differentiation of escherichia coli serotypes using dc...
TRANSCRIPT

1
Differentiation of Escherichia coli Serotypes Using DC Gradient
Insulator Dielectrophoresis
Paul V. Jones, Alexa F. DeMichele, LaKeta Kemp, and Mark A. Hayes
Department of Chemistry and Biochemistry, Arizona State University, Tempe, AZ, USA
*Corresponding Author: Prof. Mark A. Hayes email: [email protected] fax: 480-965-2747
Abstract
Bacteria play a significant role in both human health and disease. An estimated 9.4 million cases of foodborne
illness occur in the United States each year. As a result, rapid identification and characterization of microorganisms
remains an important research objective. Despite limitations, selective culturing retains a central role amongst a cadre of identification strategies. For the past decade, separations-based approaches to rapid bacterial identification
have been under investigation. Gradient insulator dielectrophoresis (g-iDEP) promises benefits in the form of rapid
and specific separation of very similar bacteria, including serotypes of a single species. Furthermore, this approach
allows simultaneous concentration of analyte, facilitating detection and downstream analysis. Differentiation of
three serotypes or strains of Escherichia coli bacteria is demonstrated within a single g-iDEP microchannel, based
on their characteristic electrokinetic properties. Whole cells were captured and concentrated using a range of applied
potentials, which generated average electric fields between 160 and 470 V/cm. Bacteria remained viable after
exposure to these fields, as determined by cellular motility. These results indicate the potential g-iDEP holds in
terms of both separatory power and the possibility for diagnostic applications.
Keywords: dielectrophoresis, Escherichia coli, bioparticle trapping, separation, serotype List of Abbreviations: DC, direct current; EP, electrophoresis; EOF, electroosmotic flow; DEP, dielectrophoresis;
iDEP, insulator dielectrophoresis; g-iDEP, gradient-insulator-based dielectrophoresis

2
Introduction
It is believed that over 1030 bacteria live on planet Earth and their biomass may exceed that of all other
organisms combined. [1] The average human intestine is home to about 1014 bacteria—a microbiome composed of
500-1000 individual species. [2] Bacteria in the environment, of course, represent an even more complex array of
species and niches. Typically these organisms are commensal or mutualistic, conferring some benefit to each other
or their host. Some species, however, are pathogenic. Most strains of Escherichia coli, for instance, are innocuous to
humans. However as recent headlines note, some can cause intoxication and infection where resulting syndromes
may lead to death.
Relatively little is known about the immense diversity of species comprising the gut flora that crowds the
human intestine. Many species remain unknown since most identification strategies require culturing—the growth of
particular species in artificial environment—and many species will not accommodate this strategy. False negatives
have been documented to reach at least seventy percent when conventional microbiological culture is used alone. [3-
5]
In practical settings, bacteria are identified by molecular - and microbiologists, who use an ensemble of tests to
accomplish this task. Species and strains are identified and grouped by phenotypic characteristics such as
appearance and immunologic reactivity, and genotypic characteristics. Specific examples of tests used for
classification include differential staining, selective culturing, serological typing, nucleotide sequence recognition,
and flow cytometry. [6] Many of these methods require preparation and growth of cultures, which significantly
extends the time required for analysis. Culturing also reduces the possibility of determining the abundance or
population diversity of microbes in the original sample. While nucleic acid amplification methods minimize or
eliminate the need for culturing, DNA isolation and purification can be laborious. Emerging commercial approaches
involving rapid PCR may reduce the time and preparation required for such tests, but involve benchtop instruments,
only detect previously identified targets for which sequences are established, and typically only screen for panels of
very common pathogens. As such, these approaches do not lend themselves to the development of rapid and broad
field-based analysis. [7]
A separations-based strategy for isolating and concentrating intact microorganisms could offer significant
benefits over traditional approaches. Rapid identification and quantitation could provide revolutionary benefits in
scientific, clinical, and environmental applications. A number of scientists, for over fifty years, have recognized that
different cells have unique electrical properties and furthermore that those properties can be detected and used to
initiate separations between different types of cells. Early work focused on sensing unique resistive and dielectric
properties via impedance spectroscopy. These works often investigated the electric properties of single species by
applying an alternating potential across the cells and recording current with respect to frequency. [8-10] Others
attempted to bifurcate samples into two analyte populations (e.g. leukemic cells and erythrocytes). [11-14] This
research defined many unique and quantifiable differences between bacteria and many other types of cells.
A number of researchers have pursued capillary electrophoresis (CE) of microorganisms. [15] However,
designing such a separation scheme faces many hurdles. As targets for analytical separations, bacteria and other

3
microbes are both attractive and uniquely challenging. After several years developing novel approaches to CE of
bacteria, Armstrong et al. identified a few of the chief difficulties involved with bacterial CE separations. These
include long separation times, poor specificity, sensitivity of the analyte to the surrounding analytical environment,
requirements for sample purity, and microbe aggregation. [16] CE separations of bacteria have yielded interesting
results, but are typically plagued by band broadening. This decreases selectivity and separation efficiency.
Armstrong et al. introduced the use of poly(ethylene oxide) (PEO) as a dynamic additive in bacterial separations.
This dramatically increased apparent separation efficiency, however, peak purity was not assessed and the narrow
peaks were determined to result from microbial aggregation.
Innovations using mass spectrometry (MS) provide an interesting alternative route to microbe identification.
MS is typically used to identify small and large molecules. Identification of cells involves breaking them into
ionized molecular fragments and measuring mass/charge ratio of the products. Cells can be identified by the
characteristic fingerprint they produce in such analyses. Mass-spectrometry faces many challenges, however,
including the need for sample purity, broad chemical differences in cell species, and variations between stages of
cell development.
Recent electrokinetic (EK) approaches to the manipulation and analysis of microbes and other cells have
demonstrated the potential for significant improvements over traditional methods. Dielectrophoresis (DEP) offers
tantalizing benefits in the form of extremely rapid and specific separations that can occur while simultaneously
concentrating the analyte. Dielectrophoretic force results from the interaction between permanent or field-induced
dipoles and a spatially inhomogeneous electric field. DEP acts upon analyte in concert with other field-induced
forces such as electrophoresis (EP) and electroosmotic flow (EOF). Together, these three forces provide multiple
force vectors with which to query a variety of analyte properties, including but not limited to particle size, structure,
surface charge, charge heterogeneity, polarizability, and permittivity differences between the cells and the buffer.
These traits can vary widely between cells and microbes that otherwise appear and behave similarly. As one
example, DEP has been used to differentiate erythrocytes based on antigen expression. [17]
Early implementations of DEP used patterned electrodes to generate AC field gradients. Separations were based
on the characteristic crossover frequency, where net dielectrophoretic force switches from positive (up-gradient) to
negative (down-gradient). Later work used electrically insulating structures to impinge upon field lines and induce a
local gradient. Beginning in 2002, this work was rapidly expanded. [18,19] The use of insulator-based
dielectrophoresis (iDEP) ameliorated many of the problems associated with traditional DEP experiments, which
included electrolysis within separation zones, joule heating, cellular damage, and complex fabrication procedures.
DC iDEP also enabled the simultaneous use of field-driven flow through separation zones.
The work presented here utilizes an approach to iDEP first introduced in 2007, in which insulating sawtooth
features along the sides of a microchannel create electric field inhomogeneities. [20] Progressive changes in the
tooth geometry create distinct zones of increasing local field gradient along the length of the channel. This
progression of local maxima yields a secondary macro-gradient globally across the device. Analyte is driven through
the channel by a combination of EP and EOF. Particles traveling down the channel encounter zones of increasing
DEP force as they approach each set of opposing teeth. When DEP force is sufficient to counter the combination of
4
EP and EOF, particles are trapped and prevented from further translation down the channel. This causes particles to
stop at discrete and unique points along the channel, based on their individualized electrokinetic properties.
Using this approach, our group is refining the separation of bacterial species and strains based on their physical
and electrical properties. The work presented here is unique for three reasons. First, it uses a linear separation mode
combining electrophoresis, electroosmotic flow, and dielectrophoresis, where a distinctive balance point can be
found for an analyte based on the ratio of its electrokinetic mobility (the sum of electrophoretic and electroosmotic
mobilities) and dielectrophoretic mobility. Second, it is an extremely high-resolution separation scheme, better than
many traditional electrophoretic and dielectrophoretic strategies. Third, we demonstrate that individual strains of E.
coli can be differentiated. This suggests an opportunity to begin to identify bacteria by their electric properties.
Specifically, this work indicates that three serotypes of E. coli can be differentiated within an appropriately designed
g-iDEP microchannel, including differentiation of pathogenic from non-pathogenic types.
Materials and Methods
Microdevice Fabrication
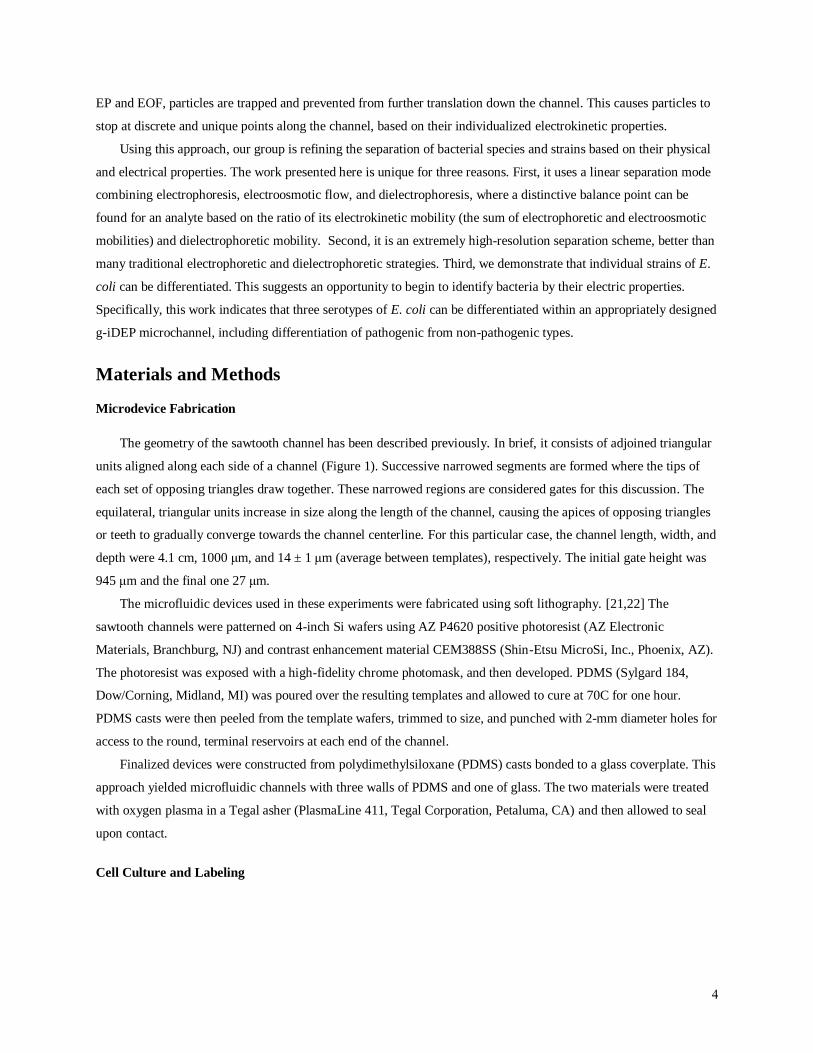
The geometry of the sawtooth channel has been described previously. In brief, it consists of adjoined triangular
units aligned along each side of a channel (Figure 1). Successive narrowed segments are formed where the tips of
each set of opposing triangles draw together. These narrowed regions are considered gates for this discussion. The
equilateral, triangular units increase in size along the length of the channel, causing the apices of opposing triangles
or teeth to gradually converge towards the channel centerline. For this particular case, the channel length, width, and
depth were 4.1 cm, 1000 μm, and 14 ± 1 μm (average between templates), respectively. The initial gate height was
945 μm and the final one 27 μm.
The microfluidic devices used in these experiments were fabricated using soft lithography. [21,22] The
sawtooth channels were patterned on 4-inch Si wafers using AZ P4620 positive photoresist (AZ Electronic
Materials, Branchburg, NJ) and contrast enhancement material CEM388SS (Shin-Etsu MicroSi, Inc., Phoenix, AZ).
The photoresist was exposed with a high-fidelity chrome photomask, and then developed. PDMS (Sylgard 184,
Dow/Corning, Midland, MI) was poured over the resulting templates and allowed to cure at 70C for one hour.
PDMS casts were then peeled from the template wafers, trimmed to size, and punched with 2-mm diameter holes for
access to the round, terminal reservoirs at each end of the channel.
Finalized devices were constructed from polydimethylsiloxane (PDMS) casts bonded to a glass coverplate. This
approach yielded microfluidic channels with three walls of PDMS and one of glass. The two materials were treated
with oxygen plasma in a Tegal asher (PlasmaLine 411, Tegal Corporation, Petaluma, CA) and then allowed to seal
upon contact.
Cell Culture and Labeling

5
Three strains of Escherichia coli were obtained including serotypes O157:H7, strain 465-97; O55-H7; and a
quality control strain O6:K1:H1, equivalent to ATCC 25922. Each strain represents a different serogroup, and will
be referred to by serotype only.
E. coli seed stock was stored on biobeads in Brucella Broth with 10% glycerol at -80°C. Ten-mL aliquots of
sterile lysogeny broth (LB) (Sigma-Aldrich Co., St. Louis, MO) were placed in culture tubes. Each tube was
inoculated with one of the strains then incubated overnight at 37°C. This allowed each culture to reach late log
phase, with a cell concentration of approximately 109 cells/mL. Following incubation, 500-μL aliquots of each cell
culture were centrifuged at 4000 g for 3 minutes. The supernatant was discarded and the cell pellet resuspended by
adding 1 mL 2 mM phosphate buffer at a pH of 7.4 and mixing with a vortexer for 10-15 seconds. This process was
repeated two more times in order to wash the cells and remove the LB broth.
Cells were labeled using Vybrant DiO fluorescent dye (Invitrogen). [23-25] Excitation and emission
wavelengths for this dye are 484 and 501 nm, respectively. A 5-μL aliquot of dye was added to each 1-mL
suspension of washed cells. These were incubated in a 37°C water bath for approximately 20 minutes. The samples
were then washed three times in order to eliminate free dye. This was accomplished by centrifuging and
resuspending the cells in phosphate buffer as described above, with the exception that the final buffer solution
contained 4 mg/mL bovine serum albumin (BSA). Throughout the labeling process, exposure to ambient light was
minimized in order to prevent photobleaching. Examination of the dispersed, suspended cells using a microscope
revealed that they were individual, intact cells, with minimal aggregation.
Experimental
The microdevice was placed on the stage of an Olympus IX70 inverted microscope with a ×4 or ×10 objective
for observation and data collection. Samples were introduced into the microdevice by pipetting ~ 20 μL of cell
suspension into the inlet reservoir. Hydrodynamic flow was balanced by pipetting a similar volume of buffer into
the outlet reservoir. Particle motion within the channel was observed in order to monitor and ensure stasis of flow. A
mercury short arc lamp (H30 102 w/2, OSRAM) was used for illumination. An Olympus DAPI, FITC, Texas Red
triple band-pass cube (Olympus, Center Valley, PA) was used for fluorescence microscopy. Both still images and
video were collected with a monochrome QICAM cooled CCD camera (QImaging, Inc., Surrey, BC) and Streampix
V image capture software (Norpix, Inc., Montreal, QC).
Platinum electrodes with a diameter of 0.404 mm (Alfa Aesar, Ward Hill, MA) were inserted through the
PDMS access ports into the terminal reservoirs. They were then connected to a HVS448 3000D high voltage
sequencer (Labsmith, Inc., Livermore, CA).
Bacteria were captured in both deionized H20 (DI-H20) and 2 mM phosphate buffer at a pH of 7.4. The
conductivities of these solutions were 55.3 and 343 µS/cm, respectively. DI-H20 and buffer solutions also contained
BSA ranging in concentration from 0 - 8 mg/mL. The experiments described here contained BSA at 4 mg/mL. DC
potentials applied across the device ranged from 0 – 3000 V in 100 V increments. These potentials correspond to
average field strengths (Eapp = V / 4.1 cm) of 0 – 732 V/cm and increments of approximately 24 V/cm.

6
Particle image velocimetry (PIV) measurements were used to determine the EK velocity of the bacteria. Cell
motion was observed within the straight portions of the microchannel proximal to each reservoir. Local electric field
strength was determined using COMSOL Multiphysics modeling. These values were used along with velocity data
to estimate EK mobilities.
Mathematical Modeling
Electric field characteristics in the microchannel were numerically modeled with COMSOL Multiphysics
software (COMSOL, Inc., Burlington, MA). The model consisted of properly scaled 2D geometry of the main
channel, excluding the device reservoirs. A 2D approximation greatly simplifies the calculations and was used since
the electrical potential is presumed to vary minimally across the relatively small depth of the microchannel. The
conductivity and relative permittivity of the medium were set to 1.2 S/m and 78, respectively.
Safety Considerations
Organisms used in this experiment were Biosafety Level I or II. All experiments were carried out in an
approved BSL II laboratory within accordance with the current version of the CDC/NIH BMBL publication.
Results
Three strains of E. coli, expressing O157:H7, O55:H7, or O6:K1:H1 antigenic phenotypes, with each being a
different serotype, were investigated within g-iDEP devices. Their behavior was examined primarily at the final
three sets of gates within the microchannel, namely those with a gate pitch of 300 μm, 90 μm, or 27 μm. Gate pitch
refers to the distance between the points of opposing teeth. The magnitude of the electric potential applied across the
device was recorded in terms of ΔV divided by 4.1 cm, or the overall length of the channel (Eapp). The value of Eapp
was varied along with the duration of applied potential (tapp). The location of collection was noted in terms of gate
pitch.
Electrokinetic and dielectrophoretic behaviors of the bacteria were broadly consistent with prior observations of
other samples in g-iDEP devices. Upon application of potential, bulk motion of particles was initiated towards the
outlet reservoir, which housed the cathode, consistent with expected EOF direction and charge state of bacteria. [26]
No particle capture was observed in the wide-gated segments of the sawtooth channel (gate pitch > 300 μm). Within
these regions, all visible material traveled consistently towards the cathode in the outlet reservoir. Capture resulted
in the formation of crescent-shaped bands of concentrated particles immediately upstream of a given gate.
[27,22,28,20] Unique capture and concentration of all three E. coli serotypes was observed.
All three serotypes were captured at 27 μm gates, with statistically significant differences in Eapp required for
capture of each. Only two serotypes were captured at 90 μm gates, and one serotype at 300 μm gates. The behavior
of O6:K1:H1 and O55:H7 indicate that the difference in Eapp required for capture of different serotypes increases at
larger gate pitches.
The amount of material captured at a particular gate was dependent upon the magnitude and duration of the
applied electric field. Below a particular value of Eapp no capture occurred, even over extended periods of time. That

7
threshold value is referred to as Eonset and occurred after sufficient potential was applied across the device, causing
particles to collect in characteristic zones near the entrance to a gate. Capture was monitored by local fluorescence
intensity. Material continued to capture while potential was applied. Since collection varied with both tapp and Eapp,
data was collected and compared at consistent time points following application of the electric field. By holding tapp
constant, the dependence of capture on Eapp could be investigated. Above Eonset, the rate of particle accumulation
increased with Eapp (Figure 3). This was observed both via qualitative image analysis and fluorescence intensity
measurements.
Integrated fluorescence intensity (FI) was measured within a small region of interest (ROI) at expected capture
zones. Plots of these data corresponded with qualitative observations. Specifically, measured values of FI increased
rapidly with tapp above Eonset (Figure 4a). FI measurements were taken at tapp = 5 s and plotted versus Eapp, elucidating
characteristic behaviors for each serotype at the various gate pitches. At values of Eapp greater than Eonset, FI
continued to increase before eventually leveling off. This yielded plots with a roughly sigmoidal shape (Figure 4b).
Repeated experiments demonstrated similar behavior. Figure 5 shows the average integrated fluorescence
intensity for data collected from five different devices with separate bacterial preparations of serotype O6:K1:H1.
Error bars indicate the standard deviation of each set.
The inflection points of the sigmoidal curves shown in Figure 4b were used as the serotype-specific Eonset values
for appreciable capture. These Eonset values were plotted versus gate pitch for each serotype (Figure 6). Eonset values
for O6:K1:H1 were 163 ± 31, 259 ± 52, and 427 ± 53 V/cm for the 27-, 90-, and 300-μm gates, respectively. Eonset
values for O55:H7 were 290 ± 16 and 470 ± 8 V/cm at 27- and 90-μm gates. For O157:H7, Eonset was 324 ± 25
V/cm at 27-μm gates. The results indicate statistically significant differences in capture behavior for the three
serotypes of E. coli bacteria.
Unstained samples of each E. coli serotype were also used on microdevices and observed using a combination
of brightfield and darkfield microscopy. Capture data from these runs agreed identically with that obtained using
fluorescently-labeled samples, suggesting that the electrokinetic effects of the membrane-intercalating dye were
negligible within the framework of this application.
Discussion
In order to understand behavior of these species in a g-iDEP microchannel, it’s instructive to briefly
consider their physicochemical characteristics. The cell surface of gram-negative bacteria such as E. coli typically
consists of various phospholipids, membrane proteins, and a lipopolysaccharide (LPS) coat. [29] The
lipopolysaccharide layer on the outer leaflet of the E. coli membrane (associated with the O antigen) is expected to
contribute significantly to negative surface charge, due to the presence of both carboxylic acid and phosphate
moieties. [30] Large-scale surface features such as flagella and fimbriae also affect the cell’s surface properties. [31]
Various strains of E. coli differ in their biochemical and physical phenotypes. Distinctions between strains can
manifest in terms of protein expression, glycosylation, LPS structure, as well as differences in their flagella,

8
fimbriae, and internal structures. [32] Considered together, these phenotypic differences can impact the charge and
polarizability of E. coli cells, and thus contribute to different electrophoretic and dielectrophoretic mobilities.
Utilizing g-iDEP methodology presents unique opportunities to exploit these differences to generate
separations. Although the complexity of biological objects like bacterial cells creates unique challenges, it also
furnishes a rich set of vectors for separatory differentiation. Demonstrations of bioparticle capture using this
approach have shown rapid, specific capture from heterogeneous samples
For the purposes of this discussion, EK motion refers to the transport of particles induced by the application
of an external electric field. In these experiments EK transport included the effects of EP and EOF, which are both
directly proportional to electric field strength. In the case of small particles, EP force is proportional to net surface
charge as well as field strength. At or below neutral pH, E. coli bacteria possess a negative surface charge. As such,
EP force will be directed toward positive electric potential. Above a pH of ~4, glass and oxidized PDMS surfaces
carry a negative surface charge. This produces EOF in the opposite direction, or towards negative electric potential.
In these experiments pH was maintained at 7.4. As a result, the observed motion of all bacteria towards the negative
electrode indicated that under these conditions the electroosmotic mobility (μEO) exceeded their electrophoretic
mobility (μEP) of the bacteria. Although dominant μEO determined the direction of transport, differences in μEP
between analytes still contribute significantly to net electrokinetic mobility (μEK) and the resulting translational
velocity of particles.
Electrophoretic mobilities for various serotypes of E. coli, including O157:H7, have been reported in the
range of -0.2 x 10⁻⁴ to -1.4 x 10⁻⁴ cm2/Vs at or near neutral pH.[33] However, these values vary with buffer pH and
ionic strength. Within the g-iDEP microchannel, μEP was not measured directly. Instead, an effective estimated μEK
was determined via particle tracking. Positive values support that EOF exceeded EP force. Values of μEK determined
for E. coli in the g-iDEP microchannel ranged from 1.2 x 10⁻⁴ to 2.5 x 10⁻⁴ cm2/Vs.
Theoretical descriptions of dielectrophoretic behaviors of cells utilize multishell models to approximate cell
structure and heterogeneity.[34] In these models, cells are treated as bodies consisting of onion-like layers with
varying electrical properties. E. coli can be approximated as a prolate ellipsoid, with two finite-thickness shells
encapsulating the cytoplasm. The outer and inner shells represent the LPS layer and cell membrane, respectively.
The cytoplasm and each shell are attributed unique values for permittivity and conductivity. These models indicate
that at low frequencies, including DC fields, the conductivity of the LPS layer (σwall) and cell membrane (σmem)
factor significantly into the dielectric properties of the cell. [35] The dielectric properties of bacteria have yet to be
precisely characterized. No alternative or independent quantitative information exists for both size and dielectric
differences between strains of E. coli. Work performed by Castellarnau et al. using AC DEP focused on crossover
frequencies of isogenic mutants of one strain of E. coli and further utilized a multishell model to estimate
conductivities of cell cytoplasm, membrane, and wall. The geometric parameters used for these calculations
involved an ellipsoid with axes a = 3/2 and b = a/2, cell membrane thickness of 8 nm, and cell wall thickness of 50
nm. Using this approach, respective values for σwall and σmem were estimated to be 58 x 10-3 S/m and 259 x 10-6 S/m
for E. coli strain 5K. These conductivities are expected to vary significantly between strains of bacteria, based on
their chemical makeup and protein expression profiles. Castellarnau et al. found that these values may vary by up to

9
70 percent for isogenic mutants of a single strain. Their experiments demonstrated that isogenic mutants of E. coli,
differing at one allele, express sufficiently divergent phenotypes for different dielectrophoretic behavior.
Discussions of bacterial dielectric properties typically stop short of assigning or estimating specific values
for μDEP. An experimental value of μDEP can be deduced from g-iDEP data by observing that the electrokinetic (FEK)
and dielectrophoretic forces (FDEP) balance at the noted gate for the appropriate Eonset. This estimation was only
calculated for the serovar that was captured at all three gates, O6:K1:H1, and resulting a value of -1.4 ± 0.9 x 10⁻¹⁷
m4/V2s—a reasonable value compared to other particles measured in insulator dielectrophoretic systems
(polystyrene, 1 micron, -2 x 10-16 m4/V2s). [36] This mobility can be used along with the local electric field strength
to estimate the magnitude of the focusing forces exerted upon a single captured bacterium. For Eonset at a 27 µm gate
COMSOL Multiphysics modeling indicated centerline values of |E|2 were approximately 1.0 x 10¹⁵ V2/m3. For
this calculation, an E. coli cell was treated as a prolate ellipsoid with major axis a = 2 µm and minor axis b = 0.5
µm. Using these assumptions and calculated values, the force is approximately 0.2 nN (FEK ≤ -FDEP = 2 x 10⁻¹⁰ N).
The general features of the observed capture of E. coli in a sawtooth g-iDEP device are consistent with
previous results obtained using cells and other bioparticles. The characteristic behaviors have been described in
detail elsewhere. [27] Briefly, the insulating PDMS constrictions yield intense electric field gradients. As particles
approach a gate, they experience increasing dielectrophoretic force, which approaches a local maximum value.
Negative DEP force is directed away from these regions, thus maximally opposing net EK force just before a
particle passes the center of a gate. The magnitude of local electric field strength is proportional to Eapp and inversely
proportional to cross-sectional area. Thus local magnitudes of |E|2 and resulting DEP force are a function of both
Eapp and gate pitch. Trapping occurs when DEP force exerted on a particle exceeds net EK force.
The dependence of capture on Eapp and gate pitch was observed for all three serotypes (Figure 6). A
difference in Eapp required for capture at a given gate between any two particle types indicates that they possess
either differing μEK, μDEP, or both. A sufficient difference in these factors indicates that two particles could be
differentiated.
When Eapp was less than 100 V/cm, dielectrophoretic force was insufficient for capture of any cells.
Capture at field strengths less than this value would require either a smaller gate pitch or a reduction in EK velocity.
The latter could potentially be achieved by a reduction in EOF. Values of Eapp above approximately 730 V/cm were
unattainable due to equipment constraints. This represents the maximum potential of 3000 V that could be applied to
the channel using the existing power supply. Application of higher potentials is also impractical due to excessive
joule heating, which causes bubble formation within the channel, particularly where a large potential drop occurs
across narrow gates.
Variables that could not precisely controlled or quantitated, such as bacterial cell count, staining efficiency,
pressure-driven and electroosmotic flow control, slightly varying properties for the individual cells, and
photobleaching effects all contribute to the overall variance.
All samples were inspected at relatively high magnification before and after collection to observe the
typical swimming and tumbling behaviors characteristic of the serotype. In all cases investigated, similar behaviors
were observed for both conditions, suggesting that the high electric field and possible Joule heating did not

10
negatively impact the bacteria in a significant manner. This is attributed to the relatively weak external field strength
compared to local zeta potential/lipid bilayer field strength, which are typically several orders of magnitude higher
than those estimated to be present within these devices.
These results show that O157:H7, O55:H7, and O6:K1:H1 serotypes of E. coli can be differentiated using
g-iDEP operated with DC fields. In different pathogenic and non-pathogenic E. coli serotypes, small differences in
cell structure, membrane, and wall composition are shown to be sufficient for differentiating populations. Current
literature sources offer scant quantitative data regarding physical and electrical differences between strains of E.
coli. Strain-to-strain variations in mean size or geometry are unknown. If such variation existed, however, it could
be expected to contribute significantly to differences in both electrophoretic and dielectrophoretic force. Strain-
specific differences in the biochemical makeup of the cell membrane and wall are likely to affect bacterial surface
charge and conductivity. These parameters will in turn yield characteristic differences in electrophoretic and
dielectrophoretic force.
Although it has not been demonstrated here, it is plausible that simultaneous separation and capture of all
three serotypes within a single channel is achievable. This supports the idea that this approach can be adapted for
future separation and identification of similar bacteria in microfluidic devices. However, this would require
restructuring the progression of gate pitch along the channel. Future efforts will evaluate the implementation and
efficiency of such separations. Specifically, advancements in channel geometry and surface treatments, along with
the possible use DC-offset AC fields promise to extend the abilities and applicability of this approach.
While the work presented here must adapt to the semantics of existing microbiological methods, the
mechanism of identification and differentiation pursued here differs. Large-scale, phenotypic differences arise from
molecular origins, which are concomitantly associated with identifiable and characteristic variation of cellular
electric properties. With sufficient separatory resolution, gradient insulator-based dielectrophoresis (g-iDEP) will
enable separation of many if not all of the categories currently used by microbiologists.
Conclusion
Using a g-iDEP strategy implemented with a pattern of sawtooth insulators has demonstrated
differentiation of three serotypes of E. coli bacteria. While previous work has shown differentiation of bacteria
based on species or live/dead state, this is the first demonstration of serotype differentiation using DC fields or
insulator-based dielectrophoresis. Capture behavior was consistent with electric field modeling and overlapped with
capture zones predicted from negative DEP forces. The results presented here indicate that all three serotypes could
be discretely captured within a single separatory channel. Further modeling and design will facilitate optimization of
g-iDEP channel geometry for the separation and capture of similar bioanalytes from complex mixtures. Such
improvements will aid the development of new bioanalytical tools that enable the identification of microbes through
precise and rapid separations.
References

11
1. Whitman WB, Coleman DC, Wiebe WJ (1998) Prokaryotes: The unseen majority. Proc Natl Acad Sci U S A 95
(12):6578-6583. doi:10.1073/pnas.95.12.6578
2. Hooper LV, Gordon JI (2001) Commensal host-bacterial relationships in the gut. Science 292 (5519):1115-1118.
doi:10.1126/science.1058709
3. Agata EMCD, Gautam S, Green WK, Tang Y-W (2002) High Rate of False-Negative Results of the Rectal Swab
Culture Method in Detection of Gastrointestinal Colonization with Vancomycin-Resistant Enterococci. Clinical
Infectious Diseases 34 (2):167-172. doi:10.1086/338234
4. Benjamin RJ, Wagner SJ (2007) The residual risk of sepsis: modeling the effect of concentration on bacterial
detection in two-bottle culture systems and an estimation of false-negative culture rates. Transfusion 47 (8):1381-
1389. doi:10.1111/j.1537-2995.2007.01326.x
5. Scallan EG, P. M.; Angulo, F. J.; Tauxe, R. V.; Hoekstra, R. M. (2011) Foodborne Illness Acquired in the United
States—Unspecified Agents. Emerging Infectious Diseases 17 (1):16-22
6. Black JG (1996) Microbiology: principles and applications. Prentice Hall,
7. Tenover FC (2010) Potential impact of rapid diagnostic tests on improving antimicrobial use. In: Bush K (ed)
Antimicrobial Therapeutics Reviews, vol 1213. Annals of the New York Academy of Sciences. pp 70-80.
doi:10.1111/j.1749-6632.2010.05827.x
8. Suehiro J, Noutomi D, Shutou M, Hara M (2003) Selective detection of specific bacteria using dielectrophoretic
impedance measurement method combined with an antigen-antibody reaction. Journal of Electrostatics 58 (3-
4):229-246. doi:10.1016/s0304-3886(03)00062-7
9. Gascoyne PRC, Noshari J, Becker FF, Pethig R (1994) Use of Dielectrophoretic Collection Spectra for
Characterizing Differences Between Normal and Cancerous Cells. IEEE Transactions on Industry Applications 30
(4):829-834. doi:10.1109/28.297896
10. Huang Y, Wang XB, Becker FF, Gascoyne PRC (1996) Membrane changes associated with the temperature-
sensitive P85(gag-mos)-dependent transformation of rat kidney cells as determined by dielectrophoresis and
electrorotation. Biochimica et Biophysica Acta-Biomembranes 1282 (1):76-84
11. Becker FF, Wang XB, Huang Y, Pethig R, Vykoukal J, Gascoyne PRC (1994) THE REMOVAL OF HUMAN
LEUKEMIA-CELLS FROM BLOOD USING INTERDIGITATED MICROELECTRODES. Journal of Physics D-
Applied Physics 27 (12):2659-2662. doi:10.1088/0022-3727/27/12/030
12. Becker FF, Wang XB, Huang Y, Pethig R, Vykoukal J, Gascoyne PRC (1995) Separation Of Human Breast-
Cancer Cells From Blood By Differential Dielectric Affinity. Proceedings of the National Academy of Sciences of
the United States of America 92 (3):860-864
13. Burt JPH, Pethig R, Gascoyne PRC, Becker FF (1990) Dielectrophoretic Characterization Of Friend Murine
Erythroleukaemic Cells As A Measure Of Induced-Differentiation. Biochimica Et Biophysica Acta 1034 (1):93-101
14. Wang XB, Huang Y, Gascoyne PRC, Becker FF, Holzel R, Pethig R (1994) Changes In Friend Murine
Erythroleukemia Cell-Membranes During Induced-Differentiation Determined By Electrorotation. Biochimica et
Biophysica Acta-Biomembranes 1193 (2):330-344

12
15. Petr J, Maier V (2012) Analysis of microorganisms by capillary electrophoresis. Trac-Trends in Analytical
Chemistry 31:9-22. doi:10.1016/j.trac.2011.07.013
16. Armstrong DW, Schulte G, Schneiderheinze JM, Westenberg DJ (1999) Separating microbes in the manner of
molecules. 1. Capillary electrokinetic approaches. Anal Chem 71 (24):5465-5469. doi:10.1021/ac990779z
17. Srivastava SK, Daggolu PR, Burgess SC, Minerick AR (2008) Dielectrophoretic characterization of
erythrocytes: Positive ABO blood types. Electrophoresis 29 (24):5033-5046. doi:10.1002/elps.200800166
18. Chou CF, Tegenfeldt JO, Bakajin O, Chan SS, Cox EC, Darnton N, Duke T, Austin RH (2002) Electrodeless
dielectrophoresis of single- and double-stranded DNA. Biophysical Journal 83 (4):2170-2179
19. Cummings E, Singh A (2003) Dielectrophoresis in microchips containing arrays of insulating posts: Theoretical
and experimental results. Anal Chem 75 (18):4724-4731. doi:10.1021/ac0340612
20. Pysher MD, Hayes MA (2007) Electrophoretic and dielectrophoretic field gradient technique for separating
bioparticles. Anal Chem 79 (12):4552-4557. doi:10.1021/ac070534j
21. Mack C (2007) Fundamental Principles of Optical Lithography: The Science of Microfabrication. John Wiley
and Sons Ltd, Chichester, West Sussex, England
22. Staton SJR, Jones PV, Ku G, Gilman SD, Kheterpal I, Hayes MA (2012) Manipulation and capture of A beta
amyloid fibrils and monomers by DC insulator gradient dielectrophoresis (DC-iGDEP). Analyst 137 (14):3227-
3229. doi:Doi 10.1039/C2an35138b
23. Hsiao AP, Barbee KD, Huang X (2010) Microfluidic device for capture and isolation of single cells.77590W-
77590W. doi:10.1117/12.861563
24. Preira P, Grandne V, Forel JM, Gabriele S, Camara M, Theodoly O (2013) Passive circulating cell sorting by
deformability using a microfluidic gradual filter. Lab on a Chip 13 (1):161-170. doi:10.1039/c2lc40847c
25. Phillips JA, Xu Y, Xia Z, Fan ZH, Tan WH (2009) Enrichment of Cancer Cells Using Aptamers Immobilized on
a Microfluidic Channel. Anal Chem 81 (3):1033-1039. doi:10.1021/ac802092j
26. Olitzki L (1932) Electric charge of bacterial antigens. Journal of Immunology 22 (4):251-256
27. Jones PV, Staton SJR, Hayes MA (2011) Blood cell capture in a sawtooth dielectrophoretic microchannel.
Analytical and Bioanalytical Chemistry 401 (7):2103-2111. doi:Doi 10.1007/S00216-011-5284-9
28. Chen KP, Pacheco JR, Hayes MA, Staton SJR (2009) Insulator-based dielectrophoretic separation of small
particles in a sawtooth channel. Electrophoresis 30 (9):1441-1448. doi:10.1002/elps.200800833
29. Hamadi F, Latrache H, Zahir H, Elghmari A, Timinouni M, Ellouali M (2008) The relation between Escherichia
coli surface functional groups' composition and their physicochemical properties. Brazilian Journal of Microbiology
39 (1):10-15. doi:10.1590/s1517-83822008000100003
30. Amory DE, Mozes N, Hermesse MP, Leonard AJ, Rouxhet PG (1988) Chemical-analysis of the surface of
microorganisms by X-ray photoelectron-spectroscopy. Fems Microbiology Letters 49 (1):107-110.
doi:10.1111/j.1574-6968.1988.tb02690.x
31. El Ghmari A, Latrache H, Hamadi F, El Louali M, El Bouadili A, Hakkou A, Bourlioux P (2002) Influence of
surface cell structures on physicochemical properties of Escherichia coli. Microbiologica 25 (2):173-178
13
32. Latrache H, Mozes N, Pelletier C, Bourlioux P (1994) Chemical and physicochemical properties of Escherichia
coli: variations among three strains and influence of culture conditions. Colloids and Surfaces B: Biointerfaces 2 (1–
3):47-56. doi:http://dx.doi.org/10.1016/0927-7765(94)80017-0
33. Lytle DA, Rice EW, Johnson CH, Fox KR (1999) Electrophoretic mobilities of Escherichia coli O157 : H7 and
wild-type Escherichia coli strains. Applied and Environmental Microbiology 65 (7):3222-3225
34. Pethig R (2010) Dielectrophoresis: Status of the theory, technology, and applications (vol 4, 022811, 2010).
Biomicrofluidics 4 (3). doi:10.1063/1.3474458
35. Castellarnau M, Errachid A, Madrid C, Juarez A, Samitier J (2006) Dielectrophoresis as a tool to characterize
and differentiate isogenic mutants of Escherichia coli. Biophysical Journal 91 (10):3937-3945.
doi:10.1526/biophysj.106.088534
36. Weiss NG, Jones PV, Mahanti P, Chen KP, Taylor TJ, Hayes MA (2011) Dielectrophoretic mobility
determination in DC insulator-based dielectrophoresis. Electrophoresis 32 (17):2292-2297. doi:Doi
10.1002/Elps.201100034

14
Figures
Figure 1. Schematic diagram of a g-iDEP microchannel. For these experiments, devices were constructed of glass
and PDMS.
15
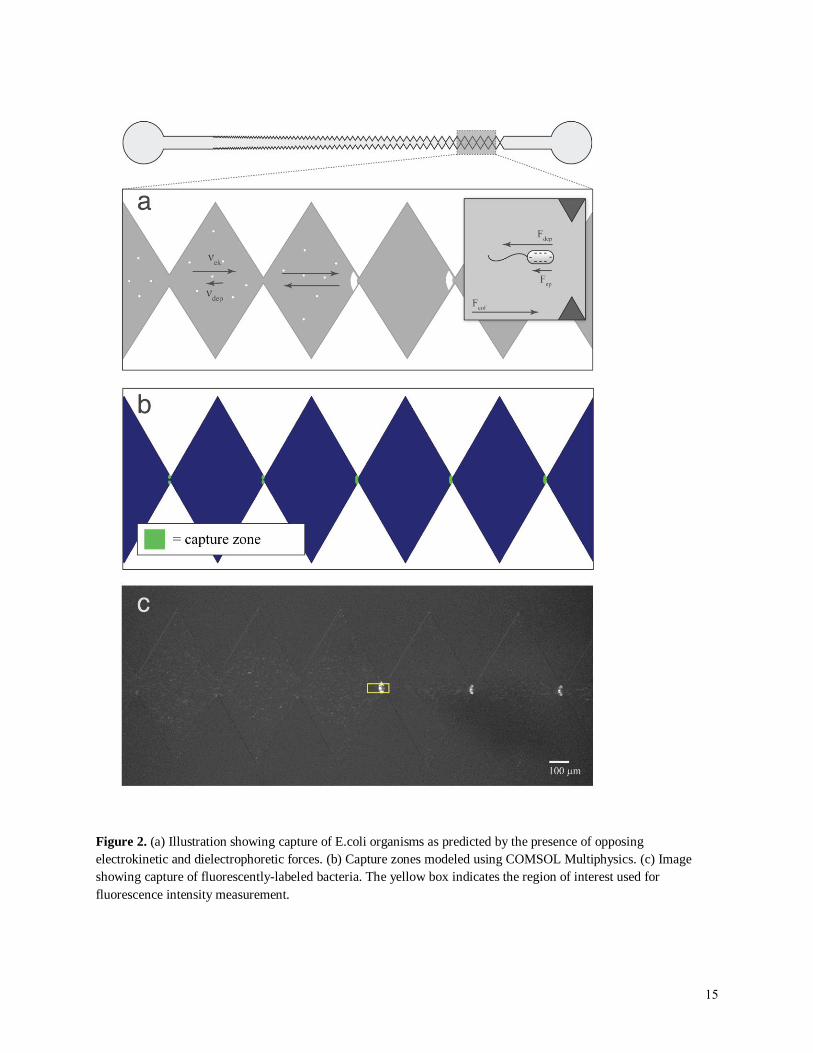
Figure 2. (a) Illustration showing capture of E.coli organisms as predicted by the presence of opposing
electrokinetic and dielectrophoretic forces. (b) Capture zones modeled using COMSOL Multiphysics. (c) Image
showing capture of fluorescently-labeled bacteria. The yellow box indicates the region of interest used for
fluorescence intensity measurement.

16
Figure 3. Capture of O6:K1:H1 at 90-μm gates. In each image, tapp = 5 seconds. Capture only occurs
above a threshold value of Eapp.

17
Figure 4. Plots showing fluorescence intensity data for capture of O6:K1:H1. (a) Plot showing the accumulation of
material over time for various applied field strengths. No capture occurs when Eapp is 100 V/cm or less, even over

18
extended periods of time. Above this range, capture is observed almost immediately. 120 to 200 V/cm comprise a
transition zone, where capture begins to occur, but is not completely exclusive. Above 200 V/cm, increasing the
applied field strength does not appreciably affect the accumulation of material with time. (b) Plot showing
fluorescence intensity increase at a capture zone (gate) versus applied field strength. Each FI measurement was
taken after 5 seconds of applied potential.
Figure 5. Plot showing FI intensity versus applied field strength for five different preparations of serotype
O6:K1:H1, each captured on a separate device.

19
Figure 6. Plot showing onset field required for capture for all three serotypes of E. coli, at three different gate
pitches (27, 90, and 300 μm). Onset field differs for all three serotypes, indicating that they can be differentiated
based on their electrokinetic behavior within a g-iDEP device. The data marker hides error bars for O55:H7 at the
90-μm gates.