differential thermal analysis of polyethylene under high pressure
TRANSCRIPT

JOURNAL OF POLYMER SCIENCE: PART A-2 VOL. 7, 377-388 (1969)
Differential Thermal Analysis of Polyethylene under High Pressure*
THEODORE DAVIDSONt and BERNHARD WUNDERLICH, Department of Chemistry, Rensselaer Polytechnic Institute, Troy,
New York 12181
synopsis
The design of a differential thermal analysis apparatus for use at elevated pressure is described. Experiments on melting and crystallization of folded-chain crystals of poly- ethylene and poly(ethy1ene-butenel) copolymer, and melting of extended-chain poly- ethylene crystals have been conducted a t pressures up to 4200 bars. The precision in transition temperature measurement was =t 1 "C. The Clausius-Clapeyron equation pre- dicts the melting point increase with pressure at atmospheric pressure to be 32.0°C/kb. The melting point depression due to copolymerization remained constant over the com- plete pressure range analyzed on the poly(ethy1enebutene-1) used in this study. Crystallization of polyethylene is retarded at elevated pressures, and a 50% larger degree of supercooling is necessary at 5000 bars to give a crystallization rate equal to that ob- served at atmospheric pressure. The difference in melting point between folded-chain and extended-chain polyethylene increases from 8.4"C at 1 bar to 25.6OC at 3000 bars.
INTRODUCTION
Crystallization of polyethylene from the melt under hydrostatic pressure above 3600 bars has led to largely extended-chain crystals.'V2 These crystals are in a condition which is close to equilibrium, in contrast to the folded-chain crystals as usually grown at atmospheric pre~sure.~ Since thermal analysis is one of the most direct methods of study of crystallization and melting, differential thermal analysis (DTA) has been adapted to the pressure range of interest. In this paper a high-pressure DTA apparatus (PDTA) capable of measuring at up to 4500 bars pressure will be described. Melting data for folded-chain crystals of polyethylene and poly(ethy1ene- butene-1) copolymer and extended-chain crystals of polyethylene at various pressures have been obtained. Crystallization of the homopolymer and the copolymer upon cooling at a constant rate has been measured at various pressures.
* This paper was presented in part at the 1966 IUPAC meeting in Tokyo and Kyoto. t Present address: Department of Materials Science and Chemical Engineering,
Northwestern University, Evanston, Illinois 60201. 377

378 T. DAVIDSON AND B. WUNDERLICH
HIGH-PRESSURE DIFFERENTIAL THERMAL ANALYSIS
PDTA Cell Design
DTA has been performed in pressure equipment of various geometries by other researchers4r5 but generally some concession had to be made for the sake of attaining high pressures. The present apparatus was designed to provide optimum geometry and thermal characteristics for DTA in a cell which can be easily pressurized and manipulated. A cylindrical geometry with thick walls provides for symmetrical placement of sample and refer- ence substances and a uniform temperature gradient. Uniform pressure at the surface of sample and reference is assured through the use of nitrogen gas as the pressure-transmitting medium. The apparatus has been used up to 3700 bars and 200°C. By proper design of all components of the system it should be possible to reach 6500 bars and 500°C with this type of high pressure DTA cell.
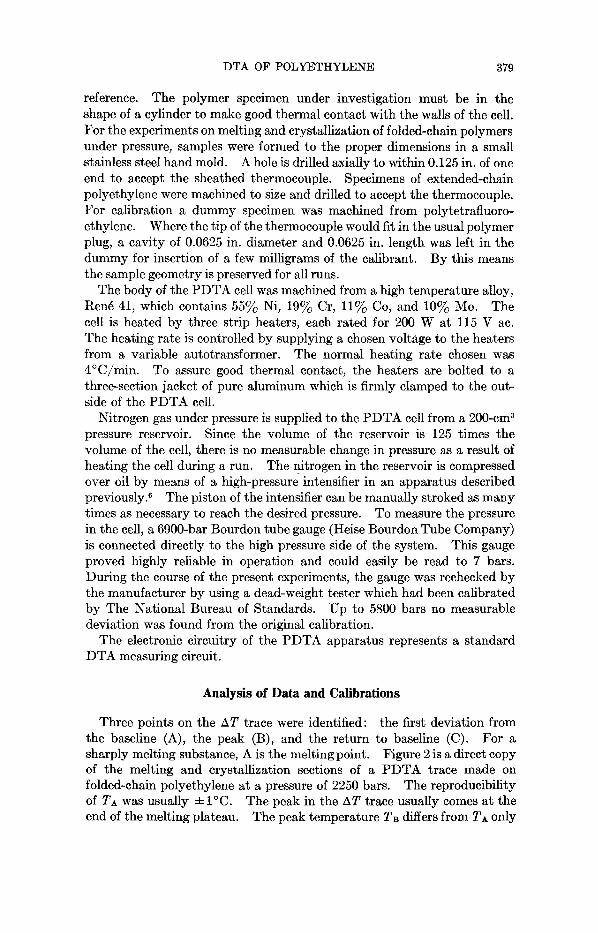
As shown in Figure 1, the cell is a cylinder 6.25 in. in length, 2 in. in outside diameter, with an 0.1875-in. bore. The bore is closed at both ends by identical plugs which form "cone-in-cone" high-pressure seals. Seals of this type function by forcing a plug with a taper of 58 or 59" into a seat tapered at 60". The interface is a narrow annulus which carries the entire sealing force on a small area. The two plugs of this cell are drilled axially for the insertion of Chromel-Alumel thermocouples which are encased in a stainless steel sheath of 0.0625 inch outside diameter. The gap between the thermocouple sheath and the bore of the closure is sealed by brazing with a silver alloy. The junction of the thermocouple is electrically insu- lated from the sheath by a packing of finely powdered magnesium oxide. Four wires emerge from each junction so that the temperature T and tem- perature difference AT circuits originate at the same point in the thermo- couple. (The cell was fabricated by Pressure Products Industries of Hatboro, Pennsylvania, who also assisted in its design.)
The tip of one thermocouple is surrounded by a reference substance which does not suffer any thermal transitions in the range of temperature under investigation. A tightly wound cylinder of asbestos paper is suitable as a
HIGH PRESSURE DTA CELL
Fig. 1. PDTA cell.
DTA OF POLYETHYLENE 379
reference. The polymer specimen under investigation must be in the shape of a cylinder to make good thermal contact with the walls of the cell. For the experiments on melting and crystallization of folded-chain polymers under pressure, samples were formed to the proper dimensions in a small stainless steel hand mold. A hole is drilled axially to within 0.125 in. of one end to accept the sheathed thermocouple. Specimens of extended-chain polyethylene were machined to size and drilled to accept the thermocouple. For calibration a dummy specimen was machined from polytetrafluoro- ethylene. Where the tip of the thermocouple would fit in the usual polymer plug, a cavity of 0.0625 in. diameter and 0.0625 in. length was left in the dummy for insertion of a few milligrams of the calibrant. By this means the sample geometry is preserved for all runs.
The body of the PDTA cell was machined from a high temperature alloy, Rend 41, which contains 55% Nil 19% Cr, 11% Co, and 10% Mo. The cell is heated by three strip heaters, each rated for 200 W at 115 V ac. The heating rate is controlled by supplying a chosen voltage to the heaters from a variable autotransformer. The normal heating rate chosen was 4"C/min. To assure good thermal contact, the heaters are bolted to a three-section jacket of pure aluminum which is firmly clamped to the out- side of the PDTA cell.
Nitrogen gas under pressure is supplied t o the PDTA cell from a 200-cm3 pressure reservoir. Since the volume of the reservoir is 125 times the volume of the cell, there is no measurable change in pressure as a result of heating the cell during a run. The nitrogen in the reservoir is compressed over oil by means of a high-pressure intensifier in an apparatus described previously.6 The piston of the intensifier can be manually stroked as many times as necessary to reach the desired pressure. To measure the pressure in the cell, a 6900-bar Bourdon tube gauge (Heise Bourdon Tube Company) is connected directly to the high pressure side of the system. This gauge proved highly reliable in operation and could easily be read to 7 bars. During the course of the present experiments, the gauge was rechecked by the manufacturer by using a dead-weight tester which had been calibrated by The National Bureau of Standards. Up to 5800 bars no measurable deviation was found from the original calibration.
The electronic circuitry of the PDTA apparatus represents a standard DTA measuring circuit.
Analysis of Data and Calibrations
Three points on the AT trace were identified: the first deviation from the baseline (A), the peak (B), and the return to baseline (C). For a sharply melting substance, A is the melting point. Figure 2 is a direct copy of the melting and crystallization sections of a PDTA trace made on folded-chain polyethylene at a pressure of 2250 bars. The reproducibility of T A was usually f 1°C. The peak in the AT trace usually comes at the end of the melting plateau. The peak temperature T g differs from TI only

380 T. DAVIDSON AND B. WUNDERLICH
7.8
7.4 c c UI
0 - .- - .= 7.0 E - z
6.6 I-
6.2
Me1 t ing
-
-
Crystallization
-
I I I I I I I I I I 1 - Time
Fig. 2. PDTA traces of melting and crystallization under pressure.
because the temperature of the cell has been rising during fusion as indi- cated by the positive slope of the plateau in the T trace. The breadth of the plateau, TB - TA, varies with the heat of fusion, mass, and thermal diffusivity of the substance which is melting and depends upon the heating rate, the temperature gradient across the sample, and any heat leakage along the thermocouple.
The melting process is somewhat complicated in the case of a polymer. The polymer sample chosen is larger than the small amount of sharp melt- ing material used for calibration. Thus in the PDTA cell, T A is the tem- perature at which melting begins on the outer surface of the cylindrical polymer specimen. A second complicating factor in polymer DTA is inherent in the melting behavior of polymeric materials. In calorimetric experiments, even slowly crystallized polyethylene has exhibited a tempera- ture range of about 15°C in which 90% of the crystalline portion fused? Some evidence suggests that slight melting may occur far below the range in which major melting is observed.* For folded-chain polyethylene of high crystallinity, TB has been shown to be close to the temperature at which all of the heat of fusion of the sample has been ab~orbed.~ This observed peak temperature must be corrected by adding the thermocouple calibration constant. From the peak, return of the AT trace to the baseline is not instantaneous but exhibits an exponential character is ti^.^ Point (C) in Figure 2 indicates the return to steady-state conditions.
Crystallization of the fully melted polymer can be followed in the PDTA cell by merely turning off the heater current which results in a cooling rate

DTA OF POLYETHYLENE 381
of approximately 2°C per minute. The beginning of solidification is indi- cated at point (D) in Figure 2 and continues to point (F) . The baseline is gradually re-established in the region labeled (G). It is of interest to note the evidence of supercooling before crystallization in the region prior to point (E). In this nonequilibrium process, point (E) is taken as the crystal- lization temperature.
Bundy'O has shown that the effect of external pressure for the used ther- mocouples (Chromel-Alumel) is negligible up to 10 kb.
The overall precision of our temperature measurements is *0.7"C. The temperature calibration was carried out by measuring TA for five pure compounds as melting standards. The indium and tin used were Fisher Certified Reagents. According to the supplier's analysis, the purity of the indium was 99.99%, while that of the tin was 99.96%. The organic compounds used: adipic acid, benzoic acid, and naphthalene, were high purity samples (Fisher Certified TherMetric Standards). The calibration data between 80 and 230°C were averaged to a net thermocouple correction of -0.2"C.
Materials
The polyethylene was characterized by gel-permeation chromatography through the courtesy of J. C. Moore of the Dow Chemical Co. The polymer was a sample of Marlex 6009 from the Phillips Petroleum Com- pany. Additives were 0.022% Ionel (2,6-di-tert-butyl-4-methyl-phenol) and 0.033% DLTDP (N,N-dilauryl thiodipropionate) . The polymer was identica.1 to polymer A used in earlier high-pressure crystallizations." Because of improvement in GPC technique, the molecular weight data reported here are thought to be somewhat more accurate than those re- ported earlier." We find M , = 8530, M , = 153000.
The ethylene-butene-1 copolymer is a laboratory sample containing 1.8 mole-% butene-l which was provided by the Research Department of the Hercules Corporation. The comonomers were polymerized in a low-pres- sure reaction under conditions favorable to random copolymerization. The material was identical to sample B-2 in previous crystallization and melting experiment^.^^,'^ The molecular weight data were obtained by gel- permeation chromatography by B. A. Denenberg of Waters Associates. M , = 9100, M , = 120,000. Both polymers were used as received.
EXPERIMENTAL DETAILS AND RESULTS
PDTA of Folded-Chain Polyethylene
Polyethylene crystallized by cooling from the melt was used as the start- ing material for the first series of experiments. In all of the runs of this series the sample was crystallized in the cell by cooling from the melt at atmospheric pressure at about 2"C/min before each melting experiment. This procedure assured that the starting material of each run initially had the same folded-chain morphology regardless of the pressure at which the
382 T. DAVIDSON AND B. WUNDERLICH
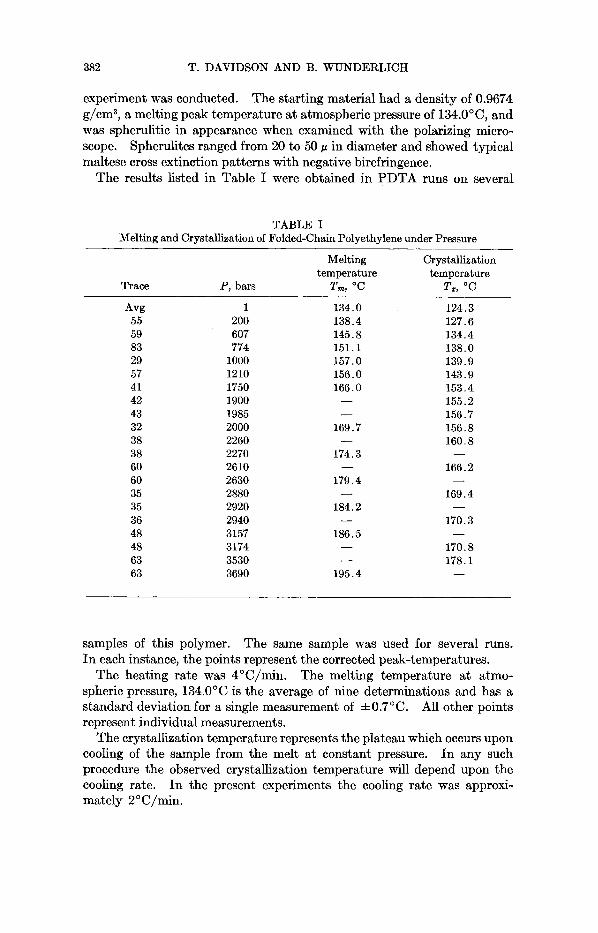
experiment was conducted. The starting material had a density of 0.9674 g/cm3, a melting peak temperature at atmospheric pressure of 134.0°C, and was spherulitic in appearance when examined with the polarizing micro- scope. Spherulites ranged from 20 to 50 p in diameter and showed typical maltese cross extinction patterns with negative birefringence.
The results listed in Table I were obtained in PDTA runs on several
TABLE I Melting and Crystallization of Folded-Chain Polyethylene under Pressure
Melting Crystallization temperature temperature
Trace P, bars Tm "C Tz, "C Avg 55 59 83 29 57 41 42 43 32 38 38 60 60 35 35 36 48 48 63 63
1 200 607 774
1000 1210 1750 1900 1985 2000 2260 2270 2610 2630 2880 2920 2940 3157 3174 3530 3690
134.0 138.4 145.8 151.1 157.0 156.0 166.0 - -
169.7
174.3
179.4
184.2
186.5
-
-
-
-
- -
195.4
124.3 127.6 134.4 138.0 139.9 143.9 153.4 155.2 156.7 156.8 160.8
166.2
169.4
170.3
170.8 178.1
-
-
-
-
-
samples of this polymer. The same sample was used for several runs. In each instance, the points represent the corrected peak-temperatures.
The melting temperature at atmo- spheric pressure, 134.0"C is the average of nine determinations and has a standard deviation for a single measurement of *0.7"C. All other points represent individual measurements.
The crystallization temperature represents the plateau which occurs upon cooling of the sample from the melt at constant pressure. In any such procedure the observed crystallization temperature will depend upon the cooling rate. In the present experiments the cooling rate was approxi- mately 2"C/min.
The heating rate was 4"Clmin.

DTA OF POLYETHYLENE 383
PDTA of Ethylene-Butene Copolymer
As in the homopolymer case, the sample was always crystallized at at- mospheric pressure before each of the runs listed in Table 11. It can be seen that the copolymer melting and crystallization temperatures lie be- low those of the homopolymer.
TABLE I1 Melting and Crystallization of Ethylene-Butene Copolymer under Pressure
Melting Crystalliiation temperature temperature
Trace P, bars Tm, "C Tz, "C
Avg 1 128.3 77 303 134.1 67 718 142.4 73 1180 150.3 71 2040 164.8 75 2920 178.1
119.8 124.0 132.6 139.4 153.0 165.6
PDTA of Extended-Chain Polyethylene
It was not possible to produce extended-chain crystals in the PDTA cell because fixed temperatures could not be maintained at high pressure with the control system designed for DTA. Occasional leaks in the pressuriza- tion system (not in the PDTA cell) made it difficult to hold pressures above 3000 bars for long periods of time. Therefore a sample of extended-chain polyethylene crystallized at 214°C and 5030 bars in a preparative appara- tus,I4 was used for the third series of PDTA runs. The sample had a density of 0.9906 g/cm3. Spherulites of 65 /L diameter were present in sections 'examined in the polarizing microscope. Replicas of the fracture surface showed numerous extended-chain lamellae of 5000 8 thickness. A fresh piece of this material was used in each PDTA run. The results are listed in Table 111.
TABLE I11 Melting of Extended Chain Polyethylene under Pressure
Trace Melting temperature
P, bars Tm, "C
109 117 118 116 113 112 119
1 211 498 807
2370 2920 4130
142.4 149.8 157.3 165.0 197.3 209.8 229.0

384 T. DAVIDSON AND B. WUNDERLICH
DISCUSSION
Effect of Pressure on Melting
A number of melting experiments on a variety of polyethylene samples under pressure can be found in the literature. In most cases it is only possible to distinguish whether branched or linear polyethylene was measured, little further characterization is usually presented. Along with chemical information, the thermal history, density, morphology, and heating rate are necessary to discuss melting. Without this information, it is difficult to compare the results of various workers, since under the com- mon name polyethylene they may actually be measuring quite different substances. In particular, on slow heating folded-chain crystals will reorganize to more perfect crystals and yield false data. Heating rates used in this research were shown to be sufficiently fast to convert metastable folded-chain crystals to metastable melt with a minimum of reorganiza- t i ~ n . ~ ~ Complications from superheating for more perfect extended-chain crystals will be discussed below.
The results of all available investigations on linear polyethylene are included in Table IV. It was necessary to take graphical points from many of the papers, since numerical data were not tabulated. The graphical or numerical character of the data is indicated by “g” or “n,” respectively, in column 1. The melting temperature versus pressure data for each reference were fitted to the same quadratic form: Exami- nation of Table IV shows that the slope ( B ) and curvature (C) of the melting curves differs among the several sets of data. Experimental difficulties as well as difference in samples accounts for the wide spread. Apart from our measurements, only Baltenas and Igonin used differential thermal analysis; all other values were arrived at by slow volume measurements. In all the studies quoted, the melting curve of polyethylene decreases in slope with increasing pressure; on a T , versus P graph the curves bend toward the P axis. Such behavior is typical of both polymers and nonpolymeric ma- terials and is coupled to the observed decrease in compressibility with pressure.
It is difficult to evaluate the slope of the melting curve near atmospheric pressure because the curve rises steeply in this region. One procedure is to compute the slope by differentiating the least-squares expression and evaluating dT,/dP at 1 bar. The results are shown in column 7 of Table IV. A better method is to calculate the slope from the point measured at atmospheric pressure and the point at the next highest measured pressure. Slopes calculated from our measurements by the latter method are listed in Column 8 of Table IV together with the published values of the slopes of other workers. In column 7 we list the slopes calculated by the least squares method.
To calculate dT,/dP at 1 bar for equilibrium melting, it is only necessary to know the values entering the Clausius-Clapeyron expression. I n the
T , = A + BP + CP2.
This may underestimate the steeper slope at low pressures.

TA
BL
E I
V
Lea
st S
quar
es A
naly
sis
of M
eltin
g D
ata
T,
= A
+ BP
+ CP
2
Sam
ple
or r
esea
rche
r, re
fere
nce
and
form
at
A
B X
lo2
c
x 10
8
Ext
ende
d ch
ain,
thi
s
Fold
ed-c
hain
, th
is
Fold
ed-c
hain
cop
olym
er,
Baer a
nd K
ardo
s16 (
9)
Bal
tena
s an
d Ig
onin
18 (n
) H
ellw
ege
et al
.17
(9)
Kar
asz
and
Jone
s1* (
g)
Mat
suok
alg
(9)
Osu
gi a
nd H
araz
e (g
)
pape
r (
4
pape
r (
4
this
pap
er (
n)
143.
7
134.
9
128.
3 13
6.8
133.
3 13
2.5
135.
8 13
7.1
147.
1
2.67
3
1.96
3
1.99
4 3.
328
2.76
5 3.
372
3.14
1 2.
988
1.61
5
-1.4
75
- 0.9
576
- 0.
9908
-3
.708
-1
.598
-4
.028
-1
.935
-2
.210
-
0.26
72
At
2 kb
At
5 kb
(l
east
squ
ares
) dT
,/dP
U
2 19
1.3
170.
6
164.
2 18
8.6
182.
2 18
3.8
190.
9 18
8.1
178.
3
240.
4 26
.7
35.2
8 cb
20
9.4
19.6
22
.1
E! -
203.
2 19
.9
210.
5 33
.3
39
231.
5 27
.6
-
200.
4 33
.7
231.
3 29
.9
-
221.
2 16
.2
25
8 -
M
244.
4 31
.4
28.0
3

386 T. DAVIDSON AND B. WUNDERLICH
limit of a hypothetically perfect crystal these quantities are the equilibrium melting temperature T," = 414.6"K, the volume change on fusion AVfo = 0.224 cm3/g, and the heat of fusion AH; = 69.2 cal/g. T," has been estimated from the dilatometric melting points of a highly crystalline ex- tended chain polymethylene of high molecular weight." The value of V,", the specific volume of perfect solid polyethylene, has been calculated from x-ray measurements of the unit subcellZ1 extrapolated in temperature up to the melting point,22 and Vl" has been estimated by extrapolating the vol- ume of molten polyethylene to the melting point. The value of AHf" has been calculated by extrapolating measured values to 100 yo cry~tall inity.~~ Using these values in the Clausius-Clapeyron relation results in :
dT,dP = 32.O0C/kb
This value is only in reasonable agreement with the directly measured value 35.2"C/kb by PDTA on extended-chain crystals, an indication that the metastable folded-chain crystals are too far from equlibrium to be described by the Clausius-Clapeyron equation.
The melting point depression of the copolymer compared to the homo- polymer remains constant over the whole pressure range at about 6.4"C. The same analysis as was carried out previously under atmospheric melting conditions seems to apply.13
Effect of Pressure on Crystallization
The data headed "crystallization" in Tables I and I1 were recorded during cooling of the molten polymers under pressure in the PDTA cell. The samples solidified in this manner were subsequently remelted at at- mospheric pressure in the PDTA apparatus. Since their remelting tem- peratures were in no case higher than that of the folded-chain starting mate- rial, we conclude that under pressure in the cell they did not crystallize into the extended chain form.
The crystallization temperatures were fitted to a quadratic equation by a least-squares procedure. The coefficients are given in Table V.
TABLE V
A B x 102 c x 106 at 2kb At 5 kb
Homopolymer 123.9 1.797 -0,7982 156.6 193.8 Copolymer 119.4 1.794 -0.7312 152.4 190.8
In both polymers the degree of supercooling necessary for crystallization in- creases by 5070 in going from atmospheric pressure to 5000 bar. The con- clusion from this experiment is that under identical supercooling (expressed in "C below the melting point) crystallization under elevated pressure is re- tarded.

DTA O F POLYETHYLENE 387
Comparison of the Melting Curves of Extended-Chain and Folded-Chain Crystals
The higher melting temperature of extended-chain polyethylene at 1 bar has been studied p r e v i ~ u s l y . ' * ' ~ ~ ~ ~ . ~ ~ The data presented in Table I11 and Figure 3 are the first measurements to show that this behavior persists at elevated pressures. From the PDTA experiments it is clear that under pressure, extended chain crystals remain stable at temperatures above the melting range of folded-chain crystals.
From Figure 3 it can be seen that the difference in melting temperatures between extended and folded-chain polyethylene increases upon going to higher pressures. At 1 bar the difference is 8.4"C, while at 3000 bars the difference in melting temperatures is 25.6"C. One part of the increase in melting point at atmospheric pressure is accounted for by greater perfection of the extended-chain crystals, as measured by the density increase from 0.9674 to 0.9906 g/cmY and the increase in lamellar thickness from the usu- ally found 100-200 A to 5000 A. Superheating is another feature of ex- tended-chain polymer All of the extended-chain crystals of lin- ear high polymers which have been analyzed to date (p~lyethylene,~~ poly- oxymethylene,26 polytetrafluoroethylene, 27 polycaprolactam,28 and sele- n i ~ m ~ ~ ) show a very slow velocity of melting. Even at a heating rate of 4"C/min, it is possible to conduct heat faster into the crystal than melting can proceed. As a result, the interior of the crystal superheats temporarily and shows a higher melting temperature. Extended-chain polyethylene crystals similar to those analyzed here showed a melting temperature of 138.7"C in slow dilatometric experiments.ll From the magnitude of the divergence of the melting points of folded- and extended-chain crystals it
I 0 I 2 3 4
PRESSURE ( KILOBARS )
Fig. 3. Melting curves of extended-chain and folded chain polyethylene: (upper) extended-chain polyethylene; (lower) folded-chain polyethylene.

388 T. DAVIDSON AND B. WlJNDERLICH
seems reasonable to assume that parallel with the decrease in crystallization rate demonstrated above, the melting rate decreases with increasing pres- sure. The PDTA apparatus is unfortunately not suited to a study of superheating because its large mass limits the heating rate. Presently it is thus not possible to decide whether the divergence in melting points is purely kinetic in origin or not.
This work was supported by the office of Naval Research.
References 1. B. Wunderlich and T. Arakawa, J. Polym. Sci. A, 2,3697 (1964). 2. P. H. Geil, F. R. Anderson, B. Wunderlich, and T. Arakawa, J. Polym. Sci. A , 2,
3. P. H. Geil, Polymer Single Crystals, Interscience, New York, 1963. 4. G. C. Kennedy and R. C. Newton, in Solids under Pressure, W. Paul and D. M.
Warschauer, Eds., McGraw-Hill, New York, 1963. 5. R. I. Harker, Amer. Min.. 49,1741 (1964). 6. B. Wunderlich, Rev. Sci. Instr., 32,1424 (1961). 7. B. Wunderlich and M. Dole, J. Polym. Sci., 24,201 (1957). 8. B. Wunderlich, P. Sullivan, T. Arakawa, A. B. DiCyan, and J. F. Flood, J. Polym.
9. B. Wunderlich and D. Poland, J. Polym. Sci. A, 1,357 (1963).
3707 (1964).
Sci. A, 1,3581 (1963).
10. F. P. Bundy, J. Appl. Phys., 32,483 (1961). 11. T. Arakawa and B. Wunderlich, in Intetnational Symposium on Macromolecular
Chemistry (J . Polym. Sci. C, 16), 0. Wichterle and B. SedlhEek, Eds., Interscience, New York, 1967, p. 653.
12. T. Arakawa and B. Wunderlich, J. Polym. Sci. A-2,4,53 (1966). 13. D. Bodily and B. Wunderlich, J. Polym. Sci. A-2,4,25 (1966). 14. T. Davidson and B. Wunderlich, to be published. 15. E. Baer and J. L. Kardos, J. Polym. Sci. A, 3,2827 (1965). 16. R. A. Baltenas and L. A. Igonin, Dokl. Akad. Nauk SSSR, 163,917 (1965). 17. K. H. Hellwege, W. Knappe, and P. Lehmann, KolZ5id-Z., 183,110 (1962). 18. F. E. Karasz, and L. D. Jones, J. Phys. Chem., 71,2234 (1967). 19. S. Matsuoka, J. Polym. Sci., 57,569 (1962). 20. J. Osugi and K. Ham, Rev. Phys. Chem. Japan, 36,28 (1966). 21. P. R. Swan, J. Polym. Sci., 56,403 (1962). 22. M. J. Richardson, P. J. Flory, and J. B. Jackson, Polymer, 4,221 (1963). 23. B. Wunderlich and C. M. Cornier, J. Polym. Sci., A-2,5,987 (1967). 24. E. Hellmuth and B. Wunderlich, J. Appl. Phys., 36,3039 (1965). 25. J. L. Kardos, E. Baer, P. H. Geil, and J. L. Koenig, Kolloid-Z., 204,1(1965). 26. M. Jaffe and B. Wunderlich, K o l W Z . , 216217,203 (1967). 27. E. Hellmuth, B. Wunderlich, and J. M. Rankin, Jr., Appl. Polym. Symp., 2,
28. F. Liberti and B. Wunderlich, J . Polym. Sci. A-2,6,833 (1968). 29. M. Jaffe and B. Wunderlich, Proceedings of the 2nd International Conference on
101 (1966).
Thermal Analysis 1968, in press.
Received July 29, 1968 Revised August 30, 1968