differential equation and agent-based models in...
TRANSCRIPT

1
Differential Equation and Agent-Based Models in Epidemiology
Michael WolfCS 591MH
February 15, 2006

2
Outline
• Modeling problem• Differential equation vs. agent-based
models• Differential equation models• Differential equation model example• Agent-based models• Social networks• Agent-based model example• Conclusions

3
Problem
• Accurate modeling of the propagation of a disease epidemic
• Accurate models essential for mitigating bioterrorist attacks
• Accurate portrayal of the disease propagation necessary to formulate an effective response
• Larger problem of diffusion– Similar to many other social diffusive problems– Diffusion of ideas, rumors, financial panic, etc.
• Two main types of models of epidemics– Differential equation (DE) – Agent-based (AB)

4
Problem
• Goal is to determine best response to an epidemic– Mass vaccination– Targeted vaccination– Quarantine
• Focus on smallpox

5
Smallpox
• Acute, highly contagious viral disease • 3 stages (or 4)
– Incubation– Prodromal– Pox
• No consensus on parameters of disease model• Eradicated in 1979 by World Health
Organization campaign– Mass vaccination somewhat effective but did not
entirely eradicate the disease– Traced vaccination strategy successfully
eradicated the disease

6
Smallpox
• Concern that smallpox could be used in a terrorist attack
• U.S. government has stockpiled 300 million vaccines for smallpox
• 2002 CDC response– Based on previous W.H.O. successful scheme– Traced vaccination and quarantine of symptomatic
smallpox cases– More massive vaccination if cases does not drop off
after two or three generations• Is this the best response?
7
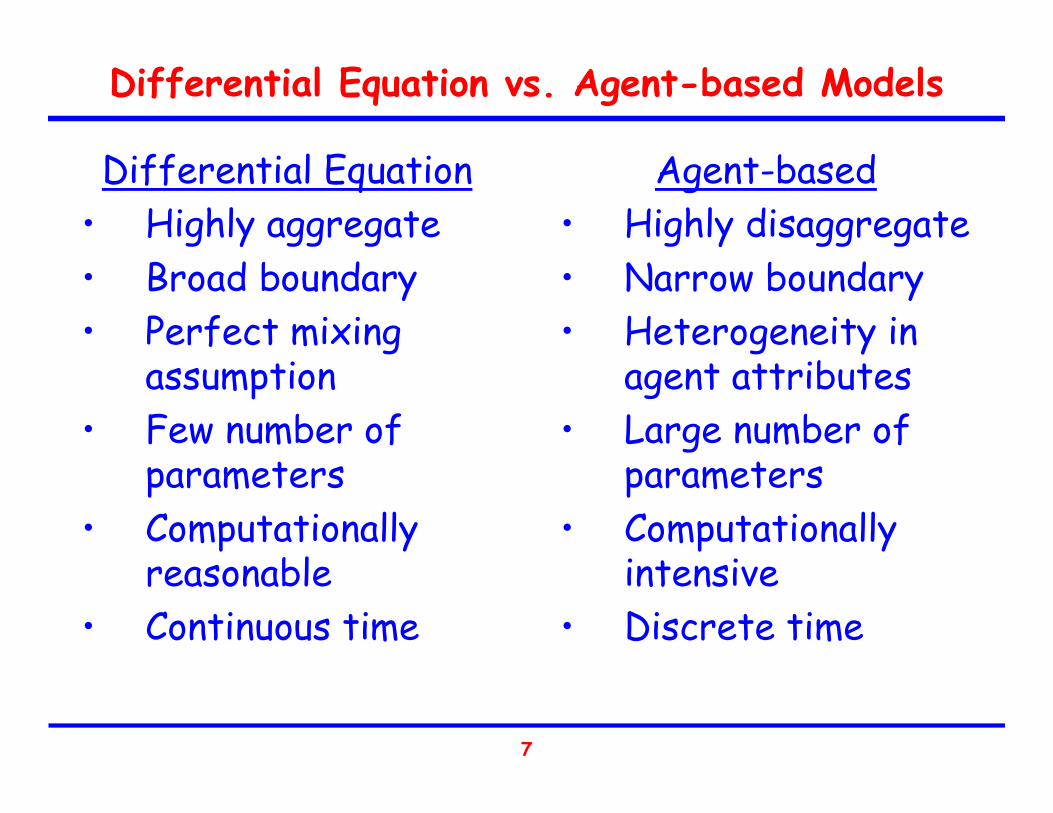
Differential Equation vs. Agent-based Models
Differential Equation• Highly aggregate• Broad boundary• Perfect mixing
assumption• Few number of
parameters• Computationally
reasonable• Continuous time
Agent-based• Highly disaggregate• Narrow boundary• Heterogeneity in
agent attributes• Large number of
parameters• Computationally
intensive• Discrete time

8
Spectrum of Model Characteristics
• DE and AB models generally thought in terms of previous listed characteristics
• However, the models often contain characteristics of both
• Aggregation– Disaggregate DE models with many components– Aggregate AB models with agents representing
multiple people• DE models can “mimic” heterogeneity by
setting parameters in a certain manner (e.g., transmission rate)
• DE/AB hybrid models possible
9
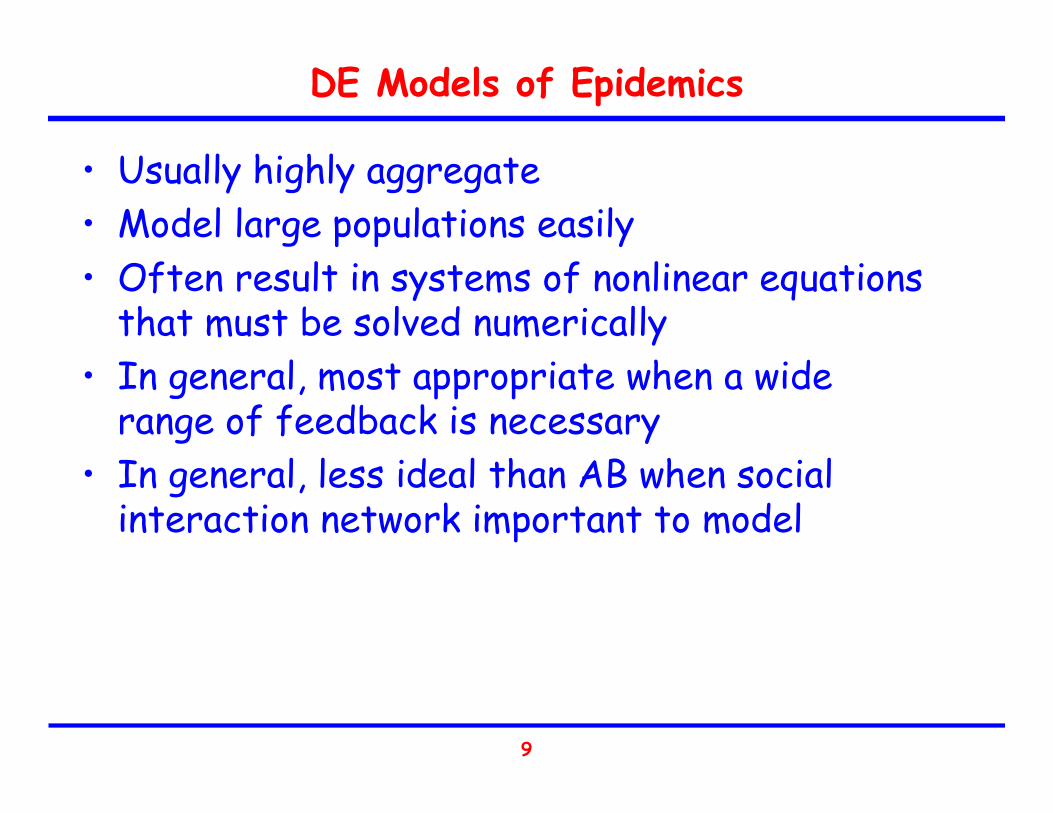
DE Models of Epidemics
• Usually highly aggregate• Model large populations easily• Often result in systems of nonlinear equations
that must be solved numerically• In general, most appropriate when a wide
range of feedback is necessary• In general, less ideal than AB when social
interaction network important to model
10
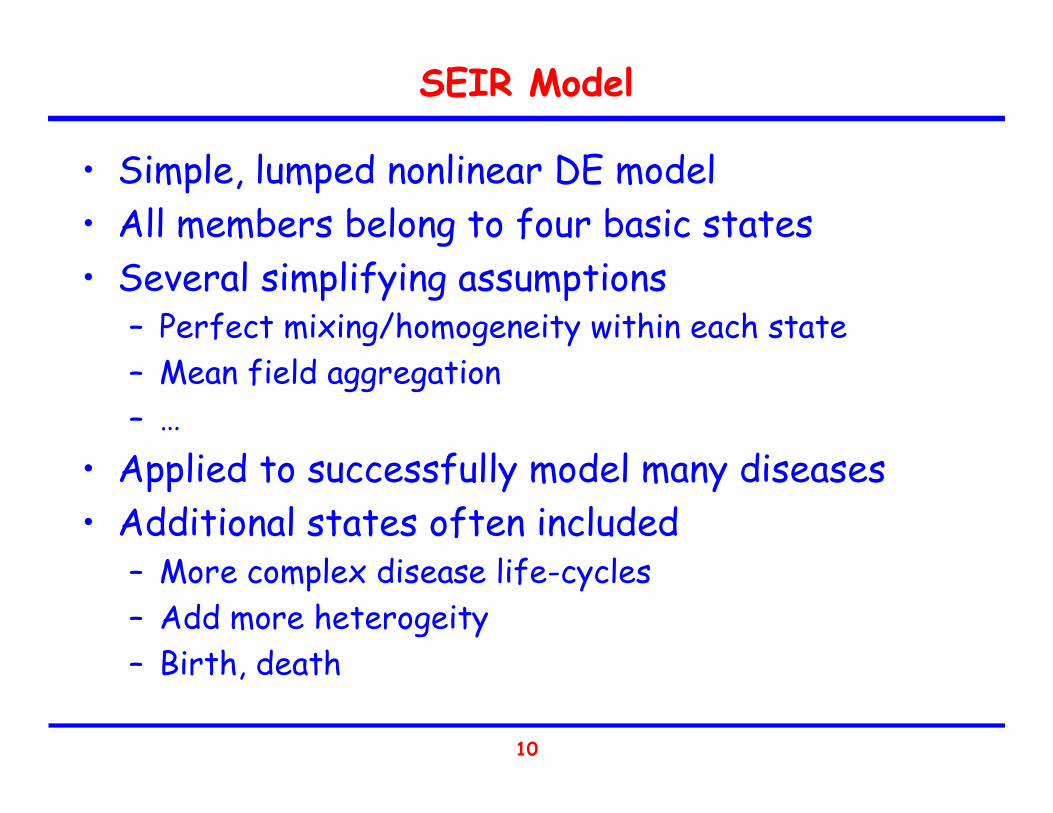
SEIR Model
• Simple, lumped nonlinear DE model• All members belong to four basic states• Several simplifying assumptions
– Perfect mixing/homogeneity within each state– Mean field aggregation– …
• Applied to successfully model many diseases• Additional states often included
– More complex disease life-cycles– Add more heterogeity– Birth, death
11
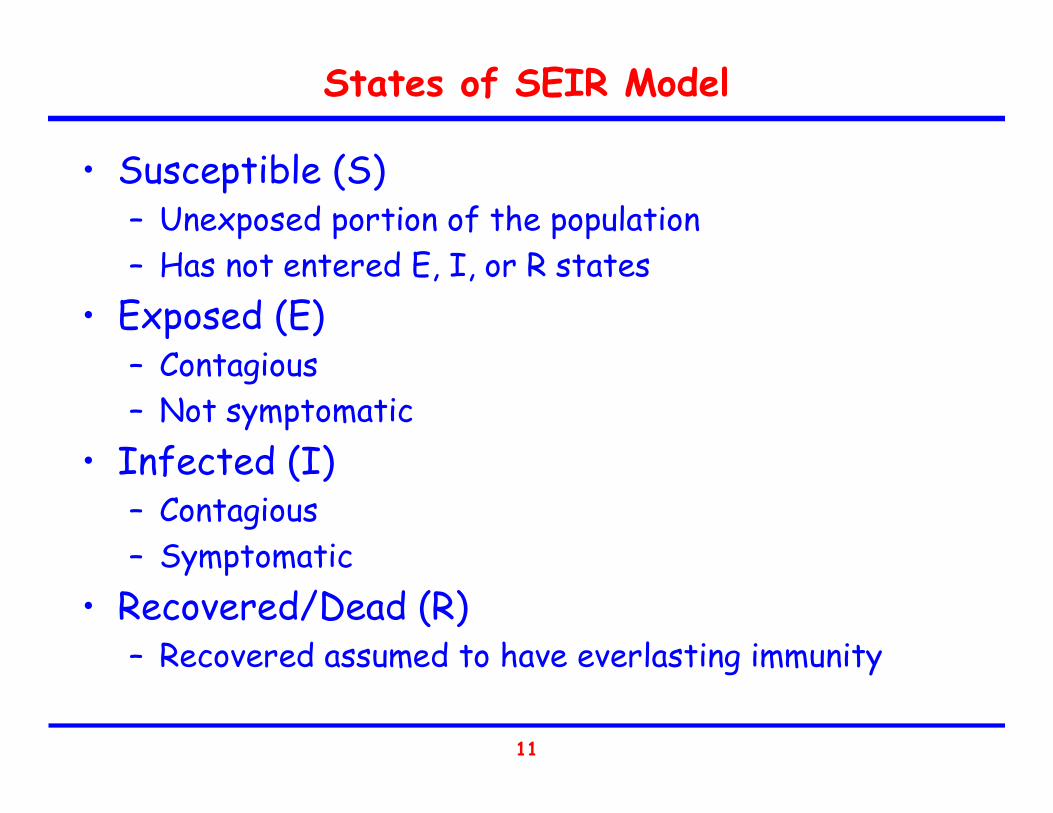
States of SEIR Model
• Susceptible (S)– Unexposed portion of the population– Has not entered E, I, or R states
• Exposed (E)– Contagious– Not symptomatic
• Infected (I)– Contagious– Symptomatic
• Recovered/Dead (R)– Recovered assumed to have everlasting immunity

12
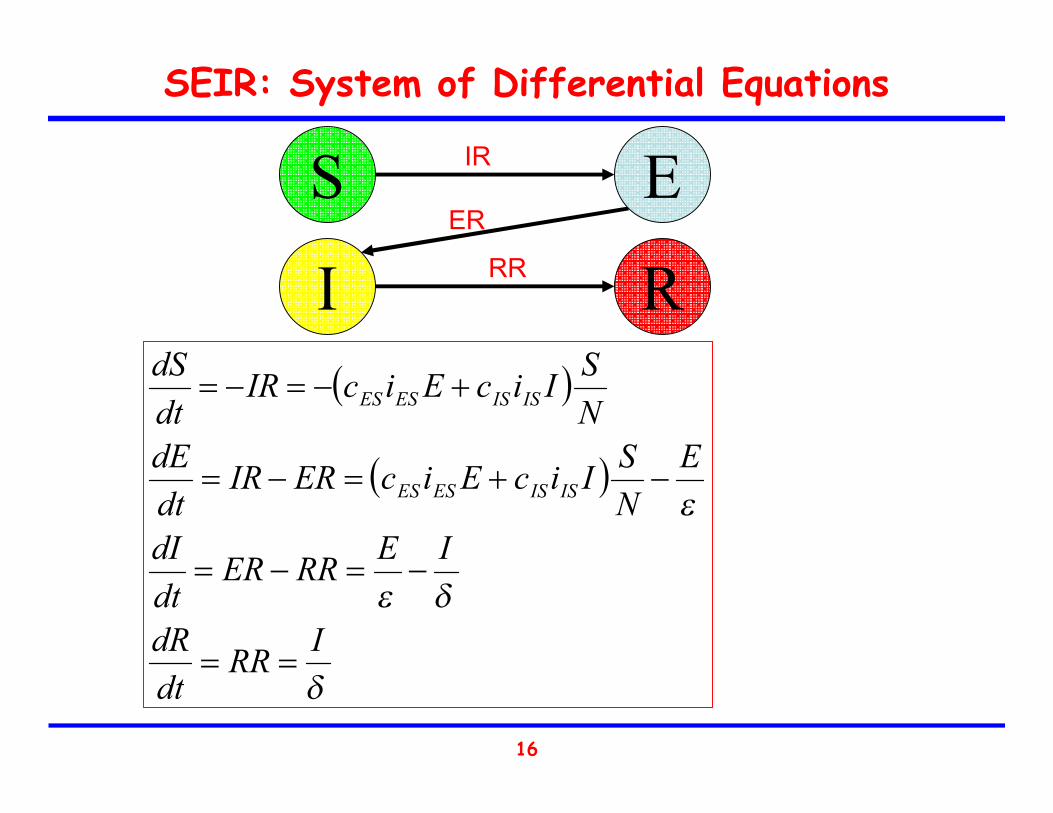
States of SEIR Model
S E
I R
IR
ER
RR

13
Infection Rate (IR)
S EIR
( )NSIicEicIR ISISESES +=
cES – contact frequency between E, SiES – infectivity of state EE – number of people in state EN – population size
• Rate at which new cases of the disease are generated by contact with E and I

14
Emergence Rate (ER)
E IER
• Rate at which asymptomatic, exposed individuals become symptomatic
εEER =
E – number of people in state E– incubation timeε

15
Recovery Rate (RR)
I RRR
• Rate at which symptomatic individuals recover or die
I – number of people in state I– duration of diseaseδ
δIRR =
16
SEIR: System of Differential Equations
( )
( )
δ
δε
ε
IRRdtdR
IERRERdtdI
ENSIicEicERIR
dtdE
NSIicEicIR
dtdS
ISISESES
ISISESES
==
−=−=
−+=−=
+−=−=
S E
I R
IR
ER
RR

17
DE Model Example: Kaplan, et al.
• SEIRlike model by Kaplan, et al. (4 disease stages)– Asymptomatic, noninfectious, vaccine sensitive– Asymptomatic, noninfectious, vaccine insensitive– Asymptomatic, infectious– Symptomatic, isolated
• Modeled smallpox epidemic and response– Mass vaccination– Traced vaccination
• Additional States – Death– Queues, etc.

18
Kaplan, et al.: Perfect Mixing
• As with SEIR model, assumes perfect mixing within states
• Recognize not accurate model of population interaction
• Claim perfect mixing leads to larger epidemics than nonrandom mixing
• Argue control strategy needs to handle this worst case
• Strategies that work in worst case should work in best

19
Kaplan, et al.: Results
Mass Targeted

20
Kaplan, et al.: Results
21
Kaplan, et al.: Conclusions
• Mass vaccination preferable to traced vaccination– Fewer deaths– Shorter life of epidemic
• CDC policy of traced vaccination, switching to mass vaccination when necessary costly
• CDC should use mass vaccination immediately as a response to smallpox attack in urban areas instead of traced vaccination

22
Agent-based Epidemic Models
• Usually highly disaggregate• Expensive computationally
– Hard to model large populations– Hard to do sensitivity analysis
• Many parameters obtained from distributions• Most appropriate when epidemic depend greatly
on heterogeneity and stochastic events• More ideal than DE Models when social
interaction network important • Social networks extremely important to AB
– Model people’s interactions– Model flow of people through locations
23
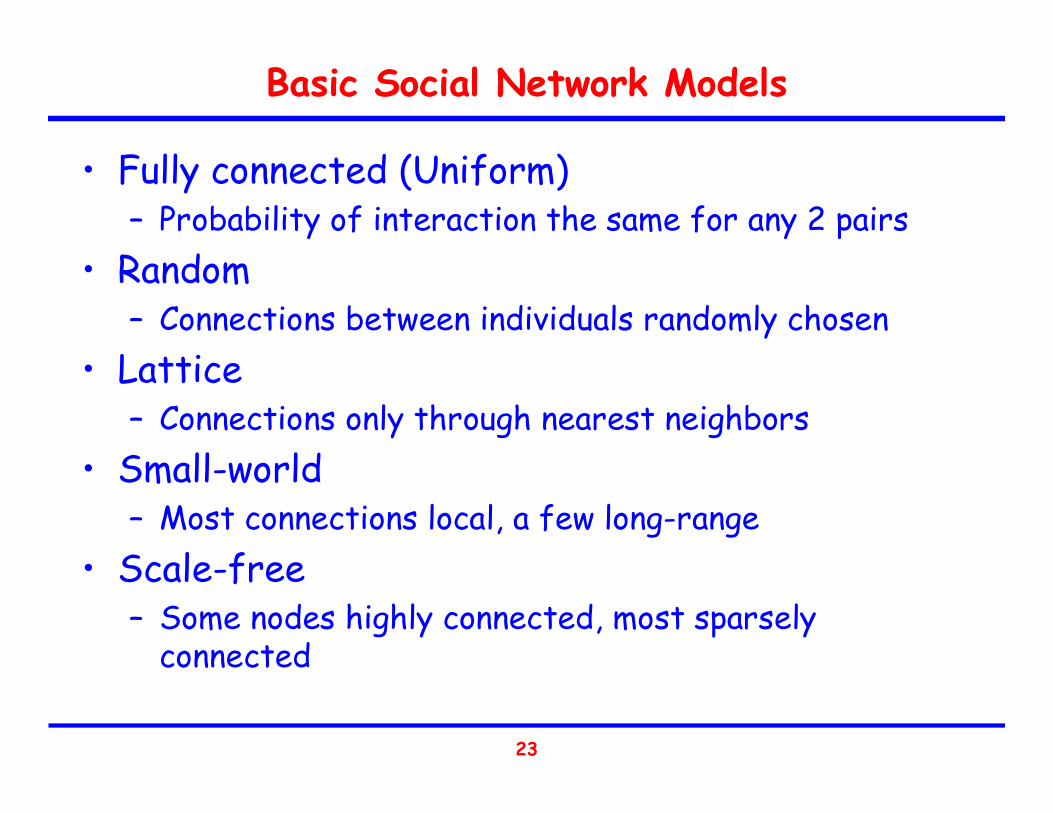
Basic Social Network Models
• Fully connected (Uniform)– Probability of interaction the same for any 2 pairs
• Random– Connections between individuals randomly chosen
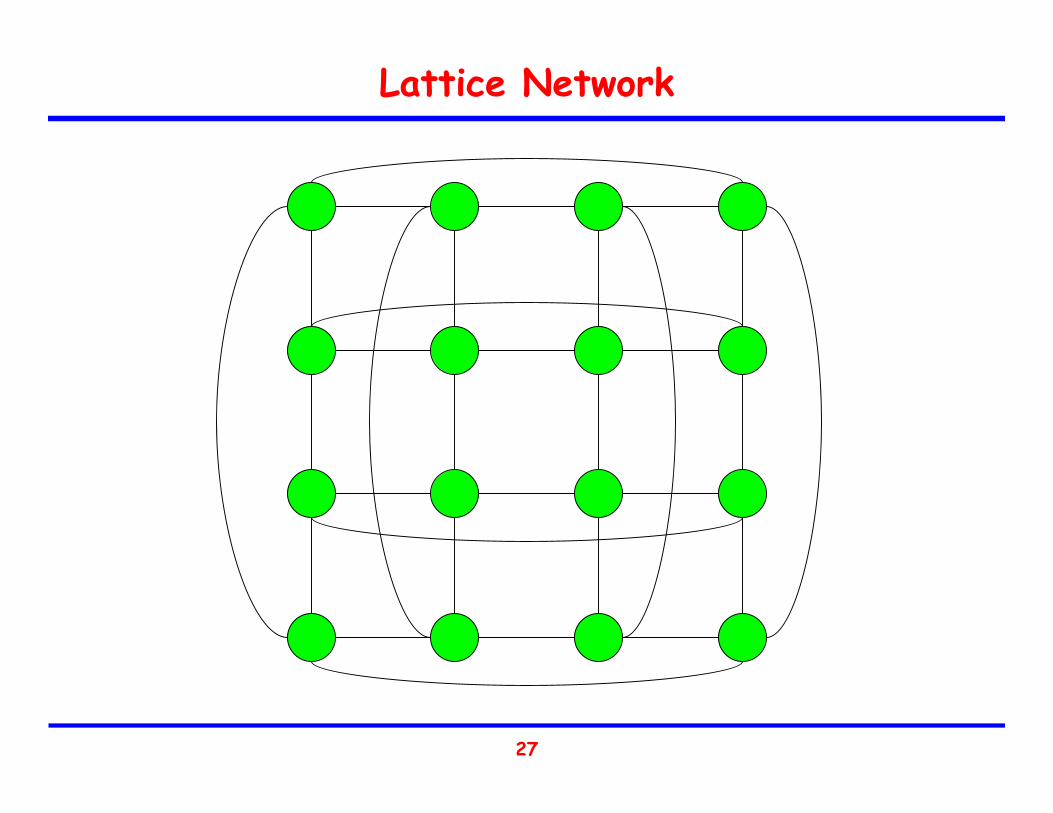
• Lattice– Connections only through nearest neighbors
• Small-world– Most connections local, a few long-range
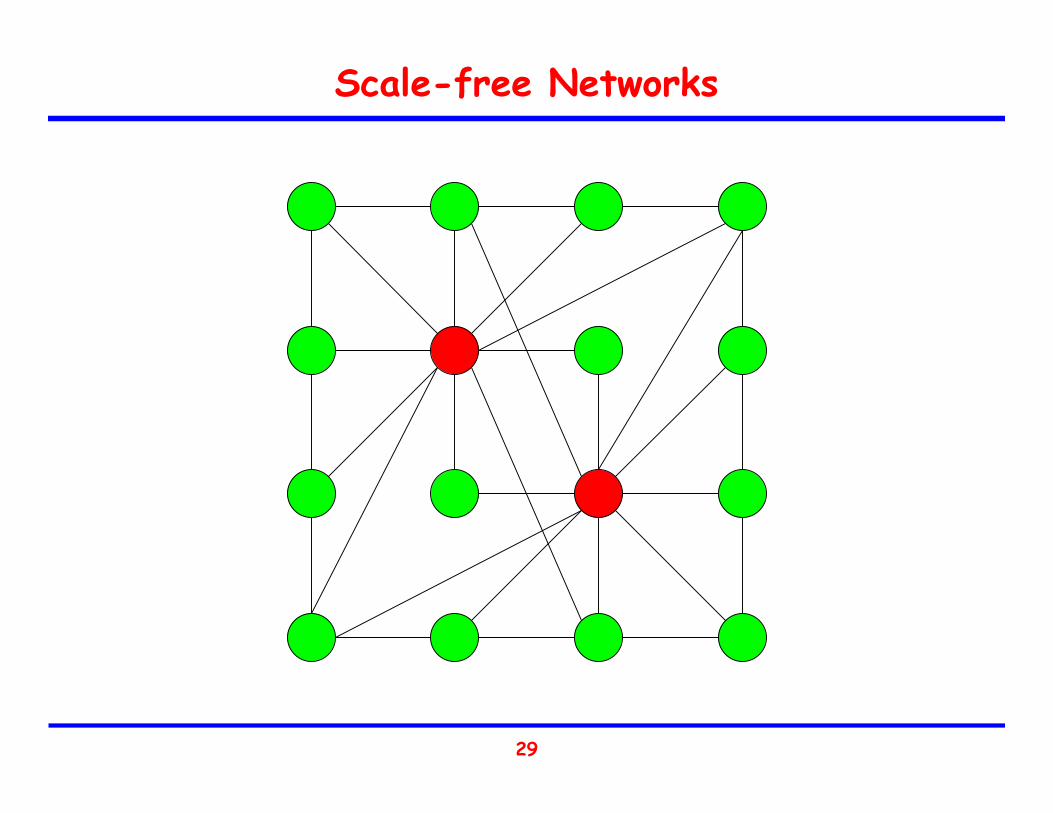
• Scale-free– Some nodes highly connected, most sparsely
connected

24
Networks

25
Fully Connected (Uniform)

26
Random Network
27
Lattice Network

28
Small-world Network
29
Scale-free Networks
30
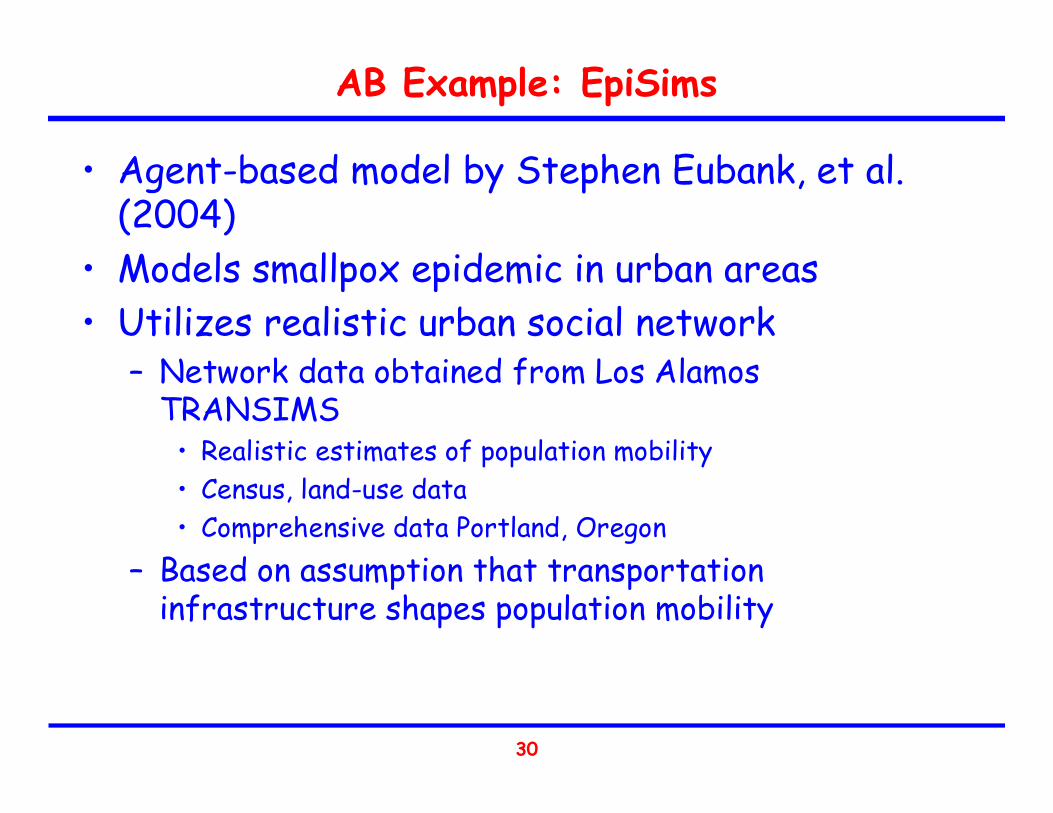
AB Example: EpiSims
• Agent-based model by Stephen Eubank, et al. (2004)
• Models smallpox epidemic in urban areas• Utilizes realistic urban social network
– Network data obtained from Los Alamos TRANSIMS
• Realistic estimates of population mobility• Census, land-use data• Comprehensive data Portland, Oregon
– Based on assumption that transportation infrastructure shapes population mobility

31
AB Example: EpiSims
• TRANSIMS creates a representative artificial population based on census data
• TRANSIMS then generates a second-by-second list of the positions of the population
• EpiSims produces dynamic graphs for the social network from this data
• Bi-partite graphs with two types of vertices– People vertices– Location vertices
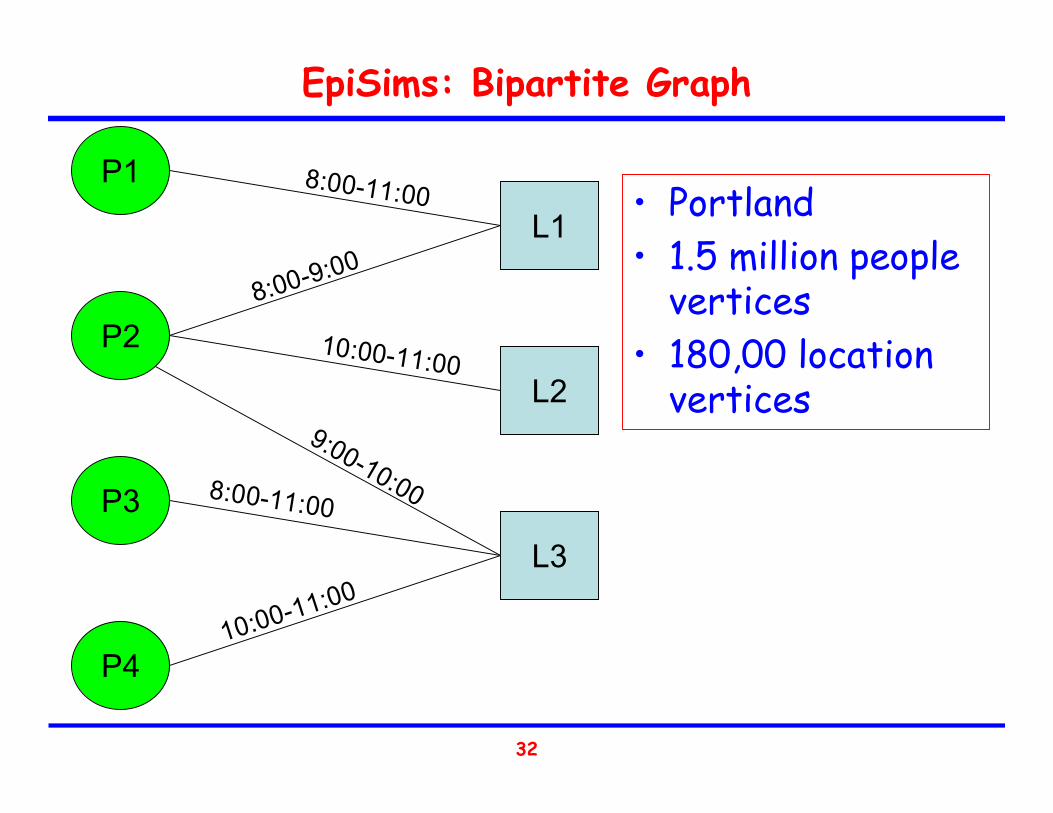
32
EpiSims: Bipartite Graph
P1
P2
P3
P4
L1
L2
L3
8:00-11:00
8:00-9:00
10:00-11:00
9:00-10:008:00-11:00
10:00-11:00
• Portland• 1.5 million people
vertices• 180,00 location
vertices

33
EpiSims: Population Contact Graphs
P1
P2
P3
P4
P1
P2
P3
P4
P1
P2
P3
P4
8:00-9:00 9:00-10:00 10:00-11:00

34
EpiSims: Travel Projection Graphs
L1
L2
L3
L1
L2
L3
9:00 10:00
35
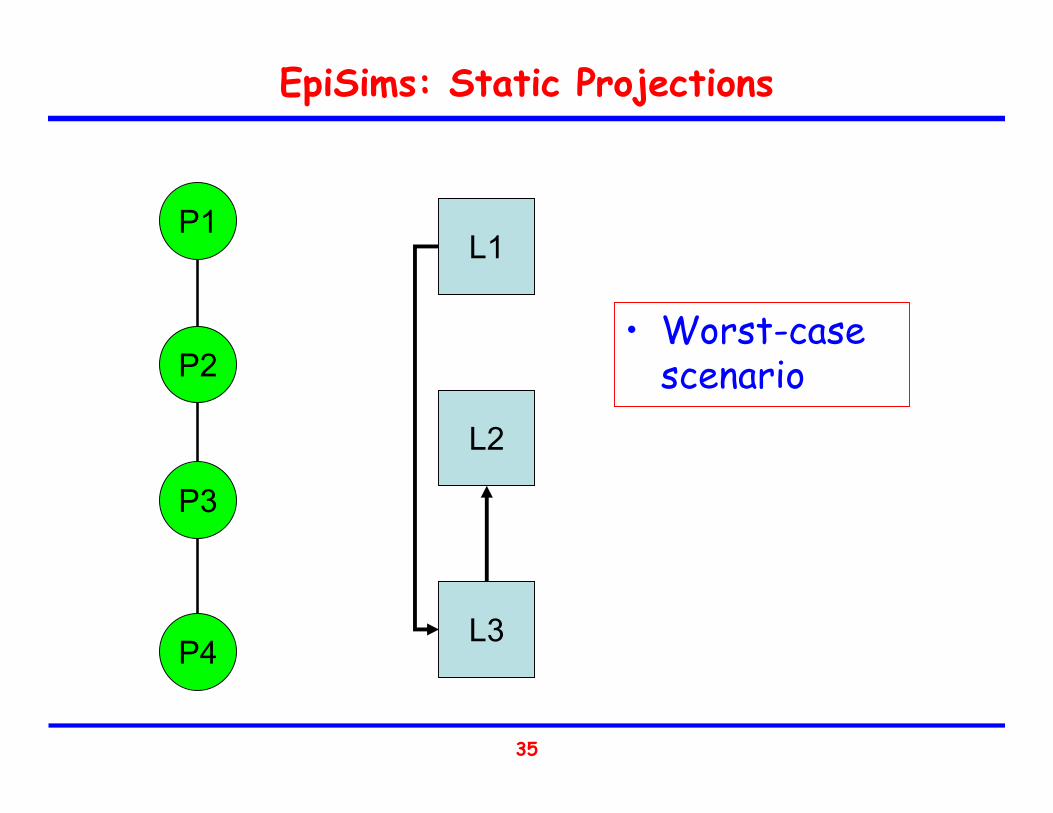
EpiSims: Static Projections
P1
P2
P3
P4
L1
L2
L3
• Worst-case scenario

36
EpiSims: Graph Properties
• Analysis of social network graphs show several important properties
• Population contact graphs exhibit small-world like properties– Highly clustered, connected groups of people– A few long range “travelers”

37
EpiSims: Graph Properties
• Population contact graph vertices are highly connected (not scale-free)

38
EpiSims: Graph Properties
• Location graph is scale-free– A few locations (“hubs”) with many connections– Majority of locations have relatively few connections

39
EpiSims: Containment Strategies from Graphs
• The graph properties give intuition into effective containment strategies– Alternatives to mass vaccination
• Overall high connectivity of people contact graphs– Cannot target social people for vaccination– Would not reduce overall connectivity of graph– Would not greatly increase graph diameter

40
EpiSims: Containment Strategies from Graphs
• Small-world property of people contact graphs– Vaccinating long distance travelers crucial– Eliminates small-world property– Increases everybody’s “degree of separation”– Slows spread of disease
• Scale-free property of location graphs– Closing “hubs” might be effective– Eubank, et al. argue maybe not
• Showed did not greatly effect the largest connected component in people contact graph
• Removed locations of over 100 degrees to see improvement– Perhaps still graph diameter would increase and
epidemic slowed

41
EpiSims: Vaccination Strategies
• Compared four vaccination strategies– No vaccination– Mass vaccination– Targeted vaccination
• Traced vaccination• Vaccination of “travelers”
– Limited targeted vaccination• Varied Response Time
– 10-day delay– 7-day delay– 4-day delay
• Varied Withdrawal Time

42
EpiSims Results: Vaccination Strategies
* - 10 day delayX - 7 day delay+ - 4 day delay

43
EpiSims: Discussion/Conclusions
• Early withdrawal most important• Quick response time second most important• Type of vaccination least important (assuming
some vaccination)• Targeted vaccination as effective as mass
vaccination• Limited targeted vaccination almost as
effective as other two methods
44
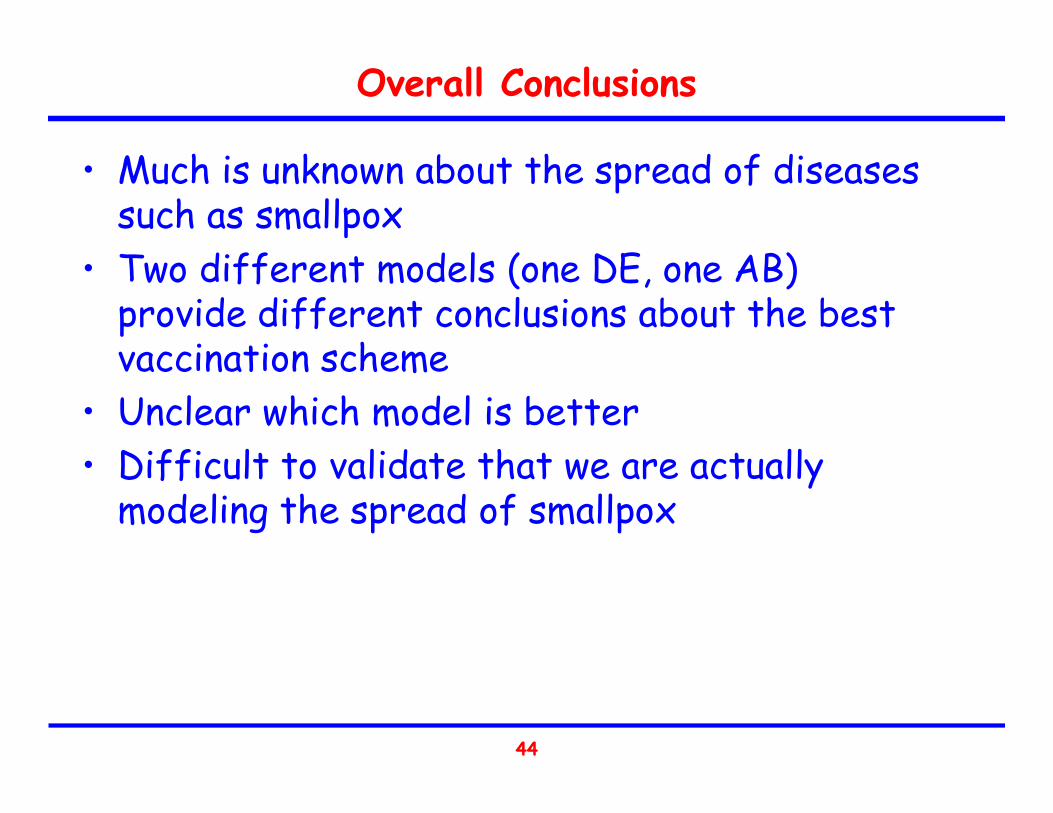
Overall Conclusions
• Much is unknown about the spread of diseases such as smallpox
• Two different models (one DE, one AB) provide different conclusions about the best vaccination scheme
• Unclear which model is better• Difficult to validate that we are actually
modeling the spread of smallpox

45
Overall Conclusions
• AB model provides more insight into social interaction aspects and better intuition into potential containment strategies
• DE model is cheaper
46
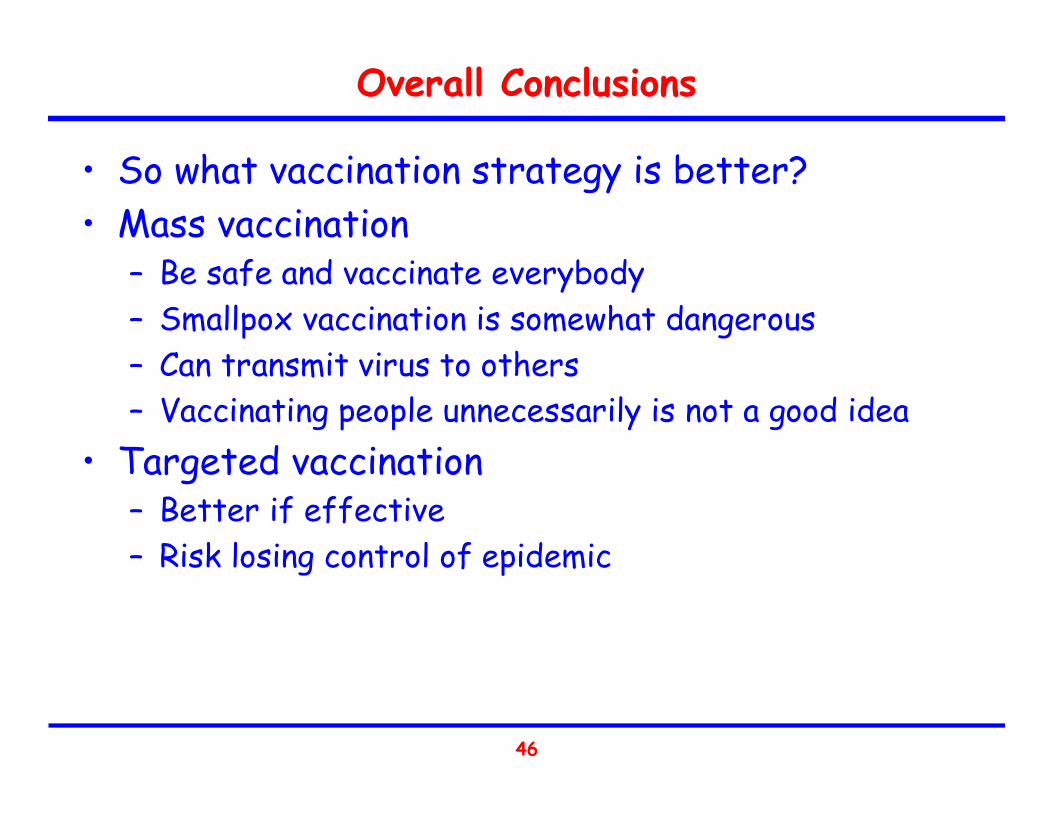
Overall Conclusions
• So what vaccination strategy is better?• Mass vaccination
– Be safe and vaccinate everybody– Smallpox vaccination is somewhat dangerous– Can transmit virus to others– Vaccinating people unnecessarily is not a good idea
• Targeted vaccination– Better if effective– Risk losing control of epidemic
47
References
Eubank, S., Hasan Guclu, V.S. Anil Kumar, Madhav V. Marathe, AravindSrinivasan, Zoltan Toroczkal, Nan Wang. (2004). "Modelling Disease Outbreaks in Realistic Urban Social Networks." Nature 429: 180-184.
Halloran, M. E., I. M. Longini Jr., Azhar Nizam, Y. Yang. (2002). "Containing Bioterrorist Smallpox." Science 298: 1428-1432.
Kaplan, E. H., D. L. Craft, L. M. Wein. (2002). "Emergency response to a smallpox attack: The case for mass vaccination." Publication of the National Academy of Science 99(no.16): 10935-10940.
Neff, J.M., et al. JAMA. 2002;288:1901-1905.
Rahmandad, H. and J. Sterman. (2004). "Heterogeneity and Network Structure in the Dynamics of Diffusion: Comparing Agent-based and Differential Equation Models." Working Paper Series: 1-31.