different dietary gluten restrictions and symptom ... · different dietary gluten restrictions and...
TRANSCRIPT

Different dietary gluten
restrictions and symptom
expression in a large population of
people with coeliac disease.
MICHELLE STUART
Supervisors: Ms Kim Faulkner-Hogg
Dr Robert Loblay
Dr Warwick Selby
Allergy Consulting Rooms and the AW Morrow
Gastroenterology and Liver Centre
Royal Prince Alfred Hospital

DECLARATION
1. I, Michelle Stuart, hereby declare that none of the work presented in this essay has
been submitted to any other University or Institution for a higher degree and that to
the best of my knowledge contains no material written or published by another
person, except where due reference is made in the text.
2. The studies described in this essay were approved by the Central Sydney Area
Health Service Medical Ethics Committee (RPAH Zone), and all subjects were
anonymous.
Signature……………………… Monday 6th
June, 1997.

ABSTRACT
The treatment for coeliac disease is a gluten free diet. Whether it is safe for
coeliacs to ingest the minute amounts of gluten often found in gluten free diets is
still controversial. The WHO/FAO Codex Alimentarius allows 0.3% protein
from gluten containing grains in foods labelled as gluten free. This is thought to
be the standard upon which gluten free diets are based in research studies and
which is adopted as practice in many countries including Australia in the past.
In March 1995 the Australian standard for gluten free food labelling changed
from this WHO guideline. Currently a food cannot be labelled gluten free if it
contains any detectable gluten. This study set out to examine the dietary
patterns in a large population of subjects with coeliac disease and to relate any
symptoms being experienced to the different levels of gluten restriction. This
may help to determine if the dietary advice given to all coeliacs should now fall in
line with the new Australian food standard for gluten free food labelling. Of the
1672 questionnaires sent to members of the Coeliac Society of NSW, 965 (58%)
were returned. This questionnaire asked for a graded description of the severity
and frequency of gastrointestinal symptoms commonly experienced by coeliacs,
and other less commonly related symptoms. Food brand selection questions were
asked so classification into one of three diet categories could be made. The
categories were: overt gluten ingestion; trace gluten ingestion in accordance with
the old Australian food standard and no detectable gluten ingestion as in the new
Australian guidelines. Of the 71.9% of the respondents with trace gluten
ingestion, 73% stated that they were not aware of ingesting gluten. After
diagnosis and commencement of gluten restriction, a large proportion were still
experiencing symptoms but generally found them to be less frequent and less
severe. The frequency and severity of symptoms was greater at gluten intakes
above that allowed in the old Australian gluten free diet. A comparison of
symptom expression between the trace gluten and no detectable gluten diets
revealed that only 2 of the 13 symptom categories were significantly different
(p<0.01). Constipation was more severe( p=0.0051) in the trace gluten group,
while diarrhoea occurred more frequently in those consuming no detectable
gluten. The lack of differences in symptoms seen between the trace gluten and
no detectable gluten diet categories would suggest that the less restrictive trace
gluten diet may be appropriate for some coeliacs.

INTRODUCTION
Coeliac disease is a malabsorptive condition wherein the small intestinal mucosa is
reversibly damaged by ingestion of gluten. Its prevalence varies geographically and it
has been found to be as common as 1/300 in Scandinavia1 and Ireland
2. Individuals
are genetically predisposed to this disorder3. Symptoms are highly variable such that
no single group of symptoms can be regarded as characteristic4. Coeliac disease can
affect many body systems but classically the gastrointestinal symptoms are
recognised; nausea, vomiting, abdominal pain and cramping, diarrhoea, constipation,
bloating and flatulence. Weakness, fatigue, weight loss, mouth ulcers, anaemia,
muscle cramps, bone pain, headaches and dermatitis are some of the other symptoms
that may occur5, but are less readily recognised as coeliac disease. Although
dermatitis herpetiformis can occur alone, it is the most common condition associated
with coeliac disease and is treated similarly6.
Blood testing for antigliadin antibody, anti-endomysial antibody and antireticulin
antibody levels do not diagnose coeliac disease, but they are useful screening tests7.
Currently coeliac disease can only be accurately diagnosed by the detection of small
intestinal mucosal damage from a small bowel biopsy. After a period on a gluten free
diet, a follow up biopsy should show a recovery of the villi. In some diagnostic cases
a gluten challenge followed by a third biopsy, to show villous damage once again, is
used8.

The recommended treatment of coeliac disease is a life long gluten free diet. Gluten
comprises 80% of the total protein in wheat, but the term is also used collectively to
describe the gut damaging prolamines of rye, barley and oats9. All these grains are
generally excluded on a gluten free diet. Wheat gluten can be fractionated into four
protein components; albumin, globulin, glutenin and alcohol soluble gliadin. Gliadin
consists of four fragments; , , and . The gliadins have been shown to contain the
toxic element of the whole gluten molecule10
. The wheat prolamin, gluten, is
considered to be the most coeliac toxic, closely followed by the rye prolamine, secalin.
The barley prolamine, horedin, is less so11
. The toxicity of the oat prolamine, avenin,
is somewhat controversial12
. Grains and other cereals which are not noxious for
coeliacs such as rice, corn, buckwheat, millet, potato, tapioca and soy are used as
dietary substitutes for these damaging grains. The recent literature suggests that
moderate amounts of oats may be consumed by less sensitive coeliacs without risk of
villous damage12
.
Controversy persists worldwide over how much gluten, if any, should be allowed in a
gluten free diet. International dietary practices vary greatly. The gluten free diet in
Australia prior to 1995 followed the guidelines of the WHO/FAO Codex
Alimentarius13
. The Codex Alimentarius allows 0.3% protein from gluten containing
grains in foods to be labelled as gluten free. This includes malt and wheat starch in
the diet, and is thought to be the practice in most countries. They contain up to
0.022% of gluten14
. In March 1995 the Australian food standard for the labelling of
gluten free foods changed. Commercial foods can no longer be labelled gluten free if
they contain detectable gluten15
. The ELISA monoclonal antibody test used detects

gluten in foods to the level of 0.003%16
so ingredients such as malt and wheat starch
are not suitable for use. There are also some who believe that although the gluten may
not currently be detected in some foods manufactured from gluten containing grains,
extreme caution is necessary, and all such products should be avoided.
Many studies 17, 18, 19, 20, 21
are suggestive of individual differences in gastrointestinal
and symptomatic response to gluten. The aim of this study is to document the diets
being consumed by a large proportion of coeliacs, and compare these with the
frequency and severity of a range of common symptoms.

METHODS
STUDY POPULATION
In April 1995, approximately one month after the NFA food standard regarding gluten
changed, current members of the Coeliac Society of NSW were sent a questionnaire
package. Non coeliac, medically interested members did not receive this. Of the 1672
questionnaires sent, 1384 recipients were adults with Coeliac Disease, 153 were
parents of Coeliac children, 38 had been diagnosed with dermatitis herpetiformis, 37
had both dermatitis herpetiformis and Coeliac Disease and 60 were following a gluten
free diet but were as yet undiagnosed.
The questionnaire package consisted of two sections. One was devised by the Coeliac
Society of Australia and was designed to obtain a description of its membership. The
second questionnaire compiled by the Allergy Clinic and AW Morrow
Gastroenterology and Liver Centre at Royal Prince Alfred Hospital, was designed to
describe the symptoms of this group of coeliacs before and after diagnosis and to
document the level of gluten avoidance in their overall diet.
DIET AND SYMPTOM QUESTIONNAIRE
This was sent state wide to all members of the Coeliac Society of NSW and was
anonymous but number coded with the questionnaire from the Coeliac Society of
Australia. Ethics permission was obtained in February 1995 from the Ethics Review
Committee of the Central Sydney Area Health Service (RPAH Zone) for its
distribution.
Symptom Report
To assess the effect of the instigation of a gluten free diet after diagnosis, recipients
were asked to record both their current and pre-diagnostic symptoms. A list of
commonly described symptoms was provided. (Appendix 1) Those generally accepted
to be associated with bowel problems were diarrhoea, constipation, nausea, vomiting,
bloating, stomach pain, cramps and excessive flatulence. Dermatitis herpetiformis
was included due to its close relationship to Coeliac Disease. Mouth ulcers,
headaches and fatigue were three other non-bowel related problems listed. The final
category „other‟ gave the opportunity to list less common complaints. Recipients were
asked to indicate the presence or absence of the symptom and to judge the frequency
and severity of the problem. (Appendix 1)
i) Severity: Recipients were asked to record the severity of their symptom according
to these guidelines:
MILD- you are aware of the symptom but it is easily tolerated.
MODERATE- this symptom is enough to cause interference with daily life
. or usual activity.
SEVERE- this is incapacitating with inability to work or take part in your
usual activities.
ii) Frequency: Recipients were asked to record if their symptoms occurred less than
once a month, monthly, weekly or daily.

Dietary Assessment
In order to assess each respondent‟s dietary practice, relevant questions were asked
regarding the use of gluten free substitutes for breads, breakfast cereals, flours,
biscuits, cakes, confectionery, alcoholic beverages, sauces and thickeners used in
cooking. Information was obtained regarding the company name and precise product
name. When a company manufactured a range of similar products, details of the exact
one used by the respondent were requested. Details of home cooking practices,
medications and use of vitamin and mineral supplements were asked for as well as
choices made when dining out or for take away meals. During assessment when there
was uncertainty as to the ingredients of any food, pharmaceutical or vitamin and
mineral product the relevant company was contacted. They were also asked to
indicate how strictly they perceived their adherence to the gluten free diet according to
the categories below:
STRICTLY- no known gluten intake.
MOSTLY STRICT- sometimes eat small amounts of wheat, barley, rye, oats, malt.
NOT VERY STRICT- having wheat products at least once a week.
NOT AT ALL- eat a normal diet.
Details of any dietary change within the last three months were requested. The
questionnaire (Appendix 1) was intentionally sent out at the time of the change in the
food standard, so that there would be respondents with varying levels of gluten in their
diet.

To study these dietary differences and their subsequent symptom outcome,
respondent‟s eating habits were classified under the following headings:
Gluten Containing Diet- this classification was made for diets where any overtly
gluten containing foods were eaten; eg. ice cream cones, communion wafers,
bread/pasta made from wheat flour etc.
Trace Gluten Diet- this diet was in accordance with the old NFA food standard based
on the Codex Alimentarius which allows up to 0.3% protein from gluten containing
grains in foods classified as “gluten free”. This diet can include foods containing malt
or wheat starch. Oats were not permitted.
No Detectable Gluten Diet- this is the new gluten free diet according to the revised
NFA food standard which allows a food to be labelled as “gluten free” only if it
contains no detectable gluten using the ELISA monoclonal antibody test. This diet
does not contain malt or wheat starch, and oats were again not permitted. Although
the following: glucose syrup, maltodextrin, dextrins, dextrose, 1400 series thickeners;
may sometimes be derived from gluten containing grains, current technology has not
detected its presence hence they were permitted in this diet.
Statistical Database
A computer database was set up in order to efficiently analyse the large volume of
data. Responses were coded numerically and entered into the Minitab 9 statistical
program. As well as descriptive statistics, Minitab was used to perform one sample
Student t-tests to compare severity and frequency for each symptom in the diet

categories. To compare the symptoms between the trace gluten and gluten free diet
groups, the two sample Student t-test was used.
COELIAC SOCIETY of AUSTRALIA QUESTIONNAIRE
The Coeliac Society of Australia prepared and distributed their questionnaire
nationally. This questionnaire (Appendix 2) detailed symptoms, diagnostic events,
limited diet and medication information, concurrent and related illnesses, family
history, age, sex and anthropometry. The answers from these respondents had been
entered into a computer database by a representative of the Coeliac Society of
Australia.
Since the two questionnaires were code matched, it was possible to use the
information from the two questionnaires cojointly. It was not possible to match up the
two questionnaire groups exactly since not exactly the same group returned each
questionnaire, however details of current age, sex, age of diagnosis and BMI were
obtained for the majority of respondents to the state wide questionnaire from the
Allergy Clinic.

RESULTS
Description of Group
Of the 1672 questionnaires sent, 965 were returned. This was a 58% questionnaire
response rate. There were figures from the national questionnaire that corresponded
to 823 (85%) of our respondent subjects. Of this group, 72% were females and 28%
were males. 6% were children. The average age was 50 ranging from 4-88. The
average BMI of the female adults was 23.4 and ranged between 16.4 and 44.6. The
average BMI of the male adults was 24 and ranged between 16.9-34. The children‟s
average age was 10 and ranged from 4-17. The median age of diagnosis for the total
group was 39 ranging from 8 months to 83 years.
Of the 965 respondents to the diet and symptom questionnaire, 18.2% were classified
as following a no detectable gluten diet, 71.9% were following a trace gluten diet,
5.9% were following a gluten containing diet and 4% were unable to be classified
(Figure 1). Five percent of respondents stated they had made a change to their own
diet in the previous 3 months in accordance with the March 1995 NFA food law
change. 73% of respondents believed they were following their diet strictly, 23.4%
believed they were mostly strict, 3.2% believed they were not very strict and 0.4%
believed they were not strict at all (Figure 2). Of the 71.9% of respondents following
the trace gluten diet, 73% did believe they were following a strict gluten free diet.
Figure 1: Proportion of subjects on each diet
Gluten free
18.2%
Trace gluten
71.8%Gluten containing
5.9%
Unable to classify
4.1%
Figure 2: Personal perceptions of dietary adherence
Strictly 73.0%
Mostly strict 23.4%
Not very strict 3.2%Not strict at all 0.4%

Symptoms
In the total group of respondents, there is a significant decrease (p<0.005) in both the
severity and frequency of all symptoms after beginning any diet with some level of
gluten restriction. The gastrointestinal symptom changes can be seen in Table 1.
Table 1. Comparison of gastrointestinal symptoms experienced before and after diagnosis and
commencement of any degree of dietary gluten restriction.
Before Diagnosis
(%)
After Diagnosis and Dietary
Gluten Restriction (%)
Severity of
symptoms
none
mild
moderate
severe
12
8
28
52
31
39
20
10
Frequency of
symptoms
never
<1/month
monthly
weekly
daily
16
3
3
13
65
32
18
13
19
18

In the no detectable gluten diet category, the decrease in symptoms in terms of
severity and frequency is significant (p<0.005) for all symptoms (Figures 3a & b).
Figure 3a: Severity of symptoms before diagnosis and after treatment with a
no detectable gluten diet.
GI MU V N Cr P B Fl D C DH H F O
0
20
40
60
80
100
% o
f su
bjec
ts
Mild Before Moderate Before Severe Before Mild After Moderate After Severe After
GI=Gastrointestinal symptoms (grouped). P=Stomach pain DH=Dermatitis HerpetiformisMU=Mouth ulcers B=Bloating H=Headaches
V=Vomiting Fl=Flatulence F=FatigueN=Nausea D=Diarrhoea O=Other symptoms
Cr=Cramps C=Constipation
***
***
***
***
*** *** ***
***
***
***
***
***
***
Statistical significance of the difference in heights for each individual symptom: *=p<0.05 **=p<0.01 ***=p<0.005
Figure 3b: Frequency of symptoms before diagnosis and after treatment with a
no detectable gluten diet.
GI MU V N Cr P B Fl D C DH H F O
0
20
40
60
80
100
% o
f su
bjec
ts
<1/month Before Monthly Before Weekly Before Daily Before
<1/month After Monthly After Weekly After Daily After
GI=Gastrointestinal symptoms (grouped) P=Stomach pain DH=Dermatitis HerpetiformisMU=Mouth ulcers B=Bloating H=HeadachesV=Vomiting Fl=Flatulence F=Fatigue
N=Nausea D=Diarrhoea O=Other symptomsCr=Cramps C=Constipation
***
***
***
***
*** ******
***
***
***
***
***
***
Statistical significance of the diifference in heights for each individual symptom: *=p<0.05 **=p<0.01 ***=p<0.005
Refer to Appendix 3 for tabular summary of the figures used for these graphs

In the trace gluten diet category, the decrease in symptoms in terms of severity and
frequency is significant (p<0.005) for all symptoms other than constipation which had
p-values of 0.073 for severity and 0.053 for frequency (Figure 4a &b). Constipation
had increased in both these categories.
Figure 4a: Severity of symptoms before diagnosis and after commencing
treatment with a trace gluten diet.
GI=Gastrointestinal symptoms (grouped). P=Stomach pain DH=Dermatitis HerpetiformisMU=Mouth ulcers B=Bloating H=Headaches
V=Vomiting Fl=Flatulence F=FatigueN=Nausea D=Diarrhoea O=Other symptoms
Cr=Cramps C=Constipation
GI MU V N Cr P B Fl D C DH H F O
0
20
40
60
80
100
% o
f su
bje
cts
Mild Before Moderate Before Severe Before Mild After Moderate After Severe After
***
***
*** ***
****** ***
***
***
***
***
***
Statistical significance of the differences in heights for each individual symptom: *=p<0.05 **=p<0.01 ***=p<0.005
Figure 4b: Frequency of symptoms before diagnosis and after commencing
treatment with a trace gluten diet.
GI MU V N Cr P B Fl D C DH H F O
0
20
40
60
80
100
% o
f su
bjec
ts
<1/month Before Monthly Before Weekly Before Daily Before
<1/month After Monthly After Weekly After Daily After
GI=Gastrointestinal symptoms (grouped) P=Stomach pain DH=Dermatitis HerpetiformisMU=Mouth ulcers B=Bloating H=HeadachesV=Vomiting Fl=Flatulence F=Fatigue
N=Nausea D=Diarrhoea O=Other symptomsCr=Cramps C=Constipation
***
***
*** ***
******
***
***
***
***
***
***
Statistical significance of the difference in heights for each individual symptom: *=p<0.05 **=p<0.01 ***=p<0.005
Refer to Appendix 3 for a tabular summary of the figures used for these graphs.
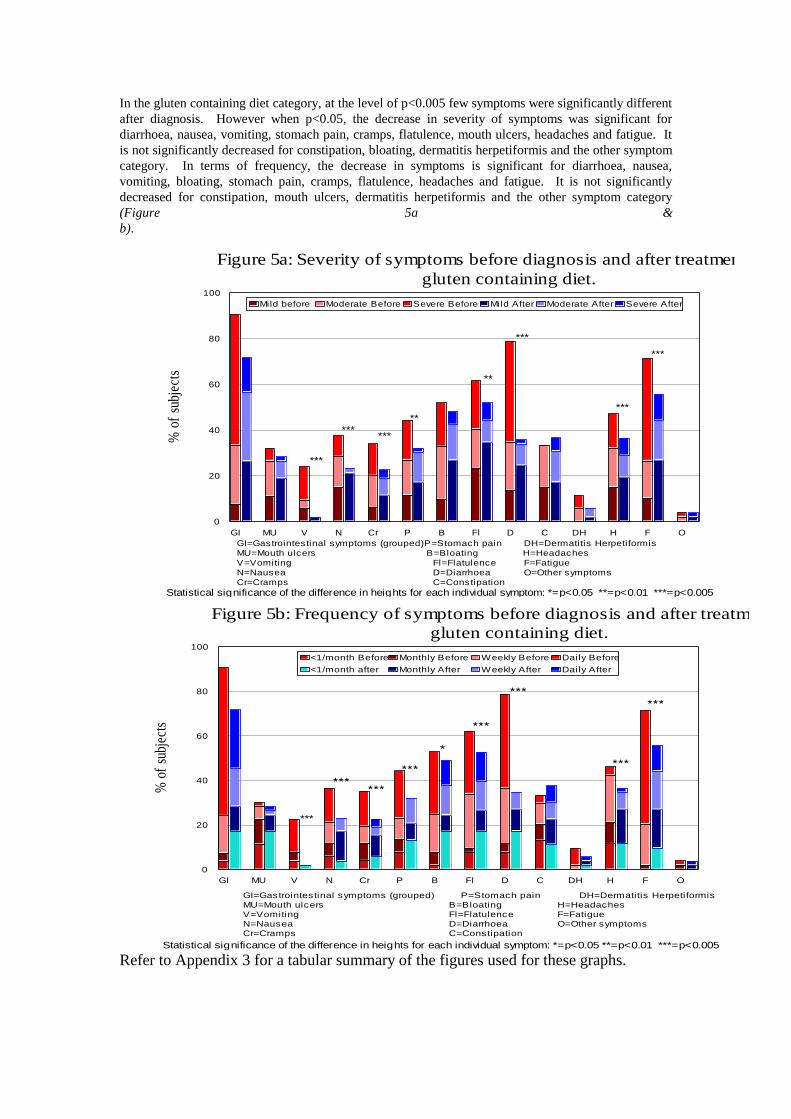
In the gluten containing diet category, at the level of p<0.005 few symptoms were significantly different
after diagnosis. However when p<0.05, the decrease in severity of symptoms was significant for
diarrhoea, nausea, vomiting, stomach pain, cramps, flatulence, mouth ulcers, headaches and fatigue. It
is not significantly decreased for constipation, bloating, dermatitis herpetiformis and the other symptom
category. In terms of frequency, the decrease in symptoms is significant for diarrhoea, nausea,
vomiting, bloating, stomach pain, cramps, flatulence, headaches and fatigue. It is not significantly
decreased for constipation, mouth ulcers, dermatitis herpetiformis and the other symptom category
(Figure 5a &
b).
Figure 5a: Severity of symptoms before diagnosis and after treatment with a
gluten containing diet.
GI MU V N Cr P B Fl D C DH H F O
0
20
40
60
80
100
% o
f su
bjec
ts
Mild before Moderate Before Severe Before Mild After Moderate After Severe After
GI=Gastrointestinal symptoms (grouped) P=Stomach pain DH=Dermatitis HerpetiformisMU=Mouth ulcers B=Bloating H=Headaches
V=Vomiting Fl=Flatulence F=FatigueN=Nausea D=Diarrhoea O=Other symptomsCr=Cramps C=Constipation
***
******
**
**
***
***
***
Statistical significance of the difference in heights for each individual symptom: *=p<0.05 **=p<0.01 ***=p<0.005
Figure 5b: Frequency of symptoms before diagnosis and after treatment with a
gluten containing diet.
GI MU V N Cr P B Fl D C DH H F O
0
20
40
60
80
100
% o
f su
bjec
ts
<1/month Before Monthly Before Weekly Before Daily Before
<1/month after Monthly After Weekly After Daily After
GI=Gastrointestinal symptoms (grouped) P=Stomach pain DH=Dermatitis HerpetiformisMU=Mouth ulcers B=Bloating H=Headaches
V=Vomiting Fl=Flatulence F=FatigueN=Nausea D=Diarrhoea O=Other symptomsCr=Cramps C=Constipation
***
Statistical significance of the difference in heights for each individual symptom: *=p<0.05 **=p<0.01 ***=p<0.005
Refer to Appendix 3 for a tabular summary of the figures used for these graphs.

When the symptoms were compared between the trace gluten diet category and the
gluten free diet category there was found to be no significant difference (p>0.01) in
the severity of any symptom other than constipation (p=0.0051), which was more
severe for the subjects following a trace gluten diet. There was no significant
difference (p>0.01) between the two groups for the frequency of any symptom except
for diarrhoea (p=0.0032) which was more frequent for the subjects following the no
detectable gluten diet.

DISCUSSION
To better understand if the dietary advice given to all patients needs to correspond
with the new food standard, this study set out to examine the dietary patterns in a large
population of coeliacs at the time of the NFA food standard change, and to document
any current symptoms experienced at these different levels of gluten restriction. In
doing so we have shown that a large proportion of coeliacs still have continuing
symptoms despite this gluten restriction.
Across all diet categories, it was clear that a reduction in the gluten content of the diet
resulted in a decrease in the number of people experiencing each symptom. Those
who still experienced symptoms generally found them to be less often and less severe.
All severities and frequencies significantly decreased in the no detectable gluten group
after beginning the diet. This was mirrored in the trace gluten diet group for all
symptoms except constipation. There were fewer significant decreases in symptoms
as the level of gluten rose above this as seen in the gluten containing diet category,
suggesting a dose dependent trend for symptom expression and gluten ingestion.
Catassi et. al.22
found a similar graded effect of gluten on villous morphology.
A number of criticisms can be made of the methodology in this study. While the
sample size is very large the questionnaire response rate was only 58%. The
respondent population is of an average age of 50, in the majority female and all are
members of the Coeliac Society of NSW. It is unknown if this sample is
representative of the Australian population diagnosed with coeliac disease. The
questionnaire is based only on the subject‟s self reporting. There was no medical
documentation to support claims, since some of the symptoms reported may due to a

separate condition. Difficulty could have been encountered when respondents were
allocating a single number rating each to the severity and the frequency of symptoms
they have experienced. In some cases considerable time had passed since diagnosis,
making recollection of symptoms during this period difficult. There was no allowance
made in this number rating system for variations in the severity or frequency of
symptoms experienced by each individual on different occasions. Dietary grouping
was often difficult. Limited questions were asked regarding the frequency and
quantity of consumption of some key food groups, thus the distinction for some
subjects between the particular diet classifications was sometimes ambiguous. While
many relevant food types were included and the food names and brands given were
thoroughly checked, we must still question whether or not all sources of gluten were
recorded by the questionnaire respondent. Cooking contamination may occur when
cooking appliances and ingredients are shared with other non-coeliacs. Ingredients
listed on food labels can be misleading and advice given in take away food shops can
be incorrect thus gluten ingestion may occur unknowingly. These points will be taken
into account when a similar survey is performed in the future to determine whether
coeliacs have adopted the food standard, and if symptoms have responded. It was
apparent from this study that when it was done, few coeliacs were aware of the food
standard changes, or that malt and wheat starch can contain gluten.
A higher incidence of constipation was seen in those subjects following the trace
gluten and gluten containing diets which was not seen for those following the no
detectable gluten diet. This may suggest that exquisite attention to gluten removal has
a positive effect on constipation. Lack of dietary fibre has generally been thought

responsible for constipation because the gluten free diet restricts the choice of grains,
minimising the range of high fibre foods available.
It is interesting to note that when the symptom frequency and severity profiles for the
trace gluten category were compared with the more restrictive diet category, there was
no significant differences seen between the groups for gut symptoms other than
diarrhoea and constipation, or for headaches, fatigue, mouth ulcers, dermatitis
herpetiformis and the other category. This appears to show that the symptoms
experienced by the trace gluten and gluten free diet groups of coeliac subjects are
almost the same. However it is important to note that this is a group trend and it may
not be true for each individual. Several studies 12, 18, 20
suggest that some individuals
with coeliac disease are more sensitive to gluten than others. We have not been able to
show if our subjects with the gluten free diet classification would have had more
severe and frequent symptoms if malt and wheaten starch were eaten. The greater
frequency of diarrhoea seen in those eating no detectable gluten may indicate them to
be a more sensitive group. Diarrhoea showed the most dramatic fall after restricting
gluten in the diet. The percentage of people experiencing it daily, fell from between
39-50% to between 0-5% over all three diet types. It may be simplistic to assume that
the diet followed is the only one known of by the coeliac or their medical care team.
The reduction or removal of diarrhoea alone may be a main goal for the individual,
and thus influence the diet each coeliac follows.
Reducing this and other symptoms to a tolerable level may be only one of several
influencing factors behind each individual‟s chosen level of gluten restriction. Some
may find the restrictions too difficult to cope with socially, so choose to be gluten free

only at their convenience. Since some forms of cancer, particularly the bowel
lymphoma23
have been linked with non compliance to a gluten free diet19
, it may be
possible that this is why some coeliacs choose to be strict with their diet independent
of symptom presence.
Holmes et. al.24
found that a gluten free diet may be important in preventing or
decreasing risk of later complications such as bowel lymphoma and other
gastrointestinal malignancies. While that study did not define the level of gluten in
the diet of its subjects, it is likely that the Codex Alimentarius was the gluten free diet
guide. Therefore it may be unnecessary for some patients to follow a completely
gluten free diet if they appear to be symptom free on a diet containing trace amounts
of gluten. We are currently unaware of any knowledge linking people on a gluten
free diet with persistent abnormal biopsies, as being more likely to have future
malignant complications. Due to this unknown factor, these people may again choose
a more restrictive diet in the hope of obtaining a normal biopsy.
This controversy concerning a „safe‟ level of gluten for coeliacs continues due to
varying results from studies performed to investigate the effect of low gluten diets on
both symptom occurrence and morphological changes of the villi in coeliac subjects.
Ciclitira et. al.18
found that there was a variety of symptomatic responses in coeliacs
consuming bread containing wheat starch. Some patients experienced one or more
gastrointestinal symptoms whereas others experienced none. Our study has shown
similar findings in all three of our gluten restricted diets. Other studies have shown
that symptoms can be present in some patients without morphological damage 18, 20, 21
and that small amounts of gluten do not always cause villi destruction 17, 18, 19
. This

tends to indicate little need for the coeliac with tolerable symptoms and a normal
biopsy to follow the no detectable gluten diet.
We have concluded from this study that for many coeliacs, after beginning a gluten
free diet, the severity and frequency of symptoms experienced, while milder, may still
be present. The group data suggests that the less restrictive trace gluten diet may be
followed in some coeliacs with similar benefit to the no detectable gluten diet.
However some studies above show that symptomatic benefit may be gained in some
individuals by the removal of trace gluten, and in the short term, no villous damage
occurs after its ingestion. Management of this disease may therefore be better
approached if continuous assessment of current biopsy results, symptom frequency
and severity, together with lifestyle and family history of cancer, are taken into
account when determining the level of dietary gluten restriction for each individual
coeliac.

Acknowledgments
Many thanks go to Ms Christina Hamilton and her supervisor, Dr Tania Prvan of the
School of Mathematical Sciences at the University of Technology, Sydney who
performed some statistical analysis on my data.
Thanks also to Mr Alan Barclay of the Allergy Consulting Rooms at Royal Prince
Alfred Hospital who provided much computing assistance and was my co-worker
when analysing the database containing responses from the national survey of the
Coeliac Society of Australia.
REFERENCES
1. Kristiansson B, Ascher H, Odenman I, Sandberg L. The incidence of coeliac disease and changes in
gluten consumption. In: Coeliac Disease. Mearin ML and Mulder CJJ. (eds.) Dordrecht: Kluwer.
1991: 107-114.
2. Mylotte MJ, Egan-Mitchell B, Fottrell PF, McNicholl BF, McCarthy CF. Incidence of coeliac
disease in the west of Ireland. British Medical Journal 1973; 1: 703-705.
3. Kagnoff MF. Understanding the molecular basis of coeliac disease. Gut 1990; 31: 497-499.
4. Visakorpi JK and Maki M. Changing clinical features of coeliac disease. Acta Paediatrica
Supplements 1994; 395: 10-13.
5. Howdle PD and Lowsowsky MS. Coeliac disease in adults. In: Coeliac Disease. Marsh MN (ed.)
Oxford: Blackwell Scientific Publications. 1992: 49-80.
6. Fry L. Dermatitis Herpetiformis. In: Coeliac Disease. Marsh MN (ed.) Oxford: Blackwell
Scientific Publications. 1992: 81-104.
7. Volta U and Bianchi FB. IgA antibodies to endomysium, gliadin and reticulin in silent coeliac
disease. The Lancet 1992; 339: 242.
8. Walker-Smith JA, Guandalini S, Schmitz J, Schmerling DH, Visakorpi JK. Revised criteria for
diagnosis of coeliac disease: Report of working group of European Society of Paediatric
Gastroenterology and Nutrition. Archives of Disease in Childhood 1990; 65: 909-911.
9. Ciclitira PJ, and Ellis HJ. Determination of the gluten content of foods. Panminerva Med 1991;
33: 75-82.
10. Wieser H. Cereal protein chemistry. In: Gastrointestinal immunology and gluten sensitive
disease: Proceedings of the sixth international symposium on coeliac disease. Feighery C and
O‟Farrelly C. (eds.) Dublin: Oak Tree Press 1994: 191-202.
11. Kasarda DD. Toxic cereal grains in coeliac disease. In: Gastrointestinal immunology and gluten
sensitive disease: Proceedings of the sixth international symposium on coeliac disease. Feighery C
and O‟Farrelly C. (eds.) Dublin: Oak Tree Press 1994: 203-220.
12. Schmitz J. Lack of oats toxicity in coeliac disease. British Medical Journal 1997; 314: 159-160.
13. WHO/FAO: Codex Alimentarius Commission Standard. 118 1981.
14. Skerrit JH, Devery JM and Hill AS. Gluten Intolerance: Chemistry, coeliac toxicity and detection
of prolamines in foods. Cereal Foods World 1990; 35: 638-644.
15. National Food Authority. Food Labelling for Gluten. 1995.
16. Skerrit JH and Hill AS. Enzyme immunoassay for the determination of gluten in foods:
collaborative study. J.A.O.A.C. 1991; 74: 257-264.
17. Montgomery AMP, Goka AKJ, Kumar PJ, Farthing MJG, Clark ML. Low gluten diet in the
treatment of adult coeliac disease: effect on jejunal morphology and serum antigluten antibodies.
Gut 1988; 29: 1564-156.
18. Ciclitira PJ, Cerio R, Ellis HJ, Maxton D, Nelufer JM, Macartney JM. Evaluation of a gliadin
containing gluten free product in coeliac patients. Human Nutrition: Clinical Nutrition 1985; 39C:
303-308.

19. Kumar PJ, Harris G, Colyer J, Clark ML, Dawson AM. Is a gluten free diet necessary for the
treatment of coeliac disease? [Abstract.] Gastroenterology 1985; 88: 1459.
20. Faulkner-Hogg KB, Selby WS and Loblay RH. A dietary analysis of symptomatic coeliacs on a
gluten free diet: the role of trace gluten and non-gluten food intolerances. (yet to be published.)
21. Thornquist H, Jacobsen GS, Dahl LB, Marhang G. Coeliac disease and gluten free diet: a
following-up study of fifteen young adults. Annals of Nutrition and Metabolism 1993; 37: 295-
301.
22. Catassi C, Rossini M, Ratsch IM, Bearzi I, Santinelli A, Castagnani R, Pisani E, Coppa GV,
Giorgio PL. Dose dependent effects of protracted ingestion of small amounts of gliadin in coeliac
disease children: a clinical and jejunal morphometric study. Gut 1993; 34: 1515-1519.
23. Mazzacca G. Diet, coeliac disease and gastrointestinal neoplasm. In: Advances in Nutrition and
Cancer Zappia,V. (ed.) Plenum Press New York 1993: 133-136.
24. Holmes GKT, Prior P, Lane MR, Pope D, Allan RN. Malignancy in coeliac disease: effect of a
gluten free diet. Gut 1989; 30: 333-338.