differences in patient outcomes of prevalence, interval
TRANSCRIPT

University of South FloridaScholar Commons
Computer Science and Engineering FacultyPublications Computer Science and Engineering
2016
Differences in Patient Outcomes of Prevalence,Interval, and Screen-Detected Lung Cancers in theCT Arm of the National Lung Screening TrialMatthew B. SchabathH. Lee Moffitt Cancer Center and Research Institute
Pierre P. MassionVanderbilt-Ingram Cancer Center, Nashville
Zachary J. ThompsonH. Lee Moffitt Cancer Center and Research Institute
Steven A. EschrichH. Lee Moffitt Cancer Center and Research Institute
Yoganand BalagurunathanH. Lee Moffitt Cancer Center and Research Institute
See next page for additional authors
Follow this and additional works at: http://scholarcommons.usf.edu/esb_facpub
Part of the Medicine and Health Sciences Commons
This Article is brought to you for free and open access by the Computer Science and Engineering at Scholar Commons. It has been accepted forinclusion in Computer Science and Engineering Faculty Publications by an authorized administrator of Scholar Commons. For more information,please contact [email protected].
Scholar Commons CitationSchabath, Matthew B.; Massion, Pierre P.; Thompson, Zachary J.; Eschrich, Steven A.; Balagurunathan, Yoganand; Goldof, Dmitry;Aberle, Denise R.; and Gillies, Robert J., "Differences in Patient Outcomes of Prevalence, Interval, and Screen-Detected Lung Cancersin the CT Arm of the National Lung Screening Trial" (2016). Computer Science and Engineering Faculty Publications. 109.http://scholarcommons.usf.edu/esb_facpub/109

AuthorsMatthew B. Schabath, Pierre P. Massion, Zachary J. Thompson, Steven A. Eschrich, YoganandBalagurunathan, Dmitry Goldof, Denise R. Aberle, and Robert J. Gillies
This article is available at Scholar Commons: http://scholarcommons.usf.edu/esb_facpub/109

RESEARCH ARTICLE
Differences in Patient Outcomes ofPrevalence, Interval, and Screen-DetectedLung Cancers in the CT Arm of the NationalLung Screening TrialMatthew B. Schabath1*, Pierre P. Massion2, Zachary J. Thompson3, Steven A. Eschrich4,Yoganand Balagurunathan5, Dmitry Goldof6, Denise R. Aberle7, Robert J. Gillies5
1 Department of Cancer Epidemiology, H. Lee Moffitt Cancer Center and Research Institute, Tampa, Florida,United States of America, 2 Thoracic Program, Vanderbilt-Ingram Cancer Center, Nashville, Tennessee,United States of America, 3 Department of Biostatistics, H. Lee Moffitt Cancer Center and Research Institute,Tampa, Florida, United States of America, 4 Department of Biomedical Informatics, H. Lee Moffitt CancerCenter and Research Institute, Tampa, Florida, United States of America, 5 Department of Cancer Imaging,H. Lee Moffitt Cancer Center and Research Institute, Tampa, Florida, United States of America,6 Department of Computer Science and Engineering; University of South Florida, Tampa, Florida, UnitedStates of America, 7 Department of Radiological Sciences; David Geffen School of Medicine at UCLA, LosAngeles, California, United States of America
AbstractLung cancer screening identifies cancers with heterogeneous behaviors. Some lung can-
cers will be identified among patients who had prior negative CT screens and upon follow-
up scans develop a de novo nodule that was determined to be cancerous. Other lung can-
cers will be identified among patients who had one or more prior stable positive scans that
were not determined to be lung cancer (indeterminate pulmonary nodules), but in follow-up
scans was diagnosed with an incidence lung cancer. Using data from the CT arm of the
National Lung Screening Trial, this analysis investigated differences in patient characteris-
tics and survival endpoints between prevalence-, interval-, and screen-detected lung can-
cers, characterized based on sequence of screening results. Lung cancers immediately
following a positive baseline (T0), and prior to the T1 screen, formed the prevalence cohort.
Interval cancers were diagnosed following a negative screen at any time point prior to the
next screening round. Two cohorts of screen-detected lung cancers (SDLC) were identified
that had a baseline positive screen that was that was not determined to be lung cancer (i.e.,
an indeterminate pulmonary nodule), but in follow-up scans was diagnosed with an inci-
dence lung cancer 12 (SDLC1) or 24 (SDLC2) months later. Two other incidence cohorts
had screen-detected lung cancers that had baseline negative screen and upon follow-up
scans developed a de novo nodule determined to be cancerous at 12 (SDLC3) or 24
(SDLC4) months later. Differences in patient characteristics, progression-free survival
(PFS), and overall survival (OS) were assessed. The lung cancer-specific death rate was
higher for SDLC3/SDLC4 compared to SDLC1/SDLC2 lung cancers (136.6/1,000 person-
years vs. 71.3/1,000 person-years, P < 0.001). Moreover, PFS and OS were significantly
PLOS ONE | DOI:10.1371/journal.pone.0159880 August 10, 2016 1 / 18
a11111
OPEN ACCESS
Citation: Schabath MB, Massion PP, Thompson ZJ,Eschrich SA, Balagurunathan Y, Goldof D, et al.(2016) Differences in Patient Outcomes ofPrevalence, Interval, and Screen-Detected LungCancers in the CT Arm of the National LungScreening Trial. PLoS ONE 11(8): e0159880.doi:10.1371/journal.pone.0159880
Editor: Sai Yendamuri, Roswell Park CancerInstitute, UNITED STATES
Received: February 21, 2016
Accepted: July 8, 2016
Published: August 10, 2016
Copyright: © 2016 Schabath et al. This is an openaccess article distributed under the terms of theCreative Commons Attribution License, which permitsunrestricted use, distribution, and reproduction in anymedium, provided the original author and source arecredited.
Data Availability Statement: None of the authors inthe manuscript are affiliated with the NCI and none ofthe authors own the dataset. All de-identified NLSTdata files are available from the National CancerInstitute (NCI) Cancer Data Access System (CDAS)at https://biometry.nci.nih.gov/cdas/. We did notgenerate any unique variables. As such, the samedata used in our analyses are available to allresearchers by submitting an application at CDAS.
Funding: Funding support came from the James &Esther King Biomedical Research Program-Team

lower for SDLC3/SDLC4 compared to SDLC1/SDLC2 (P < 0.004; P < 0.002, respectively).
The findings were consistent when stratified by stage and histology. Multivariable Cox pro-
portional models revealed that the SDLC3/SDLC4 case groups were associated with signifi-
cantly poorer PFS (HR = 1.89; 95% CI 1.31–2.74) and OS (HR = 1.80; 95% CI 1.21–2.67)
compared to SDLC1/SDLC2 lung cancers (HR = 1.00). Lung cancer patients who develop a
de novo nodule that determined to be cancerous (i.e., at least one negative CT screen prior
to cancer diagnosis) had poorer survival outcomes compared to patients who had at least
one positive screen prior to cancer diagnosis. As such, the observation that de novoscreen-detected are associated with poorer survival could be attributed to faster growing,
more aggressive cancers that arose from a lung environment previously lacking focal
abnormalities.
IntroductionThe National Lung Screening Trial (NLST) compared low-dose helical computed tomography(CT) and standard chest radiography (CXR) for three annual screens, which included a base-line prevalence screen (T0) and two annual follow-up screens (T1 and T2) [1–3]. After amedian follow-up of 6.4 years, a 20% relative reduction in lung cancer mortality was observedfor CT compared to CXR. Screen-detected lung cancers, defined as incidence lung cancersdiagnosed in the follow-up screens at T1 and T2, accounted for 58% of all CT-detected lungcancers, were 2.7-fold higher in the CT arm, associated with a stage shift from advanced tomore early stage lung cancers, and demonstrated improved 5-year survival compared to inter-val cancers and lung cancers diagnosed at the prevalence screen [1]. Screen-detected cancersinclude both a higher percentage of early stage tumors [1, 4–8] and a greater proportion ofmore rapidly growing cancers [4]. Additionally, screening detects indolent neoplasms that maynot otherwise cause clinical symptoms or death [9]. Overdiagnosis is a potential harm ofscreening because the work-up and treatment of these cancers incur additional costs, patientanxiety, and morbidity for disease that may pose no mortality threat if not otherwise treated[9, 10].
Lung cancer screening with subsequent follow-up will identify screen-detected lung cancerswith heterogeneous behaviors. For example, lung cancers will be diagnosed among participantswho had prior negative CT screens and upon follow-up scans develop a de novo nodule thatwas determined to be cancerous. Other lung cancers will be identified among patients who hadone or more prior stable positive scans that were not evaluated as lung cancer (indeterminatepulmonary nodules), but in follow-up scans was diagnosed with an incidence lung cancer.Additionally, there are screening participants that have numerous stable positive scans that arenever diagnosed as lung cancer (false positives). In addition to screen-detected lung cancers,lung cancer screening also identifies prevalence cancers at the baseline screen (i.e., first screen)and interval lung cancers diagnosed following a negative screen at any time point prior to thenext screening round. To date, there has not been a comprehensive analysis comparing screen-detected, prevalence, and interval lung cancers in the NLST. Additionally, it is unknownwhether differences in behavior of CT screen-detected lung cancers exist based on the sequenceof prior screening results, i.e., baseline positive screens vs baseline negative screens. Wehypothesize that de novo screen-detected lung cancers that develop following prior negativeCT screens are faster growing, more aggressive, and associated with poorer survival than can-cers diagnosed that had prior positive screens, since the tumor arose from a lung environment
Lung Cancer Outcomes in the NLST
PLOSONE | DOI:10.1371/journal.pone.0159880 August 10, 2016 2 / 18
Science Project (2KT01 to Dr. Gillies); the NationalCancer Institute (NCI) (U01-CA143062 to Dr. Gillies)and the NCI Early Detection Research Network (U01-CA152662 to Dr. Massion). This work has also beensupported in part by a Cancer Center Support Grant(CCSG) at the H. Lee Moffitt Cancer Center andResearch Institute; an NCI designatedComprehensive Cancer Center (grant number P30-CA76292).
Competing Interests: Dr. Gillies is a member of theAdvisory Board at HealthMyne, Inc. This does notalter the authors' adherence to all the PLOS ONEpolicies on sharing data and materials. Dr. Schabathis a PLOS ONE Editorial Board member. This doesnot alter the authors' adherence to PLOS ONEEditorial policies and criteria.

previously lacking focal abnormalities. Thus, using data from the NLST data, the goal of thisanalysis was to compare clinical characteristics and survival outcomes of prevalence lung can-cers, interval lung cancers, and screen-detected lung cancers based on the sequence of screen-ing results.
Methods
NLST study populationThis research was approved by the Chesapeake Institutional Review Board (Columbia, MD).De-identified NLST were obtained through the National Cancer Institute (NCI) Cancer DataAccess System (CDAS) [11]. We did not generate any unique variables. As such, the same dataused in our analyses are available to all researchers by submitting an application at CDAS. TheNLST study design [3] and main findings [1] have been described previously. Briefly, theNLST was a randomized multicenter trial comparing screening with low-dose helical CT toCXR in high-risk individuals. Prior to randomization, participants provided signed a consentform that explained the NLST in detail, including risks and benefits. Eligibility criteria includedcurrent or former smokers aged 55 to 74 years with a minimum 30 pack-year smoking history;former smokers had to have quit within the past 15 years. The NLST staff collected data oncancer diagnoses, lung cancer progression, and deaths that occurred through December 31,2009. We analyzed patient characteristics and survival outcomes among participants diagnosedwith lung cancer in the three screenings of the CT arm (T0, T1, and T2).
NLST CT screening resultsThe NLST protocol defined a positive screening result as one or more non-calcified nodules ormasses measuring� 4 mm in axial diameter or, less commonly, other abnormalities such asadenopathy or pleural effusion [1, 3]. Positive screens were defined in the setting of abnormali-ties on baseline screens or abnormalities on follow-up screens that were new, stable, or thatevolved, the latter demonstrated by an increase in nodule size, consistency, or other character-istic potentially related to lung cancer. Participants with positive screening results received fol-low-up recommendations; trial-wide guidelines for the management of positive screens weredeveloped, but were not mandated by protocol. The methods for classifiying and reportingidentified positive lung nodules in the NLST have been described in detail elsewhere [1, 3].
Negative screens were defined as CT scans with no abnormalities, minor abnormalities notsuspicious for lung cancer, or significant abnormalities not suspicious for lung cancer. Stableabnormalities across all three rounds could be classified as negative screens at the final screen(T2) at the discretion of the interpreting radiologist [1].
Lung cancer progression and vital statusNLST staff collected data on whether cancers progressed after initial treatment [1, 3]. Progres-sion was defined as enlargement of the original tumor, new metastasis to lymph nodes or otherorgan site not included in the original tumor staging, or disease recurrence. NLST staff col-lected vital status data on all participants; deaths were identified through update question-naires, communication from relatives, and queries to the National Death Index. Allinformation on the death certificate was recorded; the underlying cause of death based on thedeath certificate was derived according to rules established by the National Center for HealthStatistics. For deaths that may have been caused by lung cancer, an Endpoint VerificationCommittee (EVC) reviewed medical records blinded to death certificates to determine whether
Lung Cancer Outcomes in the NLST
PLOSONE | DOI:10.1371/journal.pone.0159880 August 10, 2016 3 / 18

the cause was lung cancer. The EVC cause of death was used in statistical analyses of the pri-mary endpoint [1, 3].
Prevalence-, interval-, and screen-detected lung cancersWe restructured the entire CT arm of the NLST (S1 Fig) according to baseline and follow-upscreening results (positive vs. negative screen). Lung cancers immediately following a positivebaseline (T0), and prior to the T1 screen, formed the prevalence cases (i.e., baseline lung can-cers). The screen-detected lung cancers were defined based on specific sequences of screeningresults and formed six screen-detected lung cancer case groups. Screen-Detected Lung CancerCohorts 1, 2, and 5 had a baseline positive screen that was that was determined to be lung can-cer (i.e., an indeterminate pulmonary nodule), but in follow-up scans was diagnosed with anincidence lung cancer 12 (T1) or 24 (T2) months later. Screen-Detected Lung Cancer Cohorts3, 4, and 6 has a baseline negative screen and upon follow-up scans develop a de novo nodulethat determined to be cancerous either 12 (T1) or 24 (T2) months later.
• Screen-Detected Lung Cancer Cohort 1 (SDLC1) (T0 positive!T1 positive!lung cancerdiagnosis) had baseline positive screens not associated with a lung cancer diagnosis, and thena screen-detected lung cancer followed a positive screen at T1.
• Screen-Detected Lung Cancer Cohort 2 (SDLC2) (T0 positive!T1 positive!T2 positi-ve!lung cancer diagnosis) had baseline and T1 positive screens not associated with a lungcancer diagnosis, and then a screen-detected lung cancer followed a positive screen at T2.
• Screen-Detected Lung Cancer Cohort 3 (SDLC3) (T0 negative!T1 positive!lung cancerdiagnosis) had baseline negative screens, and then a screen-detected lung cancer followed apositive screen at T1
• Screen-Detected Lung Cancer Cohort 4 (SDLC4) (T0 negative!T1 negative!T2 positi-ve!lung cancer diagnosis) had baseline and T1 negative screens, and then a screen-detectedlung cancer followed a positive screen at T2.
• Screen-Detected Lung Cancer Cohort 5 (SDLC5) (T0 positive!T1 negative! T2 positi-ve!lung cancer diagnosis) had baseline positive screens not associated with a lung cancerdiagnosis, and negative screen at T1, and then a screen-detected lung cancer followed a posi-tive screen at T2.
• Screen-Detected Lung Cancer Cohort 6 (SDLC6) (T0 negative!T1 positive!T2 positi-ve!lung cancer diagnosis) had a baseline negative screen, a T1 positive screen not associatedwith a lung cancer diagnosis, and a screen-detected lung cancer followed a positive screen atT2.
‘Interval cancers’ are defined as cancers that occur between scheduled screening episodesand the previous screening episode was negative or “normal”. In the NLST, interval cancerswere defined as lung cancers diagnosed following a negative screen at any time point prior tothe next screening round.
• All eighteen T0 interval lung cancers had a baseline negative screen.
• All ten T1 interval lung cancers had baseline and T1 negative screens.
• Among the sixteen T2 interval lung cancers, ten had negative screens at T0, T1, and T2; twohad negative screens at T0, positive screens at T1, and then negative screens at T2; two hadpositive screens at T0, and then negative screens at T1 and T2; and two had positive screensat T0 and T1, and then negative screens at T2.
Lung Cancer Outcomes in the NLST
PLOSONE | DOI:10.1371/journal.pone.0159880 August 10, 2016 4 / 18

Statistical analysesPearson’s chi-square was used to test for differences in categorical patient characteristics acrossthe case cohorts and ANOVA, Van Der Waerden normal scores test, and Wilcoxon rank-sumtest were used test for differences in continuous variables. Survival analyses were performedusing Kaplan-Meier survival curves, the log-rank statistic, and multivariable Cox proportionalhazard models. Progression-free survival (PFS) and overall survival (OS) were assessed fromdate of lung cancer diagnosis to the date of an event or date of last follow-up. For PFS an eventwas defined as death or progression of cancer; for OS an event was defined as death. Amongindividuals without an event, censoring occurred at either 5-years or date of last follow-up ifless than 5-years. Overall and lung cancer-specific death rates per 1,000 person-years were alsocalculated. All statistical analyses were two-sided and performed using SAS version 9.3 andStata/MP 12.1 for Windows (32-bit).
Results
Screening results and screening intervalsThe schema presented in Fig 1 represents the cohorts that were investigated in this analysis.We excluded SDLC5 and SDLC6 (S1 Fig) since these patients cannot be collapsed into theother case groups because their sequence of screening results are incompatible with SDLC1and SDLC2 and with SDLC3 to SDLC4. Moreover, they were not analyzed as independent casegroups because of their small sample sizes. Our sample size slightly varies from previous analy-ses [12] since 78 NLST participants who were deemed ineligible (e.g., quit smoking> 15 years)after enrollment and randomization were still included in our analyses. Despite their ineligiblestatus, these 78 participants remained in the CT-arm of the trial and only 5 of the 78 partici-pants were diagnosed with lung cancer (3 prevalence, 1 SDLC1, and 1 interval).
There were 270 prevalence cancers, 44 interval cancers, and SDLC1 and SDLC2 case groupsincluded 104 and 92 lung cancers, respectively. For the SDLC1 cases, 66.4% of the lung cancerswere observed in positive screens in which new or evolving nodules (increase in size or consis-tency) were observed (S1 Table). Similarly, 87% of SDLC2 lung cancers were observed in thesetting of new or evolving nodules. Similarly, for the SDLC3 and SDLC4 case groups, 85.5%and 98.4% of lung cancers were associated with positive screens in which new or evolving nod-ules were observed, respectively. There were no significant differences between the T1 screen-detected incidence cancers (SDLC1 and SDLC3) or the T2 screen-detected incidence cancers(SDLC2 and SDLC4) with respect to time from randomization to diagnosis or time intervalbetween successive screening visits (S2 Table).
Demographic and clinical differences between prevalence, screen-detected, and interval lung cancersThere were no significant differences between SDLC1 versus SDLC2 and between SDLC3 ver-sus SDLC4 for patient characteristics (Table 1) and for PFS and OS (S2 Fig). Thus, for all subse-quent analyses we combined SDLC1 and SDLC2 into one group representing incidence lungcancers that had baseline positive screens SDLC3 and SDLC4 into one group representing inci-dence lung cancers that had baseline negative screens. In Tables 2 and 3, pairwise comparisonswere assessed for the demographic and clinical characteristics between combined SDLC1/2cases and SDLC3/4 cases, prevalence cases, and interval cases.
There were no significant differences in demographic characteristics between the variouscohorts with the exception of sex (Table 2). A higher percentage of interval cancers were
Lung Cancer Outcomes in the NLST
PLOSONE | DOI:10.1371/journal.pone.0159880 August 10, 2016 5 / 18

observed in men (75%) than in the other cohorts (56.1% for SDLC1/2, 66.4% for SDLC3/4, and58.2% for prevalence lung cancers; P = 0.049).
There were significant differences in histological subtypes of lung cancer between the twocombined incidence cohorts (Table 3). Specifically, the SDLC1/2 cases had a higher percentageof adenocarcinoma histology than the SDLC3/4 cases (60.0% vs. 33.8%). Conversely, theSDLC3/4 cases had a significantly higher percentage of squamous cell carcinomas compared tothe SDLC1/2 cases (32% vs. 16.8%; P< 0.001). The prevalence lung cancers had a similar dis-tribution of histological subtypes compared to SDLC1/2 cases which was confirmed by pair-wise comparison analysis (P = 0.503, not included in Table 3). However, the pairwisecomparison between SDLC3/4 and prevalence lung cancers was statistically significant(P< 0.001, not included in Table 3). As such, the prevalence lung cancers had a significantly
Fig 1. Schema for the lung cancer case cohorts in the NLST at prevalence (baseline) and incidence screening (follow-up) rounds. Abbreviations:T0 = baseline screen; T1 = first screen; T2 = second screen; [+] = positive screen; [–] = negative screen. Prevalence lung cancers diagnosed at T0 areshaded green. Screen-detected lung cancers diagnosed at T1 and T2 rounds in which T0 screens were positive are shaded blue. Screen-detected lungcancers diagnosed at T1 and T2 in which T0 screens were negative are shaded red. Interval cancers (beige boxes) were diagnosed following a negativescreen. Participants were excluded if their screening results were inadequate or not compliant. At baseline we excluded 413 screens, 1,471 screens atT1, and 713 screens at T2.
doi:10.1371/journal.pone.0159880.g001
Lung Cancer Outcomes in the NLST
PLOSONE | DOI:10.1371/journal.pone.0159880 August 10, 2016 6 / 18

Table 1. Baseline Demographics and Clinical Characteristics of Four Screen-Detected Lung Cancer Case Cohorts.
Characteristic5 SDLC1 SDLC2 P-value1 SDLC3 SDLC4 P-value2
(N = 104) (N = 92) (N = 62) (N = 63)
Age, mean (SD) 64.4 (5.2) 63.0 (4.8) 0.056 63.4 (4.9) 63.8 (5.6) 0.667
Sex, N (%)
Male 59 (56.7) 51 (55.4) 0.412 39 (62.9) 44 (69.8) 0.855
Female 45 (43.3) 41 (44.6) 23 (37.1) 19 (30.2)
Race, N (%)
White 98 (94.2) 87 (94.8) 0.221 56 (90.3) 57 (90.5) 0.630
Black 5 (4.8) 5 (5.4) 4 (6.5) 0 (0.0)
Asian 1 (1.0) 0 (0.0) 1 (1.6) 3 (4.8)
Other 0 (0.0) 0 (0.0) 1 (1.6) 3 (4.8)
Ethnicity, N (%)
Hispanic or Latino 0 (0.0) 0 (0.0) 0.312 1 (1.6) 0 (0.0) 0.286
Neither Hispanic/Latino 104 (100.0) 91 (98.91) 61 (98.4) 63 (100.0)
Unknown 0 (0.0) 1 (1.09) 0 (0.0) 0 (0.0)
Smoking, N (%)
Current 53 (51.0) 52 (56.5) 0.115 42 (67.7) 34 (54.0) 0.436
Former 51 (49.0) 40 (43.5) 20 (32.3) 29 (46.0)
Pack-Years, mean (SD)
Current smokers 62.2 (28.7) 62.3 (20.1) 0.985 69.2 (25.7) 64.5 (21.8) 0.401
Former smokers 68.2 (27.2) 62.6 (28.2) 0.340 66.8 (25.5) 64.6 (27.0) 0.773
Education, N (%)
8th grade or less 1 (1.0) 1 (1.1) 0.694 1 (1.6) 1 (1.6) 0.753
11th grade 6 (5.8) 4 (4.4) 1 (1.6) 4 (6.4)
High school graduate/GED 31 (29.8) 22 (23.9) 16 (25.8) 12 (19.1)
Post high school training, excluding college 19 (18.3) 17 (18.5) 12 (19.4) 7 (11.11)
Associate degree/some college 22 (21.2) 16 (17.4) 17 (27.4) 20 (31.75)
Bachelor’s Degree 11 (10.6) 15 (16.3) 8 (12.9) 12 (19.05)
Graduate School 12 (11.5) 14 (15.2) 6 (9.9) 6 (9.52)
Other 1 (1.0) 3 (3.3) 1 (1.6) 1 (1.59)
Unknown 1 (1.0) 0 (0.0) 1 (1.6) 1 (1.59)
Marital, N (%)
Never married 4 (3.9) 5 (5.4) 0.394 1 (1.61) 3 (4.8) 0.558
Married 69 (66.4) 54 (58.7) 39 (62.9) 44 (69.8)
Widowed 9 (8.7) 7 (7.6) 5 (8.1) 7 (11.1)
Separated 0 (0.0) 0 (0.0) 2 (3.2) 1 (1.6)
Divorced 21 (20.2) 26 (28.3) 15 (24.2) 8 (12.7)
Unknown 1 (1.0) 0 (0.0) 1 (1.6) 3 (4.8)
History of COPD, N (%)
Yes 8 (7.7) 8 (8.7) 0.973 8 (12.9) 8 (12.7) 0.798
No 96 (92.3) 84 (91.3) 54 (87.1) 55 (87.3)
FH of lung cancer, N (%)
Yes 26 (25.0) 21 (22.8) 0.796 16 (25.8) 15 (23.8) 0.722
No 78 (75.0) 71 (77.2) 46 (74.2) 48 (76.2)
Stage, N (%)3
IA 58 (55.8) 45 (48.9) 0.922 28 (45.2) 37 (58.7) 0.626
IB 13 (12.5) 16 (17.4) 5 (8.1) 4 (6.4)
IIA 5 (4.8) 2 (2.2) 6 (9.7) 5 (7.9)
(Continued)
Lung Cancer Outcomes in the NLST
PLOSONE | DOI:10.1371/journal.pone.0159880 August 10, 2016 7 / 18

(P< 0.001) higher percentage of adenocarcinomas (54.1%) compared to the SDLC1/2 cases(33.8%). Interval lung cancers had the highest percentage of small cell carcinomas (31.8%)compared to SDLC1/2 (6.5%), SDLC3/4 (13.6%) and prevalence lung cancers (5.6%).
The only significant difference in stage distribution was that interval lung cancers had a sig-nificantly higher percentage of stage III (40.9%) and IV (31.8%) lung cancers (P< 0.001) com-pared to SDLC1/2 (14.3% and 10.7%), SDLC3/4 (15.2% and 11.2%) and prevalence lungcancers (15.2% and 19.3%). The mean tumor size was significantly higher for prevalence lungcancers (25.5 mm SD = 17.2) and interval lung cancers (41.1 mm SD = 21.7) compared toSDLC1/2 (21.3 mm SD = 16.3) and SDLC3/4 lung cancers (22.3 mm SD = 19.6).
Patient outcomes and Kaplan-Meier survival analysesCause of death (Table 3) was significantly different between the combined screen-detectedcases (P = 0.007). The absolute number and percentage of participants in the SDLC1/2 cases
Table 1. (Continued)
Characteristic5 SDLC1 SDLC2 P-value1 SDLC3 SDLC4 P-value2
(N = 104) (N = 92) (N = 62) (N = 63)
IIB 4 (3.8) 2 (2.2) 2 (3.2) 1 (1.6)
IIIA 6 (5.8) 8 (8.7) 6 (9.7) 4 (6.4)
IIIB 8 (7.7) 6 (6.5) 5 (8.1) 4 (6.4)
IV 9 (8.7) 12 (13.0) 8 (12.9) 6 (9.5)
Carcinoid, not assessed 0 (0.0) 1 (1.09) 0 (0.0) 0 (0.0)
Unknown 1 (1.0) 0 (0.0) 2 (3.23) 2 (3.17)
Tumor Size, N, mean mm (SD) 97, 20.5 (15.7) 85, 22.5 (17.1) 0.496 56, 24.1 (23.3) 60, 20.6 (15.4) 0.340
Histology, N (%)
Adenocarcinoma4 67 (64.4) 50 (54.6) 0.280 21 (33.9) 20 (32.8) 0.244
Small cell carcinoma 4 (3.9) 9 (9.8) 11 (17.7) 6 (9.5)
Squamous cell carcinoma 18 (17.3) 15 (16.3) 16 (25.8) 24 (38.1)
Other and NOS 15 (14.4) 17 (18.5) 14 (22.6) 11 (17.5)
Unknown 0 (0.0) 1 (1.1) 0 (0.0) 2 (3.2)
Cause of death, N (%)
Death due to lung cancer 29 (27.9) 24 (26.1) 31 (50.0) 23 (36.5)
Death not due to lung cancer 8 (7.7) 3 (3.3) 0.359 4 (6.5) 4 (6.4) 0.285
Cause of death unknown 0 (0.0) 0 (0.0) 1 (1.6) 0 (0.0)
No death reported 67 (64.4) 65 (70.7) 26 (41.9) 36 (57.1)
5-year Survival Rate, % 65.9% 67.5% 0.893 41.0% 55.2% 0.114
Death rate per 1,000 person-years, (95% CI)
Overall 83.3 90.4 0.119 183.4 135.6 0.372
(58.7–112.2) (62.0–131.8) (128.5–248.0) (89.4–191.4)
Lung cancer-specific 65.3 80.3 0.227 157.9 115.5 0.129
(45.4–94.0) (53.9–119.9) (107.3–218.2) (73.2–167.3)
Abbreviations: SDLC = Screen-Detected Lung Cancers; GED = graduate education degree; COPD = chronic obstructive pulmonary disease; FH = Family
history; Pack-years = packs smoked/day x years smoked;1 P-value comparing SDLC1 vs. SDLC22 P-value comparing SDLC3 vs. SDLC43 Carcinoid and unknown were removed before testing with Pearson’s chi-square4 BAC and adenocarcinoma were combined into one group.5 Demographic data were self-reported.
doi:10.1371/journal.pone.0159880.t001
Lung Cancer Outcomes in the NLST
PLOSONE | DOI:10.1371/journal.pone.0159880 August 10, 2016 8 / 18

with no reported deaths were significantly higher than in the SDLC3/4 cases (132 participants[67.4%] vs. 62 participants[49.6%]). Lung cancer deaths were nearly equal in number betweenthe two combined screen-detected cohorts, but the percentage was significantly lower in theSDLC1/2 cases (27.0% vs. 43.2%). There was also a significant difference in all cause deathswhen comparing the combined screen-detected cases to prevalence cases (P = 0.028), largelydriven by the reduced lung cancer death rate in the SDLC1/2 cases. Lung cancer deaths werehighest in those with interval cancers (79.6%), which was significantly different from thescreen-detected and prevalence cases (P< 0.001). The overall- and lung cancer-specific deathrates were significantly higher for the SDLC3/4 cases (159.6 per 1000 person-years and 136.6per 1000 person-years) compared to SDLC1/2 cases (86.2 per 1000 person-years and 71.3 per1000 person-years).
Kaplan-Meier survival analyses were used to calculate 5-year survival rates (Table 3) andcompare differences in PFS and OS between the lung cancer case groups. Across all lung cancercase groups, PFS (Fig 2A) was significantly highest in the SDLC1/2 case group than theSDLC3/4 cases (P< 0.001), prevalence (P = 0.031), and interval cancer cases (P< 0.001). Simi-lar findings were observed for OS (Fig 2B). PFS and OS were lowest in the interval cancers; PFS
Table 2. Baseline Demographic of the Grouped Screen-Detected, Prevalence, and Interval Cancer Cohorts.
Characteristic5 SDLC1/SDLC2 SDLC3/SDLC4 P-Value1 Prevalence P-Value2 Interval P-Value3
(N = 196) (N = 125) (N = 270) (N = 44)
Age, mean years (SD) 63.7 (5.1) 63.6 (5.3) 0.767 63.0 (5.1) 0.897 63.0 (5.1) 0.799
Sex 0.067 0.167 0.049
Male, N (%) 110 (56.1) 83 (66.4) 157 (58.2) 33 (75.00)
Female, N (%) 86 (43.9) 42 (33.6) 113 (41.9) 11 (25.00)
Race, N (%)4 0.177 0.263 0.577
Whites 185 (94.4) 113 (90.4) 250 (92.9) 40 (90.91)
Other 11 (5.6) 12 (9.6) 20 (7.4) 4 (9.09)
Smoking Status, N (%) 0.203 0.427 0.334
Current 105 (53.6) 76 (60.8) 149 (55.2) 29 (65.91)
Former 91 (46.4) 49 (39.2) 121 (44.8) 15 (34.09)
Pack-years Smoked, Mean (SD)
Current smokers 62.2 (24.7) 67.1 (24.0) 0.186 65.5 (29.3) 0.444 67.3 (26.2) 0.506
Former smokers 65.7 (27.6) 65.5 (26.1) 0.960 65.5 (30.5) 0.999 69.4 (31.3) 0.973
History of COPD, N (%) 0.176 0.393 0.482
Yes 16 (18.2) 16 (12.8) 29 (10.7) 3 (6.82)
No 180 (91.8) 109 (87.2) 241 (89.3) 41 (93.18)
FH of Lung Cancer, N (%) 0.867 0.391 0.227
Yes 47 (24.0) 31 (24.8) 79 (29.3) 7 (15.91)
No 149 (76.0) 94 (75.2) 191 (70.7) 37 (84.09)
Abbreviations: SDLC = Screen-Detected Lung Cancers, SD = Standard deviation, Pack-years = packs smoked/day x years smoked; COPD = chronic
obstructive pulmonary disease; FH = Family history in a direct relative.
Statistically significant p-values (p < 0.05) are shown in bold.1P-value comparing SDLC1 and SDLC2 vs. SDLC3 and SDLC42 P-value comparing SDLC1/SDLC2 vs. SDLC3/SDLC4 vs. prevalence cancers3 P-value comparing SDLC1/SDLC2 vs. SDLC3/SDLC4 vs. prevalence vs. interval cancers.4 For SDLC1 and SDLC2 99.5% were neither Hispanic/Latino, 99.2% for SDLC3 and SDLC4, and 96.4% for prevalence cancers5 Demographic data were self-reported. Level of education and marital status were not significantly different between cohorts and are not shown.
doi:10.1371/journal.pone.0159880.t002
Lung Cancer Outcomes in the NLST
PLOSONE | DOI:10.1371/journal.pone.0159880 August 10, 2016 9 / 18

and OS for the prevalence cancers was intermediate between the combined screen-detectedcases.
When analyzing only early stage lung cancers (stages I and II), both PFS and OS remainedhigher in the SDLC1/2 cases compared to the SDLC3/4 cases (Fig 3A and 3B; P< 0.002,P< 0.004, respectively); differences in survival endpoints between the SDLC1/2 and prevalencelung cancers were not significant. The SDLC3/4 cases had significantly poorer OS than theprevalence cases (Fig 3B, P = 0.041). When OS and PFS were stratified by histology (S3 and S4Figs), SDLC3/4 cases consistently had poorer outcomes than the SDLC1/2 cases.
Multivariable hazard models for PFS and OSMultivariable Cox proportional hazard models of PFS and OS (Table 4) were utilized toaccount for confounding from demographic and clinical variables that may have contributed
Table 3. Clinical Characteristics and Outcomes of the Grouped Screen-Detected, Prevalence, and Interval Cancer Cohorts.
Characteristic SDLC1/SDLC2 SDLC3/SDLC4 P-Value1 Prevalence P-Value2 Interval P-Value3
(N = 196) (N = 125) (N = 270) (N = 44)
Lung Cancer Histology, N (%)4 < 0.001 < 0.001 < 0.001
Adenocarcinoma 117 (60.0) 41 (33.8) 146 (54.1) 8 (18.2)
Small cell carcinoma 13 (6.5) 17 (13.6) 15 (5.6) 14 (31.8)
Squamous cell carcinoma 33 (16.8) 40 (32.0) 46 (17.1) 13 (29.6)
Other and NOS 32 (16.3) 25 (20.0) 60 (22.3) 9 (20.5)
Unknown 1 (0.5) 2 (1.6) 3 (1.1) 0 (0.0)
Stage, N (%)5 0.437 0.206 < 0.001
Stage I 132 (67.3) 74 (59.2) 156 (57.8) 7 (15.9)
Stage II 13 (6.6) 14 (11.2) 18 (6.7) 5 (11.4)
Stage III 28 (14.3) 19 (15.2) 52 (19.3) 18 (40.9)
Stage IV 21 (10.7) 14 (11.2) 41 (15.2) 14 (31.8)
Carcinoid, not assessed 1 (0.5) 0 (0.0) 2 (0.74) 0 (0.0)
Unknown 1 (0.5) 4 (3.2) 1 (0.37) 0 (0.0)
Tumor Size,meanmm (SD) 21.3 (16.3) 22.3 (19.6) 0.623 25.5 (17.2) 0.032 41.4 (21.7) < 0.001
Cause of Death, N (%) 0.007 0.028 < 0.001
Death due to lung cancer 53 (27.0) 54 (43.2) 120 (40.4) 35 (79.55)
Death not due to lung cancer 11 (5.6) 8 (6.4) 18 (6.1) 2 (4.55)
Cause of death unknown 0 (0.0) 1 (0.8) 1 (0.4) 0 (0.0)
No death reported 132 (67.4) 62 (49.6) 158 (53.2) 7 (15.91)
5-year Survival Rate, % 65.7 47.6 < 0.001 59.9 0.004 17.3% < 0.001
Death rate per 1,000 person-years, (95% CI)
Overall 86.2 159.6 < 0.001 98.9 NC 453.5 NC
(66.3–108.5) (122.5–201.1) (82.0–117.4) (319.3–610.9)
Lung cancer-specific 71.3 136.6 < 0.001 84.1 NC 429.0 NC
(53.4–91.8) (102.6–175.4) (68.6–101.2) (298.8–582.4)
Abbreviations: SDLC = Screen-Detected Lung Cancers; SD = Standard deviation; NC = not calculated
Statistically significant p-values (p < 0.05) are shown in bold.1 P-value comparing SDLC1/SDLC2 vs. SDLC3/SDLC4.2 P-value comparing SDLC1/SDLC2 vs. SDLC3/SDLC4 vs. prevalence cancers.3 P-value comparing SDLC1/SDLC2 vs. SDLC3/SDLC4 vs. prevalence vs. interval cancers.4 BAC and adenocarcinoma were combined into one group. Unknown removed before testing with Pearson’s chi-square.5 Carcinoid and unknown removed before testing with Pearson’s chi-square.
doi:10.1371/journal.pone.0159880.t003
Lung Cancer Outcomes in the NLST
PLOSONE | DOI:10.1371/journal.pone.0159880 August 10, 2016 10 / 18

Fig 2. Kaplan-Meier estimates and number of subjects at risk for (A) progression free survival and (B) overallsurvival in the prevalence-, interval-, and grouped screen-detected lung cancers. Abbreviations: SDLC1/2 = Combined screen-detected lung cancers following positive screens at T1 and T2 rounds in cohorts with T0 positivescreens; SDLC3/4 = Combined screen-detected lung cancers following positive screens at T1 and T2 rounds amongcohorts with T0 or T0 and T1 negative screens; PC = Prevalence lung cancer cohort; IC = Interval cancer cohort.
doi:10.1371/journal.pone.0159880.g002
Lung Cancer Outcomes in the NLST
PLOSONE | DOI:10.1371/journal.pone.0159880 August 10, 2016 11 / 18
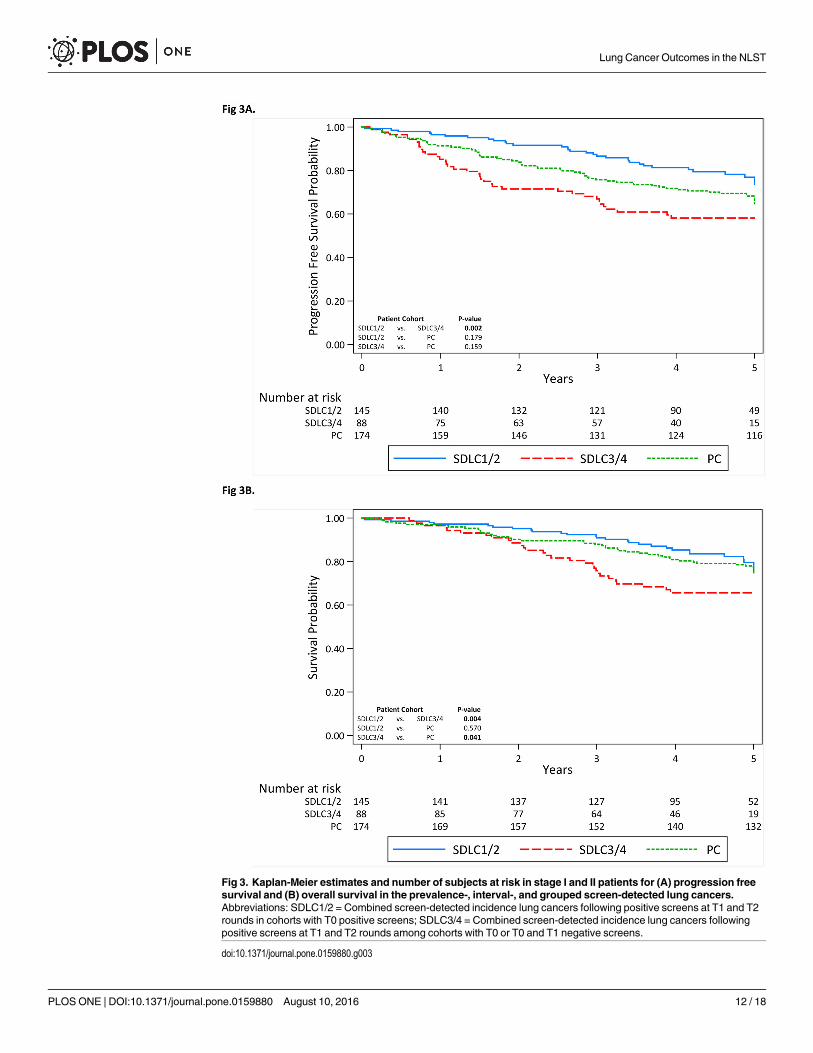
Fig 3. Kaplan-Meier estimates and number of subjects at risk in stage I and II patients for (A) progression freesurvival and (B) overall survival in the prevalence-, interval-, and grouped screen-detected lung cancers.Abbreviations: SDLC1/2 = Combined screen-detected incidence lung cancers following positive screens at T1 and T2rounds in cohorts with T0 positive screens; SDLC3/4 = Combined screen-detected incidence lung cancers followingpositive screens at T1 and T2 rounds among cohorts with T0 or T0 and T1 negative screens.
doi:10.1371/journal.pone.0159880.g003
Lung Cancer Outcomes in the NLST
PLOSONE | DOI:10.1371/journal.pone.0159880 August 10, 2016 12 / 18

Table 4. Multivariable Cox Proportional Hazards Models for Progression Free and Overall Survival for the Screen-Detected Cohorts.
Characteristic Progression Free Survival Overall Survival
HR (95% CI) HR (95% CI) HR (95% CI) HR (95% CI)
Screen-detected lung cancers
SDLC1/2 1.00 (Reference) 1.00 (Reference) 1.00 (Reference) 1.00 (Reference)
SDLC3/4 1.89 (1.31–2.74) - - 1.80 (1.21–2.67)
SDLC3 - - 1.75 (1.13–2.74) - - 1.88 (1.19–3.01)
SDLC4 - - 2.07 (1.31–3.25) - - 1.71 (1.04–2.81)
Age, per 1 year 1.03 (0.99–1.07) 1.03 (0.99–1.07) 1.06 (1.02–1.10) 1.06 (1.02–1.10)
Sex
Female 1.00 (Reference) 1.00 (Reference) 1.00 (Reference) 1.00 (Reference)
Male 0.96 (0.67–1.39) 0.97 (0.88–1.41) 1.39 (0.91–2.21) 1.39 (0.91–2.11)
Race
White 1.00 (Reference) 1.00 (Reference) 1.00 (Reference) 1.00 (Reference)
Non-white 0.77 (0.39–1.52) 0.75 (0.38–1.50) 0.96 (0.47–1.98) 0.98 (0.47–2.03)
Smoking Status
Former 1.00 (Reference) 1.00 (Reference) 1.00 (Reference) 1.00 (Reference)
Current 0.98 (0.69–1.39) 1.00 (0.70–1.42) 1.07 (0.73–1.57) 1.06 (0.72–1.56)
Pack-years, per 1 pack-year 1.00 (0.99–1.01) 1.00 (0.99–1.01) 0.99 (0.99–1.01) 1.00 (0.99–1.01)
History of COPD
No 1.00 (Reference) 1.00 (Reference) 1.00 (Reference) 1.00 (Reference)
Yes 1.57 (0.89–2.78) 1.60 (0.91–2.83) 1.31 (0.71–2.43) 1.31 (0.70–2.42)
FH of lung cancer
No 1.00 (Reference) 1.00 (Reference) 1.00 (Reference) 1.00 (Reference)
Yes 1.88 (1.27–2.80) 1.86 (1.25–2.78) 1.52 (0.98–2.32) 1.53 (0.99–2.37)
Stage at Diagnosis
Stage IA 1.00 (Reference) 1.00 (Reference) 1.00 (Reference) 1.00 (Reference)
Stage IB 1.38 (0.69–2.72) 1.38 (0.70–2.74) 1.53 (0.71–3.31) 1.53 (0.71–3.30)
Stage IIA + IIB1 4.04 (2.14–7.61) 4.07 (2.16–7.67) 4.08 (2.12–7.85) 4.08 (2.12–7.85)
Stage IIIA + IIIB1 6.38 (3.72–10.96) 6.42 (3.74–11.03) 8.27 (4.94–13.84) 8.22 (4.90–13.78)
Stage IV 15.22 (7.94–29.19) 15.48 (8.05–29.75) 25.94 (14.08–47.79) 25.64 (13.86–47.40)
Unknown 1.30 (0.29–5.82) 1.32 (0.29–5.86) 2.27 (0.50–10.36) 2.25 (0.49–10.26)
Histology
Adenocarcinoma2 1.00 (Reference) 1.00 (Reference) 1.00 (Reference) 1.00 (Reference)
Squamous cell carcinoma 1.19 (0.74–1.91) 1.17 (0.72–1.87) 1.59 (0.96–2.64) 1.60 (0.96–2.67)
Small cell carcinoma 1.05 (0.64–1.71) 0.75 (0.41–1.38) 1.64 (0.90–2.99) 1.65 (0.90–3.01)
Treatment3
Surgery 1.00 (Reference) 1.00 (Reference) – – – –
Chemotherapy and other 2.64 (1.43–4.85) 2.68 (1.45–4.96) – – – –
Radiation therapy 1.67 (0.99–2.81) 1.71 (1.01–2.89) – – – –
Abbreviations: HR = hazard ratio; CI = confidence interval; SDLC = Screen-Detected Lung Cancers; BAC = bronchioloalveolar cell carcinoma; NOS = not
otherwise specified; FH = family history; COPD = Chronic Obstructive Pulmonary Disease
Statistically significant hazard ratios (p < 0.05) are shown in bold.1 Due to small sample sizes, some stages were collapsed.2 BAC and adenocarcinoma were combined into one group3 Treatment was only included in the PFS analyses
doi:10.1371/journal.pone.0159880.t004
Lung Cancer Outcomes in the NLST
PLOSONE | DOI:10.1371/journal.pone.0159880 August 10, 2016 13 / 18

to the survival differences observed between the screen-detected lung cancer case groups.Model variables included age, sex, race, smoking variables, self-reported history of COPD, fam-ily history of lung cancer, lung cancer stage, and histology. For the PFS analyses, we alsoincluded treatment as a covariate. The SDLC1/2 cases were set as the reference group (HazardRatio [HR] = 1.0), and separate analyses were performed assessing SDLC3/4 combined and forindependent point estimates for SDLC3 and SDLC4. Relative to SDLC1/2, the hazard ratio forPFS was worst for the combined SDLC3/4 cases (HR = 1.89; 95% confidence interval [CI]1.31–2.74) as well as for SDLC3 (HR = 1.75; 95% CI 1.13–2.74) and SDLC4 (HR = 2.07; 95%CI 1.31–3.25). Similarly, the models for OS revealed that the combined SDLC3/4 cases(HR = 1.80; 95% CI 1.21–2.67) as well as the SDLC3 (HR = 1.88; 95% CI 1.19–3.01) andSDLC4 (HR = 1.71; 95% CI, 1.04–2.81) cohorts were associated with significantly elevatedHRs. For the PFS analyses, family history of lung cancer, stage of disease, and treatment exhib-ited significantly elevated HRs. For the OS analyses, age and stage of disease exhibited signifi-cantly elevated HRs.
DiscussionWe performed a post hoc analysis of the CT arm of the NLST to investigate differences inpatient characteristics and outcomes between prevalence lung cancers, interval lung cancersand screen-detected incidence cancers. Furthermore, we investigated whether there were dif-ferences among screen-detected incidence cancers in which only positive screens preceded thediagnosis of lung cancer (SDLC1 and SDLC2 case groups) and screen-detected incidence can-cers with one or more antecedent negative screens (SDLC3 and SDLC4 case groups). Becauseour analyses revealed no significant differences in patient characteristics and outcomesbetween SDLC1 and SDLC2 and between SDLC3 and SDLC4, we collapsed the four screen-detected case groups into the two combined case groups (SDLC1/SDLC2 and SDLC3/SDLC4).Thus, the main finding of this report is that lung cancer patients who develop a de novo nodulethat determined to be cancerous (i.e., at least one negative CT screen prior to cancer diagnosis)had poorer survival outcomes compared to patients who had at least one positive screen priorto cancer diagnosis. As such, the observation that de novo screen-detected are associated withpoorer survival could be attributed to faster growing, more aggressive cancers that arose from alung environment previously lacking focal abnormalities.
Previous post hoc analyses of CT screening studies have found survival advantages for lungcancer based on sex, smoking status, pack-year smoked, stage, and histology [13–15]. Our anal-ysis is among the first to show differences in patient survival outcomes among screen-detectedlung cancers based on the sequence of antecedent screening results (i.e., positive screen versusnegative screen). We performed additional analyses to rule out potential biases that may havecontributed to the observed findings. First, we found no differences in the time from randomi-zation (S2 Table) to cancer diagnoses for the T1 screen-detected cases (SDLC1 and SDLC3)and for the T2 screen-detected cancers (SDLC2 and SDLC4). Next, stratified analyses and mul-tivariable modeling (Table 4) were performed since subtle differences in patient characteristicsbetween the lung cancer case groups could influence outcomes. The results were consistentwhen we restricted to stage I and II patients (Fig 3A and 3B) and when we stratified by histol-ogy (S3 and S4 Figs) despite finding a higher percentage of squamous cell carcinomas forSDLC3/SDLC4 and a higher percentage of adenocarcinomas for SDLC1/SDLC2. Thus, stageand histology were not contributing to the observed survival differences. Finally, the resultswere consistent when multivariable models (Table 4) were utilized to remove the influence ofpotential prognostic factors. Thus, our systematic analyses appeared to rule out sources ofbiases and confounding that could have attributed the observation that patients with at least
Lung Cancer Outcomes in the NLST
PLOSONE | DOI:10.1371/journal.pone.0159880 August 10, 2016 14 / 18

one antecedent negative screen exhibited significantly poorer survival when compared topatients with consecutive positive screens prior to cancer diagnosis.
As defined by the NLST [1, 3], screen-detected cancers were defined by the sequence ofscreen positivity and negativity. A newly positive screen could represent either a new findingsatisfying definition of screen positivity (a nodule 4 mm or larger or a finding suspicious forlung cancer) or the evolution of a nodule previously not fulfilling definition of positive screen(nodule< 4 mm) that evolved. In rare instances, a clearly abnormal finding on a screen couldhave been missed by the readers—a false negative interpretation. Anatomic location did notplay a role in determining screen positivity. As such, we acknowledge the limitation that a nod-ule prompting a positive screen on an antecedent screen could be in a different anatomic loca-tion than the nodule prompting a positive screen at a later time point. The SDLC1/SDLC2cases had positive screens at baseline and depending upon the features of the detected nodulesprompting a positive screen, these participants would have undergone additional evaluation,typically imaging-based, but occasionally histologic sampling at T0 (< 11%). Among the 104lung cancer patients in SDLC1, 103 had a biopsy at T1 and only 6 had a biopsy at T0; 88 of 92patients in SDLC2 had a biopsy at T2, 6 had a had a biopsy at T1, and only 3 had a biopsy atT0. In the absence of evolutionary changes in nodule features on imaging (increased size orattenuation) or confirmatory histology, positive screens would not undergo more aggressivemanagement, but would receive next annual screen at T1. The SDLC3/4 cancers followed nega-tive baseline screens which is also based on NLST criteria [1] where either “no or minor abnor-malities” that fell below the threshold criteria for screen positivity (S1 Table). Although thenumbers of screen-detected lung cancers arising in the setting of one or more prior negativescreens is small, our data supports a more aggressive cancer behavior relative among thesescreen-detected cancers.
A previous study by Carter et al. [4] found that screen-detected lung cancers detected weresmaller and more invasive than those diagnosed at prevalence screens. Our analyses revealedthat the prevalence lung cancers were larger than the SDLC1/SDLC2 and SDLC3/SDLC4 lungcancers (Table 3), had a higher percentage of adenocarcinomas compared to SDLC3/SDLC4,and exhibited poorer outcomes than the SDLC1/SDLC2 lung cancer but improved outcomescompared to SDLC3/SDLC4 cancers. Our analyses also revealed that interval cancers wereassociated with worst outcome which is likely attributed to that these cancers exhibited a shifttowards more biologically aggressive SCLC histology, had significantly larger tumors, and hadadvanced stage disease at time of diagnosis.
There are limitations of our analysis. The generalizability of our results to screening popula-tions outside the NLST eligibility criteria is indeterminate [3]. Although we performed strati-fied and multivariable analyses, we cannot account for biases from unknown confounders andunmeasured covariates. For instance, it is unknown to what degree over-diagnoses occur in theSDLC1/2 cases, or whether they would have remained biologically indolent had they not beentreated. As noted, we do not know whether the nodules sequentially observed in SDLC1/2 lungcancer patients were the same nodules that progressed and developed into lung cancer. More-over, the implications of changing threshold criteria for screen positivity on outcomes have yetto be determined prospectively. However, our results reaffirm that interval cancers are moreaggressive, and that screen-detected cancers in cohorts with antecedent negative screens showhistologic differences relative to cancers observed at prevalence or screen-detected screens withconsistently prior positive screens, appear to be more aggressive, and to suffer survivaldisadvantages.
Although the NLST demonstrated a clear benefit of lung cancer and all-cause mortalityreduction with CT screening [1], this post hoc analysis reveals important and novel insight tothe heterogeneity of lung cancers diagnosed in a screening population. As with interval cancers
Lung Cancer Outcomes in the NLST
PLOSONE | DOI:10.1371/journal.pone.0159880 August 10, 2016 15 / 18
diagnosed following a negative screen, de novo lung tumors that arise in a lung environmentostensibly free of lung nodules are likely more rapidly growing and aggressive which results inthe significantly poorer outcomes. These findings could support more aggressive treatment ofinterval cancers and de novo screen-detected cancers with antecedent negative screens, sincecurrent evidence indicates that adjuvant chemotherapy confers a survival advantage forNSCLC patients with high-risk disease [16, 17]. However, a recent post hoc analysis by Patzet al [12] suggested that annual screening after a negative screen might be unnecessary sincethe authors reported a significant reduction in lung cancer incidence among NLST participantswith a baseline negative screen compared to those with a baseline positive screen. Ideallythough, molecular, genetic, and imaging-based biomarkers should be developed to assist inidentifying high-risk participants and biologically aggressive nodules [18, 19]. As such, addi-tional research will be needed inform the potential translational implications of these findings,to understand the biology of these screen-detected tumors, to determine whether these findingsare consistent across screening trials and screening thresholds, and how to personalize cancermanagement in these potentially vulnerable patients.
Supporting InformationS1 Fig. Schema for the Entire CT-arm of the NLST based on Screening Results and LungCancer Diagnoses. The dashed lines indicate the parts of the schema that were not included inthe final analyses.(PDF)
S2 Fig. (A) Kaplan-Meier Estimates of Progression Free Survival with Number of Subjectsat Risk for the Individual Screen-Detected Cancer Cohorts and Prevalence Cancer Cohort.(B) Kaplan-Meier Estimates of Overall Survival with Number of Subjects at Risk for theIndividual Screen-Detected Cancer Cohorts and Prevalence Cancer Cohort.(DOCX)
S3 Fig. (A) Kaplan-Meier Estimates of Progression Free Survival of Adenocarcinoma/BACCases With Number of Subjects at Risk within the Prevalence and Combined Screen-Detected Cancer Cohorts. (B) Estimates of Progression Free Survival of Adenocarcinoma/BAC Cases With Number of Subjects at Risk within the Prevalence and Combined Screen-Detected Cancer Cohorts.(DOCX)
S4 Fig. (A) Kaplan-Meier Estimates of Progression Free Survival for Squamous Cell Carci-noma Cases With Number of Subjects at Risk within the Prevalence and Combined Screen-Detected Cancer Cohorts. (B) Kaplan-Meier Estimates of Overall Survival for SquamousCell Carcinoma Cases with Number of Subjects at Risk within the Prevalence and Com-bined Screen-Detected Cancer Cohorts.(DOCX)
S1 Table. CT Screening Results at Each Round for the Incidence Cancer Cohorts with LungCancer. Abbreviations: SDLC1 = screen-detected lung cancers cohort 1 with baseline positivescreens not associated with a lung cancer diagnosis and a screen-detected incidence lung cancerfollowed a positive screen at T1; SDLC2 = screen-detected lung cancers cohort 2 with baselineand T1 positive screens not associated with a lung cancer diagnosis and a screen-detected inci-dence lung cancer followed a positive screen at T2; SDLC3 = screen-detected lung cancerscohort 3 with baseline negative screens and a screen-detected incidence lung cancer followed apositive screen at T1; SDLC4 = screen-detected lung cancers cohort 4 with baseline and T1
Lung Cancer Outcomes in the NLST
PLOSONE | DOI:10.1371/journal.pone.0159880 August 10, 2016 16 / 18

negative screens and a screen-detected incidence lung cancer followed a positive screen at T2;PC = Prevalence lung cancer cohort.(DOCX)
S2 Table. Time Intervals Between Events for the Incidence Lung Cancer Cohorts.(DOCX)
AcknowledgmentsNone of the authors are affiliated with the National Cancer Institute. The authors thank theNCI for access to NCI's data collected by the National Lung Screening Trial. The statementscontained herein are solely those of the authors and do not represent or imply concurrence orendorsement by the NCI. This work has been presented at the 2015 International Associationfor the Study of Lung Cancer (IASLC) conference [20].
Author ContributionsConceived and designed the experiments: MBS PPM RJG. Analyzed the data: MBS ZJT. Con-tributed reagents/materials/analysis tools: ZJT YB SAE. Wrote the paper: MBS PPM YB SAEDG DRA RJG.
References1. Aberle DR, Adams AM, Berg CD, BlackWC, Clapp JD, Fagerstrom RM, et al. Reduced lung-cancer
mortality with low-dose computed tomographic screening. N Engl J Med. 2011; 365(5):395–409. Epub2011/07/01. doi: 10.1056/NEJMoa1102873 PMID: 21714641.
2. Aberle DR, Adams AM, Berg CD, Clapp JD, Clingan KL, Gareen IF, et al. Baseline characteristics ofparticipants in the randomized national lung screening trial. Journal of the National Cancer Institute.2010; 102(23):1771–9. doi: 10.1093/jnci/djq434 PMID: 21119104
3. Aberle DR, Berg CD, BlackWC, Church TR, Fagerstrom RM, Galen B, et al. The National Lung Screen-ing Trial: overview and study design. Radiology. 2011; 258(1):243–53. Epub 2010/11/04. doi: 10.1148/radiol.10091808 PMID: 21045183; PubMed Central PMCID: PMC3009383.
4. Carter D, Vazquez M, Flieder DB, Brambilla E, Gazdar A, Noguchi M, et al. Comparison of pathologicfindings of baseline and annual repeat cancers diagnosed on CT screening. Lung Cancer. 2007; 56(2):193–9. Epub 2007/01/24. doi: 10.1016/j.lungcan.2006.12.001 PMID: 17239983.
5. Henschke CI, McCauley DI, Yankelevitz DF, Naidich DP, McGuinness G, Miettinen OS, et al. EarlyLung Cancer Action Project: overall design and findings from baseline screening. Lancet. 1999; 354(9173):99–105. Epub 1999/07/17. doi: 10.1016/S0140-6736(99)06093-6 PMID: 10408484.
6. Wilson DO, Weissfeld JL, Fuhrman CR, Fisher SN, Balogh P, Landreneau RJ, et al. The PittsburghLung Screening Study (PLuSS): outcomes within 3 years of a first computed tomography scan. Am JRespir Crit Care Med. 2008; 178(9):956–61. Epub 2008/07/19. doi: 10.1164/rccm.200802-336OCPMID: 18635890; PubMed Central PMCID: PMC2720144.
7. Aberle DR, DeMello S, Berg CD, BlackWC, Brewer B, Church TR, et al. Results of the two incidencescreenings in the National Lung Screening Trial. N Engl J Med. 2013; 369(10):920–31. Epub 2013/09/06. doi: 10.1056/NEJMoa1208962 PMID: 24004119.
8. Church TR, BlackWC, Aberle DR, Berg CD, Clingan KL, Duan F, et al. Results of initial low-dose com-puted tomographic screening for lung cancer. N Engl J Med. 2013; 368(21):1980–91. Epub 2013/05/24. doi: 10.1056/NEJMoa1209120 PMID: 23697514; PubMed Central PMCID: PMC3762603.
9. Manser R, Lethaby A, Irving LB, Stone C, Byrnes G, Abramson MJ, et al. Screening for lung cancer.Cochrane Database Syst Rev. 2013; doi: 10.1002/14651858.CD001991.pub3. Epub 2013/06/25.PMID: 23794187.
10. Patz EF Jr., Pinsky P, Gatsonis C, Sicks JD, Kramer BS, Tammemagi MC, et al. Overdiagnosis in low-dose computed tomography screening for lung cancer. JAMA Intern Med. 2014; 174(2):269–74. Epub2013/12/11. doi: 10.1001/jamainternmed.2013.12738 PMID: 24322569.
11. National Cancer Institute (NCI) Cancer Data Access System (CDAS). URL at: https://biometry.nci.nih.gov/cdas/.
Lung Cancer Outcomes in the NLST
PLOSONE | DOI:10.1371/journal.pone.0159880 August 10, 2016 17 / 18

12. Patz EF Jr., Greco E, Gatsonis C, Pinsky P, Kramer BS, Aberle DR. Lung cancer incidence and mortal-ity in National Lung Screening Trial participants who underwent low-dose CT prevalence screening: aretrospective cohort analysis of a randomised, multicentre, diagnostic screening trial. Lancet Oncol.2016. doi: 10.1016/S1470-2045(15)00621-X PMID: 27009070.
13. Veronesi G, Maisonneuve P, Rampinelli C, Bertolotti R, Petrella F, Spaggiari L, et al. Computed tomog-raphy screening for lung cancer: Results of ten years of annual screening and validation of cosmos pre-diction model. Lung Cancer. 2013; 82(3):426–30. Epub 2013/10/09. doi: 10.1016/j.lungcan.2013.08.026 PMID: 24099665.
14. Henschke CI, Yankelevitz DF, Libby DM, Pasmantier MW, Smith JP, Miettinen OS. Survival of patientswith stage I lung cancer detected on CT screening. N Engl J Med. 2006; 355(17):1763–71. Epub 2006/10/27. doi: 10.1056/NEJMoa060476 PMID: 17065637.
15. Kondo R, Yoshida K, Kawakami S, Shiina T, Kurai M, Takasuna K, et al. Different efficacy of CT screen-ing for lung cancer according to histological type: analysis of Japanese-smoker cases detected using alow-dose CT screen. Lung Cancer. 2011; 74(3):433–40. Epub 2011/06/15. doi: 10.1016/j.lungcan.2011.05.007 PMID: 21663995.
16. Padda SK, Burt BM, Trakul N, Wakelee HA. Early-stage non-small cell lung cancer: surgery, stereotac-tic radiosurgery, and individualized adjuvant therapy. Semin Oncol. 2014; 41(1):40–56. Epub 2014/02/26. doi: 10.1053/j.seminoncol.2013.12.011 PMID: 24565580.
17. Howington JA, BlumMG, Chang AC, Balekian AA, Murthy SC. Treatment of stage I and II non-smallcell lung cancer: Diagnosis and management of lung cancer, 3rd ed: American College of Chest Physi-cians evidence-based clinical practice guidelines. Chest. 2013; 143(5 Suppl):e278S–313S. Epub2013/05/10. doi: 10.1378/chest.12-2359 PMID: 23649443.
18. Hassanein M, Callison JC, Callaway-Lane C, Aldrich MC, Grogan EL, Massion PP. The state of molec-ular biomarkers for the early detection of lung cancer. Cancer Prev Res (Phila). 2012; 5(8):992–1006.Epub 2012/06/13. doi: 10.1158/1940-6207.CAPR-11-0441 PMID: 22689914; PubMed Central PMCID:PMC3723112.
19. Lambin P, Rios-Velazquez E, Leijenaar R, Carvalho S, van Stiphout RG, Granton P, et al. Radiomics:extracting more information frommedical images using advanced feature analysis. Eur J Cancer. 2012;48(4):441–6. Epub 2012/01/20. doi: 10.1016/j.ejca.2011.11.036 PMID: 22257792.
20. Schabath MB, Massion PP, Thompson ZJ, Eschrich SA, Balagurunathan Y, Goldof D, et al. BehaviorDifferences of Screen-Detected Lung Cancers in the CT Arm of the National Lung Screening Trial(NLST). J Thorac Oncol. 2015; 10(9):S221–S. WOS:000370365100350.
Lung Cancer Outcomes in the NLST
PLOSONE | DOI:10.1371/journal.pone.0159880 August 10, 2016 18 / 18