differences in in-flight unusual attitude …tg.hfes.org/astg/2009 differences in in-flight unusual...
TRANSCRIPT

Page 1 of 20
DIFFERENCES IN IN-FLIGHT UNUSUAL ATTITUDE RECOVERY PERFORMANCE AND WORKLOAD
Valerie J. Gawron1 – General Dynamics
Randall E. Bailey – NASA Langley Research Center
Adam Randall - BOCES
ABSTRACT
A critical use of Primary Flight Displays (PFDs) is Unusual Attitude Recovery (UAR).
Due to cost and safety considerations, very little in-flight data exist for UARs and even less for
UARs in transport category aircraft. This paper describes such UAR performance data.
Specifically as part of an in-flight evaluation of proposed upgrades to the C-141 PFDs, UARs
were performed in the Air Force Total In-Flight Simulator (TIFS) aircraft. The UAR task
consisted of an automatic set-up maneuver followed by manual recovery. Initial conditions
varied from +15 to -20 degrees pitch attitude combined with +45 to -60 degree roll attitude at
1800 or 230 KIAS. The participants were four current C-141 Air Force pilots and two current
Air Force test pilots. Each flew five sorties. The first sortie was for training followed by four
sorties for data collection. The training sortie followed a profile similar to that of a data flight
but the TIFS crew interacted with the participant to ensure that the participant was fully
cognizant of the test conditions, operational test procedures, and the test and data objectives.
Two of the four data flights were used to evaluate one of the display configurations (current
baseline or proposed upgrade). Five years after the initial data collection, the objective data from
the UARs were analyzed using multivariate analysis of variance (MANOVA) as a function UAR
and pilot. The dependent variables were aircraft state during the recovery, reaction times (RTs),
percent correct control inputs, recovery time, pitch controller movement, roll controller
movement, throttle movement, and SWAT ratings. There was a significant effect of pilot on
aircraft state, reaction time, percent correct control inputs, recovery time, pitch control
movement, roll control movement, and SWAT rating. There was a significant UAR effect for
the two nose-high UAR initial conditions: the percent correct of pitch inputs was significantly
less than that exhibited for the nose-low UAR conditions.
INTRODUCTION
Although spatial disorientation has been a causal factor in hundreds of military and
civilian aircraft accidents, very few in-flight studies have been performed in unusual attitude
recovery. Typically, research on spatial disorientation countermeasures, such as display
symbology, has been conducted in simulators (e.g., Beringer, Ball, Brennan, and Taite, 2004;
Guttman, 1986) although there have been several small General Aviation Aircraft flight tests
(e.g., Piper Saratoga used in Poonawalla, Pandya, Kephart, and Braasch, 2006 and a Piper
Cheyenne I Super 500 used in Schiefele, Howland, Maris, and Wipplinger, 2004)
1 The author is now at the MITRE Corporation

METHOD
Participants
There were six participants in this study. The four C-141 line pilots had almost
exclusively C-141-only flight time (1500 to 3000 hours). The C-141 line pilot previous exposure
to glass cockpit displays and "advanced" display systems was minimal. The two test pilots had
the least amount of in-type flight time (< 100 hours) but had comparable flight times (2800 to
3500 hours). Two subjects were Majors (Rank O-4), three were Captains (Rank O-3), and one
was a Lieutenant (Rank O-2).
Test Aircraft
The TIFS was a highly modified C-131 (Convair 580), owned by the US Air Force,
configured as a six degree-of-freedom simulator (Figure 1). General Dynamics (formerly,
Calspan) modified and operated the TIFS aircraft during this data collection period. TIFS had a
separate simulation cockpit forward and below the normal C-131 cockpit. When flown from the
simulation cockpit in the simulation mode, the participant’s control commands were fed as inputs
to onboard computers which calculated the aircraft response to be simulated (in this case, the C-
141 aircraft). These responses, along with TIFS motion sensor signals, were used to generate
feed forward and response error feedback signals in an explicit model-following simulation,
which drove the six controllers on the TIFS. The six TIFS controllers - ailerons, rudder,
elevator, throttle, side force surfaces, and direct lift flaps - provided independent control of all six
degrees-of-freedom. The result was a high-fidelity reproduction of the motion cues at the pilot
position of the simulated aircraft.
Figure 1. USAF Total In-flight Simulator (TIFS) Aircraft
SIDE FORCESURFACES (SFS)
C-131 COCKPIT
SIMULATION COCKPIT
ACCESSTUNNEL
C-131 AC POW ERCONSOLE
SENSOR BOXDLF/SFSCONTROL
BOX
DIRECT LIFTFLAP (DLF)
DIGITALCOMPUTER
SYSTEM
ANALOG ELECTRONICS ANDDIGITAL FLIGHT RECORDER
HYDRAULICCONSOLE
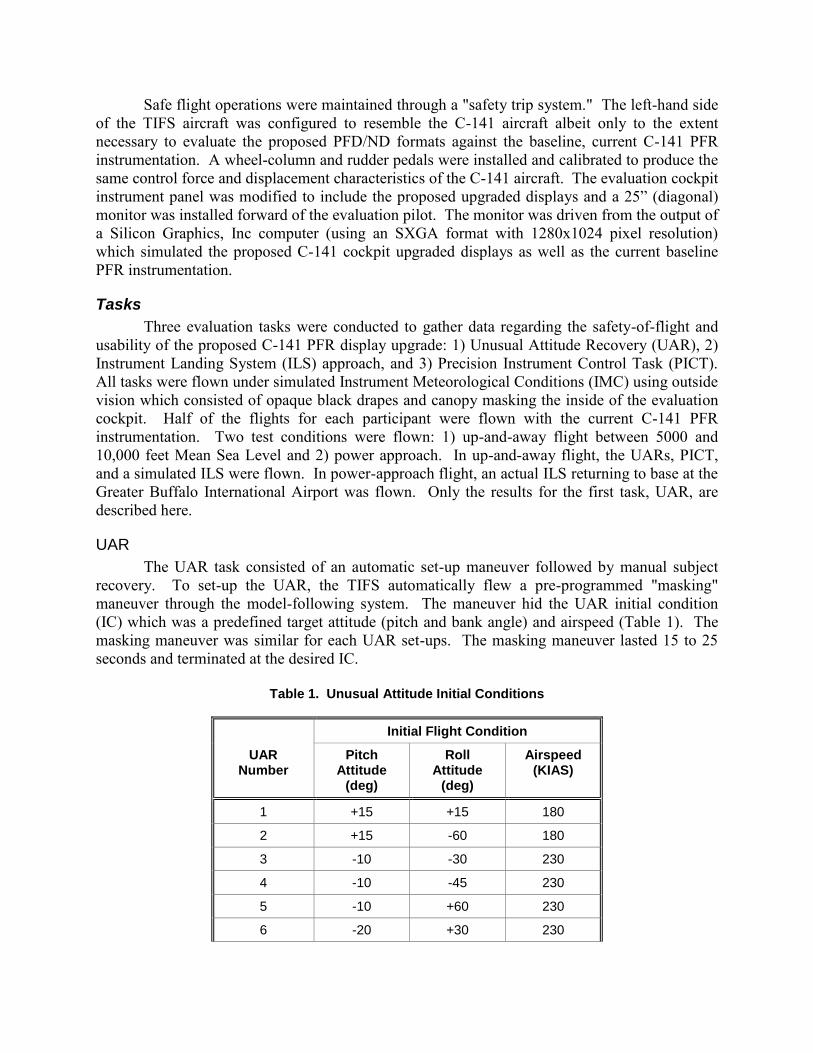
Safe flight operations were maintained through a "safety trip system." The left-hand side
of the TIFS aircraft was configured to resemble the C-141 aircraft albeit only to the extent
necessary to evaluate the proposed PFD/ND formats against the baseline, current C-141 PFR
instrumentation. A wheel-column and rudder pedals were installed and calibrated to produce the
same control force and displacement characteristics of the C-141 aircraft. The evaluation cockpit
instrument panel was modified to include the proposed upgraded displays and a 25” (diagonal)
monitor was installed forward of the evaluation pilot. The monitor was driven from the output of
a Silicon Graphics, Inc computer (using an SXGA format with 1280x1024 pixel resolution)
which simulated the proposed C-141 cockpit upgraded displays as well as the current baseline
PFR instrumentation.
Tasks
Three evaluation tasks were conducted to gather data regarding the safety-of-flight and
usability of the proposed C-141 PFR display upgrade: 1) Unusual Attitude Recovery (UAR), 2)
Instrument Landing System (ILS) approach, and 3) Precision Instrument Control Task (PICT).
All tasks were flown under simulated Instrument Meteorological Conditions (IMC) using outside
vision which consisted of opaque black drapes and canopy masking the inside of the evaluation
cockpit. Half of the flights for each participant were flown with the current C-141 PFR
instrumentation. Two test conditions were flown: 1) up-and-away flight between 5000 and
10,000 feet Mean Sea Level and 2) power approach. In up-and-away flight, the UARs, PICT,
and a simulated ILS were flown. In power-approach flight, an actual ILS returning to base at the
Greater Buffalo International Airport was flown. Only the results for the first task, UAR, are
described here.
UAR
The UAR task consisted of an automatic set-up maneuver followed by manual subject
recovery. To set-up the UAR, the TIFS automatically flew a pre-programmed "masking"
maneuver through the model-following system. The maneuver hid the UAR initial condition
(IC) which was a predefined target attitude (pitch and bank angle) and airspeed (Table 1). The
masking maneuver was similar for each UAR set-ups. The masking maneuver lasted 15 to 25
seconds and terminated at the desired IC.
Table 1. Unusual Attitude Initial Conditions
Initial Flight Condition
UAR Number
Pitch Attitude
(deg)
Roll Attitude
(deg)
Airspeed (KIAS)
1 +15 +15 180
2 +15 -60 180
3 -10 -30 230
4 -10 -45 230
5 -10 +60 230
6 -20 +30 230

Initial Flight Condition
UAR Number
Pitch Attitude
(deg)
Roll Attitude
(deg)
Airspeed (KIAS)
7 -20 +45 230
8 -20 -60 230
To initiate the task, the simulation system was engaged and the participant made a quick
controllability check. Once ready, the participant was told to guard the stick and throttles. The
participant instrument display changed to an all black display with "UAR" printed in the center
to provide a foveal target at the proper focal point. The participant’s controls stayed in their
trimmed, neutral position. Once the IC was reached, the participant's instruments were activated
to the actual flight conditions and a distinctive two-second tone was transmitted over the
intercom, thus, cueing the participant to initiate recovery.
Procedures for the UARs were briefed to each participant. The briefed recovery
procedures were consistent with standard AFM 51-37 procedures. However, since specific
recovery procedures are only generally defined in AFM 51-37 for transport-type aircraft, more
"formalized" recovery procedures were used to support quantitative analysis of UAR inputs. The
participants were trained during ground simulations on these recovery procedures. For nose-high
UARs, the participants were instructed to roll in the shortest direction to 45 degrees of bank,
allow the nose to "slice" to the horizon, and recover to wings level. For nose-low UARs, the
participants were instructed to roll wings-level and "pull" to the horizon. Throttles should be
advanced for nose-high attitude ICs; conversely, throttles should be retarded for nose-low
attitude ICs. The UAR scoring parameters were also briefed. The time to identify the UAR and
initiate correct pitch, roll, and thrust inputs was graded, in addition to the "correctness" of the
recovery inputs. Time to recover to wings-level was not graded so excessive 'g' was not to be
used. Normal acceleration between 1.5 and 2.0 g was expected in the recovery.
Pilot recovery performance for the eight UARs were “scored” (i.e., correct or incorrect)
based on the direction of control input in accordance to the UAR procedures (Table 2).
Determination of UAR "correctness" was made by comparing the control input time histories to
the recovery criteria. After the tone was initiated, the participant’s control inputs (wheel/column
pitch and roll deflection and throttle handle displacement) were examined. Participant’s control
inputs were identified as "significant" if they exceeded threshold values. The threshold values
were: 0.30 inches of pitch controller deflection, 2 degrees of roll controller deflection, and 2
degrees of throttle handle displacement from trim. (Note, full-scale deflection of the controllers
was: +7 inches, -5 inches for pitch, ±90 degrees for roll, and +80 to +29 degrees for throttle.)
The time of these inputs and their direction were noted. When grading the UAR, a "1" signified
a correct input and a "0" signified an incorrect input. For example, if the significant roll input
was in the direction of a left roll in UAR Number 1, the "score" was incorrect (i.e., the
participant initially put in roll control in the wrong direction to recover). Subsequent corrected
inputs were not scored. The UAR was completed once the participant established wings-level
flight with a flight path angle (FPA) of ±5 degrees for 5 seconds.

Table 2. UAR Initial Conditions and Recovery Input Scores
Initial Flight Condition Roll Input Pitch Input Throttle Input
UAR No.
Pitch Att.
(deg)
Roll Att.
(deg)
Air-speed KIAS
Left
None
Right
Fwd
None
Aft
Mil
None
Idle
1 +15 +15 180 0 1 1 1 0 0 1 0 0
2 +15 -60 180 0 1 1 1 0 0 1 0 0
3 -10 -30 230 0 0 1 0 0 1 0 0 1
4 -10 -45 230 0 0 1 0 0 1 0 0 1
5 -10 +60 230 1 0 0 0 0 1 0 0 1
6 -20 +30 230 1 0 0 0 0 1 0 0 1
7 -20 +45 230 1 0 0 0 0 1 0 0 1
8 -20 -60 230 0 0 1 0 0 1 0 0 1
All eight UARs were conducted on each flight. Thus, each UAR was conducted 4 times
by each participant, over the course of the flight test (2 UARs for each display configuration).
For the UAR task analysis, the following objective data were measured:
• pitch, roll, and throttle controller reaction times (i.e., the elapsed time for
controller input to exceed threshold values)
• correct /incorrect score for each controller input (see table 2)
• time to complete the UAR and altitude loss/gain
• shortest reaction time and type
• shortest correct reaction time and type
• control input statistics in the recovery (i.e., mean, variance, standard deviation,
maximum, and minimum values of pitch, roll, and throttle control inputs).
The subjective questionnaire for this task, with bipolar rating scales, was completed
immediately after finishing each UAR.
Training
All participants were trained before flight-testing. This training included: 1) egress
training for the TIFS aircraft; 2) required operations in the TIFS evaluation cockpit (i.e., location
of instrument power switches, operation of intercom, piloting controls, and safety equipment); 3)
familiarity in TIFS operating procedures; and 4) training in the evaluation tasks. All training was
conducted hands-on using the TIFS ground-simulation mode of operation. In this mode, all TIFS
systems were operated as they would in-flight with the primary exception that the TIFS motions
were not present.

Test Procedures
A pre-flight briefing was conducted before each flight. The participants were briefed on
which tasks that they were to accomplish. However, the test conditions were not revealed (e.g.,
the participant was not aware of the UAR ICs). Each participant flew five sorties. The first
sortie was for training followed by four sorties for data collection. The training sortie followed a
profile similar to that of a data flight but the TIFS crew interacted with the participant to ensure
that the participant was fully cognizant of the test conditions, operational test procedures, and the
test and data objectives. Two of the four data flights were used to evaluate one of the display
configurations (current baseline or proposed upgrade). On each sortie, the participant flew four
evaluation tasks during the up-and-away portion. These consisted of two simulated ILS tasks
from the group of condition sets, a UAR task set, and a PICT.
RESULTS
The independent variables for the TIFS flight-testing were the display configuration
(current or proposed C-141 display configuration), flight task, and participant. The test was a
repeated-measures factorial design. Evaluation tasks and display type were counterbalanced to
eliminate training and fatigue effects. Only the results for the UAR task are reported here. The
objective data from the UARs were analyzed using multivariate analysis of variance
(MANOVA) as a function UAR, pilot, and display. Display effects are described in Bailey,
Gawron, and Priest (1994) and Gawron and Bailey (1995). The dependent variables were
aircraft state during the recovery, reaction times (RTs), percent correct control inputs, recovery
time, pitch controller movement, roll controller movement, throttle movement, and SWAT. The
results for each of these types of dependent variables are described in a separate section below.
Aircraft State
There was a significant main effect of pilot (Hotellings T (25, 497) = 0.807, p = 0.000)
for only two of the five aircraft state measures: pitch attitude (p = 0.001) and vertical flight path
angle (p < 0.000) with pilot 1 having the largest negative degrees in both (see Figure 2). The
interaction between UAR and pilot was not significant (Hotellings T (175, 497) = 1.663, p =
0.668).

Figure 2. Effect of Pilot on Aircraft Pitch
Reaction Times
A second MANOVA was calculated for RTs as a function of UAR, pilot, and display.
There was no significant difference for UAR (Hotellings T (35, 407) = 0.218, p = 0.992). There
was a significant effect of pilot, however (Hotellings T (25, 407) = 8.760, p = 0.000) for all five
RTs (p < 0.000 for each). Pilot 1 had the longest pitch RT, Pilot 5 the shortest (see Figure 3).
The same results occurred for roll RT, throttle RT, and fastest correct RT. Pilot 1 had the longest
incorrect RT; Pilot 2 had the shortest. The interaction of UAR and pilot was not significant
(Hotellings T (140, 407) = 5.468, p = 0.000).
-8.00
-7.00
-6.00
-5.00
-4.00
-3.00
-2.00
-1.00
0.00
1 2 3 4 5 6Pilot
Deg
rees
Pitch Attitude
Vertical Flight Path Angle
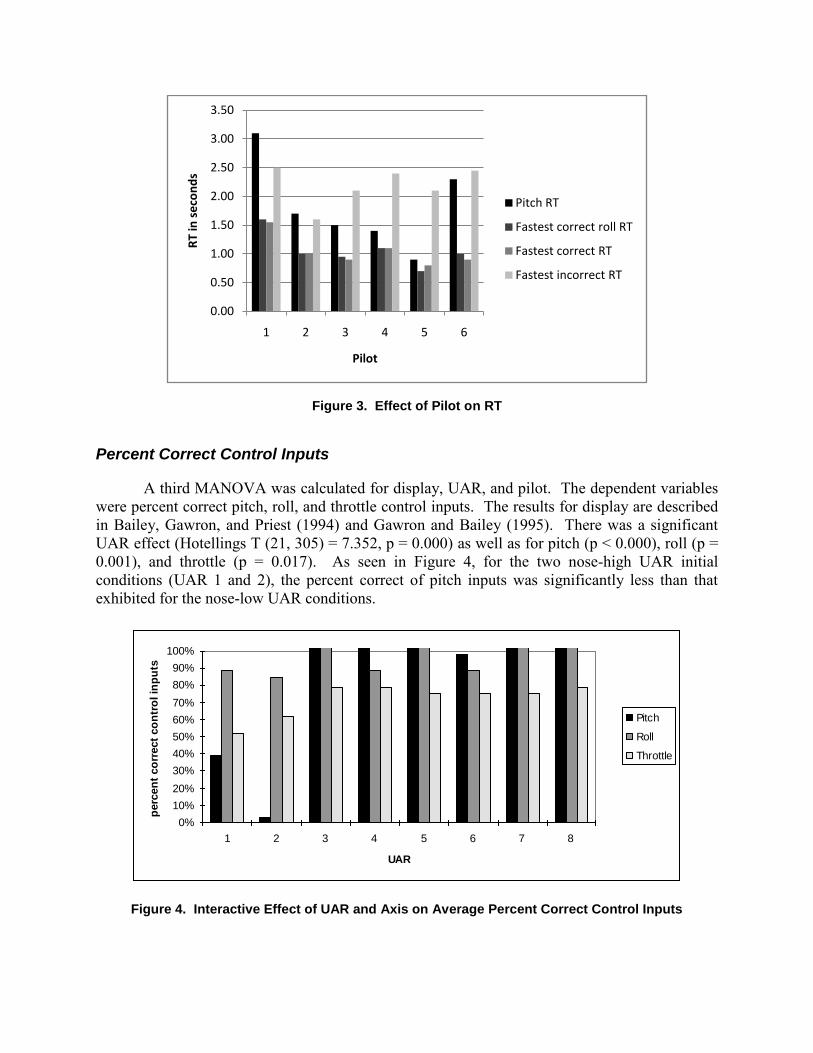
Figure 3. Effect of Pilot on RT
Percent Correct Control Inputs
A third MANOVA was calculated for display, UAR, and pilot. The dependent variables
were percent correct pitch, roll, and throttle control inputs. The results for display are described
in Bailey, Gawron, and Priest (1994) and Gawron and Bailey (1995). There was a significant
UAR effect (Hotellings T (21, 305) = 7.352, p = 0.000) as well as for pitch (p < 0.000), roll (p =
0.001), and throttle (p = 0.017). As seen in Figure 4, for the two nose-high UAR initial
conditions (UAR 1 and 2), the percent correct of pitch inputs was significantly less than that
exhibited for the nose-low UAR conditions.
Figure 4. Interactive Effect of UAR and Axis on Average Percent Correct Control Inputs
0.00
0.50
1.00
1.50
2.00
2.50
3.00
3.50
1 2 3 4 5 6
RT
in s
eco
nd
s
Pilot
Pitch RT
Fastest correct roll RT
Fastest correct RT
Fastest incorrect RT
0%
10%
20%
30%
40%
50%
60%
70%
80%
90%
100%
1 2 3 4 5 6 7 8
UAR
perc
en
t co
rrect
co
ntr
ol in
pu
ts
Pitch
Roll
Throttle
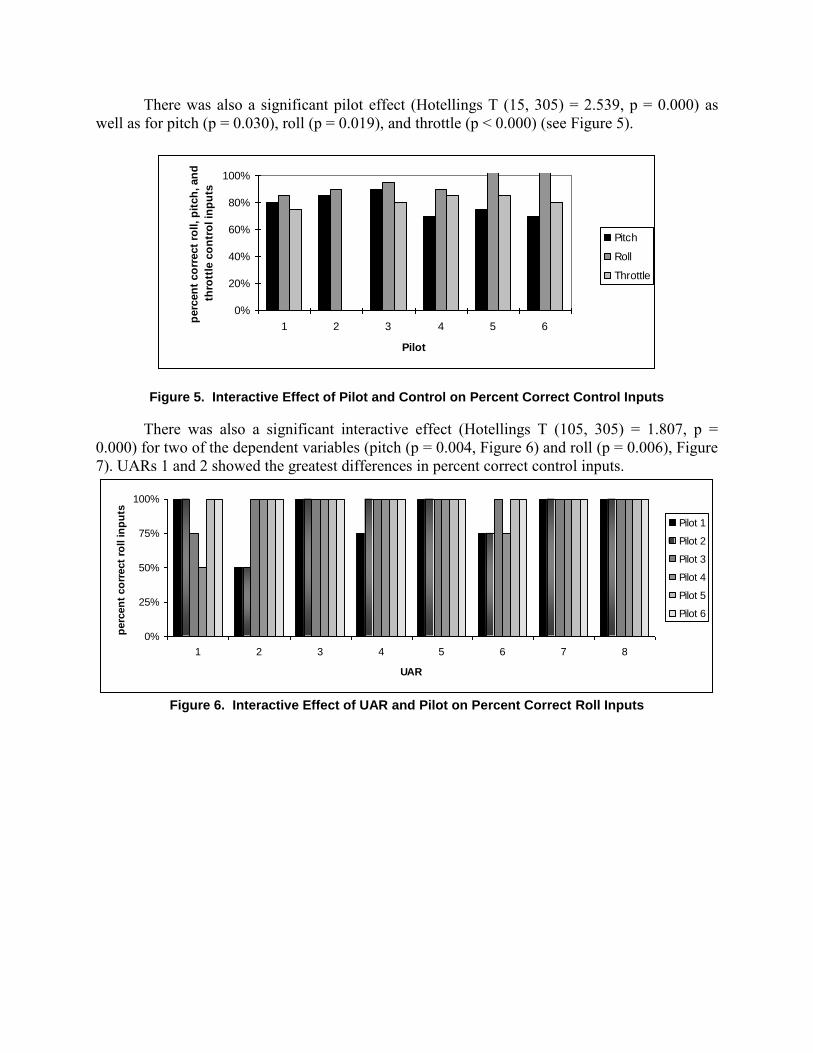
There was also a significant pilot effect (Hotellings T (15, 305) = 2.539, p = 0.000) as
well as for pitch (p = 0.030), roll (p = 0.019), and throttle (p < 0.000) (see Figure 5).
Figure 5. Interactive Effect of Pilot and Control on Percent Correct Control Inputs
There was also a significant interactive effect (Hotellings T (105, 305) = 1.807, p =
0.000) for two of the dependent variables (pitch (p = 0.004, Figure 6) and roll (p = 0.006), Figure
7). UARs 1 and 2 showed the greatest differences in percent correct control inputs.
Figure 6. Interactive Effect of UAR and Pilot on Percent Correct Roll Inputs
0%
20%
40%
60%
80%
100%
1 2 3 4 5 6
Pilot
perc
en
t co
rrect
roll, p
itch
, an
d
thro
ttle
co
ntr
ol in
pu
ts
Pitch
Roll
Throttle
0%
25%
50%
75%
100%
1 2 3 4 5 6 7 8
UAR
perc
en
t co
rrect
roll in
pu
ts
Pilot 1
Pilot 2
Pilot 3
Pilot 4
Pilot 5
Pilot 6

Figure 7. Interactive Effect of UAR and Pilot on Percent Correct Pitch Inputs
Recovery Time
A univariate analysis of variance (ANOVA) was calculated for display, UAR, and pilot
for recovery time. There was no significant main effect for UAR (F (7, 103) = 1.231, p = 0.293).
There was, however, a significant effect of pilot (F (5, 103) = 8.587, p = 0.000) with recovery
times more than twice as long for the slowest pilot than for the fastest pilot (see Figure 8). The
interaction of UAR and pilot was not significant.
Figure 8. Main Effect of Pilot on Recovery Time during UAR
0%
20%
40%
60%
80%
100%
1 2 3 4 5 6 7 8
UAR
perc
en
t co
rrect
pit
ch
in
pu
ts
Pilot 1
Pilot 2
Pilot 3
Pilot 4
Pilot 5
Pilot 6
0
5
10
15
20
25
1 2 3 4 5 6
Pilot
reco
very
tim
e (
seco
nd
s)

Pitch Control Movement
A fourth MANOVA was calculated for pitch control movement as a function of display,
UAR, and pilot. There was a significant UAR effect (Hotellings T (35, 497) = 2.854, p = 0.000)
for all five measures (all p < 0.000 except minimum p = 0.001). However, while the means were
statistically different, they were not practically different and their values were near zero. Hence,
only the maximum, minimum, and variance (see Figure 9) statistics will be discussed as relevant
measures to the UAR task analysis.
Figure 9. Effect of UAR on Maximum and Minimum Pitch Control Movement
There was also a significant effect of pilot (Hotellings T (25, 497) = 2.115, p = 0.000) for
all three relevant dependent variables (maximum and variance p < 0.000, minimum p = 0.006,
see Figure 10).
Figure 10. Main Effect of Pilot on Pitch Control
-1
0
1
2
1 2 3 4 5 6
Pilot
pit
ch
(d
eg
rees)
Minimum
Maximum
Variance
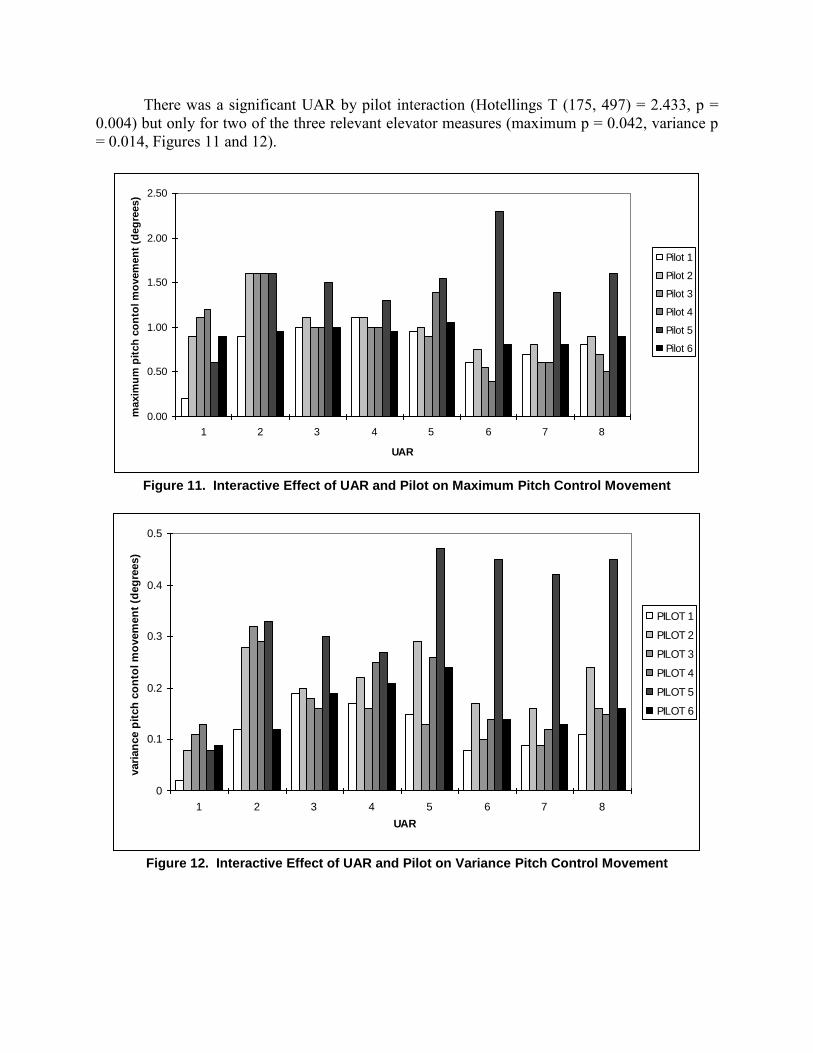
There was a significant UAR by pilot interaction (Hotellings T (175, 497) = 2.433, p =
0.004) but only for two of the three relevant elevator measures (maximum p = 0.042, variance p
= 0.014, Figures 11 and 12).
Figure 11. Interactive Effect of UAR and Pilot on Maximum Pitch Control Movement
Figure 12. Interactive Effect of UAR and Pilot on Variance Pitch Control Movement
0.00
0.50
1.00
1.50
2.00
2.50
1 2 3 4 5 6 7 8
UAR
maxim
um
pit
ch
co
nto
l m
ovem
en
t (d
eg
rees)
Pilot 1
Pilot 2
Pilot 3
Pilot 4
Pilot 5
Pilot 6
0
0.1
0.2
0.3
0.4
0.5
1 2 3 4 5 6 7 8
UAR
vari
an
ce p
itch
co
nto
l m
ovem
en
t (d
eg
rees)
PILOT 1
PILOT 2
PILOT 3
PILOT 4
PILOT 5
PILOT 6

Roll Control Movement
A fifth MANOVA was calculated for roll control measures as a function of display,
UAR, and pilot. There was a significant UAR effect (Hotellings T (35, 492) = 19.822, p =
0.000) for all five measures (p < 0.000). As with the pitch analysis, the means may have been
statistically different, but they were not practically significant so the minimum, maximum, and
variance are shown in Figure 13.
Figure 13. Effect of UAR on Roll Control Movement
There was also a main effect of pilot (Hotellings T (25, 292) = 3.578, p = 0.000;
maximum and variance p < 0.000, minimum p = 0.001, see Figure 14).
Figure 14. Effect of Pilot on Roll Control Movement
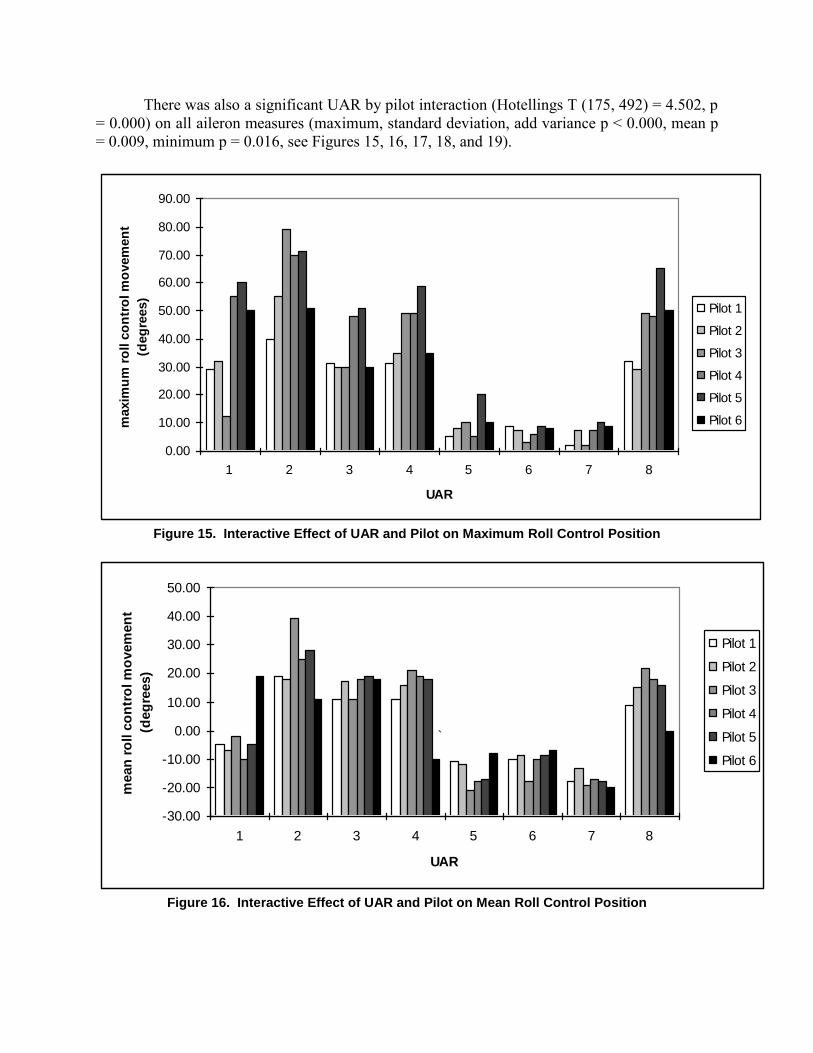
There was also a significant UAR by pilot interaction (Hotellings T (175, 492) = 4.502, p
= 0.000) on all aileron measures (maximum, standard deviation, add variance p < 0.000, mean p
= 0.009, minimum p = 0.016, see Figures 15, 16, 17, 18, and 19).
Figure 15. Interactive Effect of UAR and Pilot on Maximum Roll Control Position
Figure 16. Interactive Effect of UAR and Pilot on Mean Roll Control Position
0.00
10.00
20.00
30.00
40.00
50.00
60.00
70.00
80.00
90.00
1 2 3 4 5 6 7 8
UAR
maxim
um
ro
ll c
on
tro
l m
ovem
en
t
(deg
rees)
Pilot 1
Pilot 2
Pilot 3
Pilot 4
Pilot 5
Pilot 6
-30.00
-20.00
-10.00
0.00
10.00
20.00
30.00
40.00
50.00
1 2 3 4 5 6 7 8
UAR
mean
ro
ll c
on
tro
l m
ovem
en
t
(deg
rees)
Pilot 1
Pilot 2
Pilot 3
Pilot 4
Pilot 5
Pilot 6
`

Figure 17. Interactive Effect of UAR and Pilot on Minimum Roll Control Position
Figure 18. Interactive Effect of UAR and Pilot on Standard Deviation Roll Control Position
-80
-70
-60
-50
-40
-30
-20
-10
0
1 2 3 4 5 6 7 8
UAR
min
imu
m r
oll c
on
tro
l p
osit
ion
(d
eg
rees)
Pilot 1
Pilot 2
Pilot 3
Pilot 4
Pilot 5
Pilot 6
0.00
5.00
10.00
15.00
20.00
25.00
30.00
35.00
40.00
1 2 3 4 5 6 7 8
UAR
sta
nd
ard
devia
tio
n r
oll c
on
tro
l m
ovem
en
t
(deg
rees)
Pilot 1
Pilot 2
Pilot 3
Pilot 4
Pilot 5
Pilot 6

Figure 19. Interactive Effect of UAR and Pilot on Variance Roll Control Position
Throttle Movement
A sixth MANOVA was calculated for throttle position. There was a significant UAR
effect (Hotellings T (35, 647) = 2.411, p = 0.000) for three of the five variables (maximum and
mean p < 0.000, minimum p < 0.003, see Figure 20). There were no other significant effects on
throttle position. Again, the mean values may be statistically different, but they are not
practically significant.
Figure 20. Main Effect of UAR on Throttle Movement
0
200
400
600
800
1000
1200
1 2 3 4 5 6 7 8
UAR
vari
an
ce o
f ro
ll c
on
tro
l m
ovem
en
t
(deg
rees)
Pilot 1
Pilot 2
Pilot 3
Pilot 4
Pilot 5
Pilot 6

SWAT
An ANOVA was calculated for SWAT as a function of display, UAR, and pilot. There
were significant main and interactive effects (see Table 3 and Figure 21).
Table 3. Source Table for SWAT as a Function of UAR and Pilot
Variable Sum of Square DF F P
UAR 5,258.992 7 751.285 0.000
Pilot 48,895.510 5 9,779.102 0.000
UAR x Pilot 8,495.948 35 242.741 0.012
Figure 21. Interactive Effect of UAR and Pilot on SWAT Rating
Discussion
The objective dependent data from the UARs flown in an evaluation of current and
proposed upgraded PFR displays for the C-141 aircraft were analyzed as a function UAR and
pilot, collapsing across display configuration. Display effects are described in Bailey, Gawron,
and Priest (1994) and Gawron and Bailey (1995). These analyses are presented to highlight
differences that can be expected in testing of unusual attitude recovery performance and to
capture lessons-learned.
0
10
20
30
40
50
60
70
1 2 3 4 5 6 7 8
UAR
SW
AT
Pilot 1
Pilot 2
Pilot 3
Pilot 4
Pilot 5
Pilot 6

The dependent variables were aircraft state data during the recovery, reaction times
(RTs), percent correct control inputs, recovery time, pilot control input motion (pitch controller,
roll controller, and throttle movement), and subjective workload (as measured by SWAT).
Aircraft State
Analysis of aircraft state data showed several statistically significant differences.
However, while significant, these data merely quantify the various UAR initial conditions used.
Statistical differences are also shown between pilots but, while statistically different, these
differences are not practically significant. It is critical in UAR testing to: a) include masking
maneuvers and other experimental procedures to limit awareness and foreknowledge of the
ultimate UAR initial condition to prevent data contamination; and b) provide a wide cross-
section of attitudes and aircraft states appropriate to the aircraft class. With these design steps in
place, the analysis of aircraft state data does not provide any indication of unusual attitude
recovery performance as recovery differences, if any manifest themselves in the aircraft state
data, are hidden in the large numerical differences created by the UAR initial conditions.
Attempts to normalize the aircraft state data in an attempt to highlight recovery performance
differences were not tried because of minimal expectations given the typical variations in state
data found in flight testing.
Reaction Time
The analysis of reaction time data showed intuitive results from UAR testing.
Statistically significant individual pilot reaction time differences were found. These individual
pilot differences were consistent across all controllers indicative of consistency in pilot control
technique. Roll control reaction times were the shortest for each pilot since roll control is almost
universally the most critical axis in recovery from unusual attitudes (i.e., the aircraft lift vector
has to be pointed in the correct direction before pitch correction will be effective). Further, no
reaction time differences were noted across UAR conditions; thus, the pilots reacted in the same
manner independent of the initial attitude. This implies that the UAR initial conditions (and the
resulting display depictions) equally conveyed a sense of urgency to recover for the pilots.
Percent Correct Control Inputs
Analysis of percent correct control input data shows results indicative of the test design
and typical of individual piloting differences. The nose-high unusual attitude conditions showed
significantly worse percent correct scores, particularly in pitch, compared to the nose-low
unusual attitude initial conditions. The incorrect scores occurred because the pilots of transport
aircraft were reluctant to use forward pitch inputs and potentially unload the aircraft (which
would upset cargo or passengers). The preferred recovery procedure for the pilots was to use roll
control to enable the aircraft to slice back to the horizon. In hindsight, the recovery scores for
pitch in UAR1 and UAR2 should have probably allowed no pitch input to be scored a “correct”
recovery input. While this was considered before the flight test, subject matter experts in pre-
testing considered “no pitch control input” to be incorrect. In fighter aircraft UAR testing, this
issue is not a problem because correct recovery procedures for fighter aircraft are clear-cut in
that pilots are trained to roll inverted and pull to the horizon.
It may have been possible to achieve better recovery scores by having more severe nose-
high unusual attitudes; that is, given extreme nose high conditions, pilots would be less reluctant

to push over the aircraft (i.e., “unload”) if their energy state was critically depleting, but safety of
flight considerations for this test did not permit higher pitch attitudes than 15 degrees nose-up.
Recovery Time
Analysis of recovery time data showed results indicative of the test design and individual
piloting differences that should be expected. The time to recovery statistically varied between
pilots. Recovery time depended upon the pilot technique each pilot used – some intentionally
overshooting the straight-and-level recovered position to ensure positive recovery. Recovery
time also depended upon their willingness to use significant positive gs in the recovery. Some
pilots were more cautious in using positive gs and did not want to overshoot the desired recovery
g-load whereas others were not as cautious. This pilot attitude was also affected by the UAR
condition and the pilot’s perception of the aircraft energy state and its rate of change. All pilots
were willing to maneuver the aircraft as necessary but often felt a recovery was underway and it
was not necessary to rapidly recover. In pre-flight instructions, the pilots were not instructed to
recover as quickly as possible. The main influence of the primary flight instrumentation design
occurs in the initial unusual attitude recognition and initial recovery response - not in the pilot’s
ability to control the aircraft during the recovery.
The UAR condition also dictated recovery time as the nose-high conditions are
converging toward a recovered energy state; thus, recovery time was rapid whereas the nose-low
conditions are diverging necessitating more time to recovery.
Control Effector Movement
Analysis of pilot pitch control movement data again showed dependency on the pilot and
UAR initial condition. The least severe UAR condition showed the smallest pitch control input
movement statistics although the practical differences for pitch control inputs across pilot and
UAR are minimal. Pitch control was not the critical control axis.
Statistical pilot roll control movement differences are shown for variance across the UAR
initial conditions. Interesting, these data showed that the nose-high UARs exhibit more roll
control movements (higher variance) but this result was a statistically anomaly. The pilots
commented of the critical need to get the roll attitude of the aircraft to the wings-level condition
in the nose-low conditions to effect a proper and quick recovery. Very large and abrupt roll
control inputs were used accordingly. However, the more severe nose-low conditions typically
were of a longer time duration where little roll control input was necessary once the pilots had
rolled to near wings-level conditions; thus, the roll control input variance statistic showed small
numerical values which did not reflect the critical initial responses of the pilot. Capturing these
initial control input responses, rather than using the entire recovery time period should be used in
the future. Individual differences in roll control movement data were expected and were
indicated in the data analysis.
Workload
Analysis of subjective pilot workload data, as measured by SWAT, showed significant
individual pilot differences and differences due to the UAR initial conditions. These data were
not unexpected. The UAR initial conditions elicited different levels of workload for each
individual pilot. Further, the subjective workload varied by individual. Some pilots felt the
UARs required more workload than others. Whether SWAT was the proper measure to capture

the physical and mental stresses associated with unusual attitude recognition and recover was not
tested but should be explored.
References
Bailey, R.E., Gawron, V.J., and Priest, J.E. “Final Report: TIFS/C-141 Display Upgrade
Program,” Calspan Final Report No. 8184-7, September 1994.
Beringer, D.B., Ball, J. D., Brennan, K., and Taite, S. “The Effect of Terrain-Depicting Primary
Gawron, V.J. and Bailey, R.E.: “In-flight Evaluation of the C-141 All-Glass Cockpit,”
Proceedings of the Eighth International Symposium on Aviation Psychology at the Ohio
State University, 80-85, 1995.
Poonawalla, B.J., Pandya, S., Kephart, J., and Braasch, M.S. Flight Test Evaluation of Synthetic
And Peripheral Vision Displays In General Aviation (Paper 1-4244-0378-2). IEEE, 2006.
Schiefele, J., Howland, D., Maris, J., and Wipplinger, P. Human Factors Flight Trial Analysis
for 2D/3D SVS. Proceedings of SPIE Enhanced and Synthetic Vision 2004, Volume
5424, 50 -60.