differences in academic achievement and …libres.uncg.edu/ir/wcu/f/pruett2010.pdf · differences...
TRANSCRIPT

DIFFERENCES IN ACADEMIC ACHIEVEMENT AND ACADEMIC SELF-CONCEPT BASED ON INTELLECTUAL ABILITY, GRADE RETENTION, AND
SPECIAL EDUCATION STATUS
A thesis presented to the faculty of the Graduate School of Western Carolina University in partial fulfillment of the requirements for the degree of Specialist in School
Psychology.
By
Kristin Elizabeth Pruett
Director: Dr. Lori Unruh
Committee Members: Dr. Lori Unruh, Dr. Candace Boan-Lenzo, Dr. John Habel
April 2010

Differences in Academics ii
ACKNOWLEDGEMENTS I would like to thank my committee members and director for their assistance and
encouragement. In particular, I would like to thank Lori Unruh for her constant support
and assistance with numerous revisions and feedback throughout the process. Without
Dr. Unruh’s persistent efforts this thesis would not have been possible.
I also extend sincere thanks to Catherine Cuthbertson for her assistance in data
collection and continued efforts with data collection within her schools. Ms.
Cuthbertson’s research, data collection, and assistance throughout the process provided
pertinent information and support for my thesis. Without Ms. Cuthbertson’s efforts, this
thesis would not have been possible. Lastly, I offer my warmest regards and thanks to
Adam Wooton, my parents, and my church family for their continued support and
encouragement.

Differences in Academics iii
TABLE OF CONTENTS
Page Abstract ............................................................................................................................ 6 Introduction...................................................................................................................... 7 Literature Review............................................................................................................. 8 Borderline Intellectual Ability ............................................................................. 8 Educational Impact of Borderline Intellectual Ability......................................... 8 Academic Difficulties .............................................................................. 8 Risk for Dropping Out ............................................................................. 10 Behavioral Difficulties............................................................................. 11 Risk for Grade Retention ......................................................................... 12 Social and Emotional Difficulties ............................................................ 13 Factors Related to Academic Achievement ......................................................... 14
Relationship Between Placement in Special Education and Academic Achievement ........................................................................... 14 Relationship Between Grade Retention and Academic Achievement ............................................................................................ 18
Factors Related to Self-Concept/Self-Esteem...................................................... 21 Relationship Between Academic Achievement and Self-Esteem/Self-Concept........................................................................ 22 Relationship Between Special Education Placement and Self-Concept/Self-Esteem................................................................................ 24 Relationship Between Retention in Grade and Self-Concept/ Self-Esteem.............................................................................................. 27
Statement of the Problem................................................................................................. 30 Methods............................................................................................................................ 33 Participants........................................................................................................... 33 Measures .......................................................................................................................... 34 School Records ........................................................................................ 34 Multidimensional Self-Concept Scale ..................................................... 35 Basic Achievement Skills Inventory........................................................ 35 Procedures............................................................................................................ 36 Results.............................................................................................................................. 38 Academic Self-Concept and Academic Achievement ......................................... 39 IQ and Academic Self-Concept ........................................................................... 39 IQ and Academic Achievement ........................................................................... 40 Retention and Academic Self-Concept ................................................................ 41 Retention and Academic Achievement ................................................................ 42 Special Education Placement and Self-Concept .................................................. 43 Special Education Placement and Academic Achievement ................................. 44 Discussion ........................................................................................................................ 46 Implications for Achievement and Academic Self-Concept................................ 46 Implications for Special Education Placement .................................................... 47

Differences in Academics iv
Implications for Grade Retention......................................................................... 48 Implications for Future Decisions ....................................................................... 49 Limitations ........................................................................................................... 50 Directions for Future Research ............................................................................ 51 References........................................................................................................................ 53 Appendix A ...................................................................................................................... 59
Differences in Academics v
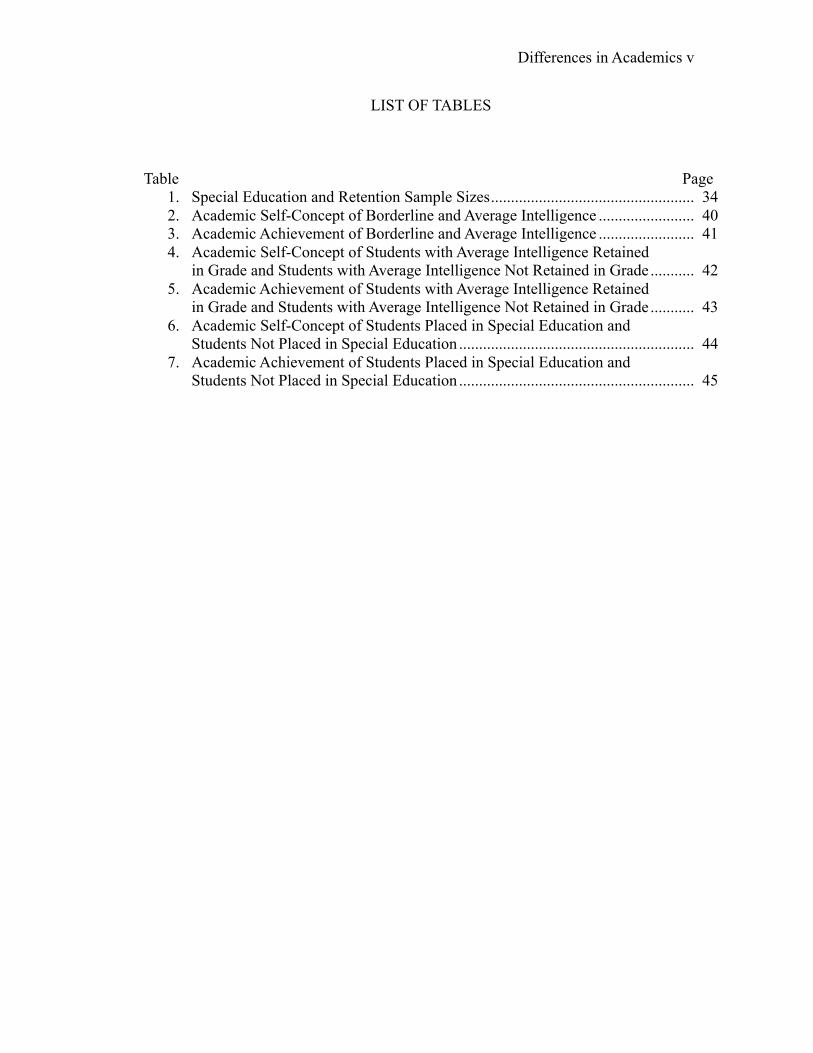
LIST OF TABLES
Table Page 1. Special Education and Retention Sample Sizes................................................... 34 2. Academic Self-Concept of Borderline and Average Intelligence ........................ 40 3. Academic Achievement of Borderline and Average Intelligence ........................ 41 4. Academic Self-Concept of Students with Average Intelligence Retained in Grade and Students with Average Intelligence Not Retained in Grade ........... 42 5. Academic Achievement of Students with Average Intelligence Retained in Grade and Students with Average Intelligence Not Retained in Grade ........... 43 6. Academic Self-Concept of Students Placed in Special Education and Students Not Placed in Special Education ........................................................... 44 7. Academic Achievement of Students Placed in Special Education and Students Not Placed in Special Education ........................................................... 45

Differences in Academics 6
ABSTRACT
DIFFERENCES IN ACADEMIC ACHIEVEMENT & ACADEMIC SELF-CONCEPT
Kristin Elizabeth Pruett
Western Carolina University (April 2010)
Director: Dr. Lori Unruh
There are a variety of factors that may impact a child’s ability to perform
academically and to develop a strong academic self-concept. This study looked at how
intellectual ability, grade retention, and special education placement impact academic
achievement and academic self-concept. Students with borderline intellectual ability (IQ
between 70 and 85) referred for special education assessment and referred students with
an average intellectual ability (IQ between 90 and 110) were administered the
Multidimensional Self-Concept Scale (MSCS: Bracken, 1992) and the Basic
Achievement Skills Inventory (BASI, 2004) in random order. Student records were used
to obtain grade retention and special education information. Pearson correlation and
multiple Independent Samples T-Tests were run to analyze the impact of IQ, Special
Education placement, and grade retention on academic achievement and academic self-
concept. Limitations of the current study and implications for future research will be
discussed.

Differences in Academics 7
Differences in Academic Achievement and Academic Self-Concept Based on Intellectual
Ability, Grade Retention, and Special Education Status
Education is an important aspect of every child's life. There are a variety of
factors that may impact a child's ability to achieve academically and therefore develop a
strong academic self-concept. Some of these factors include intellectual ability,
placement in special education services, and grade retention.
Students with borderline intellectual ability often have different educational
experiences than students with average intellectual ability. Research has shown that
students with borderline intellectual ability struggle in academic settings, which can lead
to negative consequences including limited academic progress and lower self-concept
(Cooter & Cooter 2004; Masi, Marcheschi, & Pfanner 1998). Lower academic
achievement and lower self-concept have also been shown to be factors related to grade
retention and special education placement (Shaw, 2001). Very little research has focused
on the impact of grade retention and special education placement on students with
borderline intellectual ability.

Differences in Academics 8
REVIEW OF LITERATURE
Borderline Intellectual Ability
There are several different terms used to classify students of borderline
intellectual ability, including the term “slow learners” (Shaw, Grimes, & Bulman 2005).
The term borderline intellectual functioning comes from the Diagnostic and Statistical
Manual of Mental Disorders, Fourth Edition, Text Revision, which defines it as an
individual with an IQ in the range of 71-84 (American Psychiatric Association, 2000).
Borderline intellectual functioning is an Axis II V code meaning it is not considered a
mental disorder by the American Psychiatric Association but instead can be used as a
clinical focus (Shaw, Grimes, & Bulman 2005). In the late seventies, Dunlap (1979)
defined slow learners as individuals with an IQ in the range of 70-90. More recently,
psychometrics has been used to define students with borderline intellectual ability, or
slow learners, as having an IQ falling in the range of 70-85 (Cooter & Cooter 2004).
Shaw (2001) noted that the 70-85 IQ range when placed on the normal curve represents
fourteen percent of the population. In comparison twice as many students are diagnosed
with Attention Deficit Hyperactivity Disorder (ADHD) and an equivalent number of
children qualify for special education.
Educational Impact of Borderline Intellectual Ability
Academic difficulties. Students who have been identified as having borderline
intellectual ability or as slow learners often struggle academically. Cooter and Cooter
(2004) raised the concern that the gap that many slow learners fall into is that after
assessment for special education services they fail to meet the criteria for a learning

Differences in Academics 9
disability due to the fact that using a discrepancy model there is usually not a significant
discrepancy between their ability and achievement. In addition, since their IQ is above
70 they are also not eligible for special education services under the category of mental
disability. Instead, these slow learners are placed back into the regular classroom and
expected to perform at a level equivalent to the other average to above average students
in the classroom. This limited ability to perform academically becomes more of a concern
when considering high stakes testing. High stakes testing is a term that is used to
describe end-of-grade tests, or standardized tests administered to students, which have
either significant rewards or sanctions. For many slow learners their performance on high
stakes testing results in failure and grade retention (NCSPA, 2005).
Dunlap’s (1979) research showed that slow learners are often expected to achieve
at a level that is above their intellectual ability without any remedial help. When it comes
to high stakes testing and competency tests, those with an IQ of 70 and below are
considered to have mental retardation and receive special education services. However
the child with an IQ of 71, who does not have a learning disability and receives no special
education services, is expected to pass tests at the same level as a child with an IQ of 100
(Dunlap, 1979).
Shaw (2001) looked at a population of seventy-six slow learners and how they did
on high stakes testing. The results showed that only four percent passed all three
components of the test, eight percent passed two components, and eleven percent passed
one component of the test. This study showed that only a small percentage of slow
learners are actually able to meet the standards of high stakes testing. In addition,
seventy-six percent of slow learners failed all three components of the test.

Differences in Academics 10
Cooter and Cooter (2004) reported that teachers have shown concerns that slow
learners lack an awareness of the future and as a result tend to focus on the tasks at hand
and struggle with their long term planning skills for future assignments or tasks. Along
with having difficulty with long term planning, research has also shown that slow
learners retain less information than the average student (Shuell & Keppel, 1970).
Risk for dropping out. A growing concern in schools today is the increasing rates
of students who drop out of school. Research has shown that of ten factors related to
placing a student at risk for dropping out, such as IQ, reading ability, socioeconomic
class, and average grades obtained were correlated. Many of these factors are applicable
to most if not all slow learners (Thomas, 1954). Manzo (2005) supported these factors by
identifying specific risks found in sixth grade students that would help to predict who
would drop out of school before graduating high school. Students with low attendance
rates, poor behavior, or failing grades in reading and math were identified as having the
most significant risk factors related to which students will graduate and which are more
likely to drop-out.
Research has shown that slow learners are at a greater risk of dropping out. Cassel
(1988) looked at the relationship between rates of drop-out, non-learners, and self-
esteem. The slow learner who has a low self-esteem, with little academic, psychological,
or social support at home or school, has no reason to succeed and for that reason will
drop out. Shaw (2001) found that within his study, seven of the nine slow learners who
turned sixteen during the study dropped out of school. Although the numbers are small,
the ratio of slow learners that dropped out of school suggests that slow learners may be at
a high risk of dropping out.
Differences in Academics 11
Behavioral difficulties. Among other concerns for students identified as slow
learners due to borderline intellectual ability is their tendency to display rule-breaking
behaviors. A few statistics from Shaw (2001) showed that fifty-four percent of the 76
participants in his longitudinal study involving slow learners were sent to the principal’s
office for disciplinary problems, seven percent were expelled for weapons or drug related
crimes on school grounds, and twenty-eight percent were involved in fighting or bullying.
On average both parents and teachers rated slow learners higher on the Behavior
Assessment System for Children (BASC) in measures of aggression, attention problems,
and conduct disorders compared to their same age peers.
Other studies have tried to explain the relationship between disruptive behaviors and
poor academic achievement. Johnson, McGue, and Iacono (2005) developed four
hypotheses:
1. Disruptive behaviors lead to achievement difficulties
2. Achievement difficulties lead to disruptive behaviors
3. Each leads to the other
4. The associations result from underlying common causes.
They found that each of their hypotheses were true for different individuals. Some
students achieved poorly due to their displays of disruptive behaviors and/or inattention.
In other cases disruptive behaviors and inattention were due to low achievement ability.
They recommended that the relationship between achievement difficulties and disruptive
behaviors be considered through more of an ecological perspective: the lack of emotional
support at home, genetics, lack of cognitive stimulation, and school or home
environments.

Differences in Academics 12
Koolhof, Loeber, Wei, and Pardini (2007) conducted a study with four hundred
and twenty-eight participants examining the relationship between delinquent behaviors
and intelligence. The study showed that students with a lower IQ displayed more
delinquent behaviors when compared to students with average to above average IQ.
When delinquents with both high and low IQs were compared, participants with lower
IQs performed more delinquent behaviors more frequently that were more serious and
they displayed more impulsive behaviors than those with a high IQ. Koenen, Caspi,
Moffit, Rijskijk, and Taylor (2006) had a similar study and found that antisocial boys had
an IQ eleven points lower than non-antisocial boys. For boys, lower IQ was predictive of
more antisocial behaviors overtime than boys with a higher IQ. Antisocial girls showed
an average IQ five points lower than non-antisocial girls, but there were not significant
differences between the numbers of antisocial behaviors long term.
Risk for grade retention. There have been several studies that have looked at risk
factors for grade retention, as well as the consequences of grade retention. Shaw (2001)
showed that within his three-year study regarding seventy-six slow learners, forty-seven
percent were retained at least once and sixteen percent were retained twice. Shaw’s
research showed the risks involved for slow learners and grade retention. Because slow
learners have lower academic achievement and often fail to meet standard competency
measures, they are often retained.
Blair (2001) looked at the risk factors for two hundred and twenty African
American students. The research showed that there were many factors that contributed to
the risk of grade retention with low IQ being one of them. However, those children with
a low IQ and a high risk background, defined as having small size at birth, limited

Differences in Academics 13
stimulation at home, low IQ and high externalizing behaviors, were at an increased risk
of being retained. The study separated slow learners into various groups and found that
students with an IQ of 75 were ten times more likely to be retained than a child with an
IQ of 85.
Social and emotional difficulties. Other research has focused on the relationship
between low IQ and social desirability. Crandall (1966) looked at social desirability in
relation to several different traits, including IQ. Crandall administered the Children’s
Social Desirability scale to seventy-six tenth grade students and one month later gave the
California Psychological Inventory. Results showed that students with low IQ had social
desirability rates of three and four; which were the two lowest ratings given to students.
Shaw (2001) looked at teacher opinions of slow learners. Teachers were asked to
give five words that described slow learners. Ninety-seven percent described slow
learners as being unmotivated, fifty-six percent described them as being the most difficult
to teach, eighty percent reported that they spend less time engaging slow learners than
high functioning students in their classrooms, and seventy-two percent reported that
working with high achievers is more rewarding than working with slow learners. This
study showed that not only are slow learners having trouble socially with their peers but
teachers have a more negative perception.
Among other concerns for students with borderline intellectual ability is increased
risk for development of low self-esteem/self-concept. Students with borderline
intellectual ability struggle academically, which can create a weak self-perception and
over time lower their self-esteem and increase feelings of inadequacy (Masi, et. al 1998).

Differences in Academics 14
Alves-Martins, Peixoto, Gouveia-Pereira, Amaral, and Pedro (2002) looked at
self-concept and its relationship to academic achievement. The purpose of their study
was to look at what strategies are used to protect self-esteem when a student faces
negative consequences in school. There were eight hundred and thirty-eight participants
in seventh, eight, and ninth grade classes ranging in age from thirteen to nineteen years
old with an average age of fourteen. This study was conducted in Portugal. Alves-
Martins et al. used a multidimensional model to look at self-concept and obtained both
global and academic self-concept measurements. Their results showed that there were
significant differences shown within the self-concept of seventh grade students. Alves-
Martins et al. concluded that academic results play a vital role in the self-concept of
younger adolescents. Their study also showed that low achieving students scored
significantly lower than high achieving students in school competence and behavior
domains. This research supports the notion that slow learners will have a lower academic
self-concept than average achieving students
Factors Related to Academic Achievement
New federal laws, such as No Child Left Behind, have emphasized the academic
success of all students (Shaw, Grimes, & Bulman 2005). Because of the focus on all
students, the new federal laws also apply to students in special education. This raises
concerns in regards to the academic achievement of slow learners and grade retention.
Research has shown that while retention is often used as an intervention, it is not
effective and some students show declines in their achievement (Silberglitt, Jimerson,
Burns, & Appleton 2006).

Differences in Academics 15
Relationship between placement in special education and academic achievement.
Pijl and Pijl (1998) conducted a meta-analysis of research that compared students in
regular education to students who had been placed in special education. The special
education students included in this study were classified as having a learning disability or
as having mild mental retardation. The meta-analysis was done because of concerns many
parents had about placing their students in segregated settings and teachers’ concern of
having students who qualified for special education in their regular classroom. The
results showed that the major difference between students in regular education settings
and students in special education settings was academic achievement as well as overall
IQ scores. There were considerably lower average IQ scores seen in students classified
as educable mentally retarded when compared to students with a learning disability. This
was explained by the emphasis on IQ as a determining factor for special education
placement. Therefore because IQ is used to determine placement into special education
Pijl and Pijl (1998) concluded that IQ and academic achievement are strongly correlated.
They also advocated that the majority of students with learning disabilities would be able
to succeed in the regular classroom with some help better than a secluded setting.
However the students identified as educable mentally retarded would more than likely
struggle to succeed in the regular classroom at a level that could even be compared to
students of average intelligence and would show greater achievement being placed in a
special education setting.
Other research has focused solely on the academic achievement of students in
special education. Hanushek et al. (2002) did a longitudinal study that looked at the
effects of special education programs on students in fifth grade. Hanushek et al. used a
Differences in Academics 16
population of seven hundred and sixty-seven thousand, seven hundred and sixty three
students in Texas and looked at achievement based on disability type in three consecutive
fifth grade cohorts. The types of disabilities that were considered included learning
disabilities, speech impairments, and emotional disturbances. Each student in the study
took the Texas Assessment of Academic Skills (TAAS) each spring, which determined
mastery of grade requirements. The results showed that special education had a positive
effect on student’s academic achievement. The study found that with one year of special
education services the achievement gap can be closed by three to four percentile points
which is approximately one-tenth of the average achievement gap between students in
special education and regular education.
Student placement has been shown to be an important concern. Freeman (2000)
conducted a meta-analysis on the research concerning academic achievement with
regards to several different placement types. The first comparison made looked at
achievement between children with mental retardation and children who did not have
mental retardation. Both groups of students were in the general education classroom. The
results showed that children with mental retardation performed at a lower level. The
second comparison looked specifically at students with mental retardation in special
education placement compared to students with mental retardation in the regular
classroom. The meta-analysis showed there was a more positive effect on achievement in
students in the regular classroom. Given these results Freeman looked more specifically
at the placement in regular education as being either full inclusion or only being included
in the regular classroom for part of the day. Results showed that students with mental

Differences in Academics 17
retardation achieve higher the more they are integrated into the regular classroom rather
than segregated in a special education class.
Belmont and Belmont (1980) conducted a study to compare slow learners and
students with a learning disability. They looked at the differences between students who
fail longitudinally and students who just showed short-term cognitive delays through
three different studies. By compiling the results of the three studies, they looked at
student reading achievement from kindergarten to sixth grade and found that there were
four different categories that slow learners and students with a learning disability could
be placed into, including, 1) students who show chronic failure, 2) students who perform
poorly early but later show improvement, 3) students who achieved early and failed later
and, 4) students who showed achievement fluctuations throughout elementary school
between failing and average achievement. Based off of these four categories, they
concluded that the same intervention or special education program is not going to be
effective for every student and that the students who chronically fail, the slow learners,
often need constant and long term assistance in the classroom.
Contrary to the aforementioned research, other researchers have focused on the
ineffectiveness of special education programs. There are some that view special
education settings as a “dumping ground for kids deemed ‘unteachable’” and that
inclusion is the only option. Inclusion advocates describe the perception of teachers
towards children with severe mental retardation to be the least teachable (Lipsky &
Gartner, 1987). These advocates against special education view the services as a way for
schools to obtain more money and for parents to lobby for their children to receive
special services.

Differences in Academics 18
Other findings showed that resource rooms were more effective than regular
classrooms for making gains in academic achievement for students identified as educable
mentally retarded. However, students who were close in achievement to students within
the regular setting, benefited more from being in the regular setting (Madden & Slavin,
1983). Their research was inconclusive regarding the effectiveness of students in both
resource and regular settings; however, it was stated the effectiveness would depend
largely on the programs being used.
Relationship between grade retention and academic achievement. In the past
decade there have been a lot of changes regarding the federal education laws. No Child
Left Behind has required high-stakes tests, named after their significant rewards or
consequences, be given in order to hold school districts, teachers, and students
accountable for improved academic achievement. Often these high-stakes tests are used
as a single criterion to determine grade retention (NCSPA, 2005). Retention is often used
as an intervention method in order to prevent future failure (Silberglitt et al., 2006). It has
been argued that high-stakes tests are not a good measure of student’s academic
achievement and should therefore not be the only criterion to consider when determining
grade retention (NCSPA, 2001).
Daniel Safer (1986) conducted a study that looked at the risks of grade retention
in elementary school as well as middle school. Safer used data obtained from the
cumulative folders of two hundred eighth and ninth grade students looking at academic,
socio-emotional, and behavioral information. His study showed that most students
retained in elementary school had a below average IQ with low academic achievement
whereas the retention of students in middle school was mostly due to classroom

Differences in Academics 19
misconduct and absenteeism. Safer also discussed within his article the research findings
that with one elementary school grade retention, the risk of that student being retained in
middle school increases fivefold. With increased rates of grade retention, the risk of a
student dropping out before he or she graduates high school increases as well.
Silberglitt et al. (2006) investigated the effects of grade retention on reading
performance. This study included one hundred and forty-seven students in first through
eighth grade enrolled in schools across Minnesota. His study emphasized using a control
group and randomly selected participants. Participants were in one of three groups,
which included retained, promoted, and a randomly selected control group. Within the
group of students who had been retained, he looked at the achievement the year following
retention, as well as the longitudinal academic achievement of retained students
compared to the promoted and control group. The results showed that the year following
retention the students who had been retained made academic gains. This was attributed
to the fact that the students were already starting at a higher point than at the beginning of
the year before and therefore were going to gain after an extra year within the same
grade. For this group of students retention was used as an intervention method in order to
improve achievement; however when he looked at the rate of growth from year one to
year two there were no differences and concluded that retention was not an effective
intervention in order to improve academic achievement. Over an eight-year period he
found that there was not a significant difference in overall achievement between the
retained students and the promoted students. However in the seventh and eighth year the
retained students began to show a decrease in academic achievement while promoted
students continued to make consistent progress. These results show that a more

Differences in Academics 20
longitudinal study should be conducted to look at the effects of early grade retention on
the academic achievement in high school.
Other research completed by Silberglitt et al. (2006) looked at whether the timing
of grade retention made a difference in academic achievement. This study included
forty-nine students in kindergarten through eighth grade, half who were retained early on
in grades kindergarten to second, and the other half in grades third to fifth. Reading
curriculum-based measures were used in order to determine achievement of retained
students. The results showed that over the eight-year period there were slight differences
in students who were retained early compared to students who were retained later;
however the difference was not significant. Therefore, one can conclude that early
retention is not any more or less effective than retention later on during a student's
academic career.
Bowman (2005) looked at a compilation of research that examined whether grade
retention was a help or hindrance to student’s academic success. Factors of grade
retention that were examined included different policies, the cost of retention, the effect
of increased academic standards and alternatives to retention. Bowman found that
researchers who oppose retention, base their opposition on the cost of retention, including
financial, academic, and self-esteem. Concerning academic achievement, Bowman found
that over a period of two to three years, student achievement was not any better when
compared to their academic achievement when they were first retained. In fact, their
academic outcomes were poorer than their peers in the general population who qualified
to be retained but were not.

Differences in Academics 21
Lenarduzzi and McLaughlin (1992) conducted a study that looked at the
longitudinal effects of non-promotion, also known as retention, on academic achievement
and attendance. Their study included eighteen students, seven in a control group
(promoted), and eleven in the experimental group (non-promoted). All students were
tracked through both their middle and high school years. The results showed that there
were no significant differences between the two groups in both grade point average and
attendance. The mean grade point average across both groups decreased from 1.23 to .66
in four years. The average number of days absent across both groups increased from
approximately fifteen days to one hundred and four. However given that thirty-six
percent of the students who were promoted and forty-two percent of the students not
promoted dropped out before the end of the study, the results were skewed.
Factors Related to Self-concept/Self-Esteem
Self-concept has been defined as how much people value themselves (Baumeister,
Campbell, Krueger, & Vohs 2003). Bracken (1992) defined self-concept according to
seven different features (Shavelson, Hubner, & Stanton, 1976). The first is organization.
Bracken views organization as the conceptualization one has of his or her successes and
failures, which reinforce his or her behaviors. The second feature of self-concept is its
multifaceted nature. He described self-concept as having six domains that represent an
individual’s life: social, competence, affect, academic, family, and physical. These six
domains overlap and are interrelated because they affect each other. It is these six
domains that are combined together to obtain the global self-concept. The third feature of
self-concept Bracken emphasized was the hierarchical structure followed by stability.
Because of the organization and multidimensional model, self-concept is seen as being

Differences in Academics 22
relatively stable and can only be changed gradually over time. Self-concept also has a
developmental characteristic to it. A young child most likely has not been exposed to as
many environments and concepts as someone who is eighteen. This means that a young
child's domain specific self-concepts have a tendency to be more consistent with each
other than someone who is 18. As children are gradually exposed to new environments
they are better able to differentiate between the specific domains. The evaluative nature
of the scale helps to define self-concept due to the individuals evaluation based on their
perception of themselves as well as how an individual feels that other perceive them in
varying environments. Thus, Bracken defines self-concept as:
A multidimensional and context dependent learned behavioral pattern that reflects
an individual’s evaluation of past behaviors and experiences, influences an
individual’s current behaviors, and predicts an individual’s future behaviors…and
is an interactive environmental-behavioral construct that is organized according to
behavioral principles. (Bracken, 1992, p. 10)
History has shown that the study of self-concept has varied and poses several problems.
Some of these problems include the fluctuation of scores with age, as well as the
differences seen between genders on different domains. For example, the physical
domain has a tendency to be higher for boys than girls (Bracken, 1992, Wilson, 1998).
However, Bracken’s definition was an attempt to alleviate many of those concerns.
Research often uses self-concept and self-esteem interchangeably; however, self-
esteem and self-concept measures can be very different constructs. Manning, Bear, and
Minke (2006) examined the differences between self-esteem and self-concept and said
that self-esteem is a measure of an individual’s overall global self-worth. In comparison,

Differences in Academics 23
self-concept refers to both a global self-worth as well as specific domains. While the
global self-concept of a child is psychometrically similar to self-esteem, the specific
domains give a more complex and detailed understanding of the obtained scores.
(Manning et al., 2006)
Relationship between academic achievement and self-esteem/self-concept.
Baumeister (2003) completed a meta-analysis of the research on self-esteem looking at
whether or not high self-esteem causes better performance, success, happiness, and
health. Concerning school performance, Baumeister found that high and/or low self-
esteem does not have a cause and effect relationship with school achievement. Most
studies use a global measurement of self-esteem, which includes many different facets,
not just academic achievement (Manning et al., 2006). When global self-esteem was
correlated with academic achievement there was a very weak correlation; however, when
self- concepts in specific domains were correlated with academic achievement in the
same domain, there was a higher correlation (Baumeister, 2003). This study showed that
global self-esteem is not correlated with academic achievement. Academic achievement
can increase self-esteem but there is a weak correlation between the two. However when
the research within the meta-analysis used academic self-concept rather than a global
self-esteem measure the results showed that academic self-concept and academic
achievement had a stronger correlation.
A study was conducted looking at the self-perceptions of four hundred and twenty
four students in third through the sixth grade with IQs in the average range (Leondari,
1993). The students were placed into one of three groups. The first group consisted of
students who were classified as being in special education and were pulled out for special

Differences in Academics 24
classes part of the day and the last two groups were students in the regular classroom who
were split into low achieving and high achieving based on teacher responses. Each
student was given the Perceived Competence Scale for Children. The results of
Leondari’s research showed that the students pulled out for the special classes had lower
academic self-concepts as well as a lower overall global self-concept when compared to
the other low achieving and high achieving groups within the study.
Curtis and Shaver (2001) conducted research on improving slow learners self-
esteem. This study’s purpose was to show that improving self-esteem would enhance a
student’s learning of knowledge and concepts. There were two hundred and twenty-five
participants who ranged in age from fifteen to twenty-one from British Columbia,
Canada. The study hypothesized that by providing positive feedback during difficult
tasks the students would have a better self-esteem and in return desire to do better and
improve academic achievement, specifically in social studies for this study. While in this
particular research design improvements in self-esteem were shown, there is also research
that shows there is not a direct link between global self-esteem and academic
achievement (Kloomok and Cosden, 1994, Leondari, 1993).
Relationship between special education placement and self-concept/self-esteem.
Several different studies have looked at the relationship between self-concept/self-esteem
and students placed in special education. Beck, Roblee, and Hanson (1982) used the
Piers Harris Self-concept scale to look at the self-concept of students placed in special
education compared to students in regular education. The Piers Harris Self-concept scale
provides a global self-concept score as well as six domain specific self-concept scores.
The results of this study showed that there were no significant differences among both the

Differences in Academics 25
global and domain specific self-concepts of students in special education compared to
those in regular education.
Contrary to the aforementioned research, Stone and May (2002) studied the
accuracy of self-evaluation ratings among students with learning disabilities based off of
a comparison between scores obtained from the MSCS, and a skills rating survey. There
were fifty-two participants with a learning disability and forty-nine students who did not
have a learning disability. Each student was asked to complete a “Skills Rating Survey”
in the academic domains as well as the Multidimensional Self-Concept Scale. Academic
self-concept scores were collected on each student from both assessment instruments.
The results showed that students with a learning disability had lower academic self-
concepts than their peers without a learning disability on both assessment instruments but
the differences on global self-concept scores were not significantly different between
students with a learning disability and students without a learning disability. The results
also showed that despite having a lower academic self-concept when compared to
students without a learning disability, the mean academic self-concept score for students
with a learning disability was in the average range.
Bear, Minke, and Manning (2002) conducted a meta-analysis in order to look at
the self-concept of students with learning disabilities. The analysis included sixty-one
studies that included a total of three thousand, five hundred and twenty-three students
with learning disabilities and two thousand, two hundred and eighty-eight students with
average achievement who did not have a learning disability. Of the students with
learning disabilities involved within the studies, sixty point one percent were male and
twenty-six point three percent were female. The results showed students with learning

Differences in Academics 26
disabilities had an academic self-concept that was lower than students who did not have a
learning disability. Bear et al. also looked at the differences within self-concept of
students based on grade level as well as gender. The results showed that there were no
significant differences between both gender and grade level when looking at students
who have learning disabilities. Their research supports the previously mentioned research
of Stone and May.
Other research has also shown that the self-concept of students in special
education is lower than students in regular education. Cambra and Silvestre (2003) found
these results when looking at a group of two hundred and sixty students in a Barcelona
school designed to emphasize the integration of students with special needs into the
regular classroom. The results showed that the global self-concept of the special needs
student was not any different than the global self-concept of students in regular
education.
Wiener and Tardif (2004) looked at the academic self-concept of students placed
in special education. There were one hundred and seventeen students in fourth through
eighth grade that had been identified as having a learning disability near Toronto, Canada.
Wiener and Tardif found that students with a learning disability had an academic self-
concept lower than that of the average achieving student. They also found that within the
sample of students in special education, students who were in inclusive settings fared
better and had higher academic self-concepts when compared to special education
students in resource rooms.
Other research has also looked at the differences between global and academic
self-concepts of students with learning disabilities. Kloomok and Cosden (1994) looked

Differences in Academics 27
at what factors provided a more positive global and academic self-concept in students
with a learning disability based on social support scales and importance ratings. The
importance ratings measured how important students felt specific academic areas were to
telling them how they felt about themselves. There were seventy-two students who
participated in the study from two southern California school districts. Each student had
been identified as having a learning disability, which was defined as a severe discrepancy
between intellectual ability and achievement ability. After administering the “What I am
Like,” instrument students were placed into one of three groups based on their global and
academic concept scales. Those three groups included having a high global self-concept
with a low academic self-concept, a high global self-concept with a high academic self-
concept, and a low global self-concept with a low academic self-concept. Kloomok and
Cosden (1994) found that the majority of the students tested with learning disabilities had
a high global self-concept and a low academic self-concept. The three most significant
predictors of global self-concept were perceptions about one’s physical appearance,
perceptions about social acceptability, and perceived social support. The students with
both low global and low academic self-concepts perceived themselves as having the least
amount of support from both teachers and parents, while students with both high global
and high academic self-concepts perceived themselves as having the greatest social
support from teachers and parents.
Ribner (1978) looked at the self-concept of six hundred and thirteen students in
New York City who had been placed in special classes for the minimally brain damaged
and compared them to students in regular education classes who had been referred or
qualified to be in the special classes for minimally brain damaged students. Each student

Differences in Academics 28
took a self-concept survey that looked at both school related and general competency
issues. The results showed that students in the special classes for the minimally brain
damaged scored higher on self-concepts in school related areas than the students not in
the minimally brain damaged classes. Overall, Ribner (1978) concluded that special class
placement has a positive effect on minimally brain damaged student’s academic self-
concept when compared to students who qualify for minimally brain damaged placement.
Relationship between retention in grade and self-concept/self-esteem. As
previous research has already shown, students with borderline intellectual ability are at an
increased risk of grade retention. Pomplun (1988) conducted a study looking at whether
retention was better if done during elementary school or later within a student's
education. Within the measures used was a self-concept and motivation inventory. There
were forty-seven total students from first, second, third, fourth, seventh, and eighth grade
classes. The study was completed in a school system in Florida. The study lasted two
years and one of the variables observed was the change in self-concept of the students
involved. The students were split into one of three groups based on grade: primary which
included the first and second grade students, intermediate which included the third and
fourth grade students, and secondary which included the seventh and eighth grade
students. Within each of the three groups students were placed into one of two
experimental groups or a control group. The first were students who were retained before
the study had begun, second the students who were on a list to be retained but eventually
passed on to the next grade, and third the control group which included students who had
never been retained and had never been on the list to be retained. The results showed that
the students in the primary level retained group had a stable self-concept over the two
Differences in Academics 29
year period. However, the students at the intermediate level who were in both the
borderline and retained group showed a steady decrease in self-concept over the two year
period while the control group did not show any. The secondary level borderline and
retained group also showed decreases in self-concept over the two year period. These
results show that grade retention has a significant effect on students' self-concept over
time.
Holmes and Matthews (1984) conducted a meta-analysis on the effects of grade
retention in elementary and junior high school students. Self-concept was used as a
dependent variable in nine of the studies evaluated. The results supported the previously
mentioned research (Pomplun, 1988) and showed that students who have been retained
had a significantly lower self-concept than students who had been promoted to the next
grade.
Within the aforementioned research, there are still numerous questions regarding
students with borderline IQ, as well as the impact of special education placement, grade
retention and IQ on student’s academic achievement and academic self-concept. Despite
continued efforts to understand how decisions made at school affect children, there are
still many questions.

Differences in Academics 30
STATEMENT OF THE PROBLEM
Research has provided some evidence that academic achievement is related to
academic self-concept with students who have higher levels of academic achievement
also demonstrating higher academic self-concept. In addition, there has been research
focusing on the impact of grade retention and special education placement on the self-
concept and academic achievement (Baumeister, 2003; Bear, Minke & Manning, 2002;
Pijl, 1998), but very little research on how intellectual ability impacts both academic
achievement as well as academic self-concept. Most of the research on academic ablity
and academic self-concept has involved children with average intellectual ability.
With the exception of one article (Beck, Roblee, & Hanson,1982), the research
has shown that students in special education settings have a lower academic self-concept
when compared to students in the regular education setting (Bear, Minke & Manning,
2002; Stone & May, 2002; Weiner & Tardif, 2004). However, Ribner (1978) showed that
when students with minimal brain damage and low academic achievement were
compared in different settings, the students in the special education setting had higher
academic self-concepts. It was hypothesized that the special education setting functions
as an intervention for the student's self-concept.
Some of the variance seen in the research on self-concept in special education
students is related to whether a self-esteem scale or a multidimensional self-concept scale
was used. Baumiester (2003) showed that within his meta-analysis when academic self-
concept was used as a variable rather than global self-esteem, the correlation between
self-concept and academic achievement was stronger. Given the variance in the use of

Differences in Academics 31
self-concept and self-esteem in the research, it is difficult to make conclusive arguments
concerning the academic self-concepts of students with borderline intellectual ability.
When making decisions about a child’s educational services, it is imperative that
we understand how intellectual ability, grade retention, and special education placement
are related to academic achievement and academic self-concept. This study adds to the
research regarding these relationships.
The following hypotheses were tested in this study:
1. Academic self-concept will be lower for those students with lower academic
achievement than for those students with higher academic achievement.
2. Academic self-concept for those students with borderline intellectual ability will
be lower than for those students with average intellectual ability.
3. Academic achievement for those students with borderline intellectual ability will
be lower than for those students with average intellectual ability.
4. Academic self-concept for those students who have been retained in grade will be
lower than for those students who have not been retained in grade.
5. Academic achievement for those students who have been retained in grade will be
lower than for those students who have not been retained in grade.
In addition, the following research questions were examined in this study:
1. Is academic self-concept for those students who have been placed in special
education lower than for those students who have not been placed in special
education?

Differences in Academics 32
2. Is academic achievement for those students who have been placed in special
education lower than for those students who have not been placed in special
education when not considering intelligence?
3. Is academic achievement for those students with an average IQ who have been
retained lower than for those students with an average IQ who have not been
retained?
4. Is academic self-concept for those students with an average IQ who have been
retained lower than for those students with an average IQ who have not been
retained?
5. Is the BASI measure of academic achievement a good predictor of academic self-
concept?

Differences in Academics 33
METHOD
Participants
Participants included twenty-seven students in grades fifth through twelfth at
three different schools in a small Western North Carolina School District (17 male, 10
female). The sample included 1 fifth-grader, 7 sixth-graders, 2 seventh graders, 3
freshman, 9 sophomores, 1 junior, 2 seniors, and 2 high school participants who did not
report their specific grade level. Each participant had previously been referred for an
evaluation to determine if he or she was eligible to receive special education services
indicating that at some point all of these participants had experienced some level of
academic difficulty. However, not all of these participants had been found to be eligible
for special education services.
The participants selected for this study were initially selected based on their level
of intelligence. Students with borderline intellectual ability were defined as those having
an IQ in the range of 70-85, and students with average intellectual ability were defined as
those having an IQ in the range of 90-110. The sample included eleven students with
borderline intellectual ability. These students had intelligence quotients ranging from 70
to 85 with a mean of 77.18 and standard deviation of 5.13. Chi-square analyses were
analyzed to determine if there is a relationship between age and whether or not a student
is categorized as borderline intelligence or average intelligence. Analyses indicated that
the results are not significant. Results did indicate that the minimum expected cell
frequency assumption was not met, resulting from a small sample size. Sixteen students
with average intellectual ability were included in the study with intelligence quotients

Differences in Academics 34
ranging from 90 to 107 and a mean of 98.94, and standard deviation of 5.72. The small
sample size obtained prevented the examiner from completing specific comparisons
between these two groups that had initially been planned. The comparison between the
two identified groups of borderline and average students excluded the involvement of
students with an IQ below 70, between 86 to 89 or above 110.
Records showed that of the twenty-seven participants, twenty-one were placed in
special education and twenty students had been retained at least one grade within their
academic career. See Table 1 below for information regarding how many participants
were placed in special education and how many were retained in grade based on
intelligence.
Table 1 Special Education and Retention Sample Sizes Independent Variable Borderline Intelligence Average Intelligence
Placed in Special Education 8 13
Not Placed in Special Education 3 3
Retained 11 9
Not Retained 0 7
Measures
School Records. Data regarding intellectual ability and special education
placement was provided by the school system in an excel data file that had been kept by
Differences in Academics 35
the School Psychologist for the past fifteen years. This data was also used to select
participants for the study. Data regarding grade retention was obtained on each student
who participated in this study by reviewing information within their cumulative files.
Multidimensional Self-Concept Scale (MSCS; Bracken, 1992). This is a 150 item
questionnaire designed to measure global self-concept as well as six domain specific self-
concepts including, Social, Competence, Affect, Academic, Family, and Physical. Each
of the domains consists of 25 items on a scale similar to the Likert format with responses
ranging from “Strongly Agree” to “Strongly Disagree.” A raw score is calculated for each
of the domains and is then transferred into a standard score with a mean of 100 and a
standard deviation of 15. The MSCS was normed on a sample of 2,501 children in grades
fifth through twelfth ranging in age nine to nineteen. Concurrent validity studies show
that the MSCS, when compared to the Piers-Harris Children's Self-concept Scale and the
Coopersmith Self-Esteem Inventory, was correlated with measures of r=.85 and r=.73.
The MSCS also reports internal consistency coefficients for each domain as follows,
social .90, competence .87, affect .93, academic .91, family .97, physical .92, and global
.98. Test-Retest reliability show correlation coefficients after a posttest 4 weeks later as
follows, social .79, competence .76, affect .73, academic .81, family .78, physical .81,
and global .90. For this study, the Academic Self-Concept domain was the only area
measured. In the current study the Cronbach alpha coefficient was .85.
Basic Achievement Skills Inventory: Verbal Survey Test (BASI; Bardos, 2003) The
Verbal Survey Test is a twenty-five minute timed test that assesses verbal abilities in the
areas of vocabulary, language mechanics, and reading comprehension. Scores are
reported as standard scores with a mean of 100 and a standard deviation of 15. The BASI

Differences in Academics 36
was normed on a sample of more than four thousand students in grades three to college
based on the 2000 U.S. Census demographic information. The BASI Survey was
developed and is part of the BASI Comprehensive test. The BASI Comprehensive was
created using a test specification matrix, which was developed and refined by using the
Model Curriculum and Assessment Database. This database is comprised of information
from local, state, and national education standards from U.S. schools. Validity studies
show that the Total Verbal BASI survey score, when compared to various subtests of the
Wechsler Individual Achievement Test-Second Edition was correlated with measures of
R=.73 for Word Reading, R=.76 for Reading Comprehension, R=.72 for Pseudoword
Decoding, and R=.89 for Reading Composite. The BASI reports internal consistency
coefficients ranging from .75 to .94 depending on age. Test-Retest reliability show a
correlation after a posttest four weeks later of R=.63. In the current study, the Cronbach
alpha coefficient was .85.
Procedures
Prior to beginning research, submissions were made to the Institutional Review
Board for approval. Following IRB approval, the school psychologist in this school
system assisted in selecting the participants for this study by providing a copy of the
testing Excel data file with all student names replaced by an identification number.
Based on the participants having an intelligence quotient between 70 to 85 and 90 to 110,
a list of identification numbers was formulated as potential research participants. There
were 198 students identified as possible research participants. The identification numbers
were sent to the school system’s School Psychologist. The School Psychologist then
mailed parent consent forms (attached in Appendix A), made phone calls to parents who
Differences in Academics 37
did not respond through mail, and met with parents who came to the school in order to
obtain consent. After obtaining consent from parents, the researcher had access to student
names, and cumulative folders.
On the day of the assessments at each school, students with completed consent
forms were called to the front office of each school. Students were escorted in a group by
the researcher to an empty classroom and seated at separate desks. Students were
informed of the research and their voluntary participation. Students at this point were
allowed to leave if they did not want to participate. Of the participants involved within
the study, one student did not participate. In a random order, materials were passed out
to each student. Following the standardization of each assessment instrument, students
completed the MSCS and BASI Verbal Survey Test. After completing both assessments,
students were dismissed to return to class. Following the completion of the group-
administered assessments, student cumulative folders were accessed in order to determine
grade retention information. In addition, information regarding intelligence scores, and
special education placement was obtained from the School Psychologist’s assessment
Excel data file.

Differences in Academics 38
RESULTS
Consent for participation in this study was obtained from parents of 28 students
out of the 198 potential participants identified. This represented a 14% response rate.
Only one of these twenty-eight students refused to give assent leaving a total of twenty-
seven participants. This sample size was much smaller than had been hoped, limiting
significantly the hypotheses that could be considered and analyses that could be run.
Specifically, it was not possible to consider the impact of borderline intelligence and
retention or borderline intelligence and special education placement on academic
achievement and academic self-concept. With the data available, it was decided that the
hypotheses that could be considered were those related to the relationship between
academic achievement and academic self-concept, intelligence and academic
achievement; intelligence and academic self-concept; academic achievement and
academic self-concept; educational placement and academic achievement, educational
placement and academic self-concept, retention and academic achievement; and retention
and academic self-concept.
These relationships were examined by using Pearson product-moment correlation
coefficients, multiple regression, and independent samples t-tests. For the independent
samples t-tests, the dependent variables included the standardized scores obtained from
the MSCS (academic self-concept) and the BASI (Verbal Skills). The independent
variables included special education placement, grade retention, and intelligence
quotients. Pearson product-moment correlation coefficients were not calculated for grade
retention and special education placement because the data is categorical.

Differences in Academics 39
Academic Self-Concept and Academic Achievement
The relationship between academic self-concept and academic achievement was
investigated using Pearson product-moment correlation coefficient in order to determine
if there was a positive correlation between the two variables. Preliminary analyses were
performed to ensure no violation of the assumptions of normality, linearity, and
homoscedasticity. The results from the analysis show that there is a significant medium
positive correlation between the two variables (r=.42, n=27, p=.015), with higher
academic achievement associated with higher academic self-concept.
A multiple regression was conducted to determine if academic achievement was a
significant predictor of academic self-concept. Multicollinearity, outliers, normality,
linearity, homoscedasticity, and independence of Residuals assumptions were all met. R
square equaled 176; indicating 17.6 percent of the variance in academic self-concept is
explained by the student’s academic achievement. Due to the small sample size, R
square may be an overestimation of the true value; therefore, the adjusted R square value
was examined as well. Adjusted R square equaled .143; indicating 14.3 percent of the
variance in academic self-concept is explained by the student’s academic achievement.
Standardised Beta was reported at .42 at p =.03 significance
IQ and Academic Self-Concept
An independent-samples t-test was conducted to compare the academic self-
concept scores for students with a borderline IQ and students with an average IQ.
Assumptions were met according to the Levene's Test for Equality of Variances, and
equal variances were assumed. Results indicated a significant difference in scores for

Differences in Academics 40
borderline students (M=77.82, SD 6.29) and average students (M=94.50, SD 13.26) at
p=.001 significance, t (25) =-3.87. The magnitude of the differences in the means was
very small (h2=.088), 8.8% of the variance in academic self-concept was explained by IQ.
See Table 2 below for analysis results.
Table 2 Academic Self-Concept of Borderline and Average Intelligence
Intelligence
Level
Sample
Size
Academic
Self-Concept Mean
Standard
Deviation
Borderline IQ 11 77.82 6.29
Average IQ 16 94.50 13.26
IQ and Academic Achievement
An independent-samples t-test was conducted to compare the academic
achievement scores for students with a borderline IQ and students with an average IQ.
Assumptions were met according to the Levene's Test for Equality of Variances, and
equal variances were assumed. There was no significant difference in scores for
borderline students (M=77.82, SD 11.55) and average students (M=85.81, SD 10.25) at
p=.070 significance, t (25) =-1.89. The magnitude of the differences in the means was
very small (h2=.022), 2.2% of the variance in achievement was explained by IQ. See
Table 3 below for analysis results.

Differences in Academics 41
Table 3 Academic Achievement of Borderline and Average Intelligence
Intelligence
Level
Sample
Size
Academic
Achievement Mean
Standard
Deviation
Borderline IQ 11 77.82 11.55
Average IQ 16 85.81 10.25
Retention and Academic Self-Concept
Due to the population of borderline students having all been retained in grade,
retention analyses were examined only for students with average intelligence. Within this
population, nine students had been retained in grade at least once and seven students had
not been retained in grade. An independent-samples t-test was conducted to compare the
academic self-concept scores for students with an average IQ who have been retained in
grade with students who have an average IQ who have not been retained in grade.
Assumptions were met according to Levene’s Test for Equality of Variances, and equal
variances were assumed. There was not a significant difference in academic self-concept
scores for students retained in grade (M=91.11, SD14.90) and students not retained in
grade (M=98.86, SD10.19) at p=.26 significance, t (14) =-1.17. The magnitude of the
differences in the means was very small (h2 =.089) 8.9% of the variance in academic self-
concept was explained by whether or not a student was retained. See Table 4 below for
analysis results.

Differences in Academics 42
Table 4
Academic Self-Concept of Students with Average Intelligence Retained in Grade and Students with Average Intelligence Not Retained in Grade
Variable
Sample
Size
Academic
Self-Concept Mean Standard
Deviation
Retained 9 91.11 14.90
Not Retained 7 98.86 10.19
Retention and Academic Achievement
Due to the population of borderline students having all been retained in grade,
retention analyses were examined only for students with average intelligence. Within this
population, nine students had been retained in grade at least once and seven students had
not been retained in grade. An independent-samples t-test was conducted to compare the
academic achievement scores for students with an average IQ who have been retained in
grade with students who have an average IQ who have not been retained in grade.
Assumptions were met according to Levene’s Test for Equality of Variances, and equal
variances were assumed. There was not a significant difference in academic achievement
scores for students retained in grade (M=86.89, SD 6.97) and students not retained in
grade (M=84.43, SD 13.93) at p= .65 significance, t (14) =.46. The magnitude of the
differences in the means was very small (h2 =.015) 1.5% of the variance in academic
achievement was explained by whether or not a student was retained. See Table 5 below
for analysis results.

Differences in Academics 43
Table 5
Academic Achievement of Students with Average Intelligence Retained in Grade and Students with Average Intelligence Not Retained in Grade
Variable
Sample
Size
Academic
Achievement Mean Standard
Deviation
Retained 9 86.86 6.97
Not Retained 7 84.43 13.93
Special Education Placement and Self-Concept
An independent-samples t-test was conducted to compare the academic self-
concept scores for students who have been placed in special education with students who
have not been placed in special education. Assumptions were met according to Levene's
Test for Equality of Variances, and equal variances were assumed. There was not a
significant difference in academic self-concept scores for students placed in special
education (M=86.48, SD 12.47) and students not placed in special education (M=92.00,
SD 17.84) at p=.39 significance, t (25) =-.87. The magnitude of the differences in the
means was very small (h2 =.004), .4% of the variance in academic self-concept was
explained by whether or not a student received special education services. See Table 6
below for analysis results.

Differences in Academics 44
Table 6 Academic Self-Concept of Students Placed in Special Education and Students Not Placed in Special Education
Variable
Sample
Size
Academic
Self-Concept Mean
Standard
Deviation Range
Placed 21 86.48 12.47 55-106
Not Placed 6 92.00 17.84 66-116
Special Education Placement and Academic Achievement
An independent-samples t-test was conducted to compare the academic
achievement scores for students who have been placed in special education with students
who have not been placed in special education. Assumptions were met according to
Levene's Test for Equality of Variances, and equal variances were assumed. There was
not a significant difference in academic achievement scores for students placed in special
education (M=80.90, SD=11.66) and students not placed in special education (M=88.33
SD=8.36) at p=.16 significance, t (25) =-1.45. The magnitude of the differences in the
means was very small (h2 =.012), 1.2% of the variance in academic achievement was
explained by whether or not a student received special education services. See Table 7
below for analysis results.

Differences in Academics 45
Table 7 Academic Achievement of Students Placed in Special Education and Students Not Placed in Special Education
Variable
Sample
Size
Academic
Achievement Mean
Standard
Deviation
Placed 21 80.90 11.66
Not Placed 6 88.33 8.36

Differences in Academics 46
DISCUSSION This research study provided information regarding the impact of intellectual
ability, special education placement, and grade retention on the academic achievement
and academic self-concept of students’ who have a history of academic difficulties.
Despite a small sample size, the information obtained from this research study should
provide school systems with important student factors to consider when making decisions
regarding educational interventions. It also supports the need for continued efforts to
examine these relationships.
Implications for Achievement and Academic Self-Concept
The most notable implications from this study are the academic self-concept
findings. Analyses showed that students with a borderline IQ had a significantly lower
academic self-concept when compared to other students with an average IQ. Other
research supports these findings, Masi, et. al (1998) found that students with borderline
intellectual ability struggle academically, which can create weak self-perception and over
time lower their self-esteem and increase feelings of inadequacy. A medium, but
significant correlation supports the relationship between academic achievement and
academic self-concept of students. This indicates that students with borderline
intellectual ability are performing lower academically which is impacting the way
students perceive themselves academically. Results also indicated a significant
regression, signifying that student achievement is a predictor of academic self-concept.
This significant regression is especially important considering that most of the
students within the average IQ group still performed below average academically. As

Differences in Academics 47
noted, all students within this evaluation had previously been referred for testing to
determine eligibility for special education; however, many were not eligible. Despite
having average intelligence and below average academic achievement, students with an
average IQ still had a significantly greater academic self-concept within the average
range when compared to students with borderline intellectual ability. Given the
significant difference in academic self-concept between students with borderline IQ and
those with average IQ but no difference in academic achievement, it raises the question,
what is increasing the academic self-concept of students with average intelligence, but
not for students with borderline intellectual ability?
From these results, one can conclude that by improving student achievement,
especially students with borderline IQ, one can improve their academic self-concept as
well. However; previous research and the current results are inconclusive regarding the
effectiveness of programs used to improve student achievement.
Implications for Special Education Placement
Research has been inconclusive regarding the effectiveness of special education
programs. Within the current study, the lack of a significant difference between students
with academic difficulties who are placed in special education and those who are not
placed in special education in terms of both academic self-concept scores and academic
achievement scores indicates that special education within this small district is not
making a significant impact in these two areas. However, the same can be said for the
regular education program. While the mean achievement score for students placed in
special education (80.90) was lower than the mean academic achievement score for
students not placed in special education (88.83), this difference was not significant. This

Differences in Academics 48
indicates that students placed in special education are doing no better and no worse than
students with academic difficulties who were not placed in special education. What is not
known is whether there was a significant difference in academic achievement and
academic self-concept between these two groups when they were initially referred for
testing. Without that information it is hard to compare the progress of one group
compared to the other. The small sample size for this study also prevented the examiner
from looking further at the impact of level of intelligence on the academic performance
differences between students placed in special education and those placed in regular
education.
Implications for Grade Retention
Most notable within the sample of students with borderline IQ, is that every
student had been retained in grade at least once. Research supports the negative impact
retention has on both student’s academic self-concept and academic achievement
(Pomplun, 1988 and Silberglitt et al. 2006). Retention could be a confounding variable to
the previously asked question regarding the differences in academic self-concept among
students with borderline IQ and students with average IQ. Despite students with average
intelligence having below average academic achievement, they were still able to have an
academic self-concept within the average range, which is not the case for students with
borderline IQ. This could possibly be explained by the research supporting the negative
impact retention has on student’s academic self-concept.
Due to the small sample size and having no students with borderline IQ who had
not been retained, only students with average intelligence were used within analyses to
determine the impact of grade retention on academic self-concept and academic

Differences in Academics 49
achievement. Results indicated that there was not a significant difference between the
academic achievement and academic self-concept scores of students with average
intelligence who had been retained in grade when compared to students with average
intelligence who had not been retained in grade. This indicates that retaining in grade
students who are having academic difficulty does not result in significantly improved
academic performance or academic self-concept over time.
Implications for Future Decisions
The current research supports the continued efforts to examine the decision
making process regarding special education placement and grade retention of students.
Grade retention is often a subjective, rather than objective decision made within schools
with limited criteria or data to support these decisions. Given the current model of
special education within North Carolina, decisions for special education placement
continue to be based on discrepancies among intelligence and achievement rather than a
district and school’s ability to intervene and attempt to pull a child back up to grade level
within the general education setting. However, states continue to be in a transition
between the use of the discrepancy model and the Responsiveness to Instruction (RTI)
model when making decisions regarding special education eligibility. This transition
creates a change in decision making processes, as well as a change within both the
general education and special education settings. Within RTI, schools are able to set up
learning environments for students within the general education setting that allow
students to receive differentiated instruction and instruction on their level, without the
label of a disability or the idea of being retained in grade. Given the previous research,
RTI would also increase students academic self-concept. By improving students’

Differences in Academics 50
academic achievement, and providing interventions within a regular education setting,
academic self-concept should increase as well.
Limitations
There are several limitations to the conclusions within the previously reported
analyses, particularly the small sample size. The small sample size impacts the effect
size, despite meeting the assumptions for both correlations and t-tests. There were no
students with a borderline IQ who had not been retained a grade limiting the ability to
generalize the findings regarding retention. The majority of participants were also placed
in special education regardless of intelligence. The small number of students in this
study who were in regular education classrooms further limits the generalizability of
these results.
A self-selection bias was also present within the present study and sample of
students. Ideally, participants within this study would have been a randomly selected
group of students with borderline and average IQ. However, only students who took
home and returned consent/assent forms were allowed to participate. Self-selection bias
impacts the reliability of the results.
Given the information required for this study, all participants within the study had
previously been referred for a psychological evaluation. This indicates that the majority,
of students, if not all, have experienced academic difficulties at one point in time during
their academic career. Despite having average intelligence, within this study, they could
also have a learning disability that would impact their academic achievement and
academic self-concept.

Differences in Academics 51
This particular study focused on achievement in the area of reading. However, for
many students reading could have been a strength and their disability was in math or
writing. The particular academic difficulty of students could have impacted the results of
the previous analyses.
When considering the impact of special education placement on academic
achievement and academic self-concept, the length of time a student had been receiving
special education services was not considered within this study. The length of time a
student has been receiving special education services could potentially impact the results.
Within this study, intelligence was considered as a factor impacting academic
achievement and academic self-concept. Comparisons were initially proposed to look at
the differences between students with borderline intelligence and academic intelligence.
However, due to the small sample size, there were limited analyses available to run and
analyze. Therefore correlations and t-tests were analyzed. Given the grouping of
students, participants did not represent IQ scores across the continuum, which could have
impacted the results of the correlations.
Directions for Future Research
Although analyses showed significant results especially in regards to academic
self-concept related to academic achievement, IQ and retention, further and more detailed
research in this area is still needed. Given the small sample size, a MANOVA could not
be run in order to determine significant results when considering how all factors impact
academic achievement and academic self-concept. Analyses were run with independent
variables collapsed across groups.

Differences in Academics 52
Within the small sample size, there were not any students with a borderline IQ
that had not been retained. This particular group of students requires further research in
order to better understand the impact of grade retention on students with a borderline IQ.
Other variables to consider in future research include the number of years a
student has received special education as well as the number of times a student has been
retained. In order to truly understand the impact of special education placement, the
number of years a student has been receiving specialized instruction should be
considered. When considering student placement in special education, there are various
disability categories, including, but not limited to, learning disability, and intellectual
disability. The specific education placement of a student could also impact their
academic achievement and academic self-concept.
As previously noted, the area of achievement assessed could have skewed the
results within this particular study. Future research should focus on student achievement
in all areas including reading, math, and writing.

Differences in Academics 53
REFERENCES
Alves-Martins, M., Peixoto, F., Gouveia-Pereira, M., Amaral, V., & Pedro, I. (2002). Self-
esteem and academic achievement among adolescents. Educational Psychology.
22(1), 51-62.
American Psychiatric Association. (2000). Diagnostic and statistical manual for mental
disorders (4th ed.). Washington, DC.
Bardos, A.N. (2003). Basic Achievement Skills Inventory. Pearson.
Baumeister, R. F., Campbell, J.D., Krueger, J.L., & Vohs, K.D. (2003). Does high self-
esteem cause better performance, interpersonal success, happiness, or healthier
lifestyles? Psychological Science in the Public Interest. 4, 1-44.
Bear, G. G., Minke, K. M., & Manning, M. A. (2002). Self-concept of students with
learning disabilities: A meta-analysis. School Psychology Review. 31(3), 405.
Beck, M. A., Roblee, K., & Hanson, J. (1982). Special education/regular education: A
comparison of self-concept. Education, 102(3), 277-279.
Belmont, I. & Belmont, L. (1980). Is the slow learner in the classroom learning disabled?
Journal of Learning Disabilities. 13(9), 496-499.
Blair, C. (2001). The early identification of risk for grade retention among African
American children at risk for school difficulty. Applied Development Science.
5(1), 37-50.
Bowman, L. J. (2005). Grade retention: Is it a help or hindrance to student academic
success? Preventing School Failure. 49(3), 42-46.

Differences in Academics 54
Bracken, B. A. (1992). Examiners Manual for the Multidimensional Self-concept Scale.
Austin, TX: Pro-Ed.
Cambra, C., & Silvestre, N. (2003). Students with special educational needs in the
inclusive classroom: Social integration and self-concept. European Journal of
Special Needs Education. 18(2), 197-208.
Cassel, R.N. (1988) School dropouts and non-learners in America are a tragic story of
health problems. Education. 108(3), 413-416.
Cooter, K.S., & Cooter, R.B. (2004). One size doesn’t fit all: Slow learners in the reading
classroom. The Reading Teacher. 57(7), 680-684.
Crandall, V.C. (1966). Personality characteristics and social and achievement behaviors
associated with children’s social desirability response tendencies. Journal of
Personality and Social Psychology. 4(5), 477-486.
Curtis, C.K., & Shaver, J.P. (2001). Improving slow learners’ self-esteem in secondary
social studies classes. Journal of Educational Research. 217-222.
Dunlap, H.G. (1979). Minimum competency testing and the slow learner. Educational
Leadership. 36(5), 327-329.
Freeman, S. (2000). Academic and social attainments of children with mental retardation
in general education and special education settings. Remedial and Special
Education. 21(1), 3-17.
Hanushek, E.A., Kain, J.F., & Rivkin, S.G. (2002). Inferring program effects for special
populations: Does special education raise achievement for students with
disabilities? The Review of Economics and Statistics. 84(4), 584-599.

Differences in Academics 55
Holmes, C.T., & Matthews, K.M., The effects of nonpromotion on elementary and junior
high school pupils: A meta-analysis. Review of Educational Research. 54(2), 225-
236.
Johnson, W., McGue, M., & Iacono, W.G. (2005). Disruptive behavior and school
grades: Genetic and environmental relations in 11 year-olds. Journal of
Educational Psychology. 97(3). 391-405.
Kloomok, S., & Cosden, M. (1994). Self-concept in children with learning disabilities:
The relationship between global self-concept, academic 'discounting,'
nonacademic self-concept, and perceived social support. Learning Disability
Quarterly. 17(2), 140-153.
Koenen, K.C., Caspi, A., Moffitt, T.E., Rijskijk, F. & Taylor, A. (2006). Genetic
influences on the overlap between low IQ and antisocial behavior in young
children. Journal of Abnormal Psychology. 115(4), 787-797.
Koolhof, R., Loeber, R., Wei, E.H., Pardini, D. (2007). Inhibition deficits of serious
delinquent boys of low intelligence. Criminal Behavior & Mental Health. 17(5).
274-292.
Lenarduzzi, G., & McLaughlin, T. F. (1992). Longitudinal effects of nonpromotion in
junior high school on academic achievement and attendance. Education. 113(1),
112-115.
Leondari, A. (1993). Comparability of self-concept among normal achievers, low
achievers and children with learning difficulties. Educational Studies. 19(3), 357-
371.

Differences in Academics 56
Lipsky, D.K. & Gartner, A. (1987). Capable of achievement and worthy of respect:
Education for handicapped students as if they were full fledged human beings.
Exceptional Children. 54, 69-74.
Madden, N. A., & Slavin, R. E. (1983). Mainstreaming students with mild handicaps:
Academic and social outcomes. Review of Educational Research. 53, 519-569.
Manning, M.A., Bear, G.G., & Minke, K.M. (2006). Self-concept and self-esteem. In
G.G. Bear & K.M. Minke (Eds.), Children’s needs III: Development, prevention,
and intervention. (pp 341-356).Bethesda, MD: National Association of School
Psychologists.
Manzo, K.K. (2005). Dropouts identifiable by 6th grade factors. Education Week. 24(29).
Masi, G., Marcheschi, M., Pfanner, P. (1998) Adolescents with borderline intellectual
functioning: Psychopathological risk. Adolescence. 33(130), 415-425.
North Carolina School Psychology Association (2005). Are we failing our at-risk
students? Effective alternatives to grade retention in North Carolina. Retention
and the Student Accountability Standards in North Carolina: A Position Statement
and Supporting Paper. Available at www.ncschopsy.org.
North Carolina School Psychology Association (2001). Grading the North Carolina
student accountability standards. Student accountability standards and high-
stakes testing in North Carolina: A position statement and supporting paper.
Available at www.ncschoopsy.org.
Pijl, Y. J., & Pijl, S. J. (1998). Are pupils in special education too "special" for regular
education? International Review of Education. 44(1), 5.

Differences in Academics 57
Pomplun, M. (1988). Retention: The earlier, the better? Journal of Educational
Research. 81(5), 281-287.
Ribner, S. (1978). The effects of special class placement on the self-concept of
exceptional children. Journal of learning disabilities. 11(5), 319-323.
Safer, D. (1986). Nonpromotion correlates and outcomes at different grade levels.
Journal of Learning Disabilities. 19(8), 500-503.
Shavelson, R.J., Hubner, J.J., & Stanton, G.C. (1976). Validation of construct
interpretations. Review of Educational Research, 46, 407-441.
Shaw, S., Grimes, D., & Bulman, J. (2005). Education slow learners: Are charter schools
the last, best home for their educational success? The Charter Schools Resource
Journal. 1(1), 2-19.
Shaw, S. R. (2001, April). Slow learners: Condemned to failure or failed by schools?
Paper presented to the convention of the National Association of School
Psychologists. Washington, DC.
Shuell, T.J., & Keppel, G. (1970). Learning ability and retention. Journal of Educational
Psychology. 61(1), 59-65.
Silberglitt, B., Jimerson, S. R., Burns, M. K., & Appleton, J. J. (2006). Does the timing of
grade retention make a difference? Examining the effects of early versus later
retention. School Psychology Review. 35(1), 134-141.
Silberglitt, B., Appleton, J. J., Burns, M. K., & Jimerson, S. R. (2006). Examining the
effects of grade retention on student reading performance: A longitudinal study.
Journal of School Psychology. 44(4), 255-270.

Differences in Academics 58
Stone, C. A., & May, A. L. (2002). The accuracy of academic self-evaluations in
adolescents with learning disabilities. Journal of learning disabilities. 35(4), 370.
Thomas, R.J. (1954). An empirical study of high school drop-outs in regard to ten
possibly related factors. The Journal of Educational Sociology. 28(1), 11-18.
Wiener, J., & Tardif, C. Y. (2004). Social and emotional functioning of children with
learning disabilities: Does special education placement make a difference?
Learning Disabilities Research & Practice. 19(1), 20-32.
Wilson, P. L. (1998). Multidimensional self-concept scale: An examination of grade, race,
and gender differences in third through sixth grade students' self-concepts
Psychology in the School. 35(4), 317-326.

Differences in Academics 59
APPENDIX A
Parental Consent Form
Dear Parents:
Swain County Schools are pleased to participate in a research project with Western Carolina University. Your child has been selected to participate in this study. The results will help Swain County Schools better understand how to educate our children. More specifically, this research will look at the relationship between grade retention, special education placement, and intelligence with student's academic self-concept and academic achievement. Kristin Pruett is a graduate student in the School Psychology Program at Western Carolina University. She will be doing this research beginning in the Fall of 2009. In order to keep your child’s name and records confidential, she will not have access to this information unless you sign this consent form. If you agree to allow your child to be in this study, he or she will be asked to complete a survey measuring their academic self concept as well as take a brief academic achievement assessment. These items will be given at school in a group setting and will take approximately 30-40 minutes altogether. By allowing your child to participate, you are also giving us permission to access your child’s cumulative file in order to gather demographic and school related information. Your child’s participation is strictly voluntary. All information will be kept strictly confidential. Your child’s name, school, and school district will not be written in any reports and will be known only to me, Catherine Cuthbertson, School Psychologist for Swain County Schools, and Kristin Pruett, the graduate student doing the research. Your child will not experience any harm, stress, or discomfort while participating in the research and can stop at any point. If you have any questions, feel free to contact me by email at [email protected], or you may contact Kristin Pruett directly at 828-446-0876 or by email at [email protected]. If you have any additional questions regarding your child's rights as a research participant, you may contact the office of the IRB, a committee that oversees the ethical issues of the research process. The IRB office can be contacted at 227-3177. This research project has been approved by the IRB. Please return this form in the enclosed envelope (sealed). THANK YOU for helping us to help the children in Swain County Schools! I AGREE DO NOT AGREE (Circle one) for your child to participate Child's Name: ____________________Child's Signature: ___________________

Differences in Academics 60
Parent Signature: ____________________________ Date: ___________ If you would like to know the results of the study after its conclusion, please write your email address (preferred) or phone number below. This will only be used for sharing the results of the study with you. Contact me at: ___________________________________