dietary reference values of individual … fenech csiro food and nutritional sciences ... results of...
TRANSCRIPT

Dietary reference values of individual micronutrients and
nutriomes for DNA damage prevention
Current status and a road map to the future
Michael FenechMichael FenechCSIRO Food and Nutritional SciencesCSIRO Food and Nutritional SciencesGENOME HEALTH NUTRIGENOMICS LABORATORYGENOME HEALTH NUTRIGENOMICS LABORATORY
AICR ConferenceAICR ConferenceWashington 21Washington 21--22 October 201022 October 2010
Fenech MF, Am J Clin
Nutr. 2010; 91(5):1438S-1454S

Overview
Biomarkers used to study DNA damage in humans
Association of DNA damage with developmental and degenerative disease
Current knowledge of nutritional requirements for genome maintenance and stability
Effect of nutrient-nutrient and nutrient-genotype interaction on DNA integrity
Strategies to determine DRVs
of single micronutrients and micronutrient combinations (nutriomes) for DNA damage prevention

A NUCLEOCENTRIC VIEW OF AGEINGA NUCLEOCENTRIC VIEW OF AGEINGFROM WOMB TO TOMBFROM WOMB TO TOMB

BIOMARKERS OF DNA DAMAGEBIOMARKERS OF DNA DAMAGE
NPB
MN
dicentric
Gene expression arrays γH2AX

AcknowledgementJohn RK SavageAtlas Genet CytogenetOncol
Haematol. July 2000
The principal structural
chromosomal aberrations which
contribute acentric fragments
(AF) to form micronuclei (MN)
and nucleoplasmicbridges (NPB)

Genome damageGenome damageMicronucleiMicronuclei
Human cellswith damaged& unstablegenomes
• Oxidative stress• Nutrient deficiency• Excess calories
• Strand breaks in DNA•Chromosome malsegregation•DNA hypomethylation•Telomere shortening
CYTOKINESISCYTOKINESIS--BLOCK MICRONUCLEUS (CBMN) ASSAYBLOCK MICRONUCLEUS (CBMN) ASSAY

Increased lymphocyte micronucleus frequency in early pregnancy is associated prospectively with pre-eclampsia
and/or intrauterine growth restriction
(PEIUGR)(PEIUGR)
D.L.F FurnesS, G.A Dekker, W.M Hague T .Y Khong and M.F FenechMutagenesis (2010)
ADVERSEN=7
ADVERSEN=67
LOW RISKN=45
HIGH RISKN=91
LRNN=38
PEIUGRN=36
OAON=38
HRNN=24
RISK GROUPS PREGNANCY OUTCOME GROUPS
LYMPHOCYTELYMPHOCYTEMICRONUCLEIMICRONUCLEIMEASURED AT MEASURED AT 18 WKS18 WKSGESTATIONGESTATION
02468
10121416
>19.3 >28.0 >36.7
Odd
s R
atio
Odd
s R
atio
MNMN--BN BN ‰
P=0.003P=0.003 P=0.006P=0.006
P=0.001P=0.001
PROSPECTIVE ODDS RATIOPROSPECTIVE ODDS RATIOOF PEIUGR FOR ALL COHORTOF PEIUGR FOR ALL COHORT

Risk of cancer increases with higher MN frequency
Bonassi et al (Carcinogenesis 2007)
PRO
BA
BIL
ITY
OF
SUR
VIVI
NG
W
ITH
OU
T C
AN
CER
FOLLOW UP TIME IN YEARS
6,983 subjects275 cancer cases
HUMN project (www.humn.org)

Lymphocyte Micronucleus frequency is associated prospectively with cardiovascular disease mortality in
both the general population and those with known coronary artery disease
MN>1MN>1‰‰
MNMN<<11‰‰
MN frequency
178 CAD patients178 CAD patientsMean age 62 yMean age 62 y
1650 subjects1650 subjects111 deaths111 deaths
39 due to CVD39 due to CVDMean age 65 yMean age 65 y
Federici C et al

GENOME DAMAGE INCREASED IN LYMPHOCYTES OF GENOME DAMAGE INCREASED IN LYMPHOCYTES OF ALZHEIMER AND PARKINSONALZHEIMER AND PARKINSON’’S DISEASE PATIENTSS DISEASE PATIENTS
DNA DAMAGE IN LYMPHOCYTES
AD PD CONTROL0
5
10
15
20 * *
* P<0.001
MN
PER
100
0 B
NC
s
DISTRIBUTION OF TYPE OF MICRONUCLEI
AD PD CONTROL0
25
50
75
100
MN (CHROM. LOSS) MN (CHROM. BREAK)
p < 0.0001
%
PetrozziPetrozzi
et al. Neurol. Sci. 2002et al. Neurol. Sci. 2002

18-2
5
26-3
5
36-4
5
46-5
5
56-6
5
66-7
5
76-9
0
0
10
20
30
40
50
MN
per
100
0 B
N c
ells
AGE (years)
DNA damage increases with DNA damage increases with age ....orage ....or……. poor choices of nutrition, life. poor choices of nutrition, life--style, style,
physical and sociophysical and socio--psychological environments?psychological environments?
Fenech et al. 2000
What is theWhat is thethreshold ofthreshold ofDNA damageDNA damagewe should we should allow?allow?
Can we designCan we design““exposomesexposomes””that enable us that enable us to stay belowto stay belowthis threshold?this threshold?

ENVIRONMENTALENVIRONMENTALGENOTOXINSGENOTOXINS
LIFELIFE--STYLESTYLEGENOTOXINSGENOTOXINS
MALNUTRITIONMALNUTRITION
GENETICGENETIC
AND AND
ACQUIRED ACQUIRED
SUSCEPTSUSCEPT--
IBILITYIBILITY
GENOMEGENOMEDAMAGE INDAMAGE IN::
GERMLINEGERMLINE
EMBRYOEMBRYO
FOETUSFOETUS
BABYBABY
CHILDCHILD
TEENAGERTEENAGER
YOUNG ADULTYOUNG ADULT
OLDER ADULTOLDER ADULT
HIGHERHIGHERRISKRISK
LOWERLOWERRISKRISK
DE
VE
LOP
ME
NTA
LD
EV
ELO
PM
EN
TAL
DE
GE
NE
RA
TIVE
DE
GE
NE
RA
TIVE
DIS
EA
SE
SD
ISE
AS
ES
CAUSES AND EFFECTS OF GENOME DAMAGE
EEXXPPOOSSOOMMEE
PSYCHOLOGICALPSYCHOLOGICALSTRESSSTRESS

Italy Germany USA
Poland Mexico Ecquador
Bhutan Chad Egypt Dietary patterns & 1 week’s food

The new frontier in nutrition The new frontier in nutrition
NUTRIOME GENOME
HHEEAALLTTHH
Nutrition designed for diverse genetic backgroundsNutrition designed for diverse genetic backgroundsto optimise genome maintenance and prevent diseases to optimise genome maintenance and prevent diseases
caused by DNA damagecaused by DNA damage

The following genomic stability processes are The following genomic stability processes are modulated by vitamins or micronutrientsmodulated by vitamins or micronutrients:
DNA oxidation preventionDNA oxidation prevention Vit C, Vit E, Se, polyphenols
DNA DNA methylationmethylation, synthesis, synthesis folate, Vit B12, Zn, Mg
DNA repairDNA repair niacin, Zn, folate
Gene expressionGene expression folate, Vit D, Vit A
Chromosome segregationChromosome segregation folate, Vit A, Mg
Telomere lengthTelomere length niacin? via PARP, folate
Necrosis/ApoptosisNecrosis/Apoptosis niacin, Zn, Vit E, Vit D, Vit CVit A, Vit K2.

Folate, B12, B6 and B2 and genome maintenance
METHIONINE
HOMOCYSTEINE
SAM
THF
5-MeTHF
5,10-MeTHFDNA
DNA METHYLATION
DHF
FOLIC ACID
dUMP
dTMP
DNA REPAIR & SYNTHESIS
TS
MTHFRVIT B2
SHMT1VIT B6
MTRR
MTRVIT B12 (CoIII)
MTRVIT B12
(CoI)

SeedLymphocytes
44 h
Nutrients
20 h
Mitogen
1 h
+/-Genotoxin
+/-Genotoxin
Cytochalasin
B (cytokinesis
blocking agent)
72h
Nuclear stain/Fix
Image acquisition
and analysis
Minimally invasive HighMinimally invasive High--Throughput Throughput
Nutrient Array screening for GenomeNutrient Array screening for Genome--Protective agentsProtective agents..
Micronucleus
Targeted Cell
SelectedNuclei
Development of automated CBMN Cytome
assay:MN, NPB, NBUDs, Necrosis, Apoptosis, NDI
+ FISH + Protein expression
20ul blood

A B C
D E
F G H
CBMNCBMNCYTOME CYTOME ASSAYASSAY
A ,B, C
NUCLEAR DIVISION
INDEX
D,E
CELL DEATH
F, G, H
DNA DAMAGE
Fenech M (2007) Nature ProtocolsFenech M (2007) Nature Protocols

MICRONUCLEATED CELLS
12 24 60 1200
10
20
30
40
*
**
[A]
folic acid in medium (nM)
MN
ed B
Ns/
1000
BN
s ANOVA P < 0.0001
NUCLEAR BUDS
12 24 60 1200
5
10
15
ANOVA P<0.0001
*
**
[B]
folic acid in medium (nM)
Bud
s/10
00 B
Ns
NUCLEOPLASMIC BRIDGES
12 24 60 1200.0
2.5
5.0
7.5
10.0ANOVA P<0.0001*
**
[C]
[folic acid] in medium (nM)
NPB
/100
0 B
Ns
URACIL
12 24 60 1200
10
20
30
40
50ANOVA P < 0.0001
[folic acid] in medium (nM)
pg u
raci
l / g
DN
A
* *
[D]
Crott et al. Carcinogenesis 2001

0
5
10
15
20
25
30
35
0 5 10 15 20 25
MN
ed B
Ns/
1000
BN
s
0 5 1024
20120 60 12
rad X-rays
Fenech & Morley, 1986
nM folic acid
Genome damage induction by Folic acid deficiency is of a similarGenome damage induction by Folic acid deficiency is of a similar magnitude as that induced by unsafe doses of magnitude as that induced by unsafe doses of ionisingionising radiationradiation
IAEA annual safe exposure limit ie
equivalent to 0.1-0.5 rad
X-rays
Crott & Fenech 2002
“normal”serum folate
concentration

PLACEBOPLACEBO FOLB12FOLB12
ROUND 1ROUND 1 ROUND 1ROUND 1 BASEBASE--LINELINE*CEREAL CEREAL +ONLY 7ug B12 +
700ug FOL
ROUND 2ROUND 2 ROUND 2ROUND 2 12 WEEKS12 WEEKS*TABLET TABLETPLACEBO 20ug B12 +
2000ug FOL
ROUND 3ROUND 3 ROUND 3ROUND 3 24 WEEKS24 WEEKS*
* blood sample
Randomised, placeboRandomised, placebo--controlled dietary interventioncontrolled dietary intervention
Fenech et al. 1998 Carcinogenesis

0
3
6
9
12
Low MNed cell freq.at R1. [N = 17]ANOVA P = 0.65
High MNed cell freq.at R1. [N = 16]ANOVA P < 0.0005
R1 R1 R2 R2 R3 R3
* *
MN
ed c
ells
per
100
0 B
N c
ells
Supplementation with 3.5 times RDI folic acid & vit B12reduces micronucleus index by 25 % in subjects with above average chromosome instability
Fenech et al. 1998 Carcinogenesis BaseBase--lineline 7ug B127ug B12700ug FA700ug FA
20ug B1220ug B122mg FA2mg FA

0 5 10 15 200
5
10
15
20
N = 48R = 0.392P = 0.006
MNed cells per 1000 BN cells
plas
ma
HC
(m
ol/l)
0 5 10 15 200
150
300
450
600
750
N = 48R = -0.489P = 0.0004
MNed cells per 1000 BN cells
seru
m B
12 (p
mol
/l)
Fenech et al. 1998 Carcinogenesis
M N frequency vs plasma HC inmen (50-70years) who were not
deficient in B12 or folate
0 10 20 30 400
5
10
15
R = 0.4148 P = 0.0086 N = 39
MN frequency per 1000 BN cells
plas
ma
HC
[m
ol/l]
serum B12 vs MN frequency inmen aged 50-70 years who
were not vitamin B12 deficient
0 10 20 30 400
100
200
300
400
500
600
R = -0.3418 P = 0.0127 N = 62
MN frequency per 1000 BN cells
seru
m B
12 [p
mol
/l]
MICRONUCLEUS FREQUENCY IS MINIMISED WHEN MICRONUCLEUS FREQUENCY IS MINIMISED WHEN HOMOCYSTEINE < 7.5umol/l and B12 > 300pmol/lHOMOCYSTEINE < 7.5umol/l and B12 > 300pmol/l
Fenech et al. (1997) Carcinogenesis
YOUNG ADULTS 18YOUNG ADULTS 18--32Y32Y
N=62N=62R=R=--0.310.31P==0.013P==0.013
MEN AGED 50MEN AGED 50--70Y70Y

300 times recommended intake of B12 is required to 300 times recommended intake of B12 is required to normalise normalise holoTCholoTC, MMA and , MMA and homocysteinehomocysteine in >70 year oldsin >70 year olds
EussenEussen
SJ et al 2005SJ et al 2005

Future Challenges: We have started to determine the impact of common polymorphisms in folate metabolism genes on chromosome damage in
Australians
Dhillon et al Mutation Res Fund Mech
2009
*age & gender adjusted

% variation in genome damage withincreased intake relative to lowest tertile of intake
Vita
min
E
Cal
cium
Fola
te
Ret
inol
Nic
otin
ic a
cid
-Car
oten
e R
ibof
lavi
n
Pant
othe
nic
acid
Bio
tin
-50-40-30-20-10
010203040506070
mid-tertilehighest tertile
*
** * *
*
*
*
**
** P < 0.006
% v
aria
tion
in M
N fr
eq
MICRONUTRIENTS AND GENOME DAMAGEMICRONUTRIENTS AND GENOME DAMAGERESULTS OF ANALYSIS OF FOOD FREQUENCY QUESTIONNAIRE AND GENOME DAMAGE DATABASE
Fenech et al.Fenech et al.CarcinogenesisCarcinogenesis(2005)(2005)

COMBINED EFFECT OF FOLATE AND CALCIUM INTAKE ON MN FREQUENCY
-70
-60
-50
-40
-30
-20
-10
0
low tertile mid tertile high tertile
low tertilemid tertilehigh tertile
CALCIUM INTAKE
FOLATEINTAKE
% V
ARIA
TIO
N
*
** *
**
(a) COMBINED EFFECT OF FOLATE AND RIBOFLAVIN INTAKE ON MN FREQUENCY
-40-30-20
-100
10
203040
50
low tertile mid tertile high tertile
low tertilemid tertilehigh tertile
FOLATE INTAKE
RIBOFLAVININTAKE
% V
ARIA
TIO
N * *
* *
(b)
The combined effect of (a) calcium and folate
intake and (b) riboflavin and folate
intake on MN frequency. Results shown are the % variation relative to the combined lowest tertiles
of intake in the pair of nutrients examined. * P < 0.05 for comparison with the referent value for the combined lowest tertile
of intake for the pair of nutrients examined.
NUTRIENTNUTRIENT--NUTRIENT INTERACTION ON CHROMOSOME DAMAGENUTRIENT INTERACTION ON CHROMOSOME DAMAGE
MORE RIBOFLAVINMORE RIBOFLAVININ A LOW FOLATE IN A LOW FOLATE
BACKGROUND BACKGROUND MAY BE MAY BE
GENOTOXICGENOTOXIC
Fenech et al 2005 Carcinogenesis; Fenech 2010 AJCNFenech et al 2005 Carcinogenesis; Fenech 2010 AJCN

ALMONDSWHEATBRAN
CHEDDAR CHEESE
BROCCOLI (BOILED)
TUNA (CANNED)
BEEF (COOKED)BANANA
0
100
200
300CALCIUMFOLATENIACINVITAMIN EBETA-CAROTENERETINOL
AMOUNTS IN 100g EXPRESSED AS % OF MIMIMUMREQUIREMENT FOR OPTIMUM GENOME HEALTH
Fenech, Food Chem
Tox
2008
Q. Which dietary pattern will work for your genotype ?Q. Which dietary pattern will work for your genotype ?
A. It depends on the A. It depends on the ““nutriomenutriome””
of the foods you prefer to eatof the foods you prefer to eat

. High Folate (HF) Vegetables Low Folate (LF) Vegetables
Pulses Leafy or cruciferous vegetables
Roots or Tubers
“Fruit” Vegetables
Red Kidney beans (130)
Broccoli (93) Onions (16) Tomato (15)
Mung beans (60)
Brussel sprouts (60)
Potato (22) Pumpkin (9)
Chickpeas (171)
Cabbage (43) Turnip (9) Cucumber (6)
Lentils (180) Endive (142) Parsnip (57) Capsicum (11)
Peas (59) Spinach (146) Swede (21) Eggplant (14)
Lima beans (50)
Lettuce (73) Carrot (14) Olives (0)
Mean (108) Mean (93) Mean (23) Mean (10)
Mean (100) Mean (16)
Folate content of vegetables (DFE µg per 100g)*
Eating the“wrong”
vegetablescould lead to folate
deficiency
Folate
RDA 400μgrequires eating:
2.5Kg LF veg/dor0.4Kg HF veg/d
*Data from USDA National Nutrient data base. DFE = dietary folate
equivalent. DFE values are shown in brackets.

TELOMERES (TTAGGG TELOMERES (TTAGGG repeats) ARE ESSENTIALrepeats) ARE ESSENTIALFOR CHROMOSOMEFOR CHROMOSOMESTABILITYSTABILITY
TELOMERE SHORTENING OR TELOMERE SHORTENING OR DYSFUNCTION INCREASES DYSFUNCTION INCREASES RISK FOR CANCER ANDRISK FOR CANCER ANDACCELERATED SENESCENCEACCELERATED SENESCENCE
TELOMERESTELOMERES

Wong & Collins Lancet 2003Wong & Collins Lancet 2003
SHORTER TELOMERES ARE ASSOCIATED SHORTER TELOMERES ARE ASSOCIATED PROSPECTIVELY WITH INCREASED RISK FOR CANCER PROSPECTIVELY WITH INCREASED RISK FOR CANCER
Willeit
P et al, JAMA.
2010; 304(1):69-75.
0
0.5
1
1.5
2
2.5
3
3.5
1st Qtr
LONGMEDIUMSHORT
LEUKOCYTE LEUKOCYTE TELOMERE LENGTHTELOMERE LENGTH
MULTIVARIATE HAZARDMULTIVARIATE HAZARDRATIO FOR CANCER INCIDENCE RATIO FOR CANCER INCIDENCE

Shorter telomeres in WBCs
and Buccal cells of Alzheimer’s disease (AD) cases compared to controls
Young contro
lsOld co
ntrols
Younger AD
Older AD
0
25
50
75
100
125
150
175 a
b
bcc
Abs
olut
e te
lom
ere
leng
th(K
b pe
r di
ploi
d ge
nom
e)
Young contro
lsOld co
ntrols
Younger AD
Older AD
0
10
20
30
40
50 aa
ab
b
Abs
olut
e te
lom
ere
leng
th(K
b pe
r di
ploi
d ge
nom
e)
young controls (N=30), old controls (N=26), younger AD (N=14), older AD (N=18).
Thomas et al, Mech Aging Dev, 2008
WBC TL <115 Kb per diploid genome OR of being diagnosed with AD is 10.8specificity 46% sensitivity 92.9%.
Buccal TL <40 kb per diploid genomeOR of being identified with AD is 4.6 specificity 63% sensitivity 72.7%.

FOLATEFOLATE
VITAMIN EVITAMIN E
VITAMIN DVITAMIN D
ΩΩ33--FATTY ACIDSFATTY ACIDS
CEREAL FIBRECEREAL FIBRE
MULTIVITAMIN USEMULTIVITAMIN USE
PUFAPUFA
OXIDATIVE STRESSOXIDATIVE STRESS
OBESITYOBESITY
PSYCHOLOGICAL PSYCHOLOGICAL STRESSSTRESS
PROCESSED MEATPROCESSED MEAT
HOMOCYSTEINEHOMOCYSTEINE
LONGERLONGER SHORTERSHORTERTELOMERESTELOMERES
CURRENTCURRENTKNOWLEDGEKNOWLEDGE
Int
J Obes
(Lond). 2010 Aug;34(8):1345-8; Am J Clin
Nutr. 2010 May;91(5):1273-80. Rejuvenation Res. 2009 Oct;12(5):341-9. ; Rejuvenation Res. 2009 Jun;12(3):169-76. J Nutr. 2009 Jul;139(7):1273-8; Am J Clin
Nutr. 2009 Jun;89(6):1857-63. Am J Clin
Nutr. 2007 Nov;86(5):1420-5.

FOLATE DEFICIENCY
NIACIN ORNICOTINIC
ACIDDEFICIENCY
ANTIOXIDANTDEFICIENCY
OR OXIDATIVESTRESS
8-OHdG
URACIL
HYPO-METHYLATED
SUBTELOMERE
BREAKS IN TELOMERE
REDUCEDTRF1, TRF2
BINDING
LOSS OFTELOMERE
LENGTH CONTROL
DYSFUNCTIONALAND/OR SHORT
TELOMERES;TELOMERE END
FUSIONS;AND CIN
REDUCED TANK1
ACTIVITY
?
?
?
TELOMERE DAMAGE CASCADETELOMERE DAMAGE CASCADE
Bull & Fenech Proc. Br Bull & Fenech Proc. Br NutrNutr
Soc 2008Soc 2008

High protein (TWD) or high carbohydrate (HC) weight-loss diets reverse telomere shortening in rectum in over-weight men
TWDTWD HCHC
Telo
mer
e le
ngth
(kb)
Telo
mer
e le
ngth
(kb)
0 12 52 0 12 520 12 52 0 12 52
2.62.6
5.25.2
7.87.8
10.410.4
13.013.0
15.615.6
18.218.2
0.00.0
2 way ANOVA2 way ANOVAP<0.0001P<0.0001
weeks on dietweeks on dietOO’’Callaghan, Clifton, Callaghan, Clifton, NoakesNoakes, Fenech. , Fenech. Rejuvenation Res. 2009Rejuvenation Res. 2009

IS A COMPREHENSIVE SET OF DNA IS A COMPREHENSIVE SET OF DNA DAMAGE BIOMARKERS NEEDED DAMAGE BIOMARKERS NEEDED
FOR PERSONALISED NUTRITION ANDFOR PERSONALISED NUTRITION ANDDRV DETERMINATION FOR GENOMEDRV DETERMINATION FOR GENOME
DAMAGE PREVENTION?DAMAGE PREVENTION?
LYMPHOCYTE CBMN ASSAYLYMPHOCYTE CBMN ASSAY
RBC MN ASSAYRBC MN ASSAY
BUCCAL MN ASSAYBUCCAL MN ASSAY
COMET ASSAYCOMET ASSAY
TELOMERE LENGTH MITOCHONDRIAL DNA DELETION TELOMERE LENGTH MITOCHONDRIAL DNA DELETION DNA OXIDATION DNA METHYLATIONDNA OXIDATION DNA METHYLATION
Fenech M (2010) Am. J. Fenech M (2010) Am. J. ClinClin. . NutrNutr..

Validation status of DNA damage biomarkersASSOCIATION WITH NUTRITIONAL
STATUSASSOCIATION WITH DEVELOPMENTAL
OR DEGENERATIVE DISEASE OR MORTALITY
CROSS-SECTIONAL STUDIES
PLACEBO- CONTROLLED
STUDIES
CASE-CONTROL STUDIES
PROSPECTIVE COHORT STUDIES
CYTOKINESIS-BLOCK MICRONUCLEUS ASSAY
IN LYMPHOCYTES
MICRONUCLEUS ASSAY IN BUCCAL CELLS ?MICRONUCLEUS
ASSAY IN ERYTHROCYTES
?DNA STRAND BREAKS IN LYMPHOCYTES BY
COMET ASSAY ?
DNA OXIDATION ?DNA METHYLATION ?
TELOMERE LENGTH IN LEUKOCYTES OR LYMPHOCYTES
?
MITOCHONDRIALDNA DELETION ?
DNA DNA DAMAGE DAMAGE
BIOMARKERSBIOMARKERS
Fenech M (2010) Am. J. Fenech M (2010) Am. J. ClinClin. . NutrNutr..

NUTRITIONVARIABLES
SINGLEMICRONUTRIENT
MICRONUTRIENTCOMBINATION
FUNCTIONALFOOD
FOOD GROUP
DIETARY PATTERN
STUDY DESIGN
IN VITRO MODELS
IN VIVOCROSS-
SECTIONALSTUDIES
PLACEB0-CONTROLLED
TRIALS
OUTCOME MEASURES
PRIMARY
DNA DAMAGEBIOMARKERS:
MICRONUCLEUS CYTOME ASSAYS
COMET ASSAYDNA OXIDATION
DNA METHYLATIONTELOMERE LENGTH
mtDNA DELETION
SECONDARY
TISSUEMICRONUTRIENTCONCENTRATION
DRVs FORGENOME STABILITY
DATABASESON VITAMIN & MINERAL
REQUIREMENTSFOR GENOME
STABILITYIN
DIVERSEGENETIC
BACKGROUNDSAT THE
VARIOUS LIFE-STAGES
PROPOSED ROAD-MAP TO DETERMINE DRVs FOR GENOME STABILITY
Fenech M (2010) Am. J. Fenech M (2010) Am. J. ClinClin. . NutrNutr..

LIFELIFE--STYLE HPI INDEXSTYLE HPI INDEX
LIFELIFE--STYLE IS ALSO AN IMPORTANT DETERMINANT OF DNA DAMAGESTYLE IS ALSO AN IMPORTANT DETERMINANT OF DNA DAMAGE
Huang et al Preventive Medicine 48 (2009) 383-388

NUTRINUTRI--GENOMICSGENOMICS
TOXICOTOXICO--GENOMICSGENOMICS
GENOMEGENOMEHEALTH HEALTH STATUSSTATUSOF THE OF THE
POPULATIONPOPULATION
PSYCHOPSYCHO--GENOMICSGENOMICS
LIFESTYLELIFESTYLEGENOMICSGENOMICS

AUTOMATED DIAGNOSTICSAUTOMATED DIAGNOSTICSGENOME HEALTH -
NUTRIENT STATUS -
GENOTYPE
NUTRIGENOMICSNUTRIGENOMICSEXPERT ADVICE SYSTEM
DATA BASE
INDIVIDUALISED NUTRITIONINDIVIDUALISED NUTRITIONDIETARY PATTERNS -
FUNCTIONAL FOODS -
SUPPLEMENTS
RA
DIC
AL IN
NO
VATIO
N IN
NU
TRITIO
N
VE
RIFIC
ATIO
N O
F EFFIC
AC
Y
GENOME HEALTH OPTIMISEDGENOME HEALTH OPTIMISEDDEVELOPMENTAL & DEGENERATIVE DISEASE PREVENTED
FEE
DB
ACK
TO D
ATAB
ASE
Funding: Reach 100, NCEFFFunding: Reach 100, NCEFF ABC Catalyst, DNA Doctor StoryABC Catalyst, DNA Doctor StoryFenech M (2005) Mutagenesis 20: 225Fenech M (2005) Mutagenesis 20: 225--269269

“We are at the threshold of a new era in which harm to the genome, which is the most fundamental pathology, can
be efficiently diagnosed and prevented.
A person’s DNA damage profile is likely to become the ultimate routine biomarker of health status.
Prevention of DNA damage will soon achieve its rightful place as one of the most important objectives of global
health strategies.”
Michael Fenech October 2010Michael Fenech October 2010
Felicia BulmanJulie Turner
Carolyn SalisburyPhilip ThomasJimmy Crott
Will GreenrodJosy RinaldiClare AitkenSally RecordMaryam Hor
Theodora Hua HaenJing Wu
Caroline BullNathan O’Callaghan
Wayne LeifertGlen Patten
Erin SymondsBianca BenassiSasja Beetstra
CHORI (USA)CHORI (USA)Bruce Ames, Susan Mashiyama
Natl. Ins. Natl. Ins. HlthHlth & & NutrNutr JapanJapanKeizo Umegaki, Michiyo Kimura
HUMNInternational Collaborative Project on Micronucleus frequency in human populations
•40 labs•16 countries•>12,000 subjects•>70,000 person years
Coordinating Group:Michael Fenech (Australia) ChairmanStefano Bonassi (Italy)Wushou Chang (Taiwan)Nina Holland (USA)Errol Zeiger (USA)Micheline Kirsch-Volders (Belgium)
Founded Toulouse 1997
WCH AdelaideGraeme SuthersPeter BaghurstRAH AdelaideIan Olver, Eric Yeoh
AcknowledgementsAcknowledgements
FUNDING •Kellogs Pty Ltd,•MLA•Blackmore’s,•Nutrilite/Amway•NHMRC,•Cancer Council SA, •NIH/NIAID•EUCancerRiskBio- markers Program•DPI-Victoria
THE GENOME HEALTH THE GENOME HEALTH NUTRIGENOMICS NUTRIGENOMICS
TEAMTEAMCRC DiagnosticsCRC Diagnostics
NO CONFLICT OF NO CONFLICT OF INTEREST INTEREST


OO’’Callaghan, Clifton, Callaghan, Clifton, NoakesNoakes, Fenech. Rejuvenation Res. 2009, Fenech. Rejuvenation Res. 2009
REDUCTION IN FAT CORRELATES WITH INCREASE IN TELOMERE LENGTHREDUCTION IN FAT CORRELATES WITH INCREASE IN TELOMERE LENGTH

Telomere length in older men is significantly associated with plasma folate and homocysteine
Males; r = -0.57, p = 0.004 (n = 24). Females; r = 0.092, p = 0.68 (n = 23)
Males; r = 0.42, p = 0.04 (n = 24). Females; r = -0.11, p = 0.61 (n = 23)
Telomere length is negatively correlated with plasma homocysteine in older men.
Telomere length is positively correlated with plasma folatein males but not in females.
Bull, O’Callaghan, Mayrhofer
& Fenech Rejuvenation Res (2009)

Nutritional Genomics and Nutritional Genomics and DNA Damage Diagnostics LaboratoryDNA Damage Diagnostics LaboratoryCSIRO Food & Nutritional Sciences CSIRO Food & Nutritional Sciences Seed
cells
Nutrients
Mitogen Cytochalasin B (cytokinesisblocking agent)
Nuclear stain/Fix
Image acquisition
and analysis
Minimally invasive HighMinimally invasive High--Throughput Throughput
Nutrient Array screening for GenomeNutrient Array screening for Genome--Protective agentsProtective agents..
Micronucleus
Targeted Cell
SelectedNuclei
Development of automated CBMN Cytome assay:MN, NPB, NBUDs, Necrosis, Apoptosis, NDI
+ FISH + Protein expression
9 day culture
Prof. Michael FenechProf. Michael [email protected]

Is it possible to identify the nutriome
that prevents the growth of each cancer?
One of the greatest challenges in ageing populations is the need
to prevent the proliferation of cancers which accumulate with age.
Currently there is no rational advice on the appropriate diet to
adopt once a person is diagnosed with cancer because our knowledge on nutrient-gene interaction with respect to cancers is rudimentary.
Furthermore there is concern that supplementation with certain nutrients that are required for genome maintenance and cell growth (e.g. folate, methionine) may stimulate the cancer growth

NORMAL ADENOMA NORMAL ADENOMA CANCERCANCER
FOLATE DEFICIENCYFOLATE DEFICIENCY<300 mcg/day*<300 mcg/day*
ADEQUATE FOLATEADEQUATE FOLATE300300--500mcg /day500mcg /day
EXCESSIVE FOLATEEXCESSIVE FOLATE> 1000mcg/day> 1000mcg/day
inhibits??inhibits??
inhibitsinhibits
promotespromotes
promotespromotes
FOLATE DEFICIENCYFOLATE DEFICIENCY<300 mcg/day*<300 mcg/day*
* folate deficiency increases risk of cancer initiation, dementia, stroke, osteoporosis
FOLATE: A DOUBLEFOLATE: A DOUBLE--EDGED SWORD IN CANCER EDGED SWORD IN CANCER DEPENDING ON DOSE AND TIMINGDEPENDING ON DOSE AND TIMING
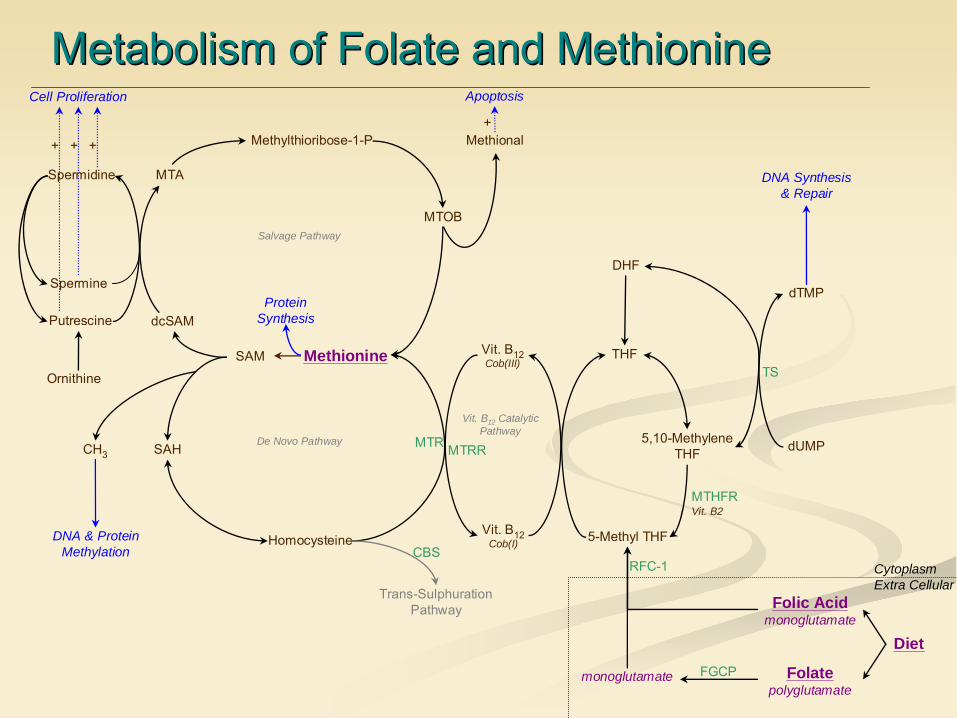
Metabolism of Folate and MethionineMetabolism of Folate and Methionine
DHF
THF
5,10-Methylene THF
5-Methyl THF
MTHFRVit. B2
Homocysteine
MethionineSAM
SAHCH3
DNA & Protein Methylation
Methylthioribose-1-P
MTOB
Methional
MTA
dcSAMPutrescine
Ornithine
Spermidine
Spermine
Cell Proliferation
+ + +
Protein Synthesis
Salvage Pathway
Apoptosis
+
Vit. B12Cob(III)
Vit. B12Cob(I)
Trans-Sulphuration Pathway
De Novo Pathway
Vit. B12 CatalyticPathway
MTR MTRR
CBS
Folatepolyglutamate
monoglutamate
Diet
RFC-1
Folic Acidmonoglutamate
FGCP
dTMP
dUMP
DNA Synthesis & Repair
TS
CytoplasmExtra Cellular

A nutrient array system could interrogate which nutrient restrictions or supplementations could control any cancer
Cancers are genetically and epigenetically very different from normal tissue in the same person and from each other across persons.
The multiple mutations in a cancer may make it difficult to rely
on genotyping or gene expression patterns to work out an appropriate dietary control strategy.
Some cancers amplify the high affinity folate
receptor and may benefit from folate
restriction.
Other cancers may have defects in methionine
metabolism making them susceptible to methionine
restriction
A nutrient array system could identify the appropriate nutriome
to control a cancer without knowing its genotype/epigenotype

PERSONALISED NUTRIOMES FOR GENOME STABILITY OF STEM CELL & iPS
CELL CULTURES
We now live in an era when stem cells are taken out of the body and expanded in vitro before being returned to the body
Stem cell or iPS
cell cytogenetic abnormalities constitute a roadblock to regenerative therapies because they increase the rate of senescence and the risk of oncogenic
transformation.
Determining the optimal nutriome
in culture medium that prevent chromosomal instability for each stem cell or iPS
culture is therefore important not only to predict in vivo requirements but also in vitro nutrient requirements for DNA damage prevention

Acknowledgement S Acknowledgement S ThuretThuret
(University College London) (University College London)
REGENERATIVE POTENTIAL REGENERATIVE POTENTIAL OF THE HIPPOCAMPUSOF THE HIPPOCAMPUS
REGENERATIVE POTENTIAL REGENERATIVE POTENTIAL OF THE BUCCAL MUCOSAOF THE BUCCAL MUCOSA
The oral epithelium is a stratified squamous epithelium. It consists of four layers:
The keratinised layer at the surface
The prickle cell layer
The basal layer
Lamina propria
7-10 daysfor cells to migrate from basal layer to keratinised layer

MICRONUCLEI
YOUNGER CONTROLS
DOWNSOLDER C
ONTROLSALZHEIM
ER
0
1
2
3 p = 0.0003
KARYORRHEXIS
YOUNGER CONTROLS
DOWNSOLDER C
ONTROLSALZHEIM
ER
0
10
20
30
40
50
60p<0.0001
CONDENSED CHROMATIN
YOUNGER CONTROLS
DOWNSOLDER C
ONTROLSALZHEIM
ER
0
25
50
75 p<0.0001
BASAL CELLS
YOUNGER CONTROLS
DOWNSOLDER C
ONTROLSALZHEIM
ER
0
25
50
75
100
p<0.0001
Buccal Micronucleus Cytome is a powerfulBuccal Micronucleus Cytome is a powerfuldiagnostic of accelerated ageingdiagnostic of accelerated ageing Fenech & Thomas 2007 Mutagenesis
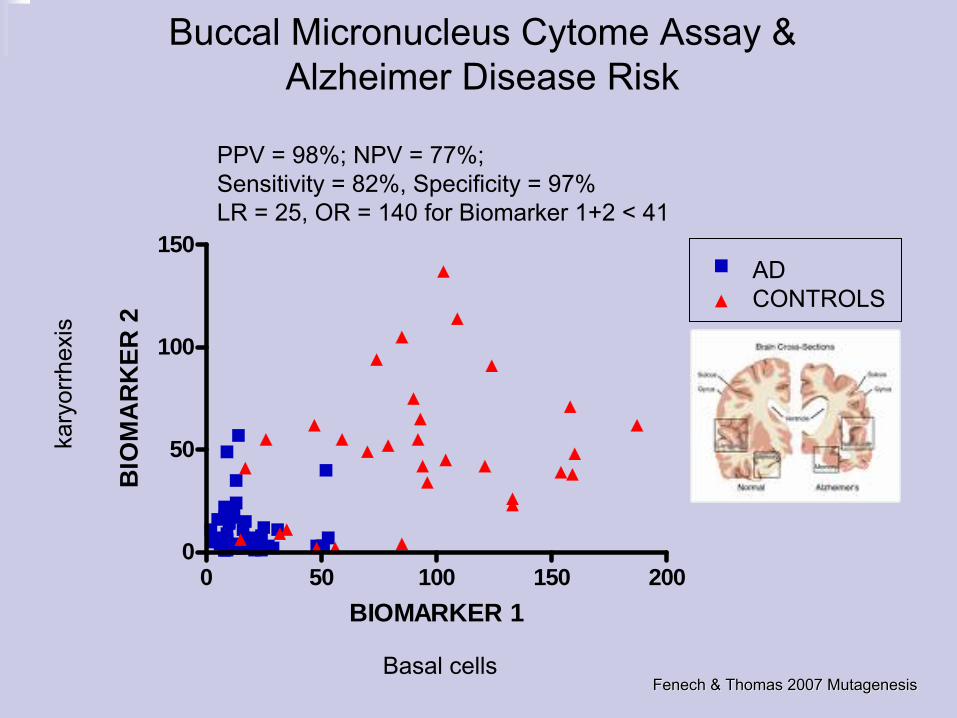
0 50 100 150 2000
50
100
150AD & MCICONTROLS
BIOMARKER 1
BIO
MA
RK
ER 2
Basal cells
kary
orrh
exis
PPV = 98%; NPV = 77%; Sensitivity = 82%, Specificity = 97%LR = 25, OR = 140 for Biomarker 1+2 < 41
ADCONTROLS
Fenech & Thomas 2007 Mutagenesis Fenech & Thomas 2007 Mutagenesis
Buccal Micronucleus Cytome Assay &Alzheimer Disease Risk

a) Polychromatic erythrocyte with micronuclei
b) Polychromatic erythrocyte with micronuclei
c) Mature erythrocytes with micronuclei
d) Polychromatic erythrocyte (bright orange) and mature erythrocyte.
PCE
Micronuclei in Mature and immature erythrocytes
WT CON
AD CON
AD CUR
AD GSE
AD MGSE
0
1
2
3
4
5
Micronucleated PCE at 9 monthsOne way ANOVA p=0.004
a
a
b
ab ab
Freq
uenc
y of
mic
ronu
clea
te P
CE'
spe
r 10
00 P
CE'
sDNA damage inbone marrow cells
Micronucleated cells at 9 months
WT CON
ADCONAD C
UR
AD GSE
AD MGSE
0.000.050.100.150.200.250.300.350.400.450.500.550.600.65
One way ANOVA p<0.0001
a
a
b b
a
Freq
uenc
y of
buc
cal c
ells
with
MN
(% o
f tot
al c
ells
sam
pled
) 3a) Basal cell 3b) Normal differentiated Cell
3c) Basal with MN 3d) Differentiated with MN
3e) Early karyolytic 3f) Mid karyolytic
3g) late karyolytic
DNA damage in Buccal cells
Effects of polyphenol consumption on Ab levels in the brain and serum of APPSwe/PS1dE9 transgenic mice
Effects of polyphenol consumption on Ab plaque burden in brain section spanning hippocampus of APPSwe/PS1dE9 transgenic mice
Protective effects of grape seed polyphenol and curcumin consumption on Aβ plaque burden in brain section spanning hippocampus and DNA damage in blood and buccal cells of APPSwe/PS1dE9 transgenic mice
Thomas P et al 2008; Wang J et al 2009Thomas P et al 2008; Wang J et al 2009


A B C
D E
F G H
CYTOME CYTOME
Fenech M 2007 Nature ProtocolsFenech M 2007 Nature Protocols
CYTOME &DNA DAMAGE
NUTRIOMENUTRIOME
Fenech 2008Fenech 2008

Folate
and mtDNA deletions
Chou and Huang (2009) EJN 48:429-436
Accumulated lymphocytic mtDNA deletions depend upon (a) dietary folate deprivation,(b) depletion of cellular folate storage
Lymphocyte mtDNA
deletions are +vely
correlatedwith brain mtDNA
deletions (r = 0.917, P < 0.0001).Department of Nutritional Science, Fu-Jen University, Hsinchuang
242, Taipei County, Taiwan.

Folate/B12choline deficiency Uracil
CytosineHypome-thylation
OxidisedDNAbases
DNA breakmisrepair
UnrepairedDNA breaks
UnrepairedDNA adducts
Dicentricchromosomes
Acentric Chromosomefragments
Telomeredysfunction
Centromeredysfunction
Telomere shortening
Telomereend fusion
BaseSequencemutationor deletion
ChromosomeLoss orMalsegregation, Micronucleusformation
mtDNAdeletion
Micronucleus formation
Anaphase bridge formation
BFBCYCLES
CHROMOSOMEINSTABILITYPHENOTPYE&ABERRANTKARYOTYPE
ACCELERATEDSENESCENCE
Deficiencyof antioxidantVitamins andCofactors ofAntioxidantenzymes
Deficiency ofCofactorsof DNARepair enzymes
POSSIBLE MECHANISMS BY WHICH MICRONUTRIENT DEFICIENCY POSSIBLE MECHANISMS BY WHICH MICRONUTRIENT DEFICIENCY COULD CAUSE DAMAGE TO THE GENOMECOULD CAUSE DAMAGE TO THE GENOME

Ageing causes Ageing causes hypomethylationhypomethylation
of satellite DNA which of satellite DNA which leads to loss of leads to loss of chch
1, 9, 16 and micronucleus formation1, 9, 16 and micronucleus formation
05
101520253035404550
YOUNG32PDLs
OLD71PDLs
AZAC 33PDLs
Mned cells(%)Bright Mni(%)
Suzuki et al. 2002 Exp. GerontologySuzuki et al. 2002 Exp. Gerontology


THE HORMESIS HYPOTHESIS OF THE HORMESIS HYPOTHESIS OF CALORIC/NUTRIENT RESTRICTIONCALORIC/NUTRIENT RESTRICTION
VISFATINVISFATIN
SIRT1SIRT1
Caloric Caloric RestrictionRestrictionMimeticsMimetics
Protein/Protein/MethionineMethioninerestrictionrestriction
KNOWN KNOWN CALORICCALORICRESTRICTION RESTRICTION MIMETICS:MIMETICS:
XENOHORMETIC AGENTS??XENOHORMETIC AGENTS??

DISCOVERY OF CALORIC RESTRICTION MIMETICSDISCOVERY OF CALORIC RESTRICTION MIMETICSDECELERATED AGEING
ACCELERATED AGEING
DAMAGEDGENOME
HEALTHYGENOME
EXCESSFAT
OPTIMALFAT LEVEL
SIRTUIN DEACETYLASEACTIVATION
NAD
RESVERATROL
PPAR-γ
+
-
NICOTINIC ACIDTRYPTOPHAN
•DNA repair•Oncogenes silenced•Compact chromatin
•Oxidants•Excess Calories•DNA misrepair
Howitz
et al Nature 2004

ENVIRONMENTAL STRESSORS(work, home, neighbourhood)
MAJOR LIFE EVENTS TRAUMA, ABUSE
INDIVIDUAL DIFFERENCES(genes,development, experiences)
PERCEIVED STRESSBEHAVIOURAL RESPONSES(fight or flight, smoking, drink,diet, exercise)
PHYSIOLOGICAL RESPONSE
ALLOSTASIS ADAPTATION
ALLOSTATIC LOAD
McEwen BS McEwen BS PhysiolPhysiol
Rev (2006)Rev (2006)

2010 May 25;5(5):e10826
CorrelationsCorrelations

LIFELIFE--STYLE HPI INDEXSTYLE HPI INDEX
LIFELIFE--STYLE IS ALSO AN IMPORTANT DETERMINANT OF DNA DAMAGESTYLE IS ALSO AN IMPORTANT DETERMINANT OF DNA DAMAGE
Huang et al Preventive Medicine 48 (2009) 383-388

••DNA DAMAGE IS THE MOST FUNDAMENTAL DISEASEDNA DAMAGE IS THE MOST FUNDAMENTAL DISEASE
••DNA DAMAGE CAN BE EFFICIENTLY DIAGNOSEDDNA DAMAGE CAN BE EFFICIENTLY DIAGNOSED
••DNA DAMAGE CAN BE PREVENTEDDNA DAMAGE CAN BE PREVENTED
••DNA DAMAGE DIAGNOSTICS SHOULD BECOME ROUTINE DNA DAMAGE DIAGNOSTICS SHOULD BECOME ROUTINE IN INTEGRATIVE & PREVENTIVE MEDICINE PRACTICESIN INTEGRATIVE & PREVENTIVE MEDICINE PRACTICES

AUTOMATED DIAGNOSTICSAUTOMATED DIAGNOSTICSGENOME HEALTH -
NUTRIENT STATUS -
GENOTYPE
NUTRIGENOMICSNUTRIGENOMICSEXPERT ADVICE SYSTEM
DATA BASE
INDIVIDUALISED NUTRITIONINDIVIDUALISED NUTRITIONDIETARY PATTERNS -
FUNCTIONAL FOODS -
SUPPLEMENTS
RA
DIC
AL IN
NO
VATIO
N IN
NU
TRITIO
N
VE
RIFIC
ATIO
N O
F EFFIC
AC
Y
GENOME HEALTH OPTIMISEDGENOME HEALTH OPTIMISEDDEVELOPMENTAL & DEGENERATIVE DISEASE PREVENTED
FEE
DB
ACK
TO D
ATAB
ASE
Funding: Reach 100, NCEFFFunding: Reach 100, NCEFF ABC Catalyst, DNA Doctor StoryABC Catalyst, DNA Doctor StoryFenech M (2005) Mutagenesis 20: 225Fenech M (2005) Mutagenesis 20: 225--269269

NETWORK OF GENES ASSOCIATED WITH MN NETWORK OF GENES ASSOCIATED WITH MN FORMATION BASED ON DATA IN LITERATURE FORMATION BASED ON DATA IN LITERATURE Dedicated network showing Dedicated network showing
customised MNcustomised MN--related generelated gene––genegene interactions with p53 as central hub interactions with p53 as central hub
and validated against actual and validated against actual occurrence of MN in exposed occurrence of MN in exposed
individuals has been constructedindividuals has been constructed
Van Van LeeuwenLeeuwen
DM et al Mutagenesis (in press)DM et al Mutagenesis (in press)
WHAT IS THE GENE EXPRESSION PATTERN ASSOCIATED WHAT IS THE GENE EXPRESSION PATTERN ASSOCIATED WITH MICRONUCLEUS FORMATION?WITH MICRONUCLEUS FORMATION?