dietary intake of aflatoxins from spices and risk assessment
TRANSCRIPT

Dietary intake of aflatoxins from spices and risk assessment
Vasanthi SiruguriScientist ‘D’ (Assistant Director)
Food & Drug Toxicology Research CentreNational Institute of Nutrition (ICMR)
Hyderabad-500007&
Ramesh V BhatInternational Food Safety Specialist
M-11, Kakateeyanagar, Habsiguda, Hyderabad-500007
12th World Spice Congress 2014-Cochin, India 16th-20th February 2014

- Aflatoxin risk : Cereals vs spices- Trends on worldwide regulations for aflatoxins:
Codex, EU, other countries.- Risk assessment need: dietary intake & exposure- Existing data on dietary intake and levels of aflatoxins- Methodology of data collection- Preliminary data on intake- frequency/quantity
consumed- Conclusions and Way ahead
Presentation coverage
2

Food Use in the diet Level of intake
Risk of exposure
Maize StapleSnack
Breakfast cereal
HighLowLow
HighLowLow
Rice Staple High Low-Medium
Groundnut Snack/sauce Low, Medium Low ,Medium, High
Spices Flavouring Low? Low?
The Food Aflatoxin Risk
3

R. chillies, B. pepper, Nutmeg
Turmeric, Ginger Mace, Cloves, Cardamom, Cinnamon, Cumin, Coriander, Fennel
Frequency of detection
High Medium Low
Risk assessment = (Hazard) (Exposure)
Spices & aflatoxin risk
?Aflatoxin problem in different spices?Intake of spices: How much? How often? How long?
Data available? 4
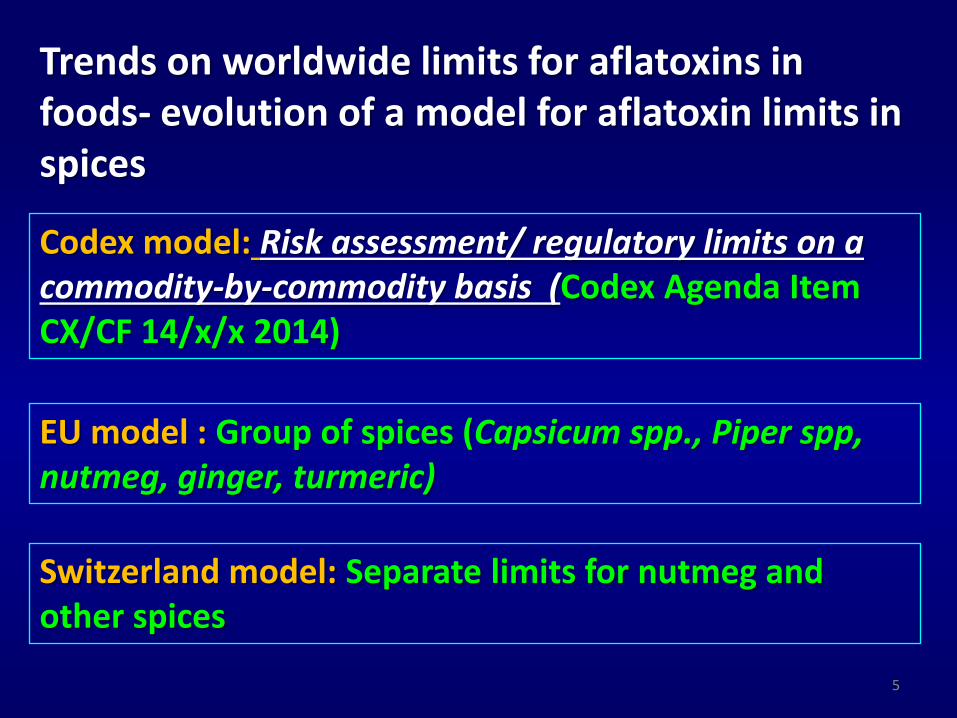
Trends on worldwide limits for aflatoxins in foods- evolution of a model for aflatoxin limits in spices
Codex model: Risk assessment/ regulatory limits on a commodity-by-commodity basis (Codex Agenda Item CX/CF 14/x/x 2014)
EU model : Group of spices (Capsicum spp., Piper spp, nutmeg, ginger, turmeric)
Switzerland model: Separate limits for nutmeg and other spices
5

Existing regulatory limits for mycotoxins in spices
Country Component *AFB1 *AFT *OTA
Bulgaria Spices 2 5 10
Czech Republic Spices 20 -
Serbia & Montenegro
Spices 30
EU Member states Spices (Capsicum spp., Piper spp, nutmeg, ginger, turmeric)
5 10 -
Finland All spices 10 -
Hungary Spices 5 10 -
Switzerland NutmegSpices
105
2010
20
Turkey Spices 5 10 -
Uruguay Spices 5 20 -
*AFB1: Aflatoxin B1; AFT: Total aflatoxins (B1, B2, G1, G2); OTA: Ochratoxin 6

Recent international deliberations on maximum limits (MLs)
Codex Alimentarius Commission- Risk assessment/ regulatory limits on a commodity-by-commodity basis (Discussion paper on aflatoxins in cereals-Codex Agenda Item CX/CF 14/x/x 2014)
- Proposal to fix 10ppb for all foods-no consensus by member countries.-Difficult to establish single level for all foods.-Maximum levels to be established on a commodity-
by-commodity basis
7
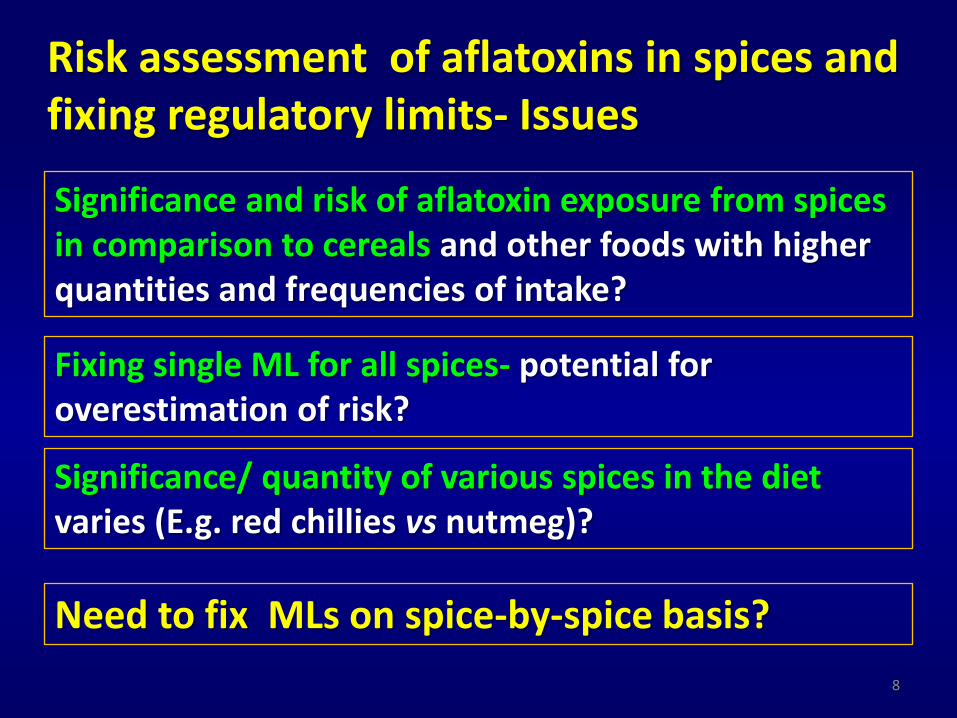
Risk assessment of aflatoxins in spices and fixing regulatory limits- Issues
Significance and risk of aflatoxin exposure from spices in comparison to cereals and other foods with higher quantities and frequencies of intake?
Fixing single ML for all spices- potential for overestimation of risk?
Significance/ quantity of various spices in the diet varies (E.g. red chillies vs nutmeg)?
Need to fix MLs on spice-by-spice basis?
8

Requirements for risk assessment of aflatoxinsfrom spices
-Generation of consumption data on individual spices.
-Generation of aflatoxin data in various spices such as mace, cardamom, cinnamon, etc.
-Harmonization of methodologies for dietary intake and risk assessment of aflatoxins from spices based on JECFA & margin of exposure (MOE) procedures.
9

Challenges of measuring intake of spices
Mixed?Individual?
Whole?Powdered?
Intake?
10

Currently used approaches used for estimating dietary intake of spices & applicability to estimating aflatoxin intake
Method Applicability
1.Food frequency methods: No. of times consumed (weekly/monthly).
Simple, easy to collect information; Useful for screening consumers/non-consumers. Qualitative/semi-quantitative
2.Recall methods (24 hr)- amount of spice used/consumed previous 24 hrs
Relies on responders’ memory, but more quantitative than (1).
3.Food records: record on type and amount of spices consumed during a defined period by respondent;
Relies on responders’ ability to record correctly/literacy level
4.Estimating portion size consumed- weigh amt of spice used per dish, total amount of dish prepared, portion size consumed and estimating intake of spice/portion consumed.
More realistic quantification than (1) or (2), time consuming, restricted sample size (that is practical/convenient)
5. International food databases (GEMS/FAOSTATS)
Provide gross estimates of intake from consumption figures from different countries. Difficult to interpret at the individual level. 11

Study on Dietary intake of aflatoxins from spices and risk assessment (Initiated with
support from Spices Board GOI/ World Spice Organization
PI: Dr. Ramesh V BhatInternational Food Safety Specialist
12

-To review relevant literature/databases on aflatoxincontamination in selected spices including dried red chillies,black pepper and nutmeg, in various countries.
-To review available literature on dietary intake of spices invarious countries.
-To assess the dietary intake of spices through dietary survey inconsumers belonging to different socio-economic groups (high,medium and low) in a selected region through apredetermined food frequency questionnaire.
-To perform risk assessment of aflatoxin exposure from spicesfrom data obtained on aflatoxin levels and dietary surveys.
Dietary intake of aflatoxins from spices and risk assessment - Objectives
13

Methodology
1.Literature review: Search Public domain/international crop &
food intake databases for available literature on aflatoxin contaminationin selected spices and spice intake data in various countries.
2.Conduct a limited diet survey in different socio-economic
population groups in a selected region in Hyderabad using a pretestedfood frequency questionnaire. Data collection on frequency and quantityof spice consumption in selected households.
3.Estimate intake of aflatoxin from spices based on the data
obtained from food frequency surveys as in (2) and aflatoxin levels inspices as available from literature/government reports/internationaldatabases.
4. Perform risk assessment of aflatoxin exposure fromspices according to JECFA and MOE approaches and evaluate in
relation to tolerance limits established in selected countries incomparison to that obtained from cereals.
14

Progress of work done:
1.Literature review on available data naturaloccurrence of aflatoxins in spices, intake of spices &aflatoxin exposure from spices in various countries :
Reviewedi) 15 published reports/studies/databases available on
spice intake from different countries;
ii) 85 published reports/reviews/studies on occurrenceof mycotoxins in spices in different countries.
15

Aflatoxin levels in spices-reported data
Spice Aflatoxin levels (g/kg)
No. of studies referred (1975-2013)
Chillies (red, paprika) <1-969 28
Black pepper <1-60 16
Nutmeg <1-378 12
Ginger <1-26 8
Cinnamon <1-53 7
Cumin seeds <1-35 6
Turmeric <1-9 4
Coriander seeds <1-15.6 4
Anise 28-38 1
Omum(Carumcopticum)
4-7 1
Mace Not available Not available 16

EU Notifications from Rapid Alert Systems for Food & Feed (RASFF) on mycotoxins in spices imported from India (1999-2014)
Spice No. of notifications
Aflatoxin levels (g/kg) OTA(g/kg)
AFB1 AFT
Chillies (red, paprika)
148 7-22 8-10
Nutmeg 30 5-230; Max:700
6-249; Max: 1200
23-120
Curry powder
41 6-62 7-47 20-36
Turmeric 14 5-115 8-116
Ginger 16 7-16 14-30
Cloves 1 2917
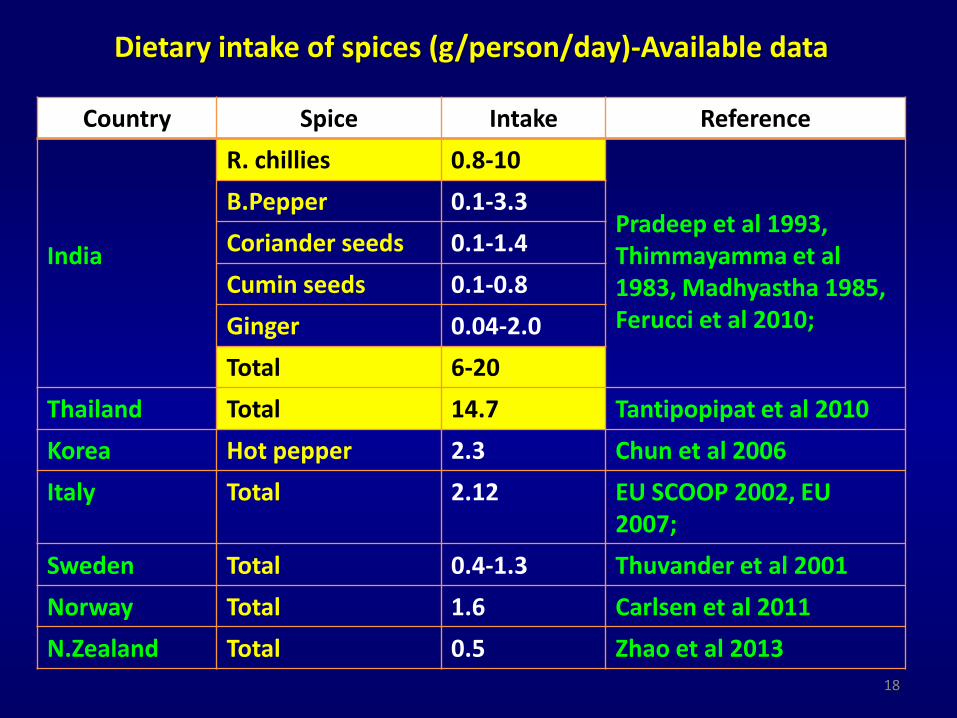
Dietary intake of spices (g/person/day)-Available data
Country Spice Intake Reference
India
R. chillies 0.8-10
Pradeep et al 1993, Thimmayamma et al 1983, Madhyastha 1985, Ferucci et al 2010;
B.Pepper 0.1-3.3
Coriander seeds 0.1-1.4
Cumin seeds 0.1-0.8
Ginger 0.04-2.0
Total 6-20
Thailand Total 14.7 Tantipopipat et al 2010
Korea Hot pepper 2.3 Chun et al 2006
Italy Total 2.12 EU SCOOP 2002, EU 2007;
Sweden Total 0.4-1.3 Thuvander et al 2001
Norway Total 1.6 Carlsen et al 2011
N.Zealand Total 0.5 Zhao et al 2013
18

Dietary intake of spices- European data from WHO GEMS database 2006; JECFA 2008;
Spice Intake (g/person/day)GEMS Cluster countries (Europe)
B D E F
Hops dry 0.1 0.1 0.3 0.1
Anise Badian Fennel 0.2 0.1 0.3 0.1
Nutmeg Mace Cardamom 0 0 0.1 0.1
Parsley 2.8 2.0 3.0 1.0
Pepper white/long/black 0.1 0.1 0.4 0.3
Pimento Allspice 0.4 0.5 0.6 0.2
Spices Not elsewhere specified
0.3 0.1 0.1 0.3
Total spices 1.1 0.9 1.8 1.1
19
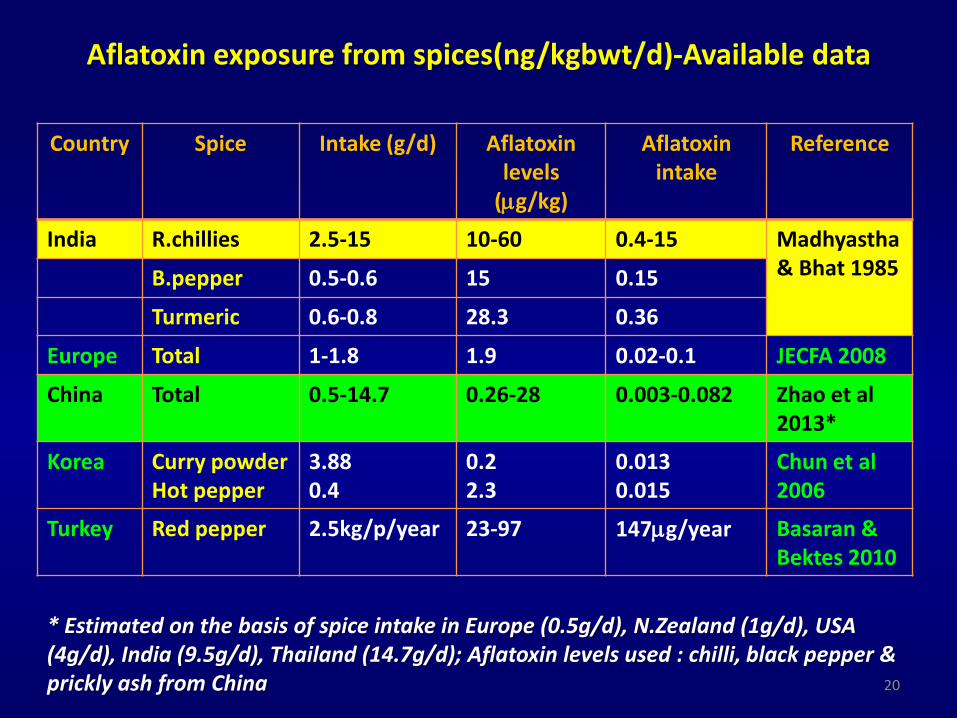
Aflatoxin exposure from spices(ng/kgbwt/d)-Available data
Country Spice Intake (g/d) Aflatoxin levels
(g/kg)
Aflatoxinintake
Reference
India R.chillies 2.5-15 10-60 0.4-15 Madhyastha& Bhat 1985B.pepper 0.5-0.6 15 0.15
Turmeric 0.6-0.8 28.3 0.36
Europe Total 1-1.8 1.9 0.02-0.1 JECFA 2008
China Total 0.5-14.7 0.26-28 0.003-0.082 Zhao et al 2013*
Korea Curry powderHot pepper
3.880.4
0.22.3
0.0130.015
Chun et al 2006
Turkey Red pepper 2.5kg/p/year 23-97 147g/year Basaran & Bektes 2010
* Estimated on the basis of spice intake in Europe (0.5g/d), N.Zealand (1g/d), USA (4g/d), India (9.5g/d), Thailand (14.7g/d); Aflatoxin levels used : chilli, black pepper & prickly ash from China 20

2. Preparation of weights & measures chart for different spices used in Indian dietaries-Standardization under progress
-Determining unit weights of each spice with portable balance (YAMASA Japan) and validating with electronic balance.-Determining weights of household measures of spices (whole & powdered :tsp, tbsp, cup, etc.)
21

Standardization of weights/household measures of various spices
Spice Unit wt (g)* Household measure (whole spice)*
1tsp 1tbsp
Household measure (powdered spice)*
1/4tsp 1tsp 1tbsp
Cardamom 0.230±41.3 2.8±0.16 8.9±0.89 0.72±0.04 2.43±0.06 -
Cloves 0.75±16.3 2.86±0.25 9.65±0.51 0.82±0.01 2.69±0.1 -
Cinnamon 1.144±0.56 - - 0.62±0.03 1.91±0.09 -
R.Chillies 0.74±0.09 - - 0.8±0.05 2.37±0.08 8.5±0.37
Nutmeg 4.4±0.52 - - 0.63±0.04 2.35±0.17 -
Mace 0.93±0.36 - - - - -
B.pepper - 4.38±0.28 11.4±0.55 0.88±0.03 2.86±0.12 -
*Means are for 6 weights
22

3.Dietary intake of spices- development of questionnaire
-A food frequency and quantity questionnaire prepared to collect information on:-Frequency of usage of different spices in dietaries, qty purchased per time.-Qty of spice used per preparation of a dish & portion size of dish consumed by weighment.-Model form is given in the following slide
23

Sex 0-1 1-5 5-12 12-18 18 Total Family income
Male
Females
Total
Dietary intake of aflatoxins from spices and risk assessmentFood frequency & quantity questionnaire for spices
Identification particulars:S.No. Date:1. Name of locality2. Address3. Name of respondent4. Language spoken5. Socio-economic status:6. Occupation7. Family size/composition
Food frequency questionnaire for estimating intake of spices
Page 1
24

Name of Spice Frequency of usage Source of
purchase (retail,
wholesale, local
market)
Qty
purchase
d/time
Cost (Rs./-)
Never Daily 3/wk 2/wk 1/wk 1/month
Chilli powder
Black pepper
Cloves
Cardamom
Nutmeg
Mace
Cinnamon
Curry powder
Rasam powder
Sambar powder
Garam masala
Coriander seeds
Cumin seeds
Asafoetida
Fenugreek seeds
Omum
Shahzeera
Poppy seeds
Turmeric
Aniseed(Saunf)
Any other
(specify)
8. Usage of Spices: Page 2
25

Recipe Spice *(Code)
Qty used (Tsp, Tbsp, gms)
Frequency of preparation
Amt of recipe made (No. of servings)
No. of Portions consumed (Adult)
Qty of spice consumed
Curry
(Vegetable,
other)
Chutney
Dhal
Rice
Salad
Spice mix (curry
powder. Rasam
powder,
sambhar
powder, garam
masala, any
other)
Snacks
Sweets/desserts
Festive
occasions
9. Qty of spice used Page 3
26

Estimation of dietary intake of spices from the diet survey
Mode of estimation Data estimated
Frequency of use (daily/weekly/monthly/occasionally)
Freq of spice intake. Rank spices most used. Identify consumers.
Qty of spice purchased per time (once a week/fortnight/month)
Qty of spice intake (g/person/day) =(qty purchased/time)/no. of persons consuming)
Qty of spice used per preparation (weight in gms: tsp/ tbsp/cup). Weigh amt of spice used & portion size of dish consumed.
Qty of spice consumed (g/person/day) =(Qty of spice used/dish)/total qty of dish prepared x No. of portions consumed/person
27

Usage of spices-preliminary data from households in Hyderabad
Spice Rank in order of use
Frequency of use(%households)
Daily Weekly Monthly Never
R.chillies, turmeric 1 100
Cumin seeds 2 86 14
Coriander seeds 3 57 14 29
Fenugreek seeds 4 43 43 14
B.Pepper 5 86 14
Cardamom 6 86 14
Cloves 7 71 29
Cinnamon 8 57 43
Caraway seeds 9 57 28 14
Carom seeds 10 14 43 43
Mace 11 29 71
Nutmeg 12 14 8628

Intake of spices-Preliminary data using Food frequency & quantity questionnaire
Spice Usage/household/day (g) Intake/person/day (g)
Per day Per week Per day Per week
R.chillies 1.0-13 0.7-4.0
Turmeric 5-8.3 0.7-4.0
Cumin seeds 3.3-8.3 0.5-3.0
Coriander seeds
6.7-17 0.1-0.8 5.8
Fenugreek seeds
0.25-8.3 3 0.8
Black pepper 0.9
Cardamom 0.1-2.4 0.01-0.4
Cloves 0.02-2.7 0.01-0.9
Cinnamon 0.04-3.4 0.01-1.14
Caraway seeds 0.3-2.5 0.13-0.84
Carom seeds 0.5-1.0 0.12-0.2529
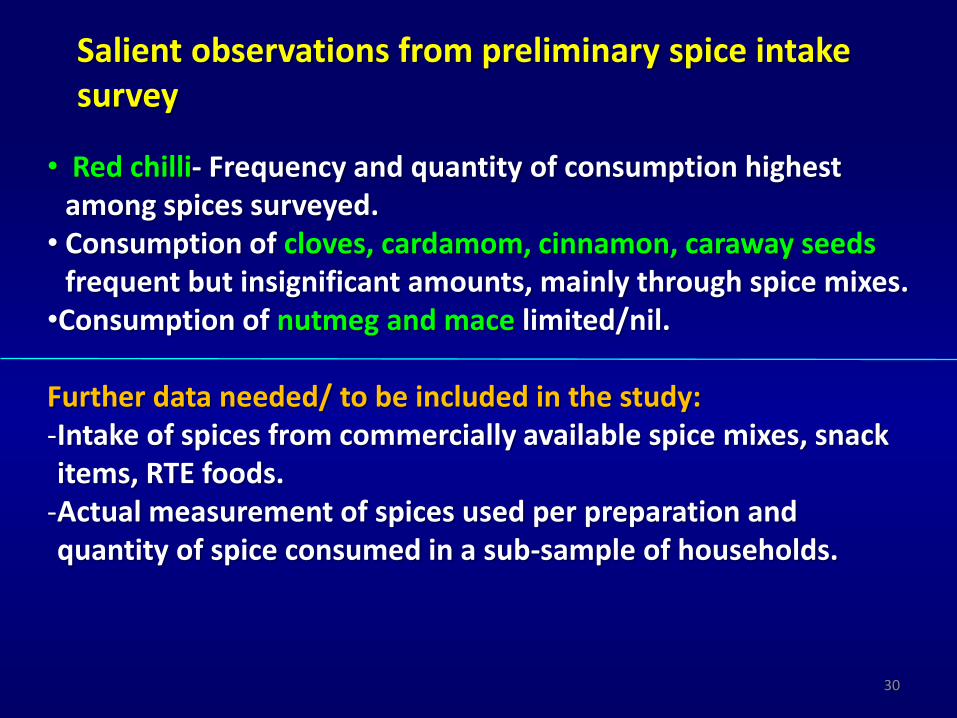
Salient observations from preliminary spice intake survey
• Red chilli- Frequency and quantity of consumption highest among spices surveyed.
• Consumption of cloves, cardamom, cinnamon, caraway seeds frequent but insignificant amounts, mainly through spice mixes.
•Consumption of nutmeg and mace limited/nil.
Further data needed/ to be included in the study:-Intake of spices from commercially available spice mixes, snack items, RTE foods.-Actual measurement of spices used per preparation and quantity of spice consumed in a sub-sample of households.
30

4. Estimating aflatoxin intake from spices
-Level of spice intake for each spice obtained from diet survey will be determined on individual basis based on income status.-Aflatoxin levels from available studies will be used to estimate aflatoxin intake from each spices.-Exposure estimation:Exposure (ng/kg bodyweight/day)=(Contamination level) (Amount consumed)/ Body weight(kg)
31

5. Performing Risk assessment of aflatoxin exposure from spices-1
Risk assessment of aflatoxin exposure by JECFA risk assessment procedure:Carcinogenic potency of AFB1 x AFB1 intake (ng /kg bwt/dayPotency= 0.01 X (1-P) + 0.3 X (P)Where,P=prevalence of HBV infection as per presence of HBsAg in serum.In the absence of HBsAg: 0.01 cases /year/100,000 population per ng of AFB1/kg bwt/dayIn the presence of HBsAg: 0.3 cases /year/100,000 population per ng of AFB1/kg bwt/day.
32

Risk assessment as per MOE approach:
MOE : the ratio between a toxicological threshold (such as the BMDL) and the intake. MOE lower than 10000 may indicate a public health concern (EFSA, 2005 &2007).Rodent BMD lower limit for 10% increased risk, taken as 170 ng/ kg body wt/day.Human BMD lower limit for 10% increased risk, taken as 870 ng /kg body weight /day.Human BMD lower limit for 1% increased risk, taken as 78 ngkg body weight /day
5. Performing Risk assessment of aflatoxin exposure from spices-2
33

Conclusions
- Codex ,since the last two decades, has been suggesting commodity by commodity basis for fixing MLs for aflatoxins in foods. This may be more relevant & important to spices (spice-by-spice basis).
- Taking intake data for all spices together for estimating aflatoxinexposure would lead to over estimation. (E.g. WHO GEMS data & Chinese data)
- Chilli is a high risk spice for aflatoxin contamination & consumption is universal vs other spices, where contamination is low, consumption is less frequent.
- Data on aflatoxin exposure has to emerge based on intake/frequency/risk assessment of individual spices
34

Way Ahead for MLs of aflatoxins in spices
1. Position paper on aflatoxin in spices be prepared for submission to Codex by Dec 2014.
2. Dietary intake of each spice/frequency data be generated.
3. Proper risk assessment study be completed before Dec 2014.
4. Data generated be published in a peer reviewed Journal
35

Acknowledgements
Grateful thanks to the World Spice Congress and the Spices Board, Government of India for financial support and sponsoring the project on Dietary intake of aflatoxins from spices and risk assessment.
36