dietary-induced alterations in thyroid hormone metabolism during
TRANSCRIPT

Dietary-induced Alterations in Thyroid
Hormone Metabolism during Overnutrition
ELLIOT DANFORTH, JR., EDWARD S. HORTON, MAUREEN O'CONNELL, andETHAN A. H. SIMS, Metabolic Unit, Department of Medicine, University ofVermont, Burlington, Vermont 05405
ALBERT G. BURGER, Thyroid Research Unit, Division of Endocrinology,Department of Medicine, University of Geneva, Geneva, Switzerland
SIDNEY H. INGBAR, Beth Israel Hospital, Harvard Medical School, Boston,Massachusetts 02115
LEWIS BRAVERMAN and APoSTOLOs G. VAGENAKIS, Endocrinology Divisions,Departments ofMedicine, University ofMassachusetts, Worcester, Massachusetts01605
A B S T R A C T Diet-induced alterations in thyroidhormone concentrations have been found in studies oflong-term (7 mo) overfeeding in man (the VermontStudy). In these studies ofweight gain in normal weightvolunteers, increased calories were required to main-tain weight after gain over and above that predictedfrom their increased size. This was associated with in-creased concentrations of triiodothyronine (T3). Nochange in the caloric requirement to maintain weightor concentrations ofT3 was found after long-term (3 mo)fat overfeeding.
In studies of short-term overfeeding (3 wk) the serumconcentrations of T3 and its metabolic clearance wereincreased, resulting in a marked increase in the produc-tion rate of T3 irrespective of the composition of thediet overfed (carbohydrate 29.6+2.1 to 54.0+3.3, fat28.2±3.7 to 49.1±3.4, and protein 31.2+2.1 to 53.2+3.7,ug/d per 70 kg). Thyroxine production was unaltered byoverfeeding (93.7+6.5 vs. 89.2±4.9 ,ug/d per 70 kg). Itis still speculative whether these dietary-induced al-terations in thyroid hormone metabolism are responsiblefor the simultaneously increased expenditure ofenergyin these subjects and therefore might represent animportant physiological adaptation in times of caloricaffluence.
Portions of these studies were presented at the XIth ActaEndocrinology Congress, Lausanne, Switzerland, 19-23June 1977 (Acta Endocrinol. 85: 84), the Annual Meeting ofthe American Federation for Clinical Research, Atlantic City,N. J., 2 May 1976 (Clin. Res. 24: 271A), and the AnnualMeeting of the American Diabetes Association, New York,15-17 June 1975 (Diabetes. 24: 406).Received for publication 12 June 1978 and in revised form
23 July 1979.
1336
During the weight-maintenance phases of the long-term overfeeding studies, concentrations of T3 wereincreased when carbohydrate was isocalorically sub-stituted for fat in the diet. In short-term studies theperipheral concentrations of T3 and reverse T3 foundduring fasting were mimicked in direction, if not indegree, with equal or hypocaloric diets restricted incarbohydrate were fed.
It is apparent from these studies that the caloriccontent as well as the composition of the diet, specifi-cally, the carbohydrate content, can be important factorsin regulating the peripheral metabolism of thyroidhormones.
INTRODUCTION
An unexpected finding in the Vermont studies ofexperimental obesity in man (1) was that lean volunteerswho gained weight by overeating required more caloriesto maintain this added weight relative to their increasedsize than they required before gaining weight. Thesevolunteers gained 25% above their ideal body weightby overeating over a period of 7 mo and required 50%more calories to maintain this new heavier weight thanthey required at their usual lean weights. More recently,in collaboration with Goldman (2), we have found thatshort-term overfeeding is associated with increasedthermogenesis (energy utilization). Whether there isan adaptive increase in thermogenesis after overnutri-tion is an old and controversial subject which we haverecently reviewed (3, 4). Any number of physiologicaland biochemical mechanisms have been evoked toexplain this phenomenon. Because it is well recognizedthat thyroid hormones directly increase thermogenesis,
J. Clin. Invest. © The American Society for Clinical Investigation, Inc. * 0021-9738/79/11/1336/12 $1.00Volume 64 November 1979 1336-1347

it is possible that a diet-induced alteration in thyroidhormone metabolism could explain the increasedthermogenesis resulting from overnutrition.We report here the changes in the serum concentra-
tions and metabolism of thyroxine (T4),1 3,5,3'-tri-iodothyronine (T3), and 3,3',5'-triiodothyronine (reverseT3, rT3) during long- and short-term overfeeding andafter diets of altered composition. We find that serumconcentrations of T3 increase and rT3 decrease duringoverfeeding and that this is associated with an acceler-ated metabolic clearance and production of T3 withoutchanges in the serum concentration or metabolism ofT4. We have also discovered that the composition ofthe diet, specifically the carbohydrate content whenintake of calories is equal to or below that required tomaintain weight, is an important factor in these changesin thyroid hormone metabolism. In view ofthese resultsand of parallel studies of thermogenesis (5, 6), it ispossible that changes in the peripheral metabolism ofT4 may comprise one of the mechanisms responsiblefor the increased thermogenesis resulting from over-nutrition.
METHODSSubjects. These studies were performed with the help of
34 normal weight and 13 moderately overweight volunteers.All subjects were between 20 and 29 yr of age and gave nohistory ofrecent illness or family history ofan endocrinopathy.All volunteers gave their informed consent for these studies.Before the study, they had normal physical examinations,routine blood and urine examinations, chest x rays, electro-cardiograms, serum electrolytes, hepatic and renal functiontests, lipid and thyroid hormone concentration examinations.These studies are a part of the larger Vermont Study of
Experimental Obesity in Man (1). With the exception of themixed-diet, long-term overfeeding study, all studies wereperformed while the subjects lived and ate their meals andsupplements under supervision on the General Clinical Re-search Center of the University of Vermont. The mixed-diet,long-term overfeeding study was performed with volunteersfrom the Vermont State Prison, Windsor, Vermont. Thesesubjects received their meals each day in an area organizedwithin the prison hospital for this study. In addition to threelarge, regular meals, dietary supplements were given at thetime of an evening television period. The subjects were moni-tored during all meals by our staff, and the food eaten at eachmeal was recorded. During the remainder of the day, the sub-jects performed their regular work assignments and weresupervised by the prison guards. Their physical activity wasuniform with respect to general activities such as walking orclimbing stairs, but the activity required by their jobs withinthe prison varied. At night they slept in their cells. In allstudies, weight maintenance was first established for 3 wk bythe use of frozen meals (Swanson Foods, Campbell Soup Co.,Camden, N. J.) drawn from single production lots. The dietarycomposition was provided by the manufacturer, and identicalmeals were taken during the initial and experimental periods.
IAbbreviations used in this paper: CHO, carbohydrate;FAT, fat; PRO, protein; rT3, reverse T3; T3, 3,5,3'-triiodo-thyronine; T4, thyroxine; TRH, thyroid releasing hormone;TSH, thyroid stimulating hormone.
These were variously supplemented with weighed quantitiesof standard foods to achieve maintenance of weight or to alterthe proportion ofcarbohydrate and fat in the diet. The caloriessupplied above maintenance during the overfeeding phaseswere supplied as part ofthe regular meals and as between-mealfeedings. Demographic data, including age, sex, physicalcharacteristics, duration and type of overfeeding, calorieseaten and their composition, body composition, adipose cellsize and number for the two long-term overfeeding studiesand the short-term overfeeding studies are detailed in tablesregistered with the National Auxiliary Publications Service.2Long-term overfeeding studies. The long-term study of
mixed-diet overfeeding included four subjects studied duringperiods of weight maintenance before and after 7 mo of over-eating an average of 2,000 kcal/d of a mixed diet. Thisstudy was designed to dissociate where possible the effectof change in the ratio of carbohydrate and fat in the diet fromthe effect of gain in weight. For this reason, the subjectsunderwent two 4-wk-long periods of weight maintenance ofthe same protein content, one containing 400 and the other1,200 kcal/m2 carbohydrate, before and after their gain inweight.The long-term study of fat overfeeding included four sub-
jects studied before and after overeating fat for 3 mo. Theexcess fat in these diets averaged 895 kcal/d consisting ofmargarine, corn oil, a corn oil colloidal suspension, and fat-enriched soups and cookies. The ratio of saturated to un-saturated fatty acids in these diets was _1:2.5.Short-term overfeeding studies. 17 subjects underwent
short-term overfeeding. Studies were performed before andthen repeated 3 wk after having taken 1,375 kcal/d excesscarbohydrate (six subjects), 1,340 kcal/d excess fat (five sub-jects), or 965 kcal/d excess protein (six subjects). The subjectswho received excess carbohydrate and fat were randomizedinto two groups. The six subjects overfed protein were studiedin a single group. The excess carbohydrate was supplied asDextrimaltose (Mead-Johnson & Co., Bristol-Meyers Co.,Evansville, Ind.), and the additions of fat were the same asfor the long-term fat-overfed group. The excess protein wasprovided as lean meat supplemented with casein (Caseinate,Mead-Johnson & Co.).Fasting study. Seven moderately overweight subjects fasted
for 7 d, except for water and electrolytes, and were then al-lowed to refeed using a balanced diet.No carbohydrate study. Three normal weight subjects
were studied after weight had been maintained for 1 wk on abalanced liquid diet containing 20% milk protein (Casec,Mead-Johnson & Co.), 40% carbohydrate (Dextrimaltose), and40% liquid corn oil, and again after the equal-caloric replace-ment of all carbohydrate in the diet with fat (carbohydrate-free phase) for a week, and then again after taking the originalformula diet for a week. In this study, in contrast to the situa-tion in the overfeeding studies, total calories and weightswere maintained and therefore the composition of the dietserved as the variable.Low carbohydrate study. Six normal weight subjects were
2An Appendix has been deposited with the NationalAuxiliary Publications Service (NAPS) as NAPS document03516. This information may be ordered from ASIS/NAPS,Microfiche Publications, P. 0. Box 3513, Grand CentralStation, New York 10017. Remit in advance, in U. S. funds,$3.00 for microfiche copy, or for photocopy, $5.00 up to 20pages plus 250 for additional pages. Outside the U. S. andCanada add postage of $3.00 for photocopy and $1.00 formicrofiche. Checks should be made payable to MicrofichePublications.
Thyroid Hormone Metabolism during Overnutrition 1337

studied while their weight was maintained for 1 wk on abalanced diet of regular food containing 40% CHO (carbo-hydrate), 40% FAT (fat), and 20% PRO (protein), and thenagain after the equal-caloric replacement of FAT for CHO sothat the diet contained 10% CHO, 70% FAT, and 20% PROfor 1 wk, and then again after reinstitution ofthe initial balanceddiet for 1 wk. In this study, weights were maintained andtherefore the effects of restricted CHO with increased FATserved as the variable.Protein-supplemented modified fast study. Six moderately
overweight subjects were studied during an initial 2-wk base-line period while they received a weight-maintaining dietconsisting of 45% CHO, 40% FAT, and 15% PRO. This wasfollowed by a 6-wk period during which the subjects receiveda protein-supplemented modified fast including 1.2 gikg idealweight per d oflean meat, fish, or fowl. This was supplementedby 25 meq/d of potassium bicarbonate and citrate and 200 mgof calcium as carbonate, plus vitamins and iron.Measurement of thyrotd hormones. All blood samples
were drawn when the subjects were supine. To exclude inter-assay variation, samples from each individual or from eachgroup were measured in the same assay. Serum determina-tions of T3 and rT3 were performed in duplicate or triplicateby radioimmunoassay: T3 by a modification of the method ofBurger et al. (7) and rT3 by the method of Nicod et al. (8).The intra- and interassay variations were respectively, 3 and8% for T3, and 7 and 9% for rT3. T4 was determined using a kitfrom Antibodies, Incorporated, (Davis, Calif.) and T3 resinbinding with the Abbott Trisorb M125 Kit (Abbott Laboratories,North Chicago, Ill.), except in studies involving fasting andprotein-supplemented fasting, in which T4 was determined byradioimmunoassay using a polyethylene glycol separationprocedure (9).
Thyroid-stimulating hormone (TSH) concentrations wereestimated before and after intravenous injection of syntheticthyroid-releasing hormone (THR) by the method of Diamondet al. (10). Human TSH standard (MRC 68/38) was obtainedfrom the Medical Research Council, Holly Hill, London, andhuman TSH for labeling and the anti-human TSH serum weresupplied by the National Pituitary Agency and the NationalInstitute for Arthritis, Metabolism, and Digestive Diseases.In this method, high molecular weight material and iodideare excluded from labeled TSH by gel filtration. The limit ofsensitivity of this method is 1 ,uU/ml.Kinetic studies. [(25I]T3 and [131I]T4 were obtained from
Industrial Nuclear Co., Inc., St. Louis, Mo. or from AbbottLaboratories. The two labeled hormones were diluted withhuman serum albumin and then passed through 0.2-,um filtersinto sterile containers and used without further purification.Samples (=40 ACi each) were taken into syringes and injectedinto an anticubital vein. Venous samples were taken from theopposite arm beginning at 10 min from the injection and at2, 4, 6, 8, 10, 12, 16, and 24 h, and then three times daily overthe next 3 d and twice daily thereafter. Each dose was cal-culated by either weight or volume of injected isotope. Thyroiduptake of metabolically liberated iodide was minimized byoral administration of one drop of Lugol's iodine solution(10% KI and 5% 12) twice a day during the first 4 d ofthe study.Serum [125I]T3 and [131I]T4 were separated from nonthyronine-labeled materials by the method of Nicoloff (11), using 23x 0.8-cm Dowex 1-2X anion exchange resin columns sup-plied by Curtis Nuclear Corp. (Los Angeles, Calif.) and elutionwith acetic acid. ['25I]T3 and [131I]T4 standards were preparedin pooled human serum to approximate the same level ofactivity as that of the test samples and processed in the samemanner. All samples from a group were processed in a singleexperiment to reduce interassay variability. 125I and 131I ac-tivities were estimated in a dual-channel autogamma spectrom-
eter. The counts in serum were expressed as the percentageof the dose per liter and plotted on semilogarithmic graphpaper.
Calculation. Metabolic clearance rate and body distribu-tion volume were calculated using the noncompartmentalapproaches used by Openheimer (12, 13). The results obtainedover the first 3 d were used to calculate the metabolic clearancerate of T3 and from all points to calculate the kinetics of T4.Production rate was calculated as the product ofthe metabolicclearance rate and the serum concentration (micrograms perliter) of the hormone before the injection of radioactivehormone.
Statistical analysis. The subjects served as their own con-trols throughout these studies and the data were analyzed byStudents paired t test. The results of these kinetic studiesrepresent single determinations done before and at the end ofthe experimental periods. The thyroid hormone concentrations,except as noted, are the means of samples drawn 3 or 4 dbefore and at the end of the overfeeding periods. Valuesgiven for the concentrations of hormones are the meansand SEM.
RESULTSLong-term overfeeding. Substantial weight was
gained by all subjects during the two long-term over-feeding studies. The volunteers overfed the mixed dietfor an average excess of 2,000 kcal/d3 for 7 mo gained11.2±2.6 kg, whereas the volunteers given fat in excessfor an average of895 kcal/d for 3 mo gained 14.0±0.6 kg.One ofthe major differences between these two groupswas that the group overfed a mixed diet required morecalories (2,625 kcal/m2 per d) to maintain their weightsafter gaining than did the group overfed fat (1,840 kcal/m2 per d). There was no difference between the groupsin the calories required to maintain initial lean weights(1,870 vs. 1,705 kcal/m2 per d).Serum concentrations of T3 (Table I) were higher
after overfeeding and gain in weight in the group overfeda mixed diet when the low carbohydrate periods werecompared (136± 10 vs. 152±6 ng/dl, P < 0.05). T3 con-centrations were similarly increased in this groupbefore overeating when they were shifted from a lowto a high carbohydrate diet (136± 10 vs. 151± 10 ng/dl,P < 0.01). No further increase in T3 concentrationsresulted after weight was gained when the subjectstook the high carbohydrate diet. Serum concentrationsofT4 were unchanged by overeating and gain in weightor change in dietary composition. Serum concentrationsof rT3 tended to be lower when the subjects ingestedthe high carbohydrate diets, but were only significantlylower after the subjects had gained weight. There wereno changes in the thyroid hormone concentrations orT3 resin binding in the subjects overfed fat (Table II).
3The number of excess calories eaten daily varied widelyin the subjects overfed the mixed diet which may partiallyexplain the apparent greater rate of gain in weight by thesubjects overfed fat who took a relatively constant dailyincrement in excess calories. For more details on the courseof these studies see Sims et al. (1).
1338 Danforth et al.

TABLE ISerum Concentrations of T3, rT3, and T4 at End of Weight Maintenance Periods
before and after Long-term, Mixed-diet Overfeeding
400 kcal/m'/d CHO (4 wk) 1,200 kcal/m2/d CHO (4 wk)
Subjects T3 rT3 T4 TJ rT3 T4
ngIlOO ml pgIloo ml ng/100 ml pgIloo ml
Before weight gain(1,800 kcal/m2/d)
P.T. 113 49.9 7.6 132 50.6 6.7P.W. 145 51.7 6.8 165 49.6 6.5M.R. 125 40.9 5.1 136 28.8 4.9Z.B. 160 61.2 10.2 170 51.9 9.2Mean 136 50.9 7.4 151 45.2 6.8SEM 10 4.2 1.1 10 5.5 0.9P <0.01 NS NS
After weight gain(2,700 keal/m2/d)
P.T. 147 67.3 6.7 162 54.3 6.1P.W. 159 62.0 7.3 152 55.8 5.2M.R. 135 39.5 4.3 139 33.1 3.9Z.B. 168 50.4 9.0 162 39.8 7.7Mean 152 54.8 6.8 154 45.8 5.7SEM 6 6.2 1.0 6 5.6 0.8
P (high vs. lowcarbohydrate) NS <0.01 NS
P (before vs. after gain) <0.05 NS NS NS NS NS
Short-term overfeeding. The subjects in these studies(n = 17) experienced a weight gain from 70.5+2 to74.6+2 kg over the 3-wk period. Serum concentrationsofT3 (Table III) increased whether the volunteers wereoverfed with CHO (25%), PRO (17%), or FAT (29%).Serum concentrations of rT3 decreased when CHO (15%)or PRO (23%) were overfed, although no overall changein rT3 concentrations occurred when fat was overfed.Although there was some variability, these changes inserum concentrations of T3 and rT3 were detectable
within 2 or 3 d of overfeeding and reached a new rela-tively stable concentration after 1 wk of overfeeding.To be certain the changes in hormone concentrationswere the result of changes in diet and not a compound-ing effect ofthe small amount of iodide given to protectthe thyroid gland from irradiation during the turnoverstudies, five volunteers were given comparable amountsofiodide and the same protocol followed. No detectablechange was found in the thyroid concentration afterthe administration of this small amount of iodide.
TABLE IISerum Concentrations of T3, rT3, T4, and T3 Resin Binding before (B)
and after (A) Long-term Fat Overfeeding
T3 rT3 T, T3 resin binding
Subject B A B A B A B A
ngIl00 ml ng/100 ml AgIlOO ml %
W.M. 132 138 37.5 33.6 6.7 7.5 35.6 35.3I.R. 145 144 36.8 39.5 8.4 8.9 30.9 32.9B.S. 151 159 31.2 28.6 8.1 7.7 28.7 28.6S.T. 145 128 51.3 28.1 7.5 6.6 33.1 37.0
Mean 143 142 39.2 32.5 7.7 7.7 32.1 33.5SEM 4 7 4.3 2.7 0.4 0.5 1.5 1.8P NS NS NS NS
Thyroid Hormone Metabolism during Overnutrition 1339

TABLE IIISerum Concentrations of T3, rT3, T4, and T3 Resin Binding before (B) and after (A) Short-term Overfeeding
T3 rTs T4 T3 resin binding
Subject B A B A B A B A
ngIlOO ml ngIlOO ml pgl1oo ml %
Carbohydrate overfedR.B.J.M.J.E.H.B.J.W.L.W.MeanSEMp
Fat overfedD.U.D.B.D.S.B.M.R.S.MeanSEMp
Protein overfedM.B.D.E.B.C.P.H.A.H.D.K.MeanSEMp
All subjectsMean (n = 17)SEMp
Controls (not overfed)Mean (n = 5)SEMp
103 141 33.7 2144 171 30.3 9139 180 34.7 0112 132 27.3 2135 164 30.7 2127 166 25.0 2127 159
7 8<0.0005
137 202175 210112 132108 127101 144
30.3 21.5
<0.005
44.7 41.038.3 39.029.7 30.030.0 27.332.0 34.3
127 163 34.9 34.314 18 2.9 2.6
<0.01 NS
106 142 27.3 21.3126 146 25.0 19.7154 174 37.0 26.3161 193 32.0 24.0115 137 23.7 22.0129 133 29.3 20.7132
9<0.002
1295<0.000
154 29.1 22.38 2.0 1.0
5 <0.0025
158 31.2 27.16 1.3 1.6
15 <0.0005
118 122 25.9 26.918 18 3.3 4.6
NS NS
28.0 5.7 5.523.5 7.8 5.835.0 6.7 8.621.3 8.6 7.7Z5.3 11.4 9.222.0 9.4 7.225.9 8.3 7.32.1 0.8 0.6
NS
8.0 8.08.3 8.76.7 7.0
10.8 9.88.1 8.8
8.4 8.50.7 0.5
NS
5.9 5.87.5 6.6
8.2 6.95.6 7.47.4 6.66.9 6.70.5 0.3
NS
7.9 7.50.4 0.3
NS
33.5 33.024.4 31.329.7 29.735.9 36.529.2 27.430.2 29.930.5 31.31.6 1.3
NS
26.1 27.927.5 27.629.2 28.236.4 37.035.4 37.5
30.9 31.62.1 2.3
NS
33.0 34.030.0 30.0
31.0 31.035.0 34.031.0 29.032.0 31.60.9 1.0
NS
31.1 31.50.9 0.9
NS
5.6 5.50.5 0.5
NS
Kinetics of T3. T3 and T4 turnover studies were well in all subjects (129±5 to 158+±6 ng/dl), the increaseperformed simultaneously before and during the 2nd wk in production rate of T3 was even greater than theof overfeeding after the serum concentration of T3 had metabolic clearance rate. The production rate for T3reached new stable concentrations. The metabolic increased in all 17 subjects whether overfed CHO (82%),clearance rate of T3 (Table IV) increased in all 17 sub- FAT (74%), or PRO (71%). The mean increase for alljects whether overfed CHO (43%), FAT (32%), or PRO groups was 76% from 29.8+1.5 to 52.3±1.9 ,g/d per(33%), and there was no difference among the groups. 70 kg (P < 0.0005). When calculated as micrograms perThe mean increase for all the subjects was 36% from day per square meters, production rates of T3 increased23.7±+1.4 to 32.4± 1.7 liters/d per 70 kg (P < 0.0005). from 16.0+0.8 to 28.4+ 1.3 (P < 0.0005). There was alsoBecause the serum concentrations of T3 increased as an increase in the volume of distribution of T3 in all
1340 Danforth et al.
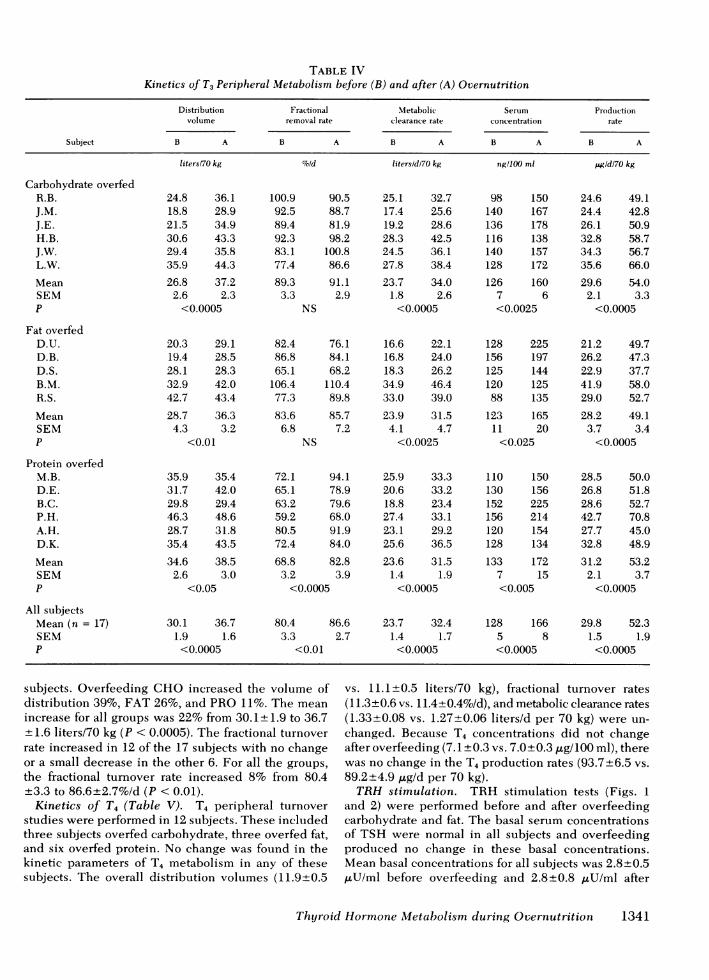
TABLE IVKinetics of T3 Peripheral Metabolism before (B) and after (A) Overnutrition
Distribution Fractional Metabolic Serum Productionvolume removal rate clearance rate concentration rate
Subject B A B A B A B A B A
litersl70 kg %Id liters/dl70 kg ng/100 ml Mggd/70 kg
Carbohydrate overfedR.B.J.M.J.E.H.B.J.W.L.W.
MeanSEMp
Fat overfedD.U.D.B.D.S.B.M.R.S.
MeanSEMp
Protein overfedM.B.D.E.B.C.P.H.A.H.D.K.
MeanSEMp
All subjectsMean (n = 17)SEMp
24.8 36.118.8 28.921.5 34.930.6 43.329.4 35.835.9 44.3
26.8 37.22.6 2.3<0.0005
20.3 29.119.4 28.528.1 28.332.9 42.042.7 43.4
28.7 36.34.3 3.2
<0.01
35.9 35.431.7 42.029.8 29.446.3 48.628.7 31.835.4 43.534.6 38.52.6 3.0
<0.05
30.1 36.71.9 1.6<0.0005
100.9 90.592.5 88.789.4 81.992.3 98.283.1 100.877.4 86.689.3 91.13.3 2.9
NS
82.4 76.186.8 84.165.1 68.2
106.4 110.477.3 89.883.6 85.76.8 7.2
NS
72.1 94.165.1 78.963.2 79.659.2 68.080.5 91.972.4 84.0
68.8 82.83.2 3.9<0.0005
80.43.3
<0.01
86.6
2.7
subjects. Overfeeding CHO increased the volume of vs. 11.1±0.5 liters/70 kg), fractional turnover ratesdistribution 39%, FAT 26%, and PRO 11%. The mean (11.3±0.6 vs. 11.4±0.4%o/d), and metabolic clearance ratesincrease for all groups was 22% from 30.1±1.9 to 36.7 (1.33±0.08 vs. 1.27+0.06 liters/d per 70 kg) were un-
±1.6 liters/70 kg (P < 0.0005). The fractional turnover changed. Because T4 concentrations did not changerate increased in 12 of the 17 subjects with no change after overfeeding (7.1±0.3 vs. 7.0±0.3,ug/100 ml), thereor a small decrease in the other 6. For all the groups, was no change in the T4 production rates (93.7±6.5 vs.
the fractional turnover rate increased 8% from 80.4 89.2±4.9 ,ug/d per 70 kg).±3.3 to 86.6±2.7%/d (P < 0.01). TRH stimulation. TRH stimulation tests (Figs. 1Kinetics of T4 (Table V). T4 peripheral turnover and 2) were performed before and after overfeeding
studies were performed in 12 subjects. These included carbohydrate and fat. The basal serum concentrationsthree subjects overfed carbohydrate, three overfed fat, of TSH were normal in all subjects and overfeedingand six overfed protein. No change was found in the produced no change in these basal concentrations.kinetic parameters of T4 metabolism in any of these Mean basal concentrations for all subjects was 2.8±0.5subjects. The overall distribution volumes (11.9±0.5 ,uU/ml before overfeeding and 2.8±0.8 ,uU/ml after
Thyroid Hormone Metabolism during Overnutrition 1341
25.1 32.717.4 25.619.2 28.628.3 42.524.5 36.127.8 38.4
23.7 34.01.8 2.6<0.0005
16.6 22.116.8 24.018.3 26.234.9 46.433.0 39.023.9 31.54.1 4.7<0.0025
25.9 33.320.6 33.218.8 23.427.4 33.123.1 29.225.6 36.5
23.6 31.51.4 1.9<0.0005
23.7 32.41.4 1.7<0.0005
98 150140 167136 178116 138140 157128 172
126 1607 6<0.0025
128 225156 197125 144120 12588 135
123 16511 20<0.025
110 150130 156152 225156 214120 154128 134
133 1727 15<0.005
128 1665 8<0.0005
24.6 49.124.4 42.826.1 50.932.8 58.734.3 56.735.6 66.0
29.6 54.02.1 3.3<0.0005
21.2 49.726.2 47.322.9 37.741.9 58.029.0 52.7
28.2 49.13.7 3.4<0.0005
28.5 50.026.8 51.828.6 52.742.7 70.827.7 45.032.8 48.9
31.2 53.22.1 3.7<0.0005
29.8 52.31.5 1.9<0.0005

TABLE VKinetics of T4 Peripheral Metabolism before (B) and after (A) Overnutrition
Distrbution Fractional Metabolic Serum Productionvolume removal rate clearance rate concentration rate
Subject B A B A B A B A B A
litersl70 kg old litersid ,gllOO ml pg/dI70 kg
Carbohydrate overfedR.B. 12.2 12.0 10.1 11.2 1.35 1.35 5.7 5.5 77.0 7.43J.M. 9.5 9.7 11.3 10.1 1.07 0.99 7.8 5.8 83.5 57.4J.E. 10.7 9.5 12.1 13.6 1.29 1.29 6.7 8.6 86.4 110.9Mean 10.8 10.4 11.5 11.6 1.24 1.21 6.7 6.6 82.3 80.9SEM 0.8 0.8 0.3 1.0 0.09 0.11 0.6 0.9 2.8 15.8P NS NS NS NS NS
Fat overfedD.U. 10.3 8.4 10.4 11.2 1.01 0.94 8.0 8.0 80.8 75.2D.B. 9.6 10.3 13.7 10.8 1.32 1.12 8.3 8.7 109.6 97.4D.S. 10.8 9.4 11.4 13.0 1.23 1.22 6.7 7.0 82.4 85.4
Mean 10.2 9.4 11.8 11.7 1.19 1.09 7.7 7.9 90.9 86.0SEM 0.4 0.6 1.0 0.7 0.09 0.08 0.5 0.5 9.3 6.4P NS NS NS NS NS
Protein overfedM.B. 14.4 13.3 12.8 12.1 1.85 1.61 5.9 5.8 109.2 93.4D.E. 15.0 13.1 5.9 9.2 0.89 1.23 7.5 6.6 66.8 81.2B.C. 10.7 10.8 11.5 9.5 1.23 1.04P.H. 13.4 12.6 12.8 11.1 1.70 1.40 8.2 6.9 139.4 96.6A.H. 13.0 11.7 11.3 12.7 1.46 1.48 5.6 7.4 81.8 109.5D.K. 13.2 12.3 11.7 12.3 1.54 1.51 7.4 6.6 114.0 99.7
Mean 13.3 12.3 11.0 11.5 1.45 1.38 6.9 6.7 102.2 96.1SEM 0.6 0.4 1.0 0.6 0.14 0.09 0.5 0.3 1.3 4.6P NS NS NS NS NS
All subjectsMean (n = 17) 11.9 11.1 11.3 11.4 1.33 1.27 7.1 7.0 93.7 89.2SEM 0.5 0.5 0.6 0.4 0.08 0.06 0.3 0.3 6.5 4.9P NS NS NS NS NS
overfeeding. The highest TSH concentration reachedafter TRH administration was similar in all subjects.The peak concentration of TSH reached after TRH(23.2±2.6 vs. 19.5±2.3 ,uU/ml, P < 0.1) and peak A in-crease in TSH (20.3±2.4 vs. 16.8±1.8 ,uU/ml, P < 0.1)tended to be lower after overfeeding. However,significantly lower values were found after overfeedingonly at 120 and 180 min. As expected, the basal con-centration of T3 was higher in each subject after over-feeding carbohydrate or fat. However, no differenceswere found after overfeeding in the response of T3 toTRH when expressed as the percentage change abovebase line (Fig. 2, inset).Eucaloric diets. When fat was equal-calorically
substituted for carbohydrate in a weight maintainingdiet for 1 wk (Fig. 3B), the serum concentrations of T3fell from 172±9 to 116±9 ng/dl (P < 0.005), and thenreturned toward their initial concentrations (157±9
ng/dl, P < 0.01) when carbohydrate was restored to thediet. Serum concentrations of rT3 responded in theopposite direction to those of T3. Beginning at 56±1ng/dl, the rT3 rose to 73±9 ng/dl (P < 0.01) and thenfell with addition of carbohydrate back to the diet to43±8 ng/dl (P < 0.01). The concentrations of T4 and T3resin binding were unaffected by this change in thecomposition of the diet. Similar alterations in theconcentrations of T3 and rT3 were produced when fatwas equally but not completely substituted for carbo-hydrate in the diet for 7 d (Fig. 3D). Beginning at 130±8 ng/dl, T3 fell to 105±9 ng/dl (P < 0.01) and thenrose to 127±7 ng/dl (P < 0.01) when these subjectswere returned to the diet containing 40% CHO. CHOaccounted for only 10% of the total calories necessaryto maintain weight during the experimental phase ofthis study.Hypocaloric diets. Fasting over the same period
1342 Danforth et al.

30 -
20 -
10-
E 7 -
5-I
3 -
3 -
2 -
1-I
BEFOREAFTER
0 30 60 90 120 150 180minutes
FIGURE 1 Comparison of the serum TSH response to TRH(500 ,ug i.v.) before and during carbohydrate and fat over-feeding for 3 wk. Each point represents the mean±SEM(n = 6). Statistical significance is reached only at 120 (P< 0.025) and 180 (P < 0.005) min after TRH injection.
as the above carbohydrate-restricted studies resultedin similar changes in the serum concentrations of T3and rT3 (Fig. 3A). The initial concentration of T3 inthese subjects was 155+7 ng/dl, fell to 87±7 ng/dl(P < 0.0005) during the 7-d fast, and then rose to 146±9 ng/dl with refeeding (P < 0.001). Initial rT3 con-centrations were 25+2 ng/dl, rose with fasting to 57+2ng/dl (P < 0.0005), and then fell again to 24±2 ngldl(P < 0.001) with refeeding. Slower but similar changesin the concentrations of T3 and rT3 to those of fastingoccurred with administration of a protein-supple-mented modified fast for 1 wk (Fig. 3C). During the1st wk of the diet, T3 concentrations fell from 166±8 to109±4 ngldl (P < 0.0005) and rT3 concentrations rosefrom 31+2 to 53±5 ng/dl (P < 0.0005). As the modifiedfast was continued, T3 concentrations continued to falland at 6 wk were equivalent to those found after 1 wk offasting (88+5 ng/dl, P <0.05). rT3 concentrations,however, returned toward their initial values as thefast was continued (39±2 ng/dl, P <0.05). Again, T4concentrations were unaffected by these dietarymanipulations after 1 wk, but were slightly lower(P < 0.05) after 6 wk of the diet.
DISCUSSION
We can conclude from these studies that overfeedingincreases the serum concentration ofT3 and acceleratesits metabolic clearance and production without alteringthe serum concentration, metabolic clearance, orproduction of T4. Our estimates of the peripheral
250-
200-
E 150-0CDC) :
100 -
50-
0-
- BEFOREAFTER
+ 60-1.A+ 40-
+ 20-
100 -
- 204
° 1hours 2
0
3
I hours 2 3
FIGuRE 2 Comparison of the serum T3 response to TRH(500 ,ug i.v.) before and during carbohydrate and fat over-feeding for 3 wk. Each point represents the mean+SEM(n = 6). The inset represents the percent change in T3 fromcontrol values. The increased base-line concentration (P< 0.01) after overfeeding persisted throughout the response.However, the percent change in T3 from base line is un-changed by overfeeding.
metabolism of T4 and T3 in these lean, young, healthysubjects while they were eating a weight-maintainingbalanced diet agree with estimates reported by others(11, 14-20) in normal euthyroid subjects. The uni-formity of these results is best explained by the carefulattention paid to the antecedent diets, because it isknown that starvation (21) and ovemutrition inducealterations in the peripheral metabolism of thyroidhormones. Overnutrition in these subjects induced amarked and similar increase in the production of T3regardless of the component of the diet overfed (CHO82%, FAT 74%, and PRO 71%). It is known that most ofthe T3 found in the serum of euthyroid man is derivedfrom the peripheral monodeiodination ofT4 rather thanby direct secretion from the thyroid gland (17, 22-25).Similar studies have not been performed in hypothy-roid or euthyroid subjects given thyroid hormoneadequate to inhibit endogenous secretion of T3, butbecause the serum concentrations and peripheralkinetics of T4 were unaltered, it is unlikely the alteredproduction ofT3 reflects a selective increased secretionof T3 from the thyroid. It is more likely that overnutri-tion is associated with an acceleration ofthe peripheral
Thyroid Hormone Metabolism during Overnutrition
0
#1.0
r-
0;
1343

C FAST7 DAYS
C
200
160
120
80
40
C PSMF PSMFDIET DIET7 DAYS 6 WEEKS
B
-a'%§C NOCOM
DIET7 DAYS
C
4w ~~D160_
120 +
80
40 - r1-_rT3C LOW C
CHODIET7 DAYS
FIGURE 3 Comparison of the changes in the serum con-centrations of T3 and rT3 produced by fasting (A) (n = 7),carbohydrate-free equal-caloric weight maintaining diets (B)(n = 3), protein-supplemented modified fasts (PSMF) (C)(n = 6), and low carbohydrate (10%) equal-caloric weightmaintaining diets (D) (n = 6). Each experimental pointrepresents the mean+SEM and is statistically different fromcontrol days at P < 0.01 level or greater, except the rT3 valuesin D that represent the determination in a single individual.
conversion of T4 to T3. Serum concentrations of rT3decreased in these studies. However, we are unableto say whether the peripheral metabolism of rT3 is alsoaffected by overnutrition for the reason that studiesof the kinetics of rT3 were not performed.As noted earlier, our interest in performing these
studies came from observations made in studies oflong-term overfeeding in which volunteers overfed a mixeddiet developed higher serum concentrations of T3 andrequired a greater relative number of calories to main-tain their heavier weights than volunteers overfed adiet high in fat who had no change in their T3 concentra-tions. At first glance the studies of short-term overfeed-ing do not appear to explain this discrepancy, becausethe concentrations, metabolic clearance, and produc-tion of T3 increased whether the subjects overatecarbohydrates or fat. In this regard, it is important tonote that the measurements of thyroid hormones in thetwo long-term overfeeding studies were performedafter relatively long (4 wk) periods at stable weightand not while the subjects were gaining weight, as wasthe case in the short-term overfeeding studies. It isalso important to consider the difference in require-ments between the two groups. The number ofcaloriesneeded to maintain weight before gaining was similar
in the two groups. However, after weight was gainedthe group taking a mixed diet required more caloriesto maintain weight than the fat-overfed group. Al-though some of this difference in requirement mightbe a result of differences between the groups in theirinstitutional setting, length of study, amount of exer-cise, shifts in body composition, coffee intake orsmoking habits, the magnitude of this difference islarge enough so that another source of energy expendi-ture must have occurred in the group overfed themixed diet. The group overfed a mixed diet wastherefore "overeating" in order to maintain their newweights, whereas the fat-overfed subjects were able tomaintain their new weights by eating approximatelythe same relative number of calories they had requiredbefore gaining weight. It seems clear therefore that thelevel of caloric intake is important in regulating theserum concentrations and the peripheral metabolismof thyroid hormone. This observation is supported in areciprocal manner by the observation that starvationreduces the serum concentration of T3 and the peri-pheral conversion of T4 to T3 (26).A second important observation that is not obvious
when examining the results ofthe short-term overfeed-ing studies is the importance of the carbohydratecontent of the diet in determining the serum con-centrations of the thyroid hormones. This was firstsuspected when the results of the long-term, mixed-diet overfed group was studied when taking either alow (400 kcal/m2 per d) or a high (1,200 kcal/m2 per d)level of carbohydrate in the diet. An increase in T3occurred before weight was gained when a weight-maintaining low carbohydrate diet was replaced by anequal-caloric high-carbohydrate diet. However, nofurther increase in T3 concentrations resulted whenthe high carbohydrate diet was given after weight wasgained and maintenance established on the increasedintake. This suggested a finite phenomenon that couldbe induced either by increasing the carbohydratecontent without increasing the total number of caloriesin the diet.The four short-term studies served to clarify the
importance of the carbohydrate content of the diet inproducing these changes. Changes in the concentra-tions of T3 and rT3 that occur during starvation weremimicked when carbohydrate was eliminated orrestricted in diets adjusted to maintain weight by theisocaloric replacement of carbohydrate with fat.Changes similar to those found during completestarvation also occurred in the concentrations of T3and rT3 after 1 wk of a protein-supplemented modifiedfast containing almost no carbohydrate. T3 concentra-tions continued to fall, and were at their lowestconcentrations after 6 wk of the protein-supplementedfast. Interestingly, in this study, as has been reported
_ A
0-0-#0.b00QS rT3 ",I_ _. __ _
IE
812
4
K.c
10-so - T
* CO _0so_o_Df_f."0ci'
1344 Danforth et al.
D
21
31
p
)I
after prolonged starvation (27), rT3 concentrationsreturned toward normal as the fast was continued. It isapparent from these results that the composition of thediet, as well as the caloric content of the diet, can playan important role in determining the concentrationsof T3 and rT3 in the serum. This conclusion thenraises the question not only ofthe relationship betweenaltered thyroid hormone metabolism and energyutilization where energy intake is above or belowmaintenance, but also the relationship between thyroidhormone metabolism and energy intake where energyintake is kept the same and only the composition ofthediet changed.There is substantial evidence in man and from in
vivo (28-33) and in vitro (34-40) animal studies tosupport these observations. Others have confirmed ourinitial report in studies in man that the level of carbo-hydrate in the diet is an important determinant of theconcentrations ofT3 and rT3. Spaulding et al. (41) foundthat 800 kcal hypocaloric diets containing no carbohy-drate mimicked the fall in T3 found during starvation.Several investigators have reported a return towardnormal of the fasting-induced low T3 and high rT3concentrations when carbohydrate or a mixed diet wasrefed (42-44), and the absence of such an effect whenfat was refed (45). Further support for these observa-tions is found in the studies by Schonborn et al (46),Burman et al. (44), and Davidson and Chopra (47). Thelatter study confirms our initial report that carbohydratesources of calories are important modulators of serumconcentrations of T3 in man, and concludes as we dothat the influence of total calories is as pronounced asthat of carbohydrate when a permissive amount ofcarbohydrate is present in the diet. If, as we believe,these alterations in thyroid hormone metabolismrepresent important adaptations of the body to the fedand fasted states, then this is an attractive conclusionbecause in diets near or below maintenance, the levelofcarbohydrate, through effects on other hormones andsubstrates, is the major signal to the body of the fed orthe fasted state.The physiological significance ofthese diet-induced
alterations in thyroid hormone metabolism is presentlyunknown. We have measured increased thermogenesis(energy utilization) in these subjects (5, 6), and inothers overfed carbohydrate (2). It is tempting tospeculate that the increased clearance and productionof T3 might be responsible for this increase in thermo-genesis. Energy utilization is decreased during starva-tion, raising the possibility that the decreased produc-tion of T3 in this condition might be responsible. Thisinterpretation is not simple, for the reason that it is nowrecognized that caloric restriction lowers not only T3concentrations but also the putative nuclear T3-receptor capacity (48-50), suggesting the possibility
that the capacity to bind T3 to its receptor is a functionof the nutritional state of the organism. In starvation itseems unlikely that the fall in oxygen consumption isentirely the result of the lowered T3 concentrations.This is supported by our discovery that the fall inoxygen consumption during starvation occurs inhyperthyroid as well as hypothyroid rats given T3 (51).During overfeeding, however, an increase in theconcentration and production ofT3 in conjunction withan unaltered or even an increase in T3-receptorcapacity, as suggested by the replenishment of T3-receptor capacity on refeeding, could support a role forT3 in the increased energy utilization after over-nutrition.Although a strong case for the inhibition of the
pituitary secretion of TSH by overfeeding cannot bemade, the rise following TRH stimulation was lesssustained. It is debated whether in starvation circu-lating levels ofTSH or the response ofTSH to TRH isnormal or low (27, 42, 45, 52, 53). Sensitization of thepituitary to the inhibition ofthyrotropin by T3 has beensuggested by some investigators (54) to explain thenormal circulating levels ofTSH and response to TRHfound during starvation. One mechanism that couldexplain such altered sensitivity of the pituitary tocirculating concentrations of T3 during starvation andovernutrition is the findings of Silva et al. (55). Theyfound that a greater amount of T3 bound to receptorsin the pituitary is generated locally from T4 than in theperipheral tissues such as the liver and kidney. There isthe possibility therefore that the expression of T3activity may vary with the tissues involved. If this is so,then the effect of over- and undernutrition on theperipheral metabolism of T4 and the resetting of thehypothalamic pituitary thyroid axis might be importantmechanisms by which increased amounts of T3 aremade available to the body during times of caloricaffluence and decreased amounts during times ofcaloric deprivation. Thyroid hormones have wellrecognized effects on the two costliest homeostaticprocesses of the body, protein synthesis and degrada-tion, and the maintenance of intracellular sodiumconcentrations by the sodium pump. Diet-inducedalterations in thyroid hormone metabolism could,through the regulation of the rate of these processesand therefore the expenditure of energy, represent animportant physiological adaptation to feast and famine.
ACKNOWLEDGMENTS
The authors are indebted to Elaine D. Tyzbir, M. S. (Vermont),and Christine Alloid and Theresa Burer (Geneva) for theirtechnical help and advice, and to Nancy Perrine (Vermont)and Viviane Nicolet (Geneva) for their help in preparing themanuscript. We would also like to thank Mabel Hills, R. N.,and her staff, and Catherine Armstrong, chieftechnician ofthe
Thyroid Hormone Metabolism during Overnutrition 1345

Clinical Research Center, University of Vermont, as well asmany volunteers without whom these studies would havebeen impossible. We want also to thank Dr. Rinato L. Galeazzi,Department of Pharmacology, University of Bern, for hisadvice and help with the kinetic calculations.This work was supported by grants from the National
Institutes of Health: U. S. Public Health Service grants AM18535 (Danforth) and AM 10254 (Sims); the General ClinicalResearch Center of the University of Vermont (NationalInstitutes of Health, U. S. Public Health Service M01-00109);and by a grant from the Swiss National Science Foundation(Burger).
REFERENCES
1. Sims, E. A. H., E. Danforth, Jr., E. S. Horton, G. A. Bray,J. A. Glennon, and L. B. Salans. 1973. Endocrine andmetabolic effects of experimental obesity in man. RecentProg. Horm. Res. 29: 457-496.
2. Goldman, R. F., M. F. Haisman, G. Bynum, E. Danforth,Jr., E. S. Horton, and E. A. H. Sims. 1975. Experimentalobesity in man: metabolic rate in relation to dietaryintake. In Obesity in Perspective. Fogarty InternationalCenter Series on Preventive Medicine. National Insti-tutes of Health, Bethesda, Md. 2(pt. 2): 165-186.
3. Danforth, E., Jr., A. G. Burger, R. F. Goldman, andE. A. H. Sims. 1978. Thermogenesis during weight gain.V. Energy expenditure. In Recent Advances in ObesityResearch. Newman Publishing Ltd., London. 2:229-236.
4. Sims, E. A. H. 1976. Experimental obesity, dietary-induced thermogenesis and their clinical implications.Clin. Endocrinol. Metabol. 5(2): 377-395.
5. Burse, R. L., R. F. Goldman, E. Danforth, Jr., E. S. Horton,and E. A. H. Sims. 1977. Effect of excess carbohydrate(CHO) and fat intake on resting metabolism. Fed. Proc.36(3): 546.
6. Burse, R. L., R. F. Goldman, E. Danforth, Jr., D. C.Robbins, E. S. Horton, and E. A. H. Sims. 1977. Effect ofexcess protein intake on metabolism. Physiologist.20(4): 13.
7. Burger, A. G., C. Sakoloff, V. Staeheli, M. B. Vallotton,and S. H. Ingbar. 1975. Radioimmunoassays of 3, 5, 3'-triiodo-L-thyronine with and without a prior extractionstep. Acta Endocrinol. 80: 58-69.
8. Nicod, P., A. Burger, V. Staeheli, and M. B. Vallotton.1976. A radioimmunoassay for 3,3',5'-triiodo-L-thyroninein unextracted serum: method and clinical results.J. Clin.Endocrinol. Metab. 42: 823-829.
9. O'Connell, M., D. C. Robbins, E. S. Horton, E. A. H. Sims,and E. Danforth, Jr. 1979. Changes in serum concentra-tions of 3,3',5'-triiodothyronine (reverse T3) and 3,5,3'-triiodothyronine (T3) during prolonged moderate exer-cise.J. Clin. Endocrinol. Metab. 49: 242-246.
10. Diamond, R. C., and S. W. Rosen. 1974. Chromatographicdifferences between circulating and pituitary thyro-tropins. J. Clin. Endocrinol. Metab. 39: 316-325.
11. Nicoloff, J. T., J. C. Low, J. H. Dussault, and D. A. Fisher.1972. Simultaneous measurement of thyroxine andtriiodothyronine peripheral turnover kinetics in man.J. Clin. Invest. 51: 473-483.
12. Oppenheimer, J. H., H. L. Schwartz, and M. I. Surks.1975. Determination ofcommon parameters of iodothyro-nine metabolism and distribution in man by noncom-partmental analysis. J. Clin. Endocrinol. Metab. 41:319-324.
13. Oppenheimer, J. H., H. L. Schwartz, and M. I. Surks.1975. Erratum: revised calculations of common param-
eters of iodothyronine metabolism and distribution bynoncompartmental analysis. J. Clin. Endocrinol. Metab.41: 1172-1173.
14. Woeber, K. A., R. J. Sobel, S. H. Ingbar, and K. Sterling.1970. The peripheral metabolism of triiodothyronine innormal subjects and in patients with hyperthyroidism.J. Clin. Invest. 49: 643-649.
15. Cavalieri, R. R., M. Steinberg, and G. L. Searle. 1971.Metabolic clearance rate of L-triiodothyronine in man: acomparison of results by single-injection and constantinfusion methods. J. Clin. Endocrinol. Metab. 33:624-629.
16. Jubiz, W., A. H. Bigler, L. F. Kumagai, and C. D. West.1972. Estimation of thyroxine production rates in non-steady states.J. Clin. Endocrinol. Metab. 34: 1009-1015.
17. Surks, M. I., A. R. Schadlow, J. M. Stock, and J. H.Oppenheimer. 1973. Determination of iodothyronineabsorption and conversion of L-thyroxine (T4) to L-triiodothyronine (T3) using turnover rate techniques.J. Clin. Invest. 52: 805-811.
18. Inada, M., K. Kasagi, S. Kurata, Y. Kazama, H. Takayama,K. Torizuka, M. Fukase, and T. Soma. 1975. Estimation ofthyroxine and triiodothyronine distribution and of theconversion rate of thyroxine to triiodothyronine in man.J. Clin. Invest. 55: 1337-1348.
19. Chopra, I. J. 1976. An assessment of daily production andsignificance of thyroidal secretion of 3,3',5'-triiodothy-ronine (reverse T3) in man. J. CGin. Invest. 58: 32-40.
20. Bianchi, R., G. C. Zucchelli, D. Giannessi, A. Pilo,G. Mariani, A. Carpi, and M. G. Toni. 1978. Evaluation oftriiodothyronine (T3) kinetics in normal subjects, inhypothyroid, and hyperthyroid patients using specificantiserum for the determination of labeled T3 in plasma.J. Clin. Endocrinol. Metab. 46: 203-214.
21. Vagenakis, A. G., A. Burger, G. I. Portnay, M. Rudolph,J. T. O'Brien, F. Azizi, R. A. Arky, P. Nicod, S. H. Ingbar,and L. E. Braverman. 1975. Diversion of peripheralthyroxine metabolism from activating to inactivatingpathways during complete fasting. J. Clin. Endocrinol.Metab. 41: 191-194.
22. Braverman, L. E., S. H. Ingbar, and K. Sterling. 1970.Conversion of thyroxine (T4) to triiodothyronine (T3) inathyreotic human subjects. J. Clin. Invest. 49: 855-864.
23. Pittman, C. S., J. B. Chambers, Jr., and V. H. Read. 1971.The extrathyroidal conversion rate of thyroxine totriiodothyronine in normal man. J. Clin. Invest. 50:1187-1196.
24. Braverman, L. E., A. Vagenakis, P. Downs, A. E. Foster,K. Sterling, and S. H. Ingbar. 1973. Effects ofreplacementdoses of sodium-L-thyroxine on the peripheral metabo-lism of thyroxine and triiodothyronine in man. J. Clin.Invest. 52: 1010-1017.
25. Chopra, I. J., D. H. Solomon, U. Chopra, S. Y. Wu, D. A.Fisher, and Y. Nakamura. 1978. Pathways of metabolismof thyroid hormones. Recent Prog. Horm. Res. 34:521-567.
26. Vagenakis, A. G., A. Burger, G. I. Portnay, M. Rudolph,J. T. O'Brien, F. Azizi, R. A. Arky, P. Nicod, S. H. Ingbar,and L. E. Braverman. 1975. Diversion of peripheralthyroxine metabolism from activating to inactivatingpathways during complete fasting. J. Clin. Endocrinol.Metab. 41: 191-194.
27. Carlson, H. E., E. J. Drenick, I. J. Chopra, and J. M.Hershman. 1977. Alterations in basal and TRH-stimulatedserum levels of thyrotropin, prolactin, and thyroidhormones in starved obese men. J. Clin. Endocrinol.Metab. 45: 707-713.
1346 Danforth et al.

28. Burger, A. G., C. Wimpheimer, C. Alliod, and E. Danforth,Jr. 1977. Nutritionally-induced alterations of serumtriiodothyronine (T3) in the rat. Program of the SecondInternational Congress on Obesity, Washington, D. C. 21.
29. Tulp, 0. L., P. P. Krupp, E. Danforth, Jr., and E. S. Horton.1979. Characteristics of thyroid function in experimentalmalnutrition.J. Nutr. 109: 1321-1332.
30. Glass, A. R., R. Mellitt, K. D. Burman, L. Wartofsky, andR. S. Swerdloff. 1978. Serum triiodothyronine in under-nourished rats: dependence on dietary composition ratherthan total calorie or protein intake. Endocrinology. 102:1925-1928.
31. Edozien, J. C., N. Niehaus, M. Mar, T. Makoui, andB. R. Switzer. 1978. Diet-hormone interrelationships inthe rat.J. Nutr. 108: 1767-1776.
32. Stirling, J. L., and M. J. Stock. 1968. Metabolic origins ofthermogenesis induced by diet. Nature (Lond.). 220:801-802.
33. Owen, 0. E., P. Felig, A. P. Morgan, J. Wahren, andG. F. Cahill, Jr. 1969. Liver and kidney metabolism duringprolonged starvation. J. Clin. Invest. 48: 574-583.
34. Balsam, A., and S. H. Ingbar. 1978. The influence offasting, diabetes, and several pharmacological agents onthe pathways of thyroxine metabolism in rat liver.J. Clin.Invest. 62: 415-424.
35. Kaplan, M. M., and R. D. Utiger. 1978. lodothyroninemetabolism in rat liver homogenates. J. Clin. Invest.61: 459-471.
36. Harris, A. R. C., S. Fang, A. G. Vagenakis, and L. E. Braver-man. 1978. Effect of starvation, nutrient replacement, andhypothyroidism on in vitro hepatic T4 to T3 conversion inthe rat. Metab. Clin. Exp. 27: 1680-1690.
37. Gavin, L. A., D. M. Bissell, M. E. Hammond, and R. R.Cavalieri. 1978. Effects of glucose on thyroxine mono-deiodination in primary hepatocyte cultures. Clin. Res.26: 419A (Abstr.)
38. Harris, A. R. C., S. Fang, L. Hinerfeld, L. E. Braverman,and A. G. Vagenakis. 1979. The role of sulfhydryl groupson the impaired hepatic 3',3,5-triiodothyronine genera-tion from thyroxine in the hypothyroid, starved, fetal andneonatal rodent.J. Clin. Invest. 63: 516-524.
39. Balsam, A., and S. H. Ingbar. 1979. Observations on thefactors that control the generation of triiodothyroninefrom thyroxine in rat liver and the nature of the defectinduced by fasting. J. Clin. Invest. 63: 1145-1156.
40. Burger, A. G., C. Wimpfhieirner, M. Berger, and E.Danforth, Jr. 1978. Lack of relationship between starva-tion ketosis and reverse T3 levels. Program of the 60thMeeting of the Endocrine Society. 115.
41. Spaulding, S. W., I. J. Chopra, R. S. Sherwin, and S. S.Lyall. 1976. Effect of caloric restriction and dietarycomposition on serum T3 and reverse T3 in man. J. Clin.Endocrinol. Metab. 42: 197-200.
42. Croxson, M. S., T. D. Hall, 0. A. Kletzky, J. E. Jaramillo,and J. T. Nicoloff. 1977. Decreased serum thyrotropin
induced by fasting. J. Clin. Endocrinol. Metab. 45:560-568.
43. Vagenakis, A. G., A. Burger, G. I. Portnay, M. Rudolph,J. T. O'Brian, F. Azizi, R. A. Arky, P. Nicod, S. H. Ingbar,and L. E. Braverman. 1975. Diversion of peripheralthyroxine metabolism from activating to inactivatingpathways during complete fasting. J. Clin. Endocrinol.Metab. 41: 191-194.
44. Burman, K. D., R. C. Dimond, G. S. Harvey, J. T. O'Brian,L. P. Georges, J. Bruton, F. D. Wright, and L. Wartofsky.1979. Glucose modulation of alterations in serumiodothyronine concentrations induced by fasting. Metab.Clin. Exp. 28: 291-299.
45. Azizi, F. 1978. Effect of dietary composition of fasting-induced changes in serum thyroid hormones andthyrotropin. Metab. Clin. Exp. 27: 935-942.
46. Schonborn, J., J. G. Wechsler, U. Rabast, H. Jager, andH. Ditschuneit. 1977. The effect of dietary compositionand energy on plasma thyroid hormones. Proceedings ofthe Second International Congress on Obesity, Washing-ton, D. C., October 23-26. 10 (Abstr.)
47. Davidson, M. B., and I. J. Chopra. 1979. Effect of carbo-hydrate and noncarbohydrate sources of calories onplasma 3, 5, 3'-triiodothyronine concentrations in man.J. Clin. Endocrinol. Metab. 48: 577-581.
48. Burman, K. D., Y. Lukes, F. D. Wright, and L. Wartofsky.1977. Reduction in hepatic triiodothyronine bindingcapacity induced by fasting. Endocrinology. 101: 1331-1334.
49. DeGroot, L. J., A. H. Coleoni, P. A. Rue, H. Seo, E.Martino, and S. Refetoff. 1977. Reduced nuclear triiodo-thyronine receptors in starvation-induced hypothy-roidism. Biochem. Biophys. Res. Commun. 79: 173-178.
50. Schussler, G. C., and J. Orlando. 1978. Fasting decreasestriiodothyronine receptor capacity. Science (Wash. D. C.).199: 686-688.
51. Wimpfbeimer, C., E. Saville, M. J. Voirol, E. Danforth, Jr.,and A. G. Burger. 1979. Starvation-induced decreasedsensitivity of resting metabolic rate to triiodothyronine.Science (Wash. D. C.). 205: 1272-1273.
52. Portnay, G. I., J. T. O'Brian, J. Bush, A. G. Vagenakis,F. Azizi, R. A. Arky, S. H. Ingbar, and L. E. Braverman.1974. The effect of starvation on the concentration andbinding ofthyroxine and triiodothyronine in serum on theresponse to TRH. J. Clin. Endocrinol. Metab. 39:191- 194.
53. Vinik, A. I., W. J. Kalk, H. McLaren, S. Hendricks, andB. L. Pimstone. 1975. Fasting blunts the TSH responseto synthetic thyrotropin-releasing hormone (TRH).J. Clin.Endocrinol. Metab. 40: 509-511.
54. Oppenheimer, J. H. 1979. Thyroid hormone action at thecellular level. Science (Wash. D. C.). 203: 971-979.
55. Silva, J. E., T. E. Dick, and P. R. Larsen. 1978. Thecontribution of local tissue thyroxine monodeiodinationto the nuclear 3,5,3'-triiodothyronine in pituitary, liver andkidney ofeuthyroid rats. Endocrinology. 103: 1196- 1207.
Thyroid Hormone Metabolism during Overnutrition 1347