dietary assessment of athletes: validation of a four-day
TRANSCRIPT
Dietary assessment of athletes: validation of a four-day weighed
diet record and a physical activity record
Marianne Udnæseth
Master Thesis in Clinical Nutrition
Supervisors:
Christine Helle
Lene Frost Andersen
Department of Nutrition
School of Medicine
UNIVERSITY OF OSLO
May 2009

2
Acknowledgements
The present master thesis in clinical nutrition was planned during spring 2008, after
an inquiry from the Department of Sports Nutrition at the Norwegian Olympic Sports
Centre, Olympiatoppen. The study was conducted at the Department of Nutrition,
University of Oslo, from autumn 2008 to spring 2009.
I would like to thank my supervisors, Christine Helle and Lene Frost Andersen, for
valuable advice and guidance during the planning and implementation of the study.
To Christine and Olympiatoppen, thank you for giving me the opportunity to get
better known with the field of sports nutrition. To Lene, thank you for shearing your
great knowledge and experiences in nutritional methodology and research with me.
I would also like to address a special thanks to Anders Aandstad at the Defence
Institute at the Norwegian School of Sport Sciences for lending me the physical
activity monitors used in this study. Without your contribution, this study would not
have been realized.
To all the athletes who participated in the study, you deserve a big thank-you for
devoting your time and for showing a great positivism and an admirably go-ahead
spirit.
To all my wonderful fellow students, I will miss our daily lunches, discussions, and
all the laughter and fun we have sheared the last five years.
And last but not least I would like to give my deepest thanks to my family and my
dearest Tom-Erik for your support, encouragement, patience and love and for always
having faith in me.
Oslo, May 2009
Marianne Udnæseth

3
Summary
Background: The ability to assess the energy intake (EI) and the energy needs of an
individual athlete or a group of athletes is of vital importance in the field of sports
nutrition. Optimal nutrition may contribute to enhanced performance and recovery
from exercise whereas inadequate EI relative to energy expenditure (EE)
compromises performance and negates the benefits of training. Therefore, meeting
energy needs have become a nutrition priority for athletes. However, the majority of
studies looking at athletes’ energy balance have found limited agreement between
self-reported EI and EE measured using the doubly labelled water (DLW) technique.
The discrepancies between EI and EE cast doubt on the validity of self-reported
dietary data, which is often used as a basis for the dietary assessment of athletes.
Objective: To investigate the validity of a four-day weighed diet record developed
for assessing the dietary intake of Norwegian elite athletes by comparing EI with EE
measured with the physical activity monitor SenseWear Pro2 Armband (SWA) in a
group of male endurance athletes. In addition, EE estimated from a four-day physical
activity record was validated against EE measured with SWA.
Design: The participants completed simultaneously a four-day weighed diet record
and a four-day physical activity record. During the same four days, they also
measured EE with SWA.
Subjects: Thirty-five Norwegian male athletes being members of National teams in
summer sports (rowing, kayaking, orienteering, middle- and long-distance running,
cycling and race walking) volunteered to participate and completed the study.
However, two participants were excluded due to acute sickness during the monitoring
period and defect SWA-measurements. Thus, only 33 athletes were included in the
study.
Results: The EI was on average 7.6% (1.3 MJ/d, P = 0.017) lower than the EE
measured with SWA (EESWA). The 95% confidence limits of agreement in a Bland-
4
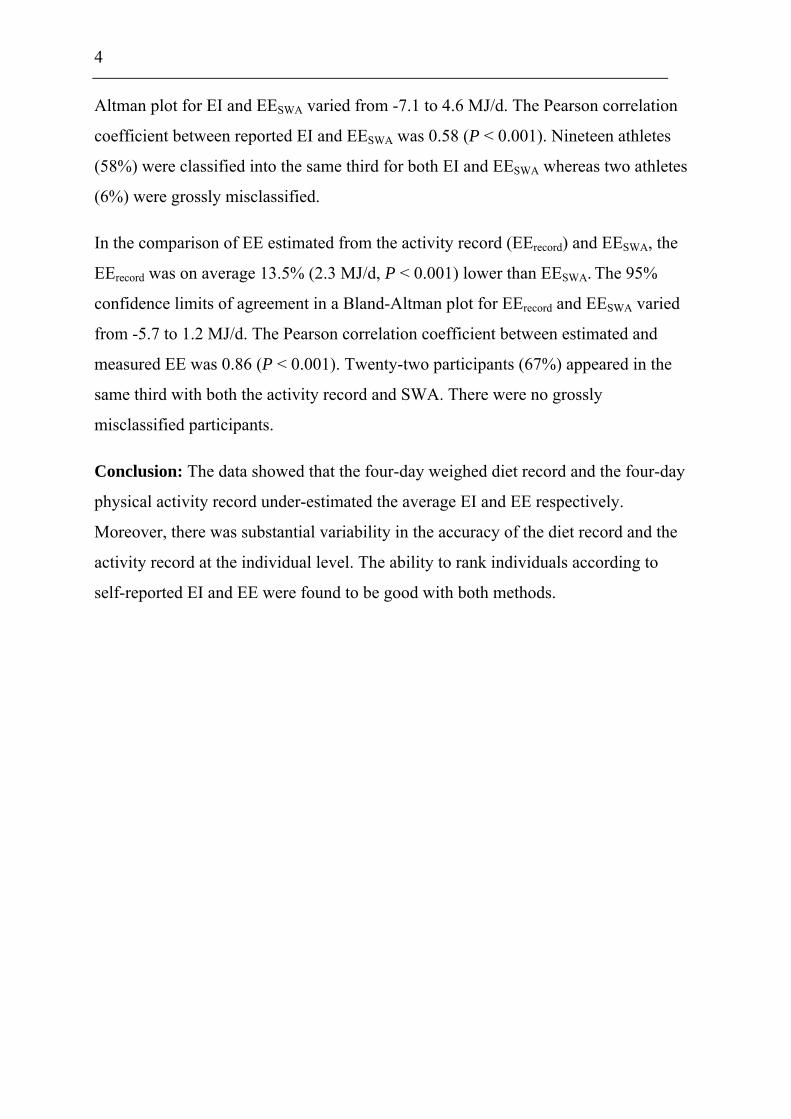
Altman plot for EI and EESWA varied from -7.1 to 4.6 MJ/d. The Pearson correlation
coefficient between reported EI and EESWA was 0.58 (P < 0.001). Nineteen athletes
(58%) were classified into the same third for both EI and EESWA whereas two athletes
(6%) were grossly misclassified.
In the comparison of EE estimated from the activity record (EErecord) and EESWA, the
EErecord was on average 13.5% (2.3 MJ/d, P < 0.001) lower than EESWA. The 95%
confidence limits of agreement in a Bland-Altman plot for EErecord and EESWA varied
from -5.7 to 1.2 MJ/d. The Pearson correlation coefficient between estimated and
measured EE was 0.86 (P < 0.001). Twenty-two participants (67%) appeared in the
same third with both the activity record and SWA. There were no grossly
misclassified participants.
Conclusion: The data showed that the four-day weighed diet record and the four-day
physical activity record under-estimated the average EI and EE respectively.
Moreover, there was substantial variability in the accuracy of the diet record and the
activity record at the individual level. The ability to rank individuals according to
self-reported EI and EE were found to be good with both methods.

5
Norsk sammendrag
Bakgrunn: Vurdering av energiinntaket og energibehovet til en individuell
idrettsutøver eller en gruppe idrettsutøvere er en sentral problemstilling i fagfeltet
idrettsernæring. Et optimalt kosthold kan bidra til å forbedre prestasjon og restitusjon
etter trening, mens et utilstrekkelig energiinntak i forhold til energiforbruk vil ha
negativ innvirkning på prestasjon og redusere effekten av trening. Å dekke
energibehovet har derfor blitt en av prioritetene for idrettsutøvere. Likevel har de
fleste studier som har sett på energibalansen til idrettsutøvere, funnet lite samsvar
mellom selvrapportert energiinntak og energiforbruk målt med dobbelt merket vann
(DLW) metoden. Den observerte differansen mellom energiinntak og energiforbruk
sår tvil om validiteten til selvrapporterte kostholdsdata, som ofte blir brukt som
grunnlag for den individuelle kostveiledningen av idrettsutøvere.
Formål: Formålet med denne studien var å undersøke validiteten til en fire-dagers
veid kostregistrering utviklet for å vurdere kostinntaket til norske toppidrettsutøvere,
ved å sammenligne energiinntak med energiforbruk målt med aktivitetsmonitoren
SenseWear Pro2 Armband (SWA) i en gruppe mannlige utholdenhetsutøvere. I tillegg
ble energiforbruk estimert fra en fire-dagers aktivitetsregistrering validert mot
energiforbruk målt med SWA.
Design: Deltakerne gjennomførte en fire-dagers veid kostregistrering og en fire-
dagers aktivitetsregistrering samtidig. I de samme fire dagene målte de også
energiforbruket sitt med SWA.
Deltakere: Trettifem norske landslagsutøvere i sommeridretter (roing, kajakk,
orientering, mellom- og langdistanse løping, sykling og kappgang) deltok frivillig og
fullførte datainnsamlingen. To utøvere måtte imidlertid ekskluderes på grunn av akutt
sykdom i løpet av registreringsperioden og feil på SWA-målingen av energiforbruk.
Totalt ble 33 idrettsutøvere inkludert i studien.
6
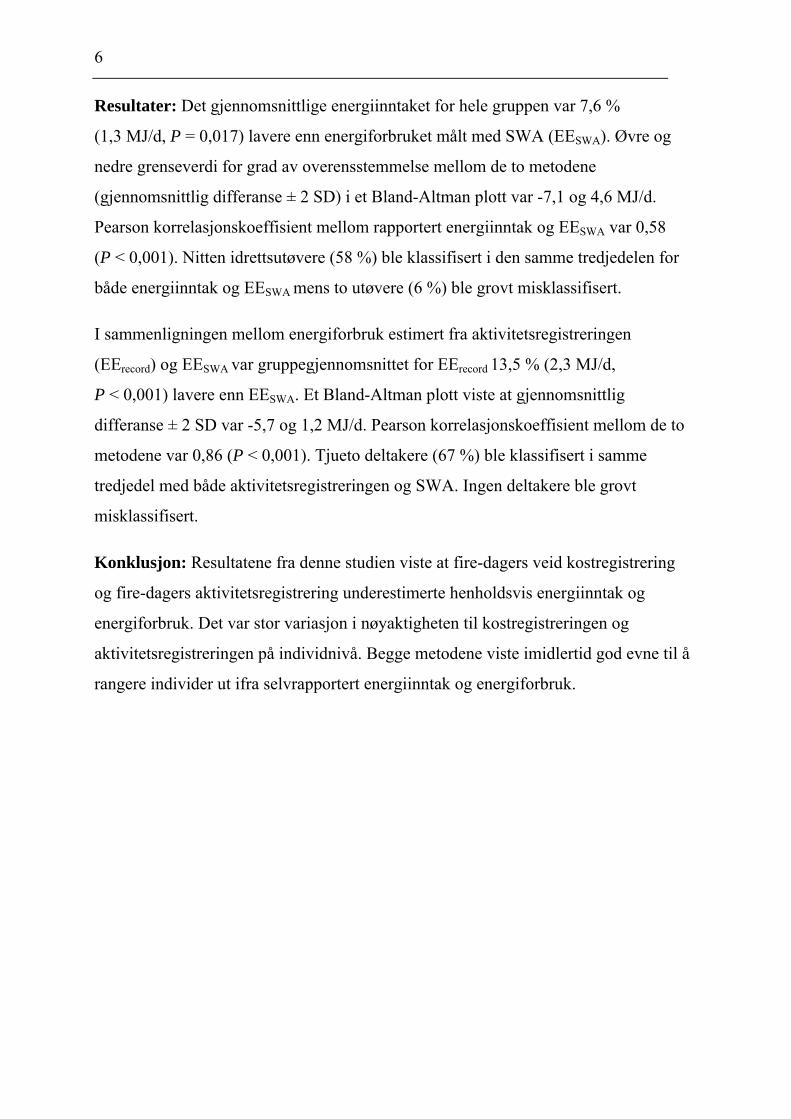
Resultater: Det gjennomsnittlige energiinntaket for hele gruppen var 7,6 %
(1,3 MJ/d, P = 0,017) lavere enn energiforbruket målt med SWA (EESWA). Øvre og
nedre grenseverdi for grad av overensstemmelse mellom de to metodene
(gjennomsnittlig differanse ± 2 SD) i et Bland-Altman plott var -7,1 og 4,6 MJ/d.
Pearson korrelasjonskoeffisient mellom rapportert energiinntak og EESWA var 0,58
(P < 0,001). Nitten idrettsutøvere (58 %) ble klassifisert i den samme tredjedelen for
både energiinntak og EESWA mens to utøvere (6 %) ble grovt misklassifisert.
I sammenligningen mellom energiforbruk estimert fra aktivitetsregistreringen
(EErecord) og EESWA var gruppegjennomsnittet for EErecord 13,5 % (2,3 MJ/d,
P < 0,001) lavere enn EESWA. Et Bland-Altman plott viste at gjennomsnittlig
differanse ± 2 SD var -5,7 og 1,2 MJ/d. Pearson korrelasjonskoeffisient mellom de to
metodene var 0,86 (P < 0,001). Tjueto deltakere (67 %) ble klassifisert i samme
tredjedel med både aktivitetsregistreringen og SWA. Ingen deltakere ble grovt
misklassifisert.
Konklusjon: Resultatene fra denne studien viste at fire-dagers veid kostregistrering
og fire-dagers aktivitetsregistrering underestimerte henholdsvis energiinntak og
energiforbruk. Det var stor variasjon i nøyaktigheten til kostregistreringen og
aktivitetsregistreringen på individnivå. Begge metodene viste imidlertid god evne til å
rangere individer ut ifra selvrapportert energiinntak og energiforbruk.

7
Table of contents
ACKNOWLEDGEMENTS .................................................................................................................2
SUMMARY...........................................................................................................................................3
NORSK SAMMENDRAG ...................................................................................................................5
TABLE OF CONTENTS .....................................................................................................................7
LIST OF TABLES..............................................................................................................................10
LIST OF FIGURES............................................................................................................................11
LIST OF APPENDIXES ....................................................................................................................12
ABBREVIATIONS AND DEFINITIONS........................................................................................13
1. INTRODUCTION....................................................................................................................15
1.1 BACKGROUND........................................................................................................................15
1.1.1 Energy needs of athletes .............................................................................................15
1.1.2 Dietary assessment of athletes ....................................................................................16
1.1.3 The search for an ideal method to assess the energy intake of athletes......................18
1.2 VALIDATION OF DIETARY ASSESSMENT METHODS..................................................................18
1.2.1 Definition of validity ...................................................................................................19
1.3 HOW TO VALIDATE A METHOD ...............................................................................................19
1.4 VALIDATION OF ENERGY INTAKE ...........................................................................................20
1.5 METHODS FOR VALIDATION OF ENERGY INTAKE ....................................................................22
1.5.1 The doubly labelled water technique ..........................................................................22
1.5.2 Indirect calorimetry ....................................................................................................23
1.5.3 Heart rate monitors ....................................................................................................24
1.5.4 Accelerometers............................................................................................................24
8
1.5.5 SenseWear Pro2 Armband.......................................................................................... 25
1.5.6 Physical activity questionnaires................................................................................. 26
1.5.7 Physical activity records ............................................................................................ 26
2. OBJECTIVE AND RESEARCH QUESTIONS ................................................................... 28
2.1 OBJECTIVE ............................................................................................................................ 28
2.2 RESEARCH QUESTIONS .......................................................................................................... 28
3. SUBJECTS AND METHODS................................................................................................ 29
3.1 SUBJECTS .............................................................................................................................. 29
3.1.1 Criteria for participation ........................................................................................... 29
3.1.2 Participation .............................................................................................................. 29
3.2 METHODS.............................................................................................................................. 30
3.2.1 Design ........................................................................................................................ 30
3.2.2 Body measurements.................................................................................................... 31
3.2.3 The test methods......................................................................................................... 31
Four-day weighed diet record .............................................................................................................. 31
Four-day physical activity record ........................................................................................................ 34
3.2.4 The reference method................................................................................................. 35
SenseWear Pro2 Armband.................................................................................................................... 35
3.2.5 Statistical methods ..................................................................................................... 36
4. RESULTS................................................................................................................................. 38
4.1 SAMPLE ................................................................................................................................. 38
4.2 COMPARISON OF ENERGY INTAKE ESTIMATED FROM THE FOUR-DAY WEIGHED DIET RECORD AND
ENERGY EXPENDITURE MEASURED WITH THE SENSEWEAR PRO2 ARMBAND ................................... 39
Accuracy in reporting........................................................................................................................... 42

9
Comparison of macronutrient intake .................................................................................................... 43
Comparison of intake of selected foods and food groups ..................................................................... 44
4.3 COMPARISON OF ENERGY EXPENDITURE ESTIMATED FROM THE FOUR-DAY PHYSICAL ACTIVITY RECORD
AND ENERGY EXPENDITURE MEASURED WITH THE SENSEWEAR PRO2 ARMBAND ............................45
5. DISCUSSION ...........................................................................................................................48
5.1 SAMPLE..................................................................................................................................48
5.1.1 Participation rate........................................................................................................48
5.1.2 The representativity of the sample ..............................................................................49
5.2 THE REFERENCE METHOD.......................................................................................................50
5.2.1 The validity of SenseWear Pro2 Armband...................................................................51
5.3 THE TEST METHODS................................................................................................................53
5.3.1 The validity of the four-day weighed diet record ........................................................53
5.3.2 The use of the EI:EE ratio ..........................................................................................55
5.3.3 Possible reasons for under-estimation of energy intake .............................................56
5.3.4 Characteristics of under-reporters .............................................................................58
5.3.5 The validity of the four-day physical activity record ..................................................58
5.3.6 Possible reasons for under-estimation of energy expenditure....................................59
6. CONCLUSION.........................................................................................................................62
REFERENCE LIST............................................................................................................................64
APPENDIXES.....................................................................................................................................71

10
List of tables
Table 1.1: Why an athlete’s energy intake is of great importance (p. 16)
Table 3.1: Approximate energy costs expressed as multiples of basal metabolic rate (BMR) for six
activity categories (p. 34)
Table 3.2 Example of calculation of total daily energy expenditure for one day based on the four-day
activity record (p. 35)
Table 4.1: Number of participants from different sports (p. 38)
Table 4.2: Physical characteristics of the participants (p. 38)
Table 4.3: Energy intake (EI) estimated from the weighed diet record, energy expenditure measured
with the SenseWear Pro2 Armband (EESWA) and the relationship between EI and EESWA (p. 39)
Table 4.4: Distribution of participants in thirds with regard to energy intake (EI) estimated from the
weighed diet record and energy expenditure measured with the SenseWear Pro2 Armband (EESWA)
(p. 42)
Table 4.5: Physical characteristics, energy intake (EI) estimated from the weighed diet record,
energy expenditure measured with the SenseWear Pro2 Armband (EESWA) and the relationship
between EI and EESWA among under-reporters (UR), acceptable-reporters (AR) and over-reporters
(OR) (p. 43)
Table 4.6: Absolute intake of macronutrients and intake of macronutrients as percentage of energy
estimated from the weighed diet record among under-reporters (UR), acceptable-reporters (AR) and
over-reporters (OR) (p. 44)
Table 4.7: Absolute intake of selected food items and food groups estimated from the weighed diet
record among under-reporters (UR), acceptable-reporters (AR) and over-reporters (OR) (p. 45)
Table 4.8: Energy expenditure measured with the SenseWear Pro2 Armband (EESWA) and estimated
from the activity record (EErecord) and the relationship between EE from the two methods (p. 46)
Table 4.9: Distribution of participants in thirds with regard to energy expenditure estimated from the
activity record (EErecord) and measured by the SenseWear Pro2 armband (EESWA) (p. 47)
11
List of figures
Figure 1.1: The SenseWear Pro2 Armband (SWA) (p. 26)
Figure 4.1: Comparison of energy intake (EI) estimated from the weighed diet record and energy
expenditure measured with the SenseWear Pro2 Armband (EESWA) within and between the different
sports (p. 40)
Figure 4.2: The difference between energy intake (EI) estimated from the weighed diet record and
energy expenditure measured with the SenseWear Pro2 Armband (EESWA) plotted against the mean of
the two methods (p. 41)
Figure 4.3: Energy intake (EI) estimated from the weighed diet record plotted against energy
expenditure measured with the SenseWear Pro2 Armband (EESWA) (p. 41)
Figure 4.4: The difference between energy expenditure estimated from the activity record (EErecord)
and energy expenditure measured with the SenseWear Pro2 Armband (EESWA) plotted against the
mean of the two methods (p. 46)
Figure 4.5: Energy expenditure estimated from the activity record (EErecord) plotted against energy
expenditure measured with the SenseWear Pro2 Armband (EESWA) (p. 47)

12
List of appendixes
Appendix 1: Approvals from the National Committees for Research Ethics in Norway (p. 72)
Appendix 2: Approval from Norwegian Social Science Data Services (p. 75)
Appendix 3: Written invitation to participate in the study (p. 77)
Appendix 4: The record notebook (p. 81)
Appendix 5: Written information about the SenseWear Pro2 Armband given to the participants
(p. 98)
Appendix 6: Control questions to the diet- and activity record (p. 101)
Appendix 7: An example of the feedback the participants received (p. 105)
13
Abbreviations and definitions
Anteroposterior From front to back
AR Actual-reporters
BMI Body mass index (kg/m2)
BMR Basal metabolic rate, the amount of energy expended while at complete rest
in a thermoneutral environment, in the post-absorptive state (after a 12-hour
overnight fast)
CL Confidence limits
CV Coefficient of variation
DLW Doubly labelled water
EE Energy expenditure
EErecord Energy expenditure estimated from the four-day physical activity record
EESWA Energy expenditure measured with the SenseWear Pro2 Armband
EI Energy intake
g Gram
HR Heart rate
IC Indirect calorimetry
kg Kilogram
kJ Kilojoule
Mediolateral Relating to the median (middle) plane and a side
MET Metabolic equivalent
MJ Megajoule, 1000 kJ
Olympiatoppen Resource centre for Norwegian top-level sports

14
OR Over-reporters
P25 The 25th percentile
P75 The 75th percentile
REE Resting energy expenditure
RMR Resting metabolic rate, the amount of energy expended while at rest, a
closely related measurement to BMR but measured under less strict
conditions
RQ Respiratory quotient
SD Standard deviation
Sports products Supplements of carbohydrate and protein in the form of drinks, gels, bars and
powders
SPSS Statistical Package for the Social Sciences, computer program used for
statistical analysis
SWA SenseWear Pro2 Armband, a physical activity monitor
TEE Total energy expenditure
UR Under-reporters
VCO2 Carbon dioxide production (L/minute)
VO2 Oxygen consumption or oxygen uptake (L/minute)

15
1. Introduction
1.1 Background
The ability to assess the energy intake (EI) and the energy needs of an individual
athlete or a group of athletes is of vital importance in the field of sports nutrition. The
fact that optimal nutrition may contribute to enhanced performance and recovery
from exercise has resulted in increasing concern about both the quality and the
quantity of the diets of many athletic groups. Of special concern is their EI.
Inadequate EI relative to energy expenditure (EE) compromises performance and
negates the benefits of training (1). Sports that require a high EE, like endurance
sports, are especially vulnerable.
1.1.1 Energy needs of athletes
The total energy expenditure (TEE) of an athlete is determined by his or her basal
metabolic rate (BMR), the level of activity during training, competition and leisure
time, the thermic effect of food, and in some cases, growth (2). For a male athlete, the
EE of one hour endurance training of high intensity can be more than 4 megajoule
(MJ) (3). The total daily energy requirement of an endurance athlete is consequently
high, often more than 20 MJ (3). A study of male cross country skiers showed that
they had a mean EE of 30.2 MJ/d (4).
Meeting energy needs is a nutrition priority for athletes (1). According to Burke (2)
there are several reasons why the EI of athletes is important (table 1.1).

16
Table 1.1 Why an athlete’s energy intake is of great importance
1. It sets the potential for achieving the athlete’s requirements for energy-containing macronutrients, vitamins, minerals and other dietary compounds required for optimal function and health
2. It assists the manipulation of muscle mass and body fat levels to achieve the specific physique that is ideal for athletic performance
3. It affects the function of hormonal and immune systems Adapted from: Burke LM. Energy needs of athletes. Can J Appl Physiol 2001;26 Suppl:S202-S219.
Many athletes struggle to eat enough food to compensate for their high energy output,
especially in the most intensive periods of training (5). The training load generally
varies from day to day, and consequently athletes will have days and shorter periods
of energy imbalance. A negative energy balance over time will affect performance
and recovery from exercise. Insufficient EI may result in the use of body fat and lean
tissue as energy sources, and subsequently, possibly loss of muscle mass and reduced
strength and endurance (1;6). Additionally, immune, endocrine and musculoskeletal
function may be compromised (7;8). At the long-term, nutrient deficiencies may arise
and further compromise health (1).
The majority of studies looking at athletes’ energy balance have found limited
agreement between self-reported EI and EE measured using the doubly labelled water
(DLW) technique (9-16). Under-reporting of EI is a general problem and some
studies have suggested that under-reporting is even greater as EE increases (12;17-
20). The discrepancies between EI and EE cast doubt on the validity of self-reported
dietary data. Under-reporting makes it difficult to give appropriate diet
recommendations, because the recommendations often are based on self-reported
dietary data. As a consequence, performance and health may suffer.
1.1.2 Dietary assessment of athletes
A number of techniques may be used for the dietary assessment of individuals and
groups of athletes. These can be classified into two major categories; retrospective

17
and prospective methods. Retrospective methods include 24-hour diet recall, food-
frequency questionnaire (FFQ) and diet history. These methods recall past
consumption. Prospective methods include duplicate portion, estimated and weighed
diet records and measures food intake at the time of consumption. The application,
strengths and limitations of these methods have been extensively reviewed elsewhere
(21-23).
A three to four day estimated diet record is the most widely used approach in the
clinical practice of sports nutrition (2;24;25). However, weighed records, modified
diet histories and collections of single or multiple 24-hour diet recalls are also
commonly used (20;25). When performing an estimated diet record, the subject is
asked to keep a detailed record of all foods and drinks consumed during the recording
period. The amount of each food item is quantified by describing portions in terms of
household measures (glasses, spoons etc.), in dimensions or number of items of
predetermined size (20;26). This method is relatively simple and less demanding for
the athlete compared to the weighed dietary method (26).
Despite the advantages of the estimated diet record, it is less accurate than the
weighed method provided that respondents are trained and motivated (25). The
weighed diet record follows the same procedure as the estimated method, except that
the subject has to weigh each item of food and drink at the time of consumption,
rather than estimate. The weighing procedure can be demanding and is highly
dependent on subject co-operation. The compliance may be poor and subjects may
alter their food patterns to simplify the recording, thereby introducing bias (26).
An alternative approach to assess the EI and energy needs of athletes is to measure
their EE (26). Measuring EE will not give any qualitative information about the diet.
However, it will make a basis for dietary plans and guiding of athletes regarding how
much food is needed to achieve energy balance. Practical ways of assessing EE in
everyday life include heart rate monitors, physical activity monitors like
accelerometers, and physical activity questionnaires and records (27;28).
18
1.1.3 The search for an ideal method to assess the energy intake of athletes
The ideal method to assess the EI of athletes should provide as accurate data as
possible while placing minimal burden on both the athlete and the nutritionist. The
Department of Sports Nutrition at the Norwegian Olympic Sports Centre,
Olympiatoppen, has developed a four-day weighed diet record as a tool for assessing
the diet of Norwegian elite athletes. Additionally, a self-developed physical activity
record for the estimation of EE is considered for use at Olympiatoppen.
In order to be able to give athletes appropriate nutritional recommendations, it is
important to have knowledge about the accuracy of dietary methods used in the
clinical practice. To test whether a four-day weighed diet record provides reasonable
estimates of true EI of elite athletes, and whether an activity record can give
reasonable estimates of EE, these methods needs to be validated. The purpose of this
study is to evaluate one established and one potential method for collecting data on
EI and EE of athletes at the Norwegian Olympic Sports Centre.
1.2 Validation of dietary assessment methods
It is crucial for a dietary survey that the method gives accurate data. Validation
studies are performed to give knowledge about how good a method is to measure the
true dietary intake, and to investigate which types of error that may be associated
with the method. Today there is no method for dietary assessment available that can
measure the diet of an individual or a group of individuals without error. This
inaccuracy can affect the interpretation of the results of a dietary survey, or the
interpretation of the relation between diet and health (29). In the sports nutrition
setting, it can affect the interpretation of the relation between diet and physical
performance. To avoid wrong conclusion due to incorrect data, it is therefore of high
importance to investigate the quality of these methods. The quality of a dietary

19
assessment method can be expressed by the means of its validity and reproducibility.
In this thesis only validity is discussed.
1.2.1 Definition of validity
Validity is an expression of the degree to which a measurement is a true and accurate
measure of what it is designed to measure (30). To illustrate; a valid diet record is one
in which the subject records exactly what he/she ate and drank during the period of
study and this is what he/she would have eaten and drunken if no investigator had
intervened (26;31). A study is considered to be valid if the findings can be taken as
being a reasonable representation of the true situation (30).
1.3 How to validate a method
Validity can be investigated by comparing the results from a new or alternative
method (test method) with the results from a true external reference method. In
nutrition, no such reference method exists. It is not possible to have an absolute
measure of the true dietary intake. Because every measurement of dietary intake
includes some bias, only the “relative” validity can be assessed when two dietary
methods are compared (30).
The results from the test method can be compared against the results from another
method that is assumed to be more accurate than the test method. The weighed
dietary record has often been assumed to be the gold standard in validation studies of
dietary intake, and has thus been frequently used as a reference method (31). The
results from the test method can also be compared against objective biological
markers of intake (29;31). There are two types of biomarkers; recovery and
concentration biomarkers. Recovery biomarkers have a known quantitative time-
associated relation between dietary intake and recovery (excretion) in human waste,
and can be used for validating absolute dietary intake. Examples of recovery

20
biomarkers are DLW which is a biomarker for TEE and urinary nitrogen which is a
biomarker for protein intake (32).
To assess whether the validity of a method is satisfactorily, several criteria have to be
fulfilled (29). As already mentioned, the reference method must be regarded as more
accurate than the test method. Secondly, the reference method has to measure food
intake at the same level as the test method. If the test method gives information about
the intake at group level, so the reference method has to do. Furthermore, the test and
the reference method should not contain the same type of error. However, when
validating one dietary assessment method against another, the two methods often
contain both independent and dependent error. Recovery biomarkers as reference
have the advantage that they do not contain the same error as a dietary method.
Ideally, one should choose two reference methods and compare the results from the
test method with the results from both another dietary method and a valid recovery
biomarker. Whether to include one or two reference methods is often a matter of
resources (29;32).
Another important aspect is the sequence in which the reference and the test method
are administered. The test method should be administered first to avoid any influence
on the reference method. Finally, the participants in the validation study should be a
sample from the population where the test method is planned to be used. Due to a
great workload often associated with participation in validation studies, it can be
difficult to obtain a representative sample. Those who are willing to participate, are
generally more motivated than the population the method is directed to (29). It is
important to have this in mind when interpreting the results.
1.4 Validation of energy intake
Incorrect reporting of food intake, primarily under-reporting, is a major problem in
dietary surveys and represents a pressing issue for nutritionists in general as well as
sports nutritionists. From the growing body of research it is now apparent that there is
21
a generalized under-reporting of food intake in many subject groups, including
children, teenagers, elderly, obese individuals, military personnel, trekking explorers
and athletes (14;33). Among athletes, under-reporting differs widely from 0% in male
cross country skiers to 43% in elite female swimmers, as presented in a review by
Hill and Davies (14).
Although many factors are associated with under-reporting, the reasons for this
phenomenon are not clear. The term under-reporting involves both conscious and
unconscious omission of food items and under-eating (dieting) (34). Some studies
suggest that under-reporting is more prevalent in women than in men. In a study of
Norwegian males and females aged 16-79 years, Johansson et al. (35) found that
significantly more women (45%) under-reported their EI compared to men (38%).
This is in accordance with other national surveys (36-38) and may also be the case
among athletes. In a study of Greek swimmers and water polo players, twice as many
women under-reported compared to men (39).
The highest degree of under-reporting is observed among female athletes but fewer
studies of male athletes are available (14). The higher under-reporting in women is
linked to the increased prevalence of weight consciousness and thus dietary restraint
in this group. This is especially true in sports where body weight affects performance
and where there is a distinctive advantage of being lean (2;12).
Studies have also shown considerably under-reporting of EI among obese subjects,
and that the degree of under-reporting is positively correlated with degree of obesity
(14;40). Similarly, it has been observed that the larger the body mass index (BMI) of
an athlete the greater the difference between reported EI and DLW-values of EE (12).
This indicates that perceived body image may influence the accuracy in reporting
food consumed. There also seems to be a trend for absolute under-reporting to
increase as EE increases. One suggested explanation for this is that athletes
consuming large amounts of food perhaps tend to forget to report a substantial
portion of it (20). Educational level, income and socio-economic status are other
factors related to under-reporting (14).

22
To document and deal with the incorrect reporting of food intake it is important to
validate EI against an objective criterion method, such as a measurement of EE. The
use of EE for validating EI is based on the principle of energy balance and the
fundamental physiological equation:
EI = EE ± changes in body stores
Because energy can neither be created nor destroyed, EI must equal EE unless there
is a change in body energy stores (41). At the group level and in the time scale of a
dietary assessment, body weight can be regarded as constant, and therefore, mean EI
must equal mean EE (26).
1.5 Methods for validation of energy intake
Several methods are developed to measure EE and can accordingly be used for
validation of EI. However, these methods vary in accuracy, feasibility and costs.
There are three types of EE assessment methods that can be distinguished: criterion
methods, objective methods and subjective methods. Criterion methods like DLW
and indirect calorimetry (IC) are the most reliable and valid measurements against
which all other EI and EE assessments methods should be validated, but they also
hold important drawbacks. Objective EE assessment methods include activity
monitors and heart rate monitors. Finally, questionnaires and activity diaries are
considered subjective methods (28). The following section gives a brief description
of the techniques introduced above.
1.5.1 The doubly labelled water technique
The DLW technique is the gold standard for measuring EE under free-living
conditions. The subject is given a dose of water enriched with the stable isotopes
deuterium (2H) and oxygen-18 (18O). Body fluid samples, usually urine samples, are
collected at baseline before administration of the dose and subsequently either daily
23
(multipoint method) or at the beginning and end of the measurement period (two-
point method) (42). The urine samples are analysed by isotope ratio mass
spectrometry to determine the rate of disappearance of each isotope from the body.
Deuterium is lost in water only, whereas oxygen-18 is lost in both water and carbon
dioxide (CO2). The difference between the two disappearance rates can therefore be
used for calculating CO2 production. By applying standard indirect calorimetric
equations and an estimate of the respiratory quotient (RQ), TEE can be calculated
(43).
The measurement period is commonly 14 days, but periods of 7-21 days have also
been used. In validation studies, the DLW method has shown accuracy in the order of
1-3% and precision of 2-8%. More details about the DLW technique is presented
elsewhere (44).
DLW is a useful method for monitoring EE in the field because it places minimal
burden on the subjects and no restrictions on daily life. Unfortunately, the
requirement of laboratory facilities and the costs of the enriched water samples and
analysis limit this method for research use. It is not suitable as a routine tool for
validating EI data (30). Another disadvantage about the DLW technique is that it only
gives an estimate of the mean EE during the period of measurement and not day-to-
day or hour-by-hour EE.
1.5.2 Indirect calorimetry
IC is a commonly used method for assessing EE in humans (6). The method estimates
EE by determining the volume of oxygen consumed (VO2) and the volume of CO2
produced (VCO2) over a given time period. The equipment varies, but most
commonly the subject breathes into a mouthpiece or a ventilated hood through which
the subjects expired gases are collected. Knowing the VO2 and VCO2, different
formulae can be used for calculating EE. IC can also provide information concerning
the relative contribution of the different energy-containing macronutrients to the TEE
(6).
24
IC is most often used for measuring resting energy expenditure (REE) and for
determining the required level of EI in a hospital setting. The method can also be
used for measuring EE during exercise, however, due to the uncomfortable
mouthpiece and the nose clip the subject needs to wear, it is not suitable for long
periods of measurement (45). The measurement equipment makes the situation
artificial, and the method can thus not give an optimal TEE measurement of a normal
life situation. Even though IC represents one of the most valid measurements of EE
(28), it is not an appropriate method for measuring the EE of athletes for several days.
1.5.3 Heart rate monitors
Estimating EE from heart rate (HR) is a relatively inexpensive and simple method to
perform. It has therefore been investigated in many studies (46-49), including studies
of athletes (50;51). The method is based on the assumption of linear correlation
between HR and VO2 during most activities (27). When the individual relationship
between HR and VO2 is determined, measurement of VO2 can then be used for
calculating EE at different HR’s (52).
One of the main limitations of this method is that during very low or very high
intensities, the relationship between HR and VO2 becomes non-linear. Also, during
quick changes in intensities the HR response lags behind. This will introduce a small
error when HR is used for predicting EE. However, it appears to be a general
consensus that the HR method provides satisfactory estimates of average EE at the
group level (46;47;49;53).
1.5.4 Accelerometers
Accelerometers are electronic motion sensors that measure dynamic body movement
in terms of acceleration (54). Acceleration is the change in velocity with respect to
time (m/s2). The accelerometers are usually uniaxial or triaxial. Uniaxial
accelerometers measure acceleration in one direction, usually in the vertical plane.
Triaxial accelerometers measure acceleration in the anteroposterior, mediolateral and

25
vertical direction and thus provide better precision (55). The devices can be worn on
the waist, hip, low back, wrist or ankle, however the waist is the most common
position because it is closest to the centre of the body (54).
The disadvantage with accelerometers is that they are insensitive to certain activities
like static work, stair climbing and bicycling (56). Different brands of accelerometers
are commercially available, but in a recent review of eight different devices only one
showed reasonable correlation with DLW derived EE (57).
1.5.5 SenseWear Pro2 Armband
The SWA (Body Media, Pittsburg, PA., USA) is a newly developed multiple-sensor
device to estimate EE (figure 1.1). The device is a wireless armband which combines
five different sensors and is worn in contact with the upper arm skin surface.
According to information provided by the manufacturer (www.bodymedia.com), the
armband incorporates a variety of measured parameters (accelerometry, skin
temperature, near-body temperature, heat flux, galvanic skin resistance) and
demographic characteristics (gender, age, height, weight) into proprietary algorithms
to estimate EE. The biaxial accelerometer measures motion and provides information
about body position. The skin temperature sensor and near-body temperature sensor
consist of sensitive thermistors in contact to the skin relying on change in resistance
with changing temperature. The heat flux sensor uses the difference between skin
temperature and near-body temperature to assess heat loss from the body. The
galvanic skin response sensor measures the conductivity of the skin between two
electrodes in contact to the skin. The conductivity of the skin varies according to
physical and emotional stimuli. For instance, when you sweat, the skin becomes more
electrically conductive. See figure 1.1 for illustration of the armband and its sensors.

26
Figure 1.1 The SenseWear Pro2 Armband (SWA)
1. Two-axis accelerometer
2. Skin temperature sensor
3. Near-body temperature sensor
4. Heat flux sensor
5. Galvanic skin response sensor
SWA has been validated against IC and the DLW method in several studies and
among different subject groups (58-70). The results from these studies are somewhat
ambiguous, but when compared to other activity monitors SWA seems to represent
one of the best estimates of TEE (60;69).
The design of SWA (wireless, small and lightweight) makes it comfortable to wear,
which is especially important when assessing physical activity in athletes. The main
limitation for the use in athletes is that it can not be used during any water activities.
1.5.6 Physical activity questionnaires
Physical activity questionnaires, either self-reported or interviewer-administered, are
the most common tools for assessment of physical activity (71). Although the
methodology is cheap and allows large-scale application, the reliability and validity is
low (72). In general, people tend to over-estimate physical activity and under-
estimate sedentary activity (73). Activity questionnaires can be used as an activity-
ranking instrument (71), but have limited application to estimate daily EE (74-76).
1.5.7 Physical activity records
Another practical way to estimate EE is by the means of an activity record and the
factorial approach. This method calculates TEE using information on BMR, the time

27
devoted to different activities and the energy cost of each activity (BMR-multiple)
throughout 24-hour periods (77). The average energy costs of different activities can
be found in various reference lists. The values from the reference lists are mainly
based on data from IC-measurements of a wide range of activities, where the EE is
expressed as either multiples of BMR (78) or multiples of one metabolic equivalent
(MET) (79;80). One MET is considered a resting metabolic rate (RMR), which for
the average adult is approximately 1 kcal per kg bodyweight per hour or 3.5 ml
oxygen per kg bodyweight per minute. Therefore, METs, similarly to BMR-
multiples, express energy costs of physical activities as multiples of RMR (79;80).
RMR is considered approximately equal to BMR, and these terms are here used
interchangeably.
Activity records have the advantages that they are inexpensive and do not rely on
complicated methodology. However, the accuracy of an activity record is highly
dependent on the co-operation of the subject. To be accepted, the record has to be
very simple. A such simplified method was originally described by Bouchard et al.
1983 (81). Subsequently, different modifications of this method have been used for
the assessment of EE. They vary from three to seven days, including one Saturday or
Sunday, and a day is commonly divided into 96 periods of 15 minutes each
(50;82;83). Usually, activities are classified on a scale from 1 (rest) to 9 (heavy
exercise) with a corresponding energy cost derived from a comprehensive review of
literature. Even though the activity record is an inexpensive method, it is time-
consuming and has shown limited accuracy (83), especially in athletes with a high EE
(50).

28
2. Objective and research questions
2.1 Objective
In the present study the aim is to investigate the validity of a four-day weighed diet
record developed for assessing the dietary intake of elite athletes. EI estimated from
the diet record is compared with EE measured with SWA in a group of healthy male
athletes in endurance sports. In addition, EE estimated from a four-day physical
activity record is validated against EE measured with SWA. The validity at both the
individual level and the group level is considered in the study.
2.2 Research questions
The following research questions have been formulated:
Main:
1. To what extent is the EI estimated from a four-day weighed diet record in
accordance with the EE measured with SWA among Norwegian male elite
athletes in endurance sports?
2. To what extent is the EE estimated from a four-day physical activity record in
accordance with the EE measured with SWA?
Secondary:
3. To what extent do Norwegian male elite athletes in endurance sports under-
report or over-report their EI?
4. Are there any differences in the intake of macronutrients and in the intake of
selected food items and food groups in the diet between those who incorrectly
report (under- or over-report) their diet and those who do not?

29
3. Subjects and methods
3.1 Subjects
The participants in the present study were recruited from the following summer sports
classified as endurance sports: rowing, kayaking, orienteering, middle- and long-
distance running, cycling and race walking. Only males were invited to participate.
Invitation letters were sent to a total of 71 athletes.
3.1.1 Criteria for participation
There were three inclusion criteria to participate in the study. The athletes had to 1)
be 18 years or older, 2) be a member of a national team in a summer endurance sport,
and 3) be healthy and free from injuries in the data collection period.
Participants who were sick or injured, and thus could not exercise as usual, were
excluded from the study.
3.1.2 Participation
Thirty-five male elite athletes volunteered to participate in the study. This amount to
49% of those who where invited. The participation rate was 44-89% in all sports,
except in cycling where only 22% of the invited wanted to participate. The highest
participation rates were observed for rowing, kayaking and orienteering, with 89%,
60% and 58% respectively.
All 35 athletes completed the diet- and activity registrations. However, two subjects
were excluded due to acute sickness during the registration period and defective
SWA-measurements of EE, respectively. Thus, a total of 33 athletes were included in
the study.

30
3.2 Methods
3.2.1 Design
The study was approved by The National Committees for Research Ethics in Norway
(appendix 1) and Norwegian Social Science Data Services (appendix 2).
Participants were recruited consecutively from September 2008, and the data
collection was completed from September 2008 to January 2009. The study was
conducted in the athletes’ training season, which is the part of the year without
competitions.
Before recruitment of participants, address lists of male members of the national team
in each sport were obtained from the national sport federations. The athletes received
a written invitation to participate in the study by mail (appendix 3). Those who were
interested in participating were asked to return a written consent in a post paid self-
addressed envelope (appendix 3). The investigator (the master student) then contacted
each participant to arrange when and where to meet to include them in the study. The
athletes resided in or nearby Oslo were asked to meet at Olympiatoppen at an
optional day and time. Athletes resided farther away were offered to meet the
investigator in the city nearest to their home, so the inclusion would involve as little
load as possible for the athlete.
The participant had to meet the investigator both before and after the data collection
period. Body weight was measured both times. After thorough instructions at the first
meeting, the athletes performed a weighed diet record, an exercise registration, and a
physical activity record for four days (appendix 4). In the same four days, they also
wore the physical activity monitor SWA to measure their EE (appendix 5). At the
second meeting, the record notebooks were checked for any obscurities and the
participant had to answer some control questions to the diet- and activity registration
(appendix 6). At this meeting the participants were also rewarded with a cook book
for athletes.

31
When all results were processed, the athletes received a written evaluation of their
diet by mail. Appendix 7 shows an example of a written feedback given to one of the
participants. The participants were invited to contact the investigator if they had any
questions to the feedback or wanted to make an appointment to go through the
results.
3.2.2 Body measurements
Body measurements of the participants included weight and height. These data were
used for calculating BMI and for estimating BMR. Weight and height were also
applied to the software when downloading data from the SWA.
Body weight was measured both before and after the data collection period, to the
nearest 0.1 kg using the Seca Alpha 770 electronic weighing scale. The athletes were
weighed in underwear and without shoes. The mean of the two measurements of
body weight is presented in the results. Height was partly self-reported (n=12) and
partly measured to the nearest 0.1 cm using the Seca electronic stadiometer (n=21).
BMI was calculated as body weight (mean of two measurements) divided by the
square of height (kg/m2).
3.2.3 The test methods
Four-day weighed diet record
The four-day weighed diet record (appendix 4) used as the main test method in this
study is developed for the use among elite athletes in Norway.
The participants were provided with record notebooks and a digital kitchen scale
(Soehnle Page) measuring with a precision of ± one gram and a maximum of 5000
grams. The digital kitchen scale also had a tare function to make the weighing of
meals and composite dishes easier for the participants.

32
The athletes were given both practical and written instructions on how to weigh and
describe in detail the consumption of food and beverage, and to measure and note all
foods wasted and not eaten. It was stressed that the purpose of the study was to
measure the habitual food intake and that any temptations to change the diet in order
to simplify or make the diet healthier should be counteracted. They were also
instructed not to make an attempt to reduce or increase their bodyweight during the
registration period. Each participant was invited to contact the investigator by phone
or by email if any questions appeared during the four days of recording.
The data collection had to be carried out when the athletes were in Norway, and
preferably when they lived at their place of residence. The measurement period
consisted of four consecutive days including one Saturday or Sunday; either from
Wednesday to Saturday or from Sunday to Wednesday. During four days, the
participants recorded all their consumption of food items, drinks and dietary
supplements in grams or millilitres. They were asked to give time of meal and brand
name and product name of every food item. Additionally, they were asked to provide
a complete description of the method for cooking and recipes for composite dishes. If
foreign or rare food items were eaten, they were asked to enclose the packing with
nutrient content. If meals were eaten outside the home with no chance of weighing
the food, the athletes were instructed to make a note of the menu and describe the
food eaten in household measures.
When the participants handed back their record notebooks, the notebooks were read
through by the investigator to check for possible obscurities which then could be
solved with the participant. At the same time, they had to answer some control
questions about the diet during the recording period, any change in bodyweight,
sickness and use of medicine (appendix 6). Any use of dietary supplements and
sports products was also checked with regard to type, dosage and frequency of use.
The dietary assessment included results on consumption of food items, drinks and
supplements, intake of energy and nutrients, meal pattern, time for meals in relation
to exercise, and consumption of food and drink before, during and after exercise. It is

33
only the intake of energy, macronutrients and selected food items that are described
in this work. The remaining data were used in the nutritional feedback to the
participants.
The daily intake of energy and macronutrients was calculated using a food database
and software system (Mat på Data, version 5.0). This database was originally
developed at a Norwegian association for diet and health (Landsforeningen for
kosthold og helse) and later taken over and updated by the Norwegian Food Safety
Authority. The food database is based on the official Norwegian Food Composition
Table (2006). The food database was manually supplemented with data on new food
items when needed by the investigator. The new food items added were mainly sports
products, ready-made food and newly launched products. Nutrient information was
collected from the packing, producer or food databases in other countries.
Microsoft Office Excel 2003 was used for alphabetically sorting of food items eaten
by each participant, and for calculating mean daily intake in grams of selected food
items and food groups. These data was used in the comparison of food intake
between under-reporters (UR), actual-reporters (AR) and over-reporters (OR). In the
same comparison, the category fruit and berries included only fresh fruit and berries.
Vegetables did not include potatoes. Milk included both milk and cultured milk used
as drink, in coffee or tea, or on breakfast cereals. In the category sports products,
supplements of carbohydrate and protein (bars, powders, drinks and gels) were
included.
Exercise registration
The participants recorded all exercise performed during the same four days as the diet
record. The Department of Sports Nutrition at Olympiatoppen has composed a
scheme for registration of exercise for use in the combination with the diet record and
an activity registration (appendix 4).
Both practical and written information on how to fill inn the scheme were given at the
inclusion meeting. The participants were supposed to make notes on time for

34
exercise, what kind of exercise performed (endurance, strength, technique etc.),
intensity level and total duration of each exercise in minutes. On this scheme they
were also supposed to record any intake of food and liquid during the exercise.
The main purpose of the exercise registration is to calculate total minutes of exercise,
and assess the intake of liquid and carbohydrates per hour exercise. This is important
for the individual feedback to the athletes. Detailed information about exercise is also
useful for the application of appropriate energy costs of activities in the activity
record described below.
Four-day physical activity record
A four-day physical activity record was designed to estimate EE. In the record, a day
was divided into 48 30-minute intervals. The athletes were asked to precisely fill in
the kind of activity they performed every 30 minutes during the four days of
registration (appendix 4). Both practical and written information were given on how
to fill in the scheme and how to define the activities, e.g. sleeping, lying down,
sitting, walking, light exercise, moderate exercise, hard exercise etc. The activity
diaries were reviewed with the participants at the time of delivery.
Physical activity was categorized into six categories, according to Manore and
Thompson 2000 (84) (table 3.1).
Table 3.1 Approximate energy costs expressed as multiples of basal metabolic rate (BMR) for six activity categories
Activity category Examples Energy cost per unit of time of activity
Resting Sleeping, reclining BMR × 1.0 Very light Seated and standing activities BMR × 1.5 Light Slow walking, house-cleaning BMR × 2.5 Moderate Moderate walking, slow cycling, stretching,
carrying a load BMR × 4.0
Strenuous Walking uphill with a load, jogging/running, weight training, moderate pace exercise
BMR × 7.0
Very strenuous Fast running, race pace BMR × 10.0 Adapted from: Manore M, Thompson J. Energy requirements of the athlete: assessment and evidence of energy efficiency. In: Burke L, Deakin V, eds. Clinical Sports Nutrition. Roseville: McGraw-Hill Book Company Australia Pty Limited 2000:124-45.

35
When estimating the EE, the total hours spent in each activity category was
multiplied with the given average energy cost for that category (table 3.1). This result
was further multiplied with estimated BMR divided at 24 hours. BMR was estimated
from the Harris-Benedict equation for males:
BMR = 66.47 + (13.75 × weight) + (5 × height) – (6.76 × age)
The energy costs of all activities performed during a day was then added up to give
an estimate of TEE that day. See table 3.2 for an example of calculation. The mean
estimated EE of four days is presented in the results.
Table 3.2 Example of calculation of total daily energy expenditure for one day based on the four-day activity record BMR estimated from the Harris-Benedict equation: 7432 kJ/day (7.4 MJ/day) Activity category BMRa-
multiple Time spent at the activity
(hours)
Calculation Total energy coof each activity
(kJ)
st
Resting 1.0 11.5 1.0 × 11.5 × 7432 / 24 3561 Very light 1.5 8.0 1.5 × 8.0 × 7432 / 24 3716 Light 2.5 2.0 2.5 × 2.0 × 7432 / 24 1548 Moderate 4.0 1.5 4.0 ×1.5 × 7432 / 24 1858 Strenuous 7.0 1.0 7.0 × 1.0 × 7432 / 24 2168 Very strenuous 10.0 0 10.0 × 0 × 7432 / 24 0 Total 24 12 851 aBasal metabolic rate.
3.2.4 The reference method
SenseWear Pro2 Armband
As recommended by the manufacturer, the athletes wore the armband on the right
arm over the triceps muscle at the midpoint between the shoulder and the elbow. The
armband was worn during the same four days as the athletes performed the weighed
diet record and the activity record. Both practical and written information about the
SWA was given to participants (appendix 5). The investigator illustrated where and
how to place the armband. It was stressed that the armband had to be put on before

36
midnight prior to the first recording day and removed after midnight at the last
recording day. The purpose of this was to get complete 24-hour measurements during
the four days of recording. All participants were instructed to remove the armband
only for bathing purposes or any water activities. They were also asked whether it
was likely that they were going to perform any water activities during the test period,
but this was not likely for none of them.
The data from the monitor was downloaded with software developed by the
manufacturer (Innerview Professional Research Software Version 5.1, BodyMedia
Inc., Pittsburgh, PA, USA). Descriptive characteristics (sex, age, height, and weight)
were entered into the software program before initializing the monitor. When
downloading the data, the software provided percentages of on-body time. A
threshold of 95% on body time was used for including an individual in the data
analyses.
3.2.5 Statistical methods
Sample size calculation for the study was based on calculation of a standardized
difference (2δ/SD), using a standard deviation (SD) of EI of 2 MJ and a clinically
relevant difference (δ) of 1 MJ (85). Choosing a significance level of 0.05 with 80%
power, a nomogram for calculating sample size (85) estimated that we needed 32
subjects to be sure to detect a mean difference of 1 MJ between EE measured with
SWA and EI assessed with the weighed diet record.
Statistical analyses were performed using SPSS version 16.0 (SPSS inc., Chicago, IL,
USA). Results were considered to be statistically significant at P < 0.05.
The data of the whole group (n=33) were approximately normally distributed, and
parametric statistical analyses have been used for this group. These data are presented
as mean, median and SD. Mean differences between the test methods and the
reference method were analysed using the Student t-test for paired samples.

37
The agreement between the test method and the reference method at the individual
level was analysed by the method proposed by Bland and Altman (86), using a plot of
the difference between the two methods against the average of the measurements.
This type of plot shows the magnitude of disagreement, spots outliers and any trend.
Furthermore, the ability of the test methods to rank individuals according to EI and
EE were assessed using Pearson correlation coefficient and by classification of EI and
EE in thirds.
The accuracy of reported intake was calculated by expressing the ratio of EI:EE, for
which a value of 1 would mean complete agreement between EI and EE. Actual-
reporters (AR) were defined as having EI:EE in the range of 0.80-1.20, under-
reporters (UR) a ratio less than 0.80, and over-reporters (OR) a ratio larger than 1.20.
Comparisons between UR and AR were conducted using non-parametric statistical
analyses, since the data of the small group of UR were not normally distributed.
These data are presented as median values with the 25th and 75th percentiles
(P25, P75) to describe variability. Differences between UR and AR were tested using
the Mann-Whitney test. The results for the OR-group is presented in the tables but
were not included in the statistical testing because only two subjects were in this
group.

38
4. Results
4.1 Sample
Thirty-three male endurance athletes were included in the study. All participants
fulfilled the requirement of wearing the SWA more than 95% of the time of
registration. The distribution of participants from different sports is shown in table
4.1.
Table 4.1 Number of participants from different sports Male athletes (n=33) Rowing 8 Middle- and long-distance running 8 Orienteering 7 Kayaking 4 Cycling 4 Race walking 2
The athletes’ mean and median age, height, weight, BMI and exercise hours per day
are outlined in table 4.2.
Table 4.2 Physical characteristics of the participants Total (n=33) Mean Median SDa
Age (years) 22.5 21.3 3.9Height (cm) 184.8 183.0 6.8Weight (kg) 75.9 73.8 8.8BMIb (kg/m2) 22.2 22.1 1.7Exercise (hours/d) 1.9 1.9 0.6 aStandard deviation. bBody mass index.
39
Initial body weight did not differ significantly from the body weight observed
following the four-day assessment period (75.9 (8.8) kg vs. 75.8 (8.9) kg (mean
(SD)), P = 0.258).
4.2 Comparison of energy intake estimated from the four-day weighed diet record and energy expenditure measured with the SenseWear Pro2 Armband
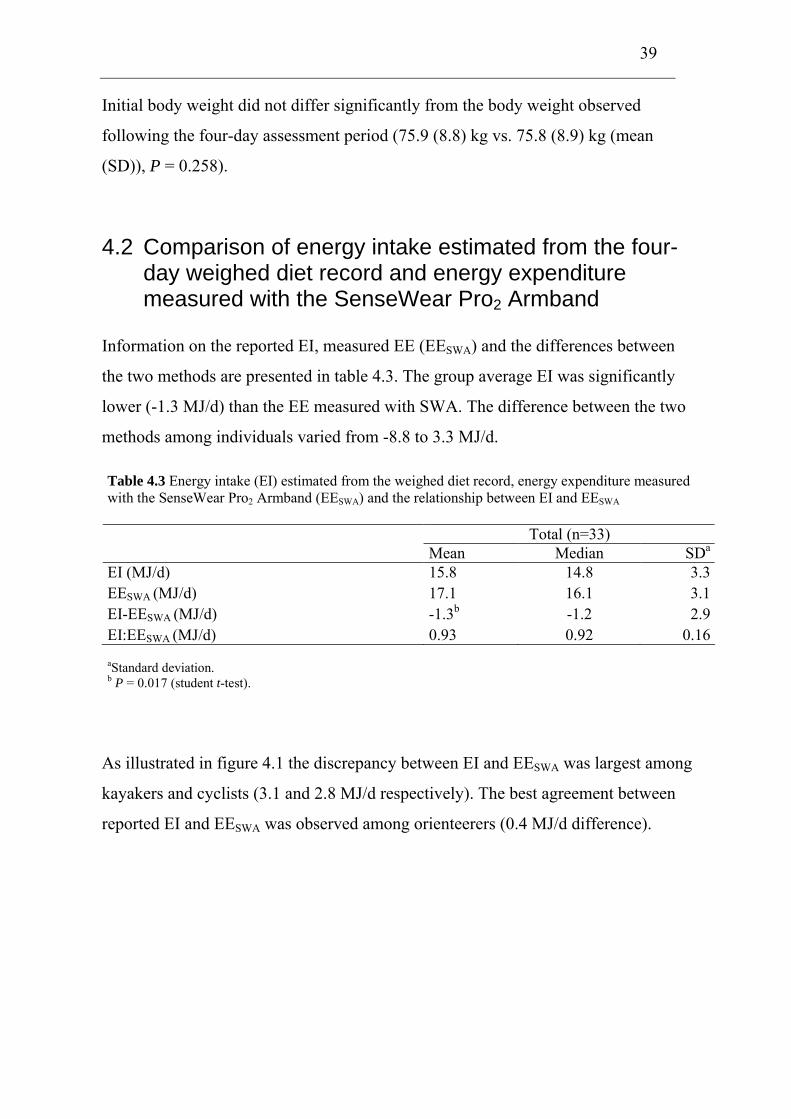
Information on the reported EI, measured EE (EESWA) and the differences between
the two methods are presented in table 4.3. The group average EI was significantly
lower (-1.3 MJ/d) than the EE measured with SWA. The difference between the two
methods among individuals varied from -8.8 to 3.3 MJ/d.
Table 4.3 Energy intake (EI) estimated from the weighed diet record, energy expenditure measured with the SenseWear Pro2 Armband (EESWA) and the relationship between EI and EESWA
Total (n=33) Mean Median SDa
EI (MJ/d) 15.8 14.8 3.3EESWA (MJ/d) 17.1 16.1 3.1EI-EESWA (MJ/d) -1.3b -1.2 2.9EI:EESWA (MJ/d) 0.93 0.92 0.16 aStandard deviation. b P = 0.017 (student t-test).
As illustrated in figure 4.1 the discrepancy between EI and EESWA was largest among
kayakers and cyclists (3.1 and 2.8 MJ/d respectively). The best agreement between
reported EI and EESWA was observed among orienteerers (0.4 MJ/d difference).

40
0,0
5,0
10,0
15,0
20,0
25,0
Rowing(n=8)
Middle- andlong-distancerunning (n=8)
Orienteering(n=7)
Kayaking(n=4)
Cycling(n=4)
Race walking(n=2)
Sport
EI
(MJ/
d)
EI (MJ/d)
EEswa (MJ/d)
Figure 4.1 Comparison of energy intake (EI) estimated from the weighed diet record and energy expenditure measured with the SenseWear Pro2 Armband (EESWA) within and between the different sports
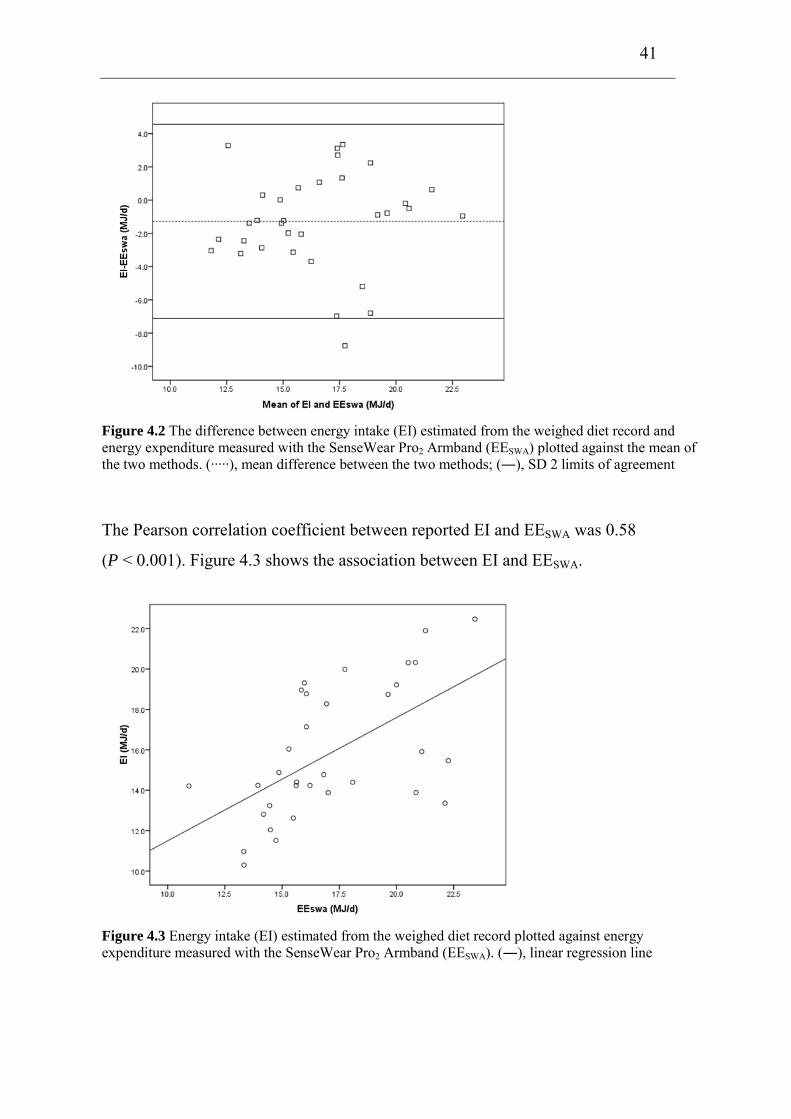
A Bland-Altman plot, showing the difference between EI estimated from the weighed
diet record and EE measured with SWA plotted against the mean of the two methods,
is presented in figure 4.2. The plot illustrates that both under-reporting and over-
reporting of EI occurred. The 95% confidence limits (CL) of agreement varied from
-7.1 to 4.6 MJ/d (± 2 SD), which indicates wide discrepancies between the two
methods for individual subjects. However, the plot does not indicate that differences
tended to increase as absolute EI increased.
41
Figure 4.2 The difference between energy intake (EI) estimated from the weighed diet record and energy expenditure measured with the SenseWear Pro2 Armband (EESWA) plotted against the mean of the two methods. (·····), mean difference between the two methods; (―), SD 2 limits of agreement
The Pearson correlation coefficient between reported EI and EESWA was 0.58
(P < 0.001). Figure 4.3 shows the association between EI and EESWA.
Figure 4.3 Energy intake (EI) estimated from the weighed diet record plotted against energy expenditure measured with the SenseWear Pro2 Armband (EESWA). (―), linear regression line

42
There was no significant relationship between BMI and the ratio of EI and EESWA
(EI:EESWA) (r = 0.097, P = 0.591).
The agreement between EI and EESWA as determined by classifying individuals into
thirds is illustrated in table 4.4. The distribution showed that 19 athletes (58%)
appeared in the same third for both EI and EESWA. Two athletes (6%) were grossly
misclassified, that means they were placed in the lowest third with one method and in
the highest third with the other method.
Table 4.4 Distribution of participants in thirds with regard to energy intake (EI) estimated from the weighed diet record and energy expenditure measured with the SenseWear Pro2 Armband (EESWA)
Thirds EESWA
1 2 3 Total
1 8a 1 2 11
2 3 5 3 11
3 0 5 6 11 Thirds EI
Total 11 11 11 33
a The number of persons classified into the same third for both EI and EESWA is outlined with bolded font.
Accuracy in reporting
Among the 33 participants, 24 athletes (73%) were classified as AR, 7 athletes (21%)
as UR and 2 athletes (6%) as OR. Table 4.5 shows a comparison of physical
characteristics, EI and EE between the three groups.
43
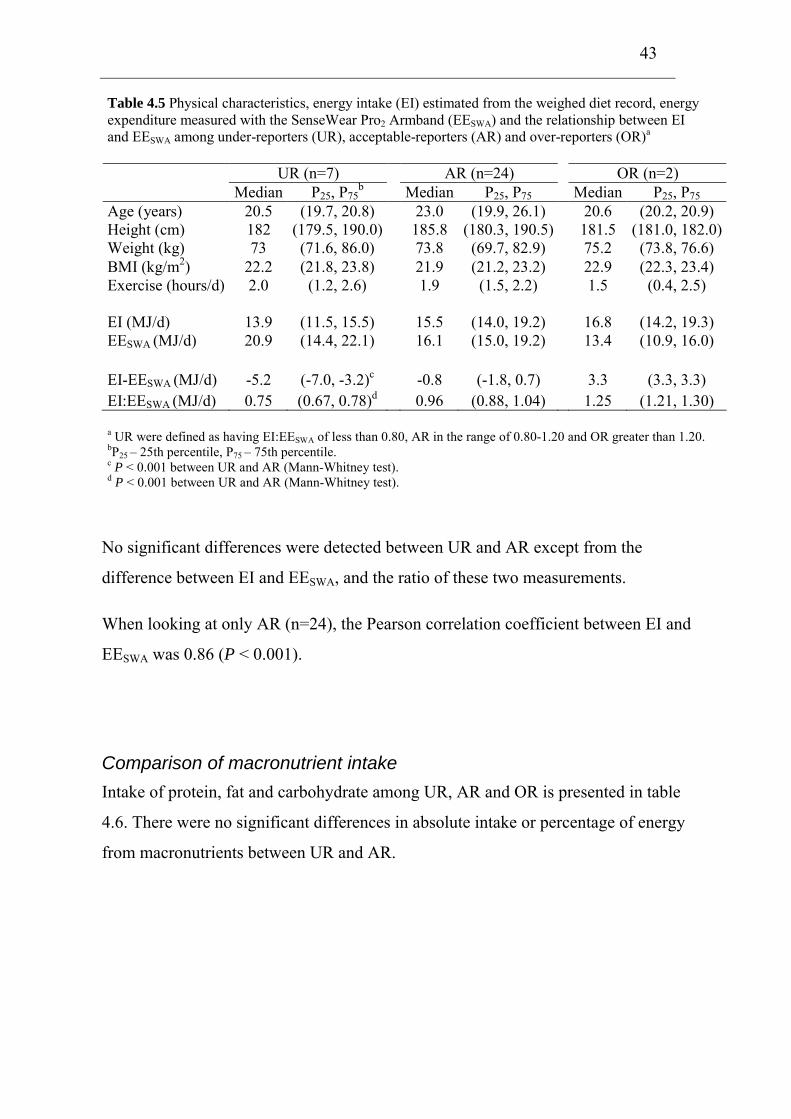
Table 4.5 Physical characteristics, energy intake (EI) estimated from the weighed diet record, energy expenditure measured with the SenseWear Pro2 Armband (EESWA) and the relationship between EI and EESWA among under-reporters (UR), acceptable-reporters (AR) and over-reporters (OR)a
UR (n=7) AR (n=24) OR (n=2) Median P25, P75
b Median P25, P75 Median P25, P75 Age (years) 20.5 (19.7, 20.8) 23.0 (19.9, 26.1) 20.6 (20.2, 20.9) Height (cm) 182 (179.5, 190.0) 185.8 (180.3, 190.5) 181.5 (181.0, 182.0)Weight (kg) 73 (71.6, 86.0) 73.8 (69.7, 82.9) 75.2 (73.8, 76.6) BMI (kg/m2) 22.2 (21.8, 23.8) 21.9 (21.2, 23.2) 22.9 (22.3, 23.4)
(1.2, 2.6) (1.5, 2.2) (0.4, 2.5) Exercise (hours/d)
2.0
1.9
1.5
EI (MJ/d) 13.9 (11.5, 15.5) 15.5 (14.0, 19.2) 16.8 (14.2, 19.3) (14.4, 22.1) (15.0, 19.2) (10.9, 16.0) EESWA (MJ/d)
20.9
16.1
13.4
EI-EESWA (MJ/d) -5.2 (-7.0, -3.2)c -0.8 (-1.8, 0.7) 3.3 (3.3, 3.3) EI:EESWA (MJ/d) 0.75 (0.67, 0.78)d 0.96 (0.88, 1.04) 1.25 (1.21, 1.30) a UR were defined as having EI:EESWA of less than 0.80, AR in the range of 0.80-1.20 and OR greater than 1.20. bP25 – 25th percentile, P75 – 75th percentile. c P < 0.001 between UR and AR (Mann-Whitney test). d P < 0.001 between UR and AR (Mann-Whitney test).
No significant differences were detected between UR and AR except from the
difference between EI and EESWA, and the ratio of these two measurements.
When looking at only AR (n=24), the Pearson correlation coefficient between EI and
EESWA was 0.86 (P < 0.001).
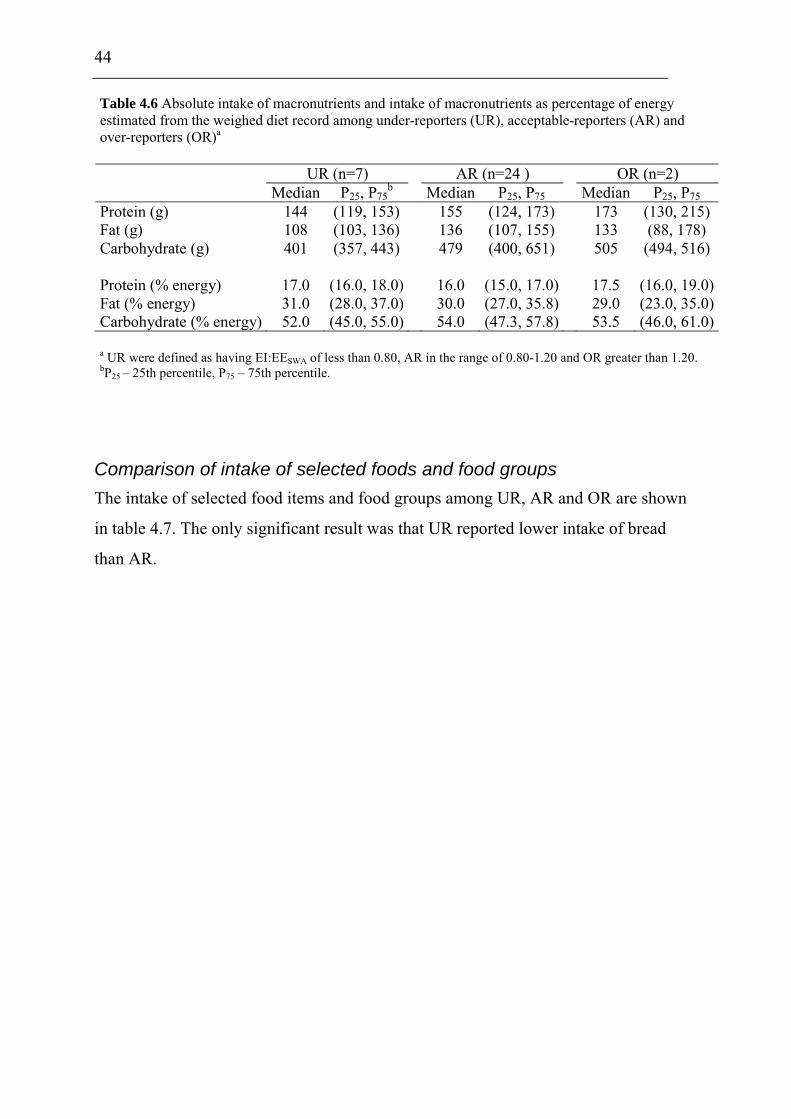
Comparison of macronutrient intake
Intake of protein, fat and carbohydrate among UR, AR and OR is presented in table
4.6. There were no significant differences in absolute intake or percentage of energy
from macronutrients between UR and AR.
44
Table 4.6 Absolute intake of macronutrients and intake of macronutrients as percentage of energy estimated from the weighed diet record among under-reporters (UR), acceptable-reporters (AR) and over-reporters (OR)a UR (n=7) AR (n=24 ) OR (n=2) Median P25, P75
b Median P25, P75 Median P25, P75
Protein (g) 144 (119, 153) 155 (124, 173) 173 (130, 215) Fat (g) 108 (103, 136) 136 (107, 155) 133 (88, 178)
401 (357, 443) 479 (400, 651) 505 (494, 516) Carbohydrate (g) Protein (% energy) 17.0 (16.0, 18.0) 16.0 (15.0, 17.0) 17.5 (16.0, 19.0)Fat (% energy) 31.0 (28.0, 37.0) 30.0 (27.0, 35.8) 29.0 (23.0, 35.0)Carbohydrate (% energy) 52.0 (45.0, 55.0) 54.0 (47.3, 57.8) 53.5 (46.0, 61.0) a UR were defined as having EI:EESWA of less than 0.80, AR in the range of 0.80-1.20 and OR greater than 1.20. bP25 – 25th percentile, P75 – 75th percentile.
Comparison of intake of selected foods and food groups
The intake of selected food items and food groups among UR, AR and OR are shown
in table 4.7. The only significant result was that UR reported lower intake of bread
than AR.

45
Table 4.7 Absolute intake of selected food items and food groups estimated from the weighed diet record among under-reporters (UR), acceptable-reporters (AR) and over-reporters (OR)a UR (n=7) AR (n=24 ) OR (n=2) Median P25, P75
b Median P25, P75 Median P25, P75 Fruit juice (g) 193 (0, 355) 319 (39, 397) 388 (140, 635)Fruit and berriesc (g) 108 (61, 169) 190 (142, 336) 145 (103, 186)Vegetablesd (g) 135 (20, 297) 157 (57, 198) 120 (47, 192) 5-a-daye (g) 544 (337, 611) 618 (472, 932) 652 (373, 930) Bread (g) 194f (177, 259) 298 (264, 349) 351 (331, 370)Crisp bread (g) 0 (0, 12) 0 (0, 11) 9 (4, 13) Breakfast cereals (g) 14 (0, 81) 63 (0, 132) 71 (0, 141) Milkg (g) 382 (294, 886) 378 (166, 507) 455 (272, 637) Chocolate and sweets (g) 13 (0, 42) 13 (0, 32) 31 (0, 61) Carbonated soft drinks with sugar (g) 0 (0, 125) 25 (0, 134) 0 (0, 0) Sports productsh (g) 8 (0,15) 0 (0,13) 0 (0, 0) a UR were defined as having EI:EESWA of less than 0.80, AR in the range of 0.80-1.20 and OR greater than 1.20. bP25 – 25th percentile, P75 – 75th percentile. c Only fresh fruit and berries. d All vegetables except potatoes. e 5-a-day calculated from fruit juice, fruit and berries and vegetables. fP = 0.007 between UR and AR (Mann-Whitney test). g Milk used as drink, in coffee or tea and on breakfast cereals. h Supplements of carbohydrate and protein.
4.3 Comparison of energy expenditure estimated from the four-day physical activity record and energy expenditure measured with the SenseWear Pro2 Armband
The values of EESWA and EE estimated from the four-day physical activity record
(EErecord) are shown in table 4.8. The group average EE estimated from the activity
record was significantly lower (-2.3 MJ/d) than the EE measured by SWA.

46
Table 4.8 Energy expenditure measured with the SenseWear Pro2 Armband (EESWA) and estimated from the activity record (EErecord) and the relationship between EE from the two methods Total (n=33) Mean Median SDa
EESWA (MJ/d) 17.1 16.1 3.1EErecord (MJ/d) 14.9 14.7 2.0EErecord-EESWA (MJ/d) -2.3b -2.3 1.7EErecord:EESWA (MJ/d) 0.88 0.86 0.09 aStandard deviation. b P < 0.001.
A Bland-Altman plot, showing the difference between EE estimated from the activity
record and EE measured with SWA plotted against the mean of the two methods, is
presented in figure 4.4. The plot illustrates that both under-reporting and over-
reporting of EE occurred. The 95% CL of agreement varied from -5.7 to 1.2 MJ/d
(± 2 SD), which indicates wide discrepancies between the two methods for individual
subjects. The plot indicates that differences tended to increase as absolute EE
increased.
Figure 4.4 The difference between energy expenditure estimated from the activity record (EErecord) and energy expenditure measured with the SenseWear Pro2 Armband (EESWA) plotted against the mean of the two methods. (·····), mean difference between the two methods; (―), SD 2 limits of agreement

47
The Pearson correlation coefficient between estimated and measured EE was 0.86
(P < 0.001). Figure 4.5 shows the association between the two methods for assessing
EE.
Figure 4.5 Energy expenditure estimated from the activity record (EErecord) plotted against energy expenditure measured with the SenseWear Pro2 Armband (EESWA). (―), linear regression line
Twenty-two athletes (67%) appeared in the same third with both the activity record
and SWA. No participants were grossly misclassified (table 4.9).
Table 4.9 Distribution of participants in thirds with regard to energy expenditure estimated from the activity record (EErecord) and measured by the SenseWear Pro2 Armband (EESWA)
Thirds EESWA
1 2 3 Total
1 7a 3 0 10
2 4 6 2 12
3 0 2 9 11
Thirds EErecord
Total 11 11 11 33
a The number of persons classified into the same third for both EErecord and EESWA is outlined with bolded font.
48
5. Discussion
The main purpose of the present study was to evaluate whether a four-day weighed
diet record provides a valid measure of true EI of elite endurance athletes.
Additionally we wanted to investigate whether a four-day physical activity record can
give a reasonable estimate of an athlete’s EE. As a reference method the activity
monitor SenseWear Pro2 Armband was used.
The results showed that the diet record and the activity record significantly under-
estimated EI and EE respectively. However both methods were good in ranking
individuals according to EI and EE.
The following section presents a discussion of the results and limitations of the study.
5.1 Sample
5.1.1 Participation rate
The participation rate in the present study was 49%. This is somewhat lower than
reported by Helle (87) in a study of Norwegian top-level endurance athletes and by
Burke et al. (88) in a study of Australian Olympic team athletes. The participation
rate in both these studies were 58%, however, both males and females were included.
In our study, only male athletes were invited to participate. Additionally, validation
studies of dietary assessment methods generally involve a greater workload for the
participants than general dietary surveys, and it may be more difficult to recruit
participants (29;89).
The high participation rate among rowers (89%) observed in our study may be due to
the close connection between one of the project co-workers and this sports
community. The low participation rate among cyclist (22%) could be caused by a lot
of travelling and staying abroad for these athletes, even in the training season.
49
Furthermore, the focus on nutrition among cyclists is high and they may already be
satisfied with their diets and did not see any benefits of participating in the study.
To facilitate the recruitment, participants were promised a written evaluation of their
diet and the results from their EE-measurements with SWA (appendix 7). Moreover,
they were offered a measurement of body composition with dual energy X-ray
absorptiometry (DXA) and a blood sample to check their blood levels of iron. These
measurements were voluntary and not a mandatory part of the study. Those who
where interested were invited to make an appointment with the investigator to go
through all the results and to get a more sport specific nutrition guidance.
Additionally, all participants were rewarded with a cook book for athletes. The use of
a reward has been shown to enhance the participation rate in dietary surveys (90).
Also, the fact that Olympiatoppen is central in Norwegian top-level sports and that
this study was conducted in the regime of Olympiatoppen, may have contributed to a
positive attitude towards participation.
The hectic life of an elite athlete with a lot of travelling may have been a general
cause for not participating in this study. The recording preferably had to be
performed in Norway and at the athlete’s place of residence, which means that the
athlete had to stay at home for four consecutive days including one Saturday or
Sunday. This was not possible for all the potential participants. Furthermore, due to
time pressure and different demands in everyday life, elite athletes are often
encouraged to reduce activities which are not related to training and competition. The
diet- and activity registration may have been considered as too demanding.
5.1.2 The representativity of the sample
In this study, only national team athletes from summer sports were included. The
reason for this is because these athletes were in their training season at the time of
data collection. In the training season there is less travelling and more stability in an
athlete’s life and it was assumed that the recording would be easier to perform in this
50
period compared to in the competition season. It is more challenging to recruit
athletes in the competition season when they are constantly on the move.
On the other side, by including winter sports the representativity of the sample of
Norwegian elite athletes in endurance sports would have been improved. Swimming
had to be excluded since the SWA can not be used in water, and thus we would not
be able to get a representative measure of these athletes’ EE.
The sample size could have been increased if we had included other athletes than
only members of national teams. However, the intention of this study was to validate
a dietary survey method used on athletes on the highest performance level, which is a
unique group in sports nutrition science.
To limit the scope of this thesis, only male athletes were invited to participate. In
view of the fact that fewer dietary surveys have been conducted on males, it was
interesting to choose this group instead of females, although ideally both sexes should
have been included. Viewed in the light of all these factors, the results from the
present study can not with certainty be generalized to the entire population of
Norwegian elite endurance athletes.
5.2 The reference method
It is important that the reference method gives a valid measure of what it is designed
to measure. In this study it was an aim that the reference method would give a valid
measure of EE at both the individual level and the group level. However, as there are
reported varying amounts of error associated with SWA measurements it can not be
considered as a “gold standard” for measuring EE. The validity of SWA is discussed
below.
51
5.2.1 The validity of SenseWear Pro2 Armband
SWA has been validated in children, obese and normal weight adults and in cancer
and cardiac patients during the past five years (58-70). Only one of the studies have
been looking at the ability of SWA to assess total daily EE in healthy adults and are
thus the most relevant for this study (64).
St-Onge and colleagues (64) found that SWA under-estimated total daily EE by on
average 117 kcal/d compared to DLW in a group of 45 normal weight subjects,
including some diabetic (n=6). Although there was a significant group mean
difference, individual values from the two methods were relatively similar as
evidenced by an intraclass correlation (ICC) of 0.81. Furthermore, in a Bland-Altman
plot, 80% of the values were within the predefined level of agreement between the
methods (±300 kcal/d). The authors concluded that despite the tendency of SWA to
under-estimate daily EE, there seems to be a reasonable concordance between SWA
and DLW for measuring TEE.
Other studies have examined the validity of the SWA in estimating EE of adults at
rest and during different modes of exercise in a laboratory setting (58-
60;62;65;67;69). In the study by Fruin and Rankin (58) (n=13) and by Malavolti et al.
(65) (n=99), no significant differences were found between mean REE measured by
SWA and IC in a group of healthy, normal weight adults. Furthermore, the agreement
as illustrated in a Bland-Altman plot and by a correlation coefficient was found to be
good in both studies. Bertoli et al. (67) on the other hand, reported poor agreement
between mean REE measured with SWA and IC (n=167). However, the participants
in this study were overweight.
In the study by Fruin and Rankin (58) the SWA generated similar mean estimates of
EE as IC on cycle ergometry (n=13). However, a poor correlation and a wide range of
agreement in Bland-Altman analyses indicated that SWA is inappropriate for
individual estimates of cycling exercises. When the participants walked on a
horizontal surface at a treadmill (n=20), SWA significantly overestimated EE (by 14-

52
38 %), whereas it under-estimated the energy cost of walking on a 5% grade (by
22%). It needs to be mentioned that in this study, specific contextual algorithms were
applied to the data by the manufacturer.
In the study by Papazoglou et al. (62), SWA underestimated REE by 8.8% (n=142)
and highly overestimated EE during cycle ergometer (n=25), stepping (n=26) and
treadmill walking exercise (n=20) in obese individuals, compared to EE measured
with IC. However, in a control group of lean and overweight subjects (n=25), the two
methods showed a high correlation (r = 0.96, P < 0.001) and a very good agreement,
as illustrated by a Bland-Altman plot.
Jakicic et al (59) found that SWA underestimated EE at treadmill walk, cycle
ergometry and stepping and overestimated EE at arm ergometry in a group of 40
normal weight subjects. Nevertheless, when they replaced the generalized equation
that the software uses for calculating EE, with an exercise-specific equation, no
significant differences between any of the exercises appeared.
In a recently study by Berntsen and his work group (69) they compared EE recorded
from four different activity monitors, including SWA, with EE measured with IC.
The participants (n=20) wore the monitors and a portable oxygen analyzer for 120
minutes while performing a variety of activities of different intensities. The findings
of this study were that SWA significantly overestimated EE in moderate intensity
physical activity (P = 0.02) and underestimated very vigorous intensity physical
activity (P < 0.001). Furthermore, TEE recorded with SWA was under-estimated by
on average 9% compared to IC during the 120 minutes of activity. Of the four
activity monitors tested, SWA was one of two monitors that showed the best
agreement with the reference method in measuring TEE. This is in accordance with
another comparison of different activity monitors conducted by King et al. (60), who
found SWA to give the best estimate of TEE during bouts of walking and running.
The results from the validation studies of SWA are somewhat ambiguous, and the use
of different versions of both the armband and the software, and the application of

53
specific algorithms in some cases, makes it difficult to compare the existing studies.
To summarize, there seems to be an acceptable agreement between SWA and the
DLW- and IC-methods in measuring mean TEE in normal weight adults. There also
seems to be a promising concordance at the individual level. However, many of the
studies presented above suffer from low sample sizes, and further research is needed
before SWA can be considered a good method for measuring EE. Furthermore, no
one has so far validated the use of SWA among elite endurance athletes, and whether
this device provides an acceptable estimate of EE in this population, remains to be
investigated.
The assumption that SWA generates valid measurements of EE at both the individual
level and the group level is a major limitation of this study. Preferably, the methods
validated in this study should have been compared with the DLW-method, which is
regarded as the gold standard for measuring free-living EE. Considering the need of
laboratory facilities as well as the costs of this method, it was not feasible for a master
thesis. Due to the increasing interest in the use of SWA, it was tempting to test its use
among athletes. SWA may represent a new, simple tool for assessing EE of athletes
in the sports nutrition practice. However to confirm or disprove this, future studies to
validate TEE measured with SWA in highly active populations are needed.
5.3 The test methods
5.3.1 The validity of the four-day weighed diet record
The development of the four-day weighed diet record presented in this study is based
on the fact that diet records over three to four days are the most widely used method
for dietary assessment of athletes (2). It is assumed that weighed records give more
precise data for EI than estimated records (20;25;91). Therefore, a four-day weighed
diet record is the preferable method to assess the EI and dietary patterns of elite
athletes at Olympiatoppen.
54
In this study we found that mean self-reported EI was significantly lower than EE as
determined by the SWA-method. This finding is consistent with investigations of
other athletic populations where self-reported EI has been compared with EE from
the DLW-method (14).
To date, there are only three studies where self-reported EI from a four-day weighed
diet record has been validated against measured EE in athletes (4;13;15). One of the
studies included men. In the study by Sjödin and co-workers (4), eight Swedish elite
cross-country skiers participated, of whom four females and four males. Females
weighed their diet for five days and males for four days. The results showed that
there was a good agreement between EI and EE measured by DLW, with a mean
difference (SD) for the entire group of only 0.1 (1.9) MJ/d. Furthermore, they found a
very high correlation between EI and EE (r = 0.96, P < 0.001). This is the only study
showing such a good agreement between self-reported EI and measured EE in elite
endurance athletes with a high energy turnover.
Hill and Davies have investigated the energy balance in female classical ballet
dancers (n=12) (13) and elite lightweight female rowers (n=7) (15). They found in
both cases an under-reporting of EI of on average 21% (667 kcal/d) and 34%
(1133 kcal/d) respectively, compared to EE measured with DLW. In our study, we
revealed an under-reporting of 7.6% (311 kcal/d or 1.3 MJ/d), which is substantially
lower than previously reported by Hill and Davies for female athletes (13;15). Burke
has suggested that under-reporting may be less extensive among male elite athletes
compared to their female counterparts (2). However, considering that SWA under-
estimates TEE compared to DLW, as indicated by the studies discussed in the
previous section, the discrepancy between EI and EE may be even larger and
consequently the under-reporting may be of a greater extent than what is revealed
with SWA in the present study.
Several authors have suggested that a correlation coefficient above 0.5 between two
methods is good or satisfactory, whereas 0.30-0.49 is fair, and below 0.30 is poor
(92;93). The correlation coefficient between the four-day weighed diet record and

55
SWA in this study was 0.58, indicating a relatively strong relationship between the
two methods. However, it is important to have in mind that this correlation is
between the weighed diet record and the reference method SWA, and not necessarily
the real EE. In the study by Sjödin and co-workers (4), where DLW was used as the
reference method, a higher correlation coefficient were reported (r = 0.96,
P = 0.0001).
In the investigation of the ability of the four-day weighed diet record and SWA to
classify individuals equally, 19 athletes (58%) were classified into the same third for
both EI and EE, and only 2 athletes (6%) were grossly misclassified. This indicates
that despite a significant difference between EI and EE at the group level, and great
variances for the individual as illustrated by the Bland-Altman plot, there is a certain
relationship between EI and EE since more than half of the participants were
classified into the same third.
5.3.2 The use of the EI:EE ratio
In this thesis we characterised mis-reporters of EI. Subjects were identified as UR,
AR and OR from their ratio EI:EESWA, according to Black (94). Both Black (94) and
Rasmussen et al. (95) have suggested methods for calculating the 95% CL of
agreement between EI and EE, where the lower CL (cut-off) represents the value
below which it is unlikely that the reported mean EI represents either habitual long
term intake or a low intake obtained by chance.
The equations used for calculating the cut-off values, rely on a coefficient of
variation (CV) for the methods used for measuring EI and EE. Since we were not
able to procure the CV for neither EI of athletes nor EE measured with SWA, we
could not use the equations proposed by Black (94) and Rasmussen et al. (95). Thus,
the definitions of UR (EI:EESWA<0.80), AR (EI:EESWA 0.80-1.20) and OR
(EI:EESWA>1.20) used in this study is based on a hypothetical 95% CL of ±20%.
Both Black (94) and Rasmussen et al. (95) used a 95% CL of ±24% in adult people,
whereas ±20% (89;96) and ±16% (97) has been reported used in studies of children.

56
We are aware of that the 95% CL chosen here might be too strict with regard to both
the CV of EI among athletes and the CV of SWA. However, the purpose was to
investigate potential differences in the intake of macronutrients and selected food
items among those who had the greatest misreporting of EI compared to acceptable
reporters.
5.3.3 Possible reasons for under-estimation of energy intake
It is generally recognised that self-reports of food intake under-estimate energy- and
nutrient intake. The discrepancy between reported EI and measured EE may be
explained in part of changes in normal dietary patterns and/or under-reporting of food
intake, which can be both conscious and subconscious (98). The individual feedback
promised to the participants in this study may have contributed to an attempt to eat
healthier than normal to impress the investigator and to get a positive feedback.
However, it has previously been suggested by Sjödin et al. (4) that the risk of altered
eating behaviours due to diet recording is minimized among elite athletes, because of
a high motivation to constantly select food in order to enhance performance. Several
of the participants in this study reported that they had a regular diet with minimal
variation between weekdays and weekends, which supports this belief.
According to Burke and colleagues (2) reporting error will be minimized when
athletes are motivated to receive a true assessment of their diet and where detailed
instructions to enhance record-keeping skills have been undertaken. The athletes were
given both practical and written instruction in the implementation of the diet record,
and the benefit of doing an accurate record for the feedback was emphasized. The
fact that athletes are familiar with keeping detailed exercise diaries may have
contributed to accurate diet records for some athletes.
It should also be kept in mind that most endurance athletes have irregular training and
eating programmes, and lots of eating occasions. The weighing of each food item and
beverage at the time of consumption may not be convenient because of lack of time
and patience (20). Athletes frequently eat while on the move, and it is easy to forget
57
to bring the weighing scale or to actually weigh the food before consumption. There
is a chance that some meals or snacks have been omitted from the record book due to
this problem, and therefore introduced some bias towards under-estimation of food
intake. In a study of adult non-athletic subjects by Livingstone et al. (98), participants
pointed out that weighing of snacks was the most onerous and irritating aspect of the
weighing procedure. Consequently, subjects admitted to have omitted some
measurements of snacks.
Another concern related to the accuracy of food records is the length of the diet-
monitoring period. The number of days needed to provide an estimate of usual intake
of energy and nutrients varies between individuals and groups, and also for different
nutrients (25). In general, group assessment requires considerably fewer days of data
collection than individual assessment, and the same holds true for the estimation of
macronutrient compared to micronutrient intake (99). Monitoring periods of seven
days are often recommended to minimize the effect of day-to-day variations in food
intake, especially when intake of individuals are being examined (20). The minimum
requirement is considered to be three days for group level measurements (20;25).
For athletes, the number of recording days is a compromise between accuracy and
compliance. When increasing the recording period, accuracy may suffer due to
reduced compliance and altered eating behaviour to simplify the recording process
(98). Besides, periods longer than three to four days of food recording have high
drop-out rates (25). A recording for three to four days is therefore the method of
choice, in order to favour good compliance and to minimize the burden for the
subjects (24). However, athletes may not necessarily be in energy balance during a
four-day period. As an example, one of the cyclists participating in our study was out
cycling for five hours one day and had a total EE of 35 MJ that day. During the four-
day monitoring period, he did not manage to compensate this energy output with food
intake. If the diet recording period had lasted longer, the discrepancy between EI and
EE might have been counterbalanced. The same could be true if the subjects had
worn the SWA for more than four days.

58
5.3.4 Characteristics of under-reporters
In the present study seven athletes (21%) were defined as UR. UR did not differ in
physical characteristics compared to AR. Although not significant, UR had a higher
median EE than the AR-group. This finding is consistent with other studies showing
a negative correlation between EE and EI; the higher the EE the lower the EI (12;17-
20).
The only significant dietary difference observed between UR and AR was that the
former group reported less consumption of bread. However, since the percentage of
energy from carbohydrates did not differ between the groups, it seems likely that UR
rely more on other dietary sources of carbohydrates than bread. Nevertheless, there
might be differences between the groups that we were not able to detect due to the
low number of subjects in each group.
5.3.5 The validity of the four-day physical activity record
Although highly advanced methods for measuring TEE such as the DLW-method are
available, it is not always the most appropriate technique due to costs and time. In the
sports nutrition practice there is need for inexpensive, time-saving and practical
methods to obtain objective measures of EE and hence energy needs of individuals.
As long as there is no single, inexpensive and simple method for the assessment of
EE and physical activity, different non-ideal methods are commonly used. The
activity diary is one such method.
Since Bouchard et al. (81) described the first and original method for activity
recording in 1983, several studies have been conducted to evaluate both the original
and modified versions of the activity record (50;74;82;83). There seems to be a
general consensus that activity records provide an acceptable estimate of EE in
populations with relatively sedentary lifestyles. However, among active populations
and at the individual level there is limited accuracy (50;74;81;82).
59
Boulay and colleagues (50) compared estimations of daily EE from a physical
activity journal and a HR-monitoring method in endurance athletes and controls.
Daily EE-estimates from the two methods were similar in controls whereas the HR-
monitoring method yielded significantly higher EE results than the activity record in
athletes (17.0 (4.0) MJ/d vs. 13.1 (2.1) MJ/d (mean (SD)), P < 0.05). This is in
concordance with our results, where the SWA EE-measurement yielded significantly
higher EE than the four-day activity record (17.1 (3.1) MJ/d vs. 14.9 (2.0) MJ/d
(mean (SD)), P < 0.001). These findings together indicate that the physical activity
level of subjects may influence the accuracy of a physical activity record.
At the individual level, Bland-Altman plots from several studies have shown wide
limits of agreement between EE estimated from activity records and EE measured by
DLW (74;82;83). This was also true for the present study, with limits of agreement
ranging from -5.7 to 1.2 MJ/d. However, the correlation coefficient of 0.86 and the
good classification of individuals into same thirds observed in this study, indicate that
the activity record may be a valuable tool for ranking individuals according to EE.
5.3.6 Possible reasons for under-estimation of energy expenditure
Boulay et al. (50) proposed two possible reasons for their observed under-estimation
of EE with the activity record method in trained individuals. One explanation was
that highly trained athletes might under-estimate the intensity of their daily activities.
Another explanation was that athletes might be less conscientious in recording their
activities.
The first explanation is less likely in this study due to several reasons. First of all, the
majority of elite athletes nowadays use HR-monitoring to discriminate between
different intensities of exercise based on their maximal HR. It is common to carefully
register training in an exercise diary with detailed description of time spent in
different intensity levels. Thus, elite athletes have reasonably good knowledge about
their own physical exertion during training. The probability that they under-estimate
the intensity of their activities is therefore reduced, at least in activities where HR is

60
monitored. What is more likely, however, is that they under-estimate the time
devoted to different activities. This is typically done if the record is not kept
consecutively. The importance of regularly updating the activity record, instead of
doing it at the end of the day, was emphasized. Nevertheless, some athletes turned out
to have forgotten to register their activity for one or more days, and had to complete
the record to the best of their ability at the last meeting with the investigator. Due to
the difficulty of remembering the activities performed every 30-minute the previous
days, this may have contributed to some bias.
Furthermore, the methodology used by Boulay et al. (50) and in the present study
differs and can not be directly compared. In the former study they used the method
proposed by Bouchard et al. (81), with each day divided into 96 periods of 15
minutes each and where the subject enters a digit from 1-9 representing the most
dominant activity in each period. The digits from 1-9 represents 9 different activity
categories with each having a predetermined average energy cost. This is the most
used approach for activity records in literature. However, such a detailed recording
comes at the cost of time commitments for both subject and investigator (27). In our
experience, elite athletes do not manage to complete an activity record even for a few
days if 15-minute or shorter periods are used. Therefore, 30-minute intervals were
chosen in this study in an attempt to reduce the participant burden and improve the
compliance. Furthermore, instead of entering a digit for the most dominant activity
each 30-minute interval, the participants were asked to make a written description of
activities and the associated degree of physical exertion. Afterwards, the investigator
had to add an appropriate energy cost to each of the 48 periods a day was divided into
(table 3.1). In contrast to the study by Boulay et al. (50), the bias towards under- or
over-estimation of energy costs of activities therefore rely on the investigator more
than the athletes themselves in the method used in the present study.
The suggestion that athletes may be less conscientious in recording their activities is a
potential explanation for the under-estimation of EE observed in our study. Despite
the thorough instruction given to all participants, some recorded their activities very

61
precisely while others did not. Registration of diet, exercise and activity at the same
time may have been too much work for the athletes in addition to their exercise
diaries. The activity record may have been given a lower priority because of the
simultaneously measurement of EE with SWA and knowing that the activity record
was of little importance for the individual feedback.
Another source of error associated with the activity record is the coarse grouping of
activities into categories and the choice of an average energy cost of each category.
We based our classification of six activity categories and appurtenant energy costs on
a table presented by Manore and Thompson (84), that is aimed for athletes (table 3.1).
Compared to the compendium of physical activities developed by Ainsworth and
colleagues (79), this classification seems reasonable.
However, there are other concerns regarding the activity record. Firstly, there is a
wide range of activities and physical efforts not listed in the available reference lists,
for instance spontaneous physical activity and fidgeting (77). Secondly, measured
energy cost of different activities may be different than in real life due to the
measuring procedure and the wearing of unfamiliar equipment while performing an
activity (77). Perhaps most important, since the values of energy costs are averages,
they do not take into account that some people perform activities more vigorously
than others. Individual differences in EE can be large and the true energy cost for a
person may or may not be close to the stated mean (79).
The use of the Harris-Benedict equation to calculate EE may have contributed to
some under-estimation of actual BMR-values. Thompson and Manore (100)
compared RMR values measured in the laboratory with RMR values predicted from
six different equations in active males and females. They found that the Cunningham
equation was the best predictor of RMR in this population. The Cunningham
equation requires the measurement of lean body mass. Due to lack of this parameter
we could not use this equation in our calculations. Instead we used the Harris-
Benedict equation which was proved to be the next best predictor, with slightly lower
values of RMR compared to laboratory measurements.

62
6. Conclusion
The results from the present study showed that average self-reported EI was
significantly lower than EE measured with SWA. The mean difference was 1.3 MJ/d.
At the individual level, a Bland-Altman plot illustrated a wide discrepancy between
self-reported EI and measured EE. However, the correlation coefficient of 0.58 and
the good classification of individuals into thirds indicated a high ability of the four-
day weighed diet record in ranking individuals according to EI.
When comparing average estimated EE from the four-day physical activity record
with SWA-measurements of EE, a significant mean difference of - 2.3 MJ/d were
detected. A Bland-Altman plot illustrated great variation between the two methods
for each individual. However, the activity record showed a high ability in ranking
individuals according to EE, as evidenced by a correlation coefficient of 0.86 and the
very good classification of individuals into thirds.
Seven athletes (21%) were classified as UR. The only significant difference in their
reported diet compared to AR was a lower consumption of bread.
The findings from the present study indicate that the self-reported weighed diet
record may represent an acceptable method for the quantification of EI of groups of
athletes. At the individual level, there may be unacceptable levels of error associated
with its use. Until a better method for quantifying EI of athletes is proved, the
weighed diet record will continue to represent a useful method in the sports nutrition
practice. However, the interpretation of its results of EI should be made with caution.
The activity record is an unsuitable tool for assessing EE of both individuals and
groups of elite athletes. It may be a valuable tool for ranking individuals according to
their EE and to investigate activity patterns, as activity records have the advantage of
providing additional information on the types of activity and time devoted by
individuals to specific activities.
63
In order to be able to give athletes correct nutritional recommendations, there is
obviously need for an objective and practical tool to evaluate EI and energy needs.
Future studies should aim at validating new, promising instruments, like the SWA,
for objective assessment of EE in athletes. The SWA is simple in use and may
represent a practical and accurate way of both assessing EE and hence energy needs
of an athlete, and to evaluate self-reported EI.
64
Reference List
1. Rodriguez NR, Di Marco NM, Langley S. American College of Sports Medicine position stand. Nutrition and athletic performance. Med Sci Sports Exerc 2009;41:709-31.
2. Burke LM. Energy needs of athletes. Can J Appl Physiol 2001;26 Suppl:S202-S219.
3. Norwegian Directorate of Health. Mat og prestasjon - Kostholdsanbefalinger for idrettsutøvere. 2003. Oslo, Norwegian Directorate of Health. Ref Type: Report
4. Sjodin AM, Andersson AB, Hogberg JM, Westerterp KR. Energy balance in cross-country skiers: a study using doubly labeled water. Med Sci Sports Exerc 1994;26:720-4.
5. Economos CD, Bortz SS, Nelson ME. Nutritional practices of elite athletes. Practical recommendations. Sports Med 1993;16:381-99.
6. Manore MM, Thompson JL. Energy requirements of the athlete: assessment and evidence of energy efficiency. In: Burke L, Deakin V, eds. Clinical Sports Nutrition. Sydney, Australia: McGraw-Hill 2006:113-34.
7. Burke LM, Loucks AB, Broad N. Energy and carbohydrate for training and recovery. J Sports Sci 2006;24:675-85.
8. Loucks AB. Energy balance and body composition in sports and exercise. J Sports Sci 2004;22:1-14.
9. Westerterp KR, Saris WH, van EM, ten HF. Use of the doubly labeled water technique in humans during heavy sustained exercise. J Appl Physiol 1986;61:2162-7.
10. Schoeller DA, Bandini LG, Dietz WH. Inaccuracies in self-reported intake identified by comparison with the doubly labelled water method. Can J Physiol Pharmacol 1990;68:941-9.
11. Schulz LO, Alger S, Harper I, Wilmore JH, Ravussin E. Energy expenditure of elite female runners measured by respiratory chamber and doubly labeled water. J Appl Physiol 1992;72:23-8.
12. Edwards JE, Lindeman AK, Mikesky AE, Stager JM. Energy balance in highly trained female endurance runners. Med Sci Sports Exerc 1993;25:1398-404.
13. Hill RJ, Davies PS. The validity of a four day weighed food record for measuring energy intake in female classical ballet dancers. Eur J Clin Nutr 1999;53:752-3.
14. Hill RJ, Davies PS. The validity of self-reported energy intake as determined using the doubly labelled water technique. Br J Nutr 2001;85:415-30.
65
15. Hill RJ, Davies PS. Energy intake and energy expenditure in elite lightweight female rowers. Med Sci Sports Exerc 2002;34:1823-9.
16. Fudge BW, Westerterp KR, Kiplamai FK et al. Evidence of negative energy balance using doubly labelled water in elite Kenyan endurance runners prior to competition. Br J Nutr 2006;95:59-66.
17. Withers RT, Smith DA, Tucker RC, Brinkman M, Clark DG. Energy metabolism in sedentary and active 49- to 70-yr-old women. J Appl Physiol 1998;84:1333-40.
18. Ambler C, Eliakim A, Brasel JA, Lee WN, Burke G, Cooper DM. Fitness and the effect of exercise training on the dietary intake of healthy adolescents. Int J Obes Relat Metab Disord 1998;22:354-62.
19. Barnard JA, Tapsell LC, Davies PS, Brenninger VL, Storlien LH. Relationship of high energy expenditure and variation in dietary intake with reporting accuracy on 7 day food records and diet histories in a group of healthy adult volunteers. Eur J Clin Nutr 2002;56:358-67.
20. Magkos F, Yannakoulia M. Methodology of dietary assessment in athletes: concepts and pitfalls. Curr Opin Clin Nutr Metab Care 2003;6:539-49.
21. Marr JW. Individual dietary surveys: purposes and methods. World Rev Nutr Diet 1971;13:105-64.
22. Block G. Human dietary assessment: methods and issues. Prev Med 1989;18:653-60.
23. Bingham SA, Gill C, Welch A et al. Comparison of dietary assessment methods in nutritional epidemiology: weighed records v. 24 h recalls, food-frequency questionnaires and estimated-diet records. Br J Nutr 1994;72:619-43.
24. Burke LM, Cox GR, Culmmings NK, Desbrow B. Guidelines for daily carbohydrate intake: do athletes achieve them? Sports Med 2001;31:267-99.
25. Deakin V. Measuring nutritional status of athletes: clinical and research perspectives. In: Burke L, Deakin V, eds. Clinical Sports Nutrition. Sydney: McGraw-Hill Australia Pty Ltd 2006:21-51.
26. Black AE. Dietary assessment for sports dietetics. Nutrition Bulletin 2001;26:29-42.
27. Schoeller DA, Racette SB. A review of field techniques for the assessment of energy expenditure. J Nutr 1990;120 Suppl 11:1492-5.
28. Vanhees L, Lefevre J, Philippaerts R et al. How to assess physical activity? How to assess physical fitness? Eur J Cardiovasc Prev Rehabil 2005;12:102-14.
29. Andersen LF. Kriterier ved validering av en metode for kostholdsundersøkelser - Når er validiteten til en metode tilfredsstillende? Nor J Epidemiol 2000;10:17-24.
30. Nelson M. The validation of dietary assessment. In: Nelson M, Margetts BM, eds. Design Concepts in Nutritional Epidemiology. Oxford: Oxford University Press 1997:241-72.

66
31. Livingstone MB, Black AE. Markers of the validity of reported energy intake. J Nutr 2003;133 Suppl 3:895S-920S.
32. Kipnis V, Subar AF, Midthune D et al. Structure of dietary measurement error: results of the OPEN biomarker study. Am J Epidemiol 2003;158:14-21.
33. Goldberg GR, Black AE. Assessment of the validity of reported energy intakes - review and recent developments. Scand J Nutr/Näringsforskning 1998;42:6-9.
34. Black AE. Critical evaluation of energy intake using the Goldberg cut-off for energy intake:basal metabolic rate. A practical guide to its calculation, use and limitations. Int J Obes Relat Metab Disord 2000;24:1119-30.
35. Johansson L, Solvoll K, Bjorneboe GE, Drevon CA. Under- and overreporting of energy intake related to weight status and lifestyle in a nationwide sample. Am J Clin Nutr 1998;68:266-74.
36. Klesges RC, Eck LH, Ray JW. Who underreports dietary intake in a dietary recall? Evidence from the Second National Health and Nutrition Examination Survey. J Consult Clin Psychol 1995;63:438-44.
37. Hirvonen T, Mannisto S, Roos E, Pietinen P. Increasing prevalence of underreporting does not necessarily distort dietary surveys. Eur J Clin Nutr 1997;51:297-301.
38. Briefel RR, Sempos CT, McDowell MA, Chien S, Alaimo K. Dietary methods research in the third National Health and Nutrition Examination Survey: underreporting of energy intake. Am J Clin Nutr 1997;65:1203S-9S.
39. Farajian P, Kavouras SA, Yannakoulia M, Sidossis LS. Dietary intake and nutritional practices of elite Greek aquatic athletes. Int J Sport Nutr Exerc Metab 2004;14:574-85.
40. Johnson RK, Soultanakis RP, Matthews DE. Literacy and body fatness are associated with underreporting of energy intake in US low-income women using the multiple-pass 24-hour recall: a doubly labeled water study. J Am Diet Assoc 1998;98:1136-40.
41. Schoeller DA, Schoeller DA. Validation of habitual energy intake. Public Health Nutr 2002;5:883-8.
42. Welle S. Two-point vs multipoint sample collection for the analysis of energy expenditure by use of the doubly labeled water method. Am J Clin Nutr 1990;52:1134-8.
43. Schoeller DA, van SE. Measurement of energy expenditure in humans by doubly labeled water method. J Appl Physiol 1982;53:955-9.
44. International Dietary Energy Consultancy Group. The Doubly-labelled Water Method for Measuring Energy Expenditure: A consensus Report by the IDECG working group. Prentice, A. M. 1990. Vienna, International Atomic Energy Agency. Ref Type: Report

67
45. Webb P. The measurement of energy expenditure. J Nutr 1991;121:1897-901.
46. Spurr GB, Prentice AM, Murgatroyd PR, Goldberg GR, Reina JC, Christman NT. Energy expenditure from minute-by-minute heart-rate recording: comparison with indirect calorimetry. Am J Clin Nutr 1988;48:552-9.
47. Davidson L, McNeill G, Haggarty P, Smith JS, Franklin MF. Free-living energy expenditure of adult men assessed by continuous heart-rate monitoring and doubly-labelled water. Br J Nutr 1997;78:695-708.
48. Li R, Deurenberg P, Hautvast JG. A critical evaluation of heart rate monitoring to assess energy expenditure in individuals. Am J Clin Nutr 1993;58:602-7.
49. Livingstone MB, Prentice AM, Coward WA et al. Simultaneous measurement of free-living energy expenditure by the doubly labeled water method and heart-rate monitoring. Am J Clin Nutr 1990;52:59-65.
50. Boulay MR, Serresse O, Almeras N, Tremblay A. Energy expenditure measurement in male cross-country skiers: comparison of two field methods. Med Sci Sports Exerc 1994;26:248-53.
51. Ekelund U, Yngve A, Westerterp K, Sjostrom M. Energy expenditure assessed by heart rate and doubly labeled water in young athletes. Med Sci Sports Exerc 2002;34:1360-6.
52. Achten J, Jeukendrup AE. Heart rate monitoring: applications and limitations. Sports Med 2003;33:517-38.
53. Sirard JR, Pate RR. Physical activity assessment in children and adolescents. Sports Med 2001;31:439-54.
54. Chen KY, Bassett DR, Jr. The technology of accelerometry-based activity monitors: current and future. Med Sci Sports Exerc 2005;37:S490-S500.
55. Bouten CV, Westerterp KR, Verduin M, Janssen JD. Assessment of energy expenditure for physical activity using a triaxial accelerometer. Med Sci Sports Exerc 1994;26:1516-23.
56. Trost SG. Objective measurement of physical activity in youth: current issues, future directions. Exerc Sport Sci Rev 2001;29:32-6.
57. Plasqui G, Westerterp KR. Physical activity assessment with accelerometers: an evaluation against doubly labeled water. Obesity (Silver Spring) 2007;15:2371-9.
58. Fruin ML, Rankin JW. Validity of a multi-sensor armband in estimating rest and exercise energy expenditure. Med Sci Sports Exerc 2004;36:1063-9.
59. Jakicic JM, Marcus M, Gallagher KI et al. Evaluation of the SenseWear Pro Armband to assess energy expenditure during exercise. Med Sci Sports Exerc 2004;36:897-904.
68
60. King GA, Torres N, Potter C, Brooks TJ, Coleman KJ. Comparison of activity monitors to estimate energy cost of treadmill exercise. Med Sci Sports Exerc 2004;36:1244-51.
61. Cole PJ, LeMura LM, Klinger TA, Strohecker K, McConnell TR. Measuring energy expenditure in cardiac patients using the Body Media Armband versus indirect calorimetry. A validation study. J Sports Med Phys Fitness 2004;44:262-71.
62. Papazoglou D, Augello G, Tagliaferri M et al. Evaluation of a multisensor armband in estimating energy expenditure in obese individuals. Obesity (Silver Spring) 2006;14:2217-23.
63. Arvidsson D, Slinde F, Larsson S, Hulthen L. Energy cost of physical activities in children: validation of SenseWear Armband. Med Sci Sports Exerc 2007;39:2076-84.
64. St-Onge M, Mignault D, Allison DB, Rabasa-Lhoret R. Evaluation of a portable device to measure daily energy expenditure in free-living adults. Am J Clin Nutr 2007;85:742-9.
65. Malavolti M, Pietrobelli A, Dugoni M et al. A new device for measuring resting energy expenditure (REE) in healthy subjects. Nutr Metab Cardiovasc Dis 2007;17:338-43.
66. Cereda E, Turrini M, Ciapanna D, Marbello L, Pietrobelli A, Corradi E. Assessing energy expenditure in cancer patients: a pilot validation of a new wearable device. JPEN J Parenter Enteral Nutr 2007;31:502-7.
67. Bertoli S, Posata A, Battezzati A, Spadafranca A, Testolin G, Bedogni G. Poor agreement between a portable armband and indirect calorimetry in the assessment of resting energy expenditure. Clin Nutr 2008;27:307-10.
68. Dorminy CA, Choi L, Akohoue SA, Chen KY, Buchowski MS. Validity of a multisensor armband in estimating 24-h energy expenditure in children. Med Sci Sports Exerc 2008;40:699-706.
69. Berntsen S, Hageberg R, Aandstad A et al. Validity of physical activity monitors in adults participating in free living activities. Br J Sports Med 2008.
70. Arvidsson D, Slinde F, Larsson S, Hulthen L. Energy Cost in Children Assessed by Multisensor Activity Monitors. Med Sci Sports Exerc 2009.
71. Westerterp KR. Assessment of physical activity: a critical appraisal. Eur J Appl Physiol 2009.
72. Shephard RJ. Limits to the measurement of habitual physical activity by questionnaires. Br J Sports Med 2003;37:197-206.
73. Klesges RC, Eck LH, Mellon MW, Fulliton W, Somes GW, Hanson CL. The accuracy of self-reports of physical activity. Med Sci Sports Exerc 1990;22:690-7.

69
74. Conway JM, Seale JL, Jacobs DR, Jr., Irwin ML, Ainsworth BE. Comparison of energy expenditure estimates from doubly labeled water, a physical activity questionnaire, and physical activity records. Am J Clin Nutr 2002;75:519-25.
75. Mahabir S, Baer DJ, Giffen C et al. Comparison of energy expenditure estimates from 4 physical activity questionnaires with doubly labeled water estimates in postmenopausal women. Am J Clin Nutr 2006;84:230-6.
76. Arvidsson D, Slinde F, Hulthen L. Physical activity questionnaire for adolescents validated against doubly labelled water. Eur J Clin Nutr 2005;59:376-83.
77. Food and Nutrition Board. Dietary Reference Intakes for Energy, Carbohydrate, Fiber, Fat, Fatty Acids, Cholesterol, Protein, and Amino Acids. Washington, D.C.: The National Academies Press, 2005.
78. FAO/WHO/UNU Expert Consultation. Energy and protein requirements. Technical Report Series 724. 1985. Geneva, Switzerland, World Health Organization. Ref Type: Report
79. Ainsworth BE, Haskell WL, Whitt MC et al. Compendium of physical activities: an update of activity codes and MET intensities. Med Sci Sports Exerc 2000;32:S498-S504.
80. Ainsworth BE, Haskell WL, Leon AS et al. Compendium of physical activities: classification of energy costs of human physical activities. Med Sci Sports Exerc 1993;25:71-80.
81. Bouchard C, Tremblay A, Leblanc C, Lortie G, Savard R, Theriault G. A method to assess energy expenditure in children and adults. Am J Clin Nutr 1983;37:461-7.
82. Bratteby LE, Sandhagen B, Fan H, Samuelson G. A 7-day activity diary for assessment of daily energy expenditure validated by the doubly labelled water method in adolescents. Eur J Clin Nutr 1997;51:585-91.
83. Rush EC, Valencia ME, Plank LD. Validation of a 7-day physical activity diary against doubly-labelled water. Ann Hum Biol 2008;35:416-21.
84. Manore M, Thompson J. Energy requirements of the athlete: assessment and evidence of energy efficiency. In: Burke L, Deakin V, eds. Clinical Sports Nutrition. Roseville: McGraw-Hill Book Company Australia Pty Limited 2000:124-45.
85. Altman DG. Practical statistics for medical research. London: Chapman & Hall, 1999.
86. Bland JM, Altman DG. Statistical methods for assessing agreement between two methods of clinical measurement. Lancet 1986;1:307-10.
87. Helle, C. En kostholdsundersøkelse av norske toppidrettsutøvere i utholdenhetsidretter. 2007. Department of Nutrition, School of Medicine, University of Oslo. Ref Type: Thesis/Dissertation

70
88. Burke LM, Slater G, Broad EM, Haukka J, Modulon S, Hopkins WG. Eating patterns and meal frequency of elite Australian athletes. Int J Sport Nutr Exerc Metab 2003;13:521-38.
89. Lillegaard IT, Andersen LF. Validation of a pre-coded food diary with energy expenditure, comparison of under-reporters v. acceptable reporters. Br J Nutr 2005;94:998-1003.
90. Johansson L, Solvoll K, Opdahl S, Bjorneboe GE, Drevon CA. Response rates with different distribution methods and reward, and reproducibility of a quantitative food frequency questionnaire. Eur J Clin Nutr 1997;51:346-53.
91. Bingham SA. Limitations of the various methods for collecting dietary intake data. Ann Nutr Metab 1991;35:117-27.
92. Cohen J. Statistical Power Analysis for the Behavioral Sciences. Hillsdale, NJ: Lawrence Erlbaum Associates, 1988.
93. Hankin JH, Wilkens LR, Kolonel LN, Yoshizawa CN. Validation of a quantitative diet history method in Hawaii. Am J Epidemiol 1991;133:616-28.
94. Black AE. The sensitivity and specificity of the Goldberg cut-off for EI:BMR for identifying diet reports of poor validity. Eur J Clin Nutr 2000;54:395-404.
95. Rasmussen LB, Matthiessen J, Biltoft-Jensen A, Tetens I. Characteristics of misreporters of dietary intake and physical activity. Public Health Nutr 2007;10:230-7.
96. Andersen LF, Pollestad ML, Jacobs DR, Jr., Lovo A, Hustvedt BE. Validation of a pre-coded food diary used among 13-year-olds: comparison of energy intake with energy expenditure. Public Health Nutr 2005;8:1315-21.
97. Andersen LF, Tomten H, Haggarty P, Lovo A, Hustvedt BE. Validation of energy intake estimated from a food frequency questionnaire: a doubly labelled water study. Eur J Clin Nutr 2003;57:279-84.
98. Livingstone MB, Prentice AM, Strain JJ et al. Accuracy of weighed dietary records in studies of diet and health. BMJ 1990;300:708-12.
99. Basiotis PP, Welsh SO, Cronin FJ, Kelsay JL, Mertz W. Number of days of food intake records required to estimate individual and group nutrient intakes with defined confidence. J Nutr 1987;117:1638-41.
100. Thompson J, Manore MM. Predicted and measured resting metabolic rate of male and female endurance athletes. J Am Diet Assoc 1996;96:30-4.
71
Appendixes
Appendix 1: Approvals from the National Committees for Research Ethics in
Norway (p. 72)
Appendix 2: Approval from Norwegian Social Science Data Services (p. 75)
Appendix 3: Written invitation to participate in the study (p. 77)
Appendix 4: The record notebook (p. 81)
Appendix 5: Written information about the SenseWear Pro2 Armband given to the
participants (p. 98)
Appendix 6: Control questions to the diet- and activity record (p. 101)
Appendix 7: An example of the feedback the participants receive (p. 105)

72
Appendix 1: Approvals from the National Committees for Research Ethics in Norway

73
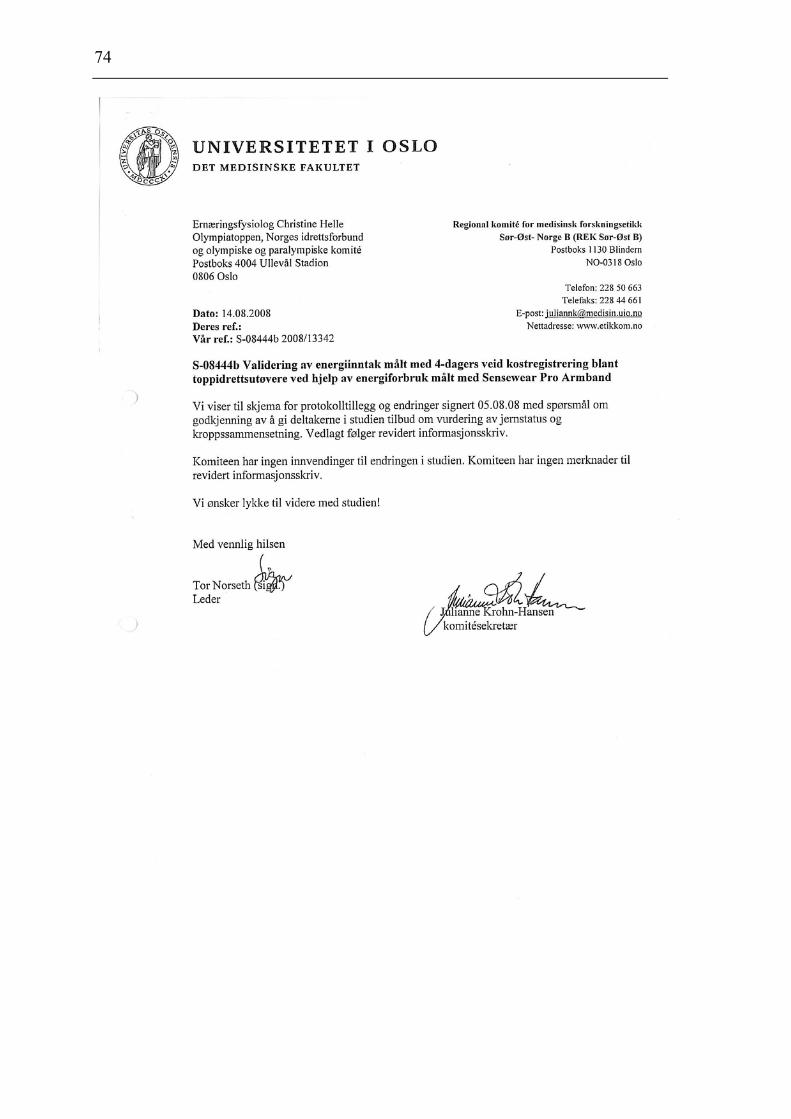
74

75
Appendix 2: Approval from Norwegian Social Science Data Services
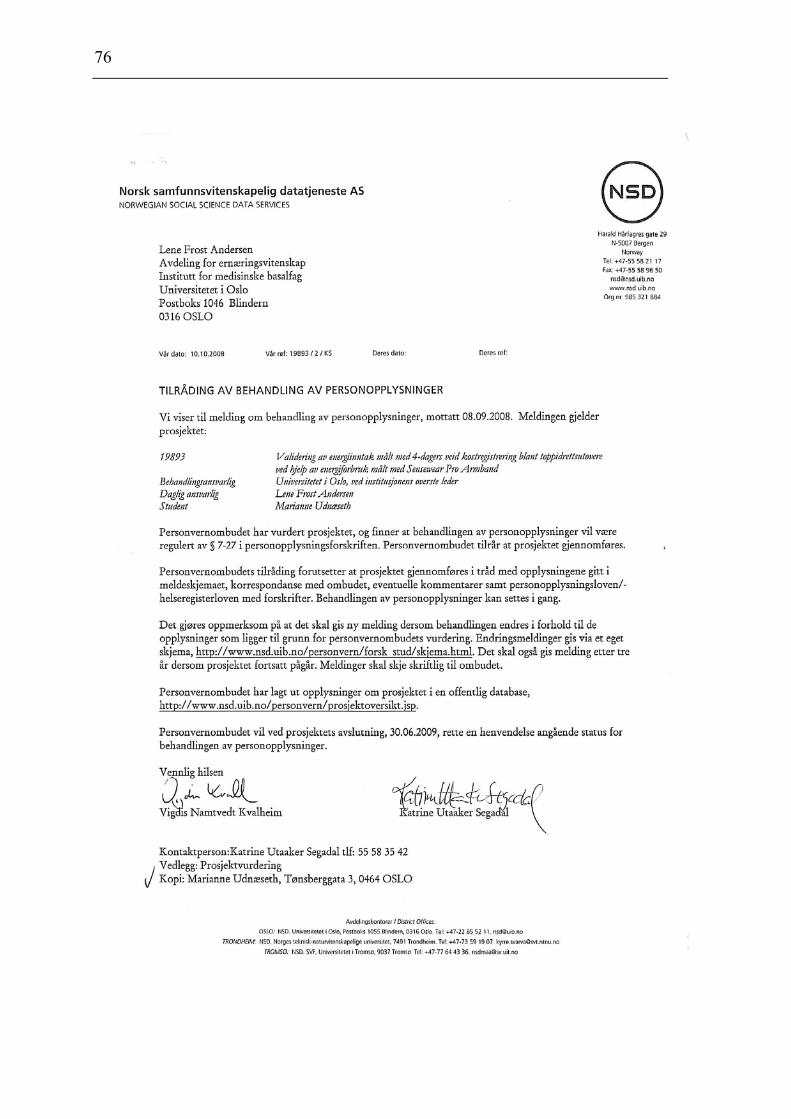
76

77
Appendix 3: Written invitation to participate in the study

78
Forespørsel om deltakelse i forskningsprosjektet
”Validering av energiinntak målt med 4-dagers veid kostregistrering blant toppidrettsutøvere ved hjelp av energiforbruk målt med SensWear Pro Armband”
Bakgrunn og hensikt Dette er et spørsmål til deg om å delta i en studie i feltet idrettsernæring. Formålet med denne studien er å undersøke validiteten (kvaliteten) til 4-dagers veid kostregistrering, som er den mest brukte metoden for innhenting av individuelle kostholdsdata på toppidrettsutøvere. Valideringsstudien gjennomføres for å gi kunnskap om hvor god 4-dagers veid kostregistrering er til å måle det sanne inntak hos toppidrettsutøvere, samt å gi kunnskap om hvilken type feil som er knyttet til metoden. Dette er viktig for å kunne tolke resultater fra kostregistreringer, og for å kunne tolke sammenhengen mellom kosthold og idrettsprestasjon. For å gjennomføre studien trenger vi 30-40 frivillige mannlige toppidrettsutøvere som driver med følgende utholdenhetsidretter: orientering, sykling, langdistanseløp, kappgang, roing og padling. De må være over 18 år, på et høyt prestasjonsnivå innen sin idrett, og være friske og skadefrie i registreringsperioden. Derfor henvender vi oss til deg. Studien er en masteroppgave i klinisk ernæring ved Universitetet i Oslo, og utføres i samarbeid med Olympiatoppens ernæringsavdeling. Den skal ledes av masterstudent Marianne Udnæseth, med veiledning fra ernæringsfysiolog Cand.scient. Christine Helle fra Olympiatoppens ernæringsavdeling. Hva må du gjøre når du deltar i studien? Du må gjennomføre en 4-dagers veid kostregistrering, og en 4-dagers aktivitetsregistrering. Du vil få utdelt registreringsskjema og vekt, og vi gir deg god instruksjon i hvordan skjemaene skal fylles ut. I tillegg vil du få utdelt et ”SenseWear Pro Armband” som skal bæres rundt armen i 4 dager for å registrere fysisk aktivitet. Ditt bidrag til studien vil altså være at du må sette av 4 sammenhengende dager i perioden september 2008-januar 2009, til registrering av kosthold og fysisk aktivitet. Hva får du igjen for å delta? Fordelen med å delta i denne studien er at du kan få en vurdering av kostholdet ditt og se om du imøtekommer kostholdsanbefalingene for din idrett. I tillegg får du målt energiforbruket ditt. Vi vil også tilby alle som deltar i studien en vurdering av jernstatus og kroppssammensetning. Hvis du ønsker, får du time hos ernæringsfysiolog hvor alle resultater blir gjennomgått sammen med deg. Eventuelt kan du få skriftlig tilbakemelding i posten. Som takk for deltakelsen vil du motta kokeboken ”Overskudd – kokebok for deg som trener”, skrevet av Christine Helle. Ulempen med å delta, er at det kan være tidkrevende å veie all mat du spiser og registrere hva slags aktiviteter du utfører i løpet av dagen, men de fleste synes det går greit etter en dags ”innkjøring”.

79
Hva skjer med informasjonen om deg? Informasjonen som registreres om deg, skal kun brukes slik som beskrevet i hensikten med studien. Alle opplysningene vil bli behandlet uten navn og fødselsnummer eller andre direkte gjenkjennende opplysninger. Det er bare en kode som knytter deg til dine resultater. Det er kun autorisert personell knyttet til prosjektet som har adgang til navnelisten, og som kan finne tilbake til deg. Andre personer kan dermed ikke se dine resultater, og det vil ikke være mulig å identifisere deg i resultatene av studien når disse publiseres. Prosjektet er godkjent av Regionale komiteer for medisinsk og helsefaglig forskningsetikk og meldt til Norsk samfunnsvitenskapelig datatjeneste. Frivillig deltakelse Det er frivillig å delta i studien. Du kan når som helst og uten å oppgi noen grunn trekke ditt samtykke til å delta i studien. Du kan også trekke deg underveis i studien hvis du av en eller annen grunn ikke ønsker å fullføre. Dersom du ønsker å delta, ber vi deg undertegne den vedlagte samtykkeerklæringen og sende den til oss så raskt som mulig, helst innen tirsdag 30. september. Bruk vedlagte frankerte konvolutt. Når vi har mottatt ditt samtykke, kontakter vi deg per telefon for å avtale videre forløp. Om du nå sier ja til å delta, kan du senere trekke tilbake ditt samtykke. Dersom du har spørsmål til studien, kan du kontakte Marianne Udnæseth på telefon 917 72 858. Vennlig hilsen Marianne Udnæseth Christine Helle Masterstudent i klinisk ernæring Ernæringsfysiolog Universitetet i Oslo Olympiatoppen Postadresse: Olympiatoppen Postboks 4004 Ullevål Stadion 0806 Oslo

80
Samtykke til deltakelse i studien Jeg er villig til å delta i studien Navn: …………………………………………………..
Adresse: …………………………………………………..
…………………………………………………..
…………………………………………………..
Telefon: …………………………………………………..
---------------------- ------------------------------------------------------------------------------------------ Dato Signert av prosjektdeltaker Jeg bekrefter å ha gitt informasjon om studien ---------------------- ------------------------------------------------------------------------------------------ Dato Signert av prosjektmedarbeider, rolle i studien

81
Appendix 4: The record notebook

82
4 dagers kost- og aktivitetsregistrering
for toppidrettsutøvere
Validering av energiinntak målt med 4-dagers veid kostregistrering blant toppidrettsutøvere
ved hjelp av energiforbruk målt med Sensewear Pro Armband
Navn: ……………………………………………………………………………
Adresse: ……………………………………………………………………………
Telefon: ……………………………………………………………………………
E-mail: ……………………………………………………………………………
Idrett: ……………………………………………………………………………
Dato (fra-til): ……………………………………………………………………………

83
Veiledning for kostregistrering (gule ark)
Du skal registrere kostholdet ditt i 4 dager (3 ukedager + 1 lørdag eller søndag)
Du skal også registrere treningen og aktivitetsnivået ditt i de samme 4 dagene
Prøv å unngå at kostregistreringen forandrer matvanene dine - spis slik du vanligvis gjør!
Skriv ned alt du spiser og drikker, også evt. kosttilskudd
Skriv ned evt. væskeinntak og matinntak under trening på sidene for treningsregistreringen
Start med det første måltidet den dagen registreringen begynner. Fyll inn alle måltidene du spiser,
både hoved- og mellommåltider. For hvert måltid skal følgende skrives ned (se også eksempel på 1-
dags kostregistrering på neste side):
1) Klokkeslett
2) Navnet på matvaren eller retten gi flest mulig opplysninger
- f.eks Birkebeinerbrød, Norvegia hvitost, Nora jordbærsyltetøy, lett melk, 15 kr Freia melkesjokolade
- evt. oppskrift på hjemmelagete retter (skriv oppskriften bak på arket)
- evt. hvordan retten er tilberedt (kokt, stekt etc.)
NB! Jo flere opplysninger du gir, jo riktigere blir beregningene. Se på matvareemballasjen når du skal
notere navnet. Hvis det er spesielle matvarer, kan du ta vare på emballasjen og legge den med.
3) Mengde av matvaren eller retten
oppgi mengde i gram når du har vekt tilgjengelig
oppgi mengde i husholdningsmål når du ikke har vekt
- antall, stykker, spiseskje, teskje, glass, kopp, dl
Veiing
Brødskiver: Nullstill vekten. Sett asjetten på vekten. Nullstill. Legg på brødskiven, les av og noter
hva den veier. Nullstill. Smør på brødskiven, legg den på vekten igjen, les og noter. Nullstill. Legg på
pålegg, les av og noter.
Kornblanding: Sett tallerkenen på vekten. Nullstill. Ha i kornblandingen, les av og noter vekten.
Nullstill. Ha i melk/yoghurt etc., les av og noter vekten.
Middag: Vei når retten er ferdig tilberedt (etter at maten er kokt, stekt etc.) Sett tallerken på vekta.
Nullstill. Vei så en og en ting om gangen. Les av og noter vekten, og nullstill mellom hver gang du
legger på noe nytt.
Sammenkokte retter: Veies i ett (f.eks fiskegrateng, gryterett o.l).
84
NB!
Vekten veier ikke mengder på 2 g eller mindre. Noter alle matvarer selv om de ikke gir noe utslag
på vekta, slik som f.eks. minimalt med margarin på brødskiva, en agurkskive til pynt etc.
Bein (f.eks. på kotelett), skinn (f.eks. på fiskeskiver), skall (f.eks. på banan) og annet som ikke er
piselig, veies for seg etterpå og trekkes fra vekten på den totale matvaren. Du kan evt. fjerne det før du
veier. Hvis du ikke har anledning til å veie det før eller etter, husk alltid å notere at vekten på matvaren
inkluderer skall, bein etc.
Veiledning for treningsregistrering (grønne ark)
Her skal du registrere de treningsøktene du har i løpet av en dag. Skriv ned type trening, intensitet
sone) og varighet på økta. I tillegg skal du registrere det du eventuelt inntar av væske og mat under
s
(
økta. Beskriv type og oppgi mengde i ml/g. Hvis du ikke har vekt tilgjengelig, oppgi mengde i
husholdningsmål (f.eks. 2 måleskjeer Maxim energidrikk i 750 ml vann, 1 banan etc.).
Veiledning for aktivitetsregistrering (hvite ark)
Her skal du registrere aktivitetsnivået ditt i løpet av døgnet. Fyll inn hva du gjør hvert 30 min i løpet av
døgnet: for eksempel sove, dusje, kle på deg, lage mat, spise, kjøre bil, gå til buss, sitte på buss, sitte på
jobb/skole, handle, gå tur etc. På de timene/minuttene du skriver trening, må du beskrive type trening
og intensitet: for eksempel oppvarming løp/sykkel, utholdenhetstrening langdistanse, styrketrening 30
reps, styrketrening max, rolig teknikktrening etc. (du kan bruke de samme opplysningene som du har
krevet på treningsregistreringen).
SKRIV TYDELIG!
Ring eller mail meg hvis du har noen spørsmål: 917 72 858
Registreringen skal leveres sammen med monitoren og tilhørende skjema umiddelbart etter at du er
ferdig.
Lykke til!
Marianne Udnæseth Masterstudent i klinisk ernæring Universitetet i Oslo
s

85

86
KOSTREGISTRERING Dag 1 Måltid 1 Kl. ..……….. Matvarer/retter Mengde ……………………………………………………… ……………………………. ……………………………………………………… ……………………………. ……………………………………………………… ……………………………. ……………………………………………………… ……………………………. ……………………………………………………… ……………………………. Måltid 2 Kl. ………….. Matvarer/retter Mengde ………………………………………………………… ……………………………. ………………………………………………………… ……………………………. ………………………………………………………… ……………………………. ………………………………………………………… ……………………………. ………………………………………………………… ……………………………. Måltid 3 Kl. ………….. Matvarer/retter Mengde ………………………………………………………… ……………………………. ………………………………………………………… ……………………………. ………………………………………………………… ……………………………. ………………………………………………………… ……………………………. ………………………………………………………… ……………………………. Måltid 4 Kl. ………….. Matvarer/retter Mengde ………………………………………………………… ……………………………. ………………………………………………………… ……………………………. ………………………………………………………… ……………………………. ………………………………………………………… ……………………………. ………………………………………………………… ……………………………. Måltid 5 Kl. ………….. Matvarer/retter Mengde ………………………………………………………… ……………………………. ………………………………………………………… ……………………………. ………………………………………………………… ……………………………. ………………………………………………………… ……………………………. ………………………………………………………… ……………………………. Måltid 6 Kl. ………….. Matvarer/retter Mengde ……………………………………………………… ……………………………. ……………………………………………………… ……………………………. ……………………………………………………… ……………………………. ……………………………………………………… ……………………………. ……………………………………………………… …………………………….

87
TRENINGSREGISTRERING Dag 1
NB! Skriv ned væskeinntak og matinntak (mengde og type) hvis du bruker det under trening Økt 1 Kl. ………..…….. Type trening og intensitet Varighet ……………………………………………………………..…. …………………….
……………………………………………………………..…. …………………….
Type væske-mat inntak Mengde
……………………………………………………………..…. …………………….
……………………………………………………………..…. …………………….
Økt 2 Kl. ………..…….. Type trening og intensitet Varighet ……………………………………………………………..…. …………………….
……………………………………………………………..…. …………………….
Type væske-mat inntak Mengde
……………………………………………………………..…. …………………….
……………………………………………………………..…. …………………….
Økt 3 Kl. ………..……..
Type trening og intensitet Varighet ……………………………………………………………..…. …………………….
……………………………………………………………..…. …………………….
Type væske-mat inntak Mengde
……………………………………………………………..…. …………………….
……………………………………………………………..…. …………………….
Evt. kommentarer til kostregistrering/treningsregistrering: ………………………………………………………………………………………………….............
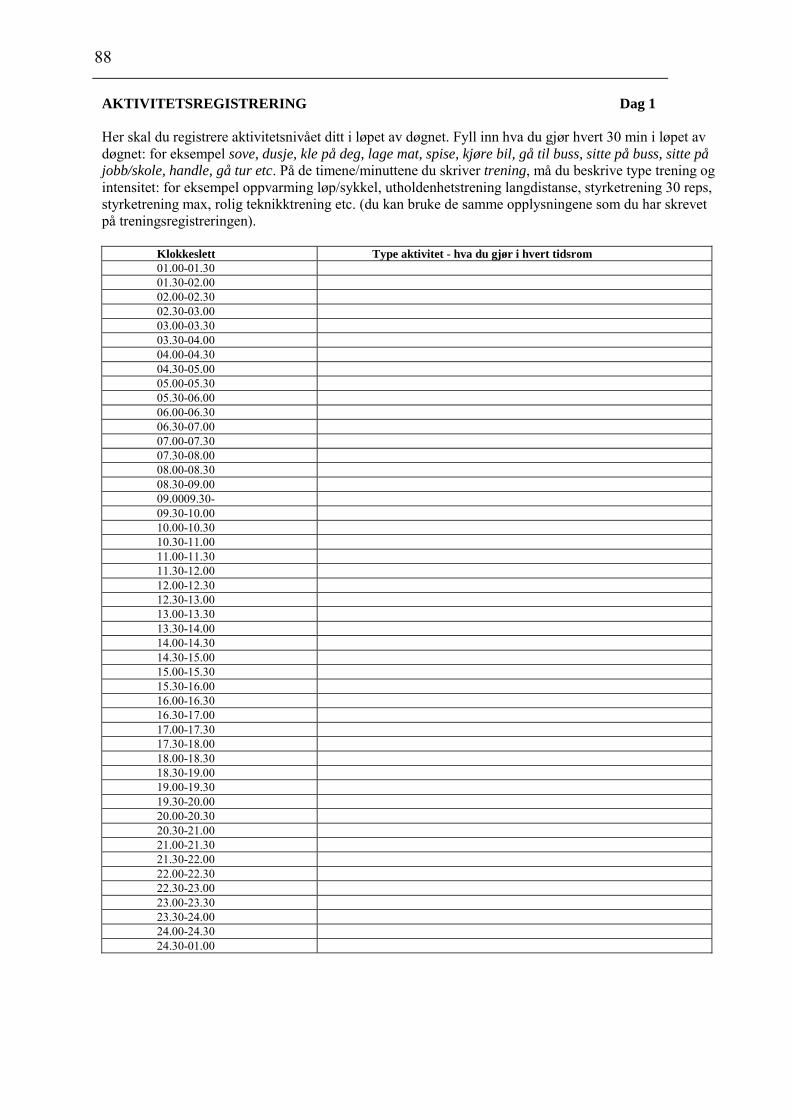
88
AKTIVITETSREGISTRERING Dag 1
Her skal du registrere aktivitetsnivået ditt i løpet av døgnet. Fyll inn hva du gjør hvert 30 min i løpet av døgnet: for eksempel sove, dusje, kle på deg, lage mat, spise, kjøre bil, gå til buss, sitte på buss, sitte på jobb/skole, handle, gå tur etc. På de timene/minuttene du skriver trening, må du beskrive type trening og intensitet: for eksempel oppvarming løp/sykkel, utholdenhetstrening langdistanse, styrketrening 30 reps, styrketrening max, rolig teknikktrening etc. (du kan bruke de samme opplysningene som du har skrevet på treningsregistreringen).
Klokkeslett Type aktivitet - hva du gjør i hvert tidsrom 01.00-01.30 01.30-02.00 02.00-02.30 02.30-03.00 03.00-03.30 03.30-04.00 04.00-04.30 04.30-05.00 05.00-05.30 05.30-06.00 06.00-06.30 06.30-07.00 07.00-07.30 07.30-08.00 08.00-08.30 08.30-09.00 09.0009.30- 09.30-10.00 10.00-10.30 10.30-11.00 11.00-11.30 11.30-12.00 12.00-12.30 12.30-13.00 13.00-13.30 13.30-14.00 14.00-14.30 14.30-15.00 15.00-15.30 15.30-16.00 16.00-16.30 16.30-17.00 17.00-17.30 17.30-18.00 18.00-18.30 18.30-19.00 19.00-19.30 19.30-20.00 20.00-20.30 20.30-21.00 21.00-21.30 21.30-22.00 22.00-22.30 22.30-23.00 23.00-23.30 23.30-24.00 24.00-24.30 24.30-01.00

89
KOSTREGISTRERING Dag 2
Måltid 1 Kl. ..……….. Matvarer/retter Mengde ………………………………………………………….. ……………………………. ………………………………………………………….. ……………………………. …………………………………………………………. ……………………………. …………………………………………………………. ……………………………. …………………………………………………………. ……………………………. Måltid 2 Kl. ………….. Matvarer/retter Mengde ………………………………………………………… ……………………………. ………………………………………………………… ……………………………. ………………………………………………………… ……………………………. ………………………………………………………… ……………………………. ………………………………………………………… ……………………………. Måltid 3 Kl. ………….. Matvarer/retter Mengde ………………………………………………………… ……………………………. ………………………………………………………… ……………………………. ………………………………………………………… ……………………………. ………………………………………………………… ……………………………. ………………………………………………………… ……………………………. Måltid 4 Kl. ………….. Matvarer/retter Mengde ………………………………………………………… ……………………………. ………………………………………………………… ……………………………. ………………………………………………………… ……………………………. ………………………………………………………… ……………………………. ………………………………………………………… ……………………………. Måltid 5 Kl. ………….. Matvarer/retter Mengde ………………………………………………………… ……………………………. ………………………………………………………… ……………………………. ………………………………………………………… ……………………………. ………………………………………………………… ……………………………. ………………………………………………………… ……………………………. Måltid 6 Kl. ………….. Matvarer/retter Mengde ……………………………………………………… ……………………………. ……………………………………………………… ……………………………. ……………………………………………………… ……………………………. ……………………………………………………… ……………………………. ………………………………………………………. …………………………….

90
TRENINGSREGISTRERING Dag 2
NB! Skriv ned væskeinntak og matinntak (mengde og type) hvis du bruker det under trening Økt 1 Kl. ………..…….. Type trening og intensitet Varighet ……………………………………………………………..…. …………………….
……………………………………………………………..…. …………………….
Type væske-mat inntak Mengde
……………………………………………………………..…. …………………….
……………………………………………………………..…. …………………….
Økt 2 Kl. ………..…….. Type trening og intensitet Varighet ……………………………………………………………..…. …………………….
……………………………………………………………..…. …………………….
Type væske-mat inntak Mengde
……………………………………………………………..…. …………………….
……………………………………………………………..…. …………………….
Økt 3 Kl. ………..……..
Type trening og intensitet Varighet ……………………………………………………………..…. …………………….
……………………………………………………………..…. …………………….
Type væske-mat inntak Mengde
……………………………………………………………..…. …………………….
……………………………………………………………..…. …………………….
Evt. kommentarer til kostregistrering/treningsregistrering: ………………………………………………………………………………………………….............
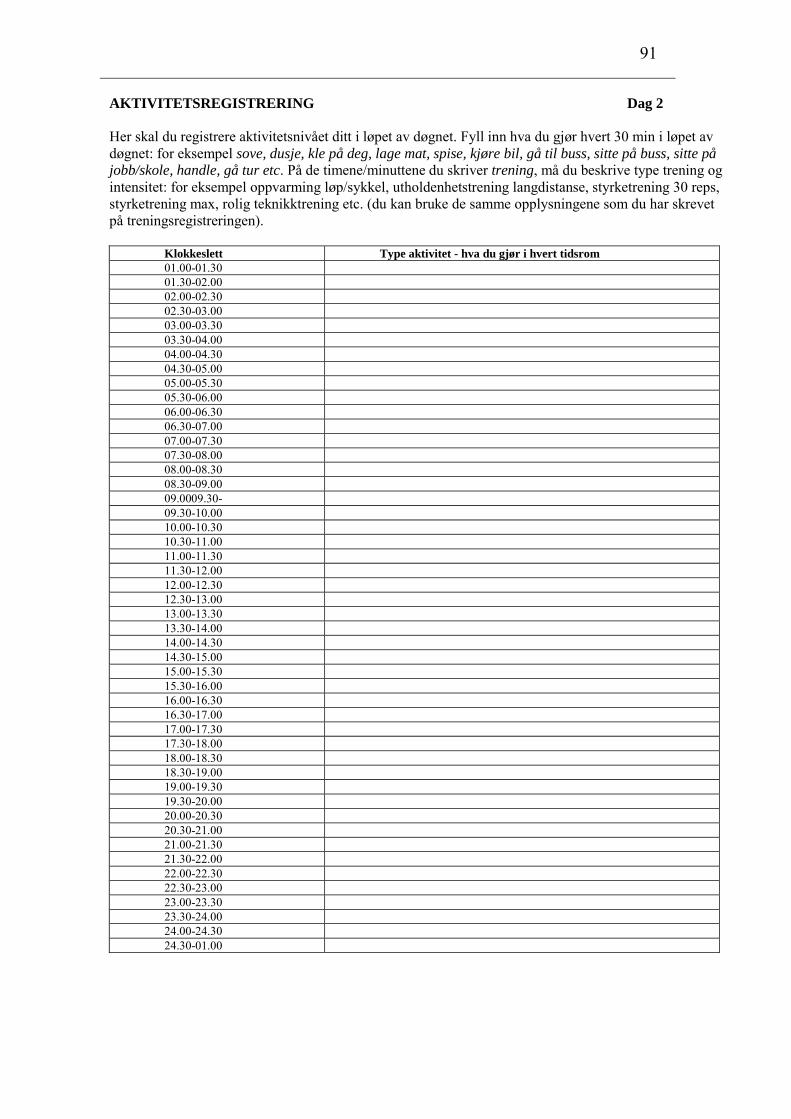
91
AKTIVITETSREGISTRERING Dag 2
Her skal du registrere aktivitetsnivået ditt i løpet av døgnet. Fyll inn hva du gjør hvert 30 min i løpet av døgnet: for eksempel sove, dusje, kle på deg, lage mat, spise, kjøre bil, gå til buss, sitte på buss, sitte på jobb/skole, handle, gå tur etc. På de timene/minuttene du skriver trening, må du beskrive type trening og intensitet: for eksempel oppvarming løp/sykkel, utholdenhetstrening langdistanse, styrketrening 30 reps, styrketrening max, rolig teknikktrening etc. (du kan bruke de samme opplysningene som du har skrevet på treningsregistreringen).
Klokkeslett Type aktivitet - hva du gjør i hvert tidsrom 01.00-01.30 01.30-02.00 02.00-02.30 02.30-03.00 03.00-03.30 03.30-04.00 04.00-04.30 04.30-05.00 05.00-05.30 05.30-06.00 06.00-06.30 06.30-07.00 07.00-07.30 07.30-08.00 08.00-08.30 08.30-09.00 09.0009.30- 09.30-10.00 10.00-10.30 10.30-11.00 11.00-11.30 11.30-12.00 12.00-12.30 12.30-13.00 13.00-13.30 13.30-14.00 14.00-14.30 14.30-15.00 15.00-15.30 15.30-16.00 16.00-16.30 16.30-17.00 17.00-17.30 17.30-18.00 18.00-18.30 18.30-19.00 19.00-19.30 19.30-20.00 20.00-20.30 20.30-21.00 21.00-21.30 21.30-22.00 22.00-22.30 22.30-23.00 23.00-23.30 23.30-24.00 24.00-24.30 24.30-01.00

92
KOSTREGISTRERING Dag 3
Måltid 1 Kl. ..……….. Matvarer/retter Mengde ……………………………………………………… ……………………………. ……………………………………………………… ……………………………. ……………………………………………………… ……………………………. ……………………………………………………… ……………………………. ……………………………………………………… ……………………………. Måltid 2 Kl. ………….. Matvarer/retter Mengde ………………………………………………………… ……………………………. ………………………………………………………… ……………………………. ………………………………………………………… ……………………………. ………………………………………………………… ……………………………. ………………………………………………………… ……………………………. Måltid 3 Kl. ………….. Matvarer/retter Mengde ………………………………………………………… ……………………………. ………………………………………………………… ……………………………. ………………………………………………………… ……………………………. ………………………………………………………… ……………………………. ………………………………………………………… ……………………………. Måltid 4 Kl. ………….. Matvarer/retter Mengde ………………………………………………………… ……………………………. ………………………………………………………… ……………………………. ………………………………………………………… ……………………………. ………………………………………………………… ……………………………. ………………………………………………………… ……………………………. Måltid 5 Kl. ………….. Matvarer/retter Mengde ………………………………………………………… ……………………………. ………………………………………………………… ……………………………. ………………………………………………………… ……………………………. ………………………………………………………… ……………………………. ………………………………………………………… ……………………………. Måltid 6 Kl. ………….. Matvarer/retter Mengde ……………………………………………………… ……………………………. ……………………………………………………… ……………………………. ……………………………………………………… ……………………………. ……………………………………………………… ……………………………. ……………………………………………………… …………………………….
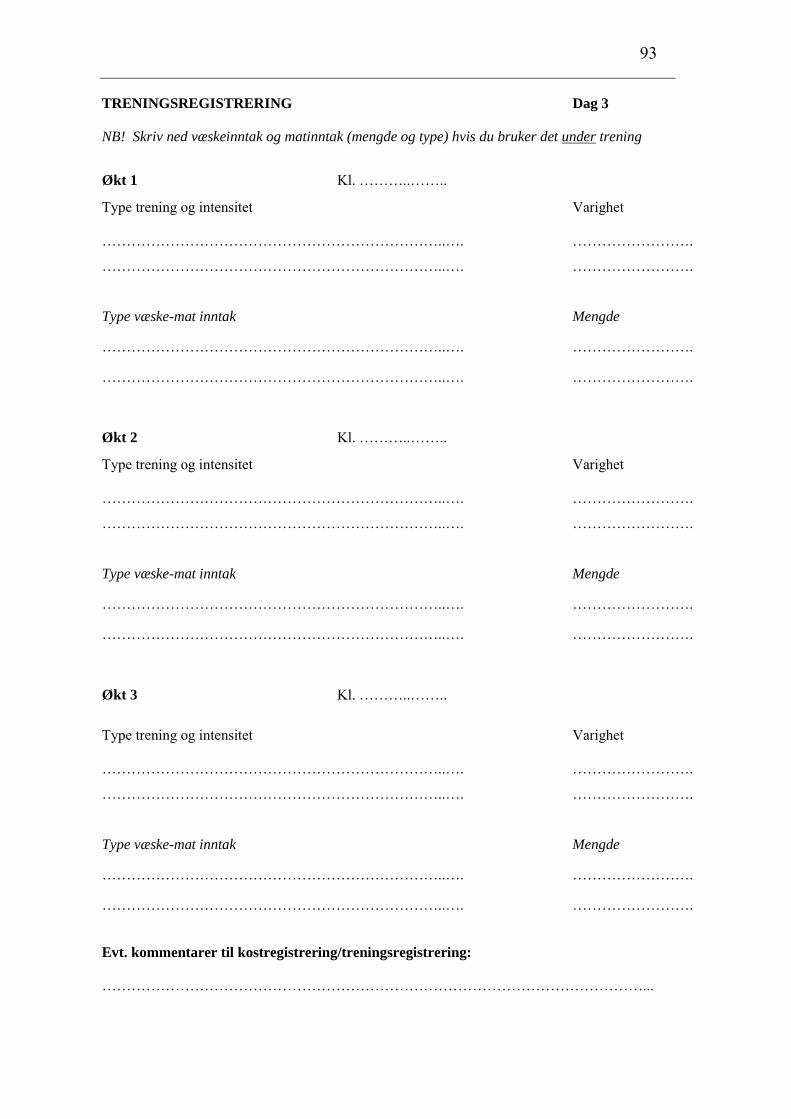
93
TRENINGSREGISTRERING Dag 3
NB! Skriv ned væskeinntak og matinntak (mengde og type) hvis du bruker det under trening Økt 1 Kl. ………..…….. Type trening og intensitet Varighet ……………………………………………………………..…. …………………….
……………………………………………………………..…. …………………….
Type væske-mat inntak Mengde
……………………………………………………………..…. …………………….
……………………………………………………………..…. …………………….
Økt 2 Kl. ………..…….. Type trening og intensitet Varighet ……………………………………………………………..…. …………………….
……………………………………………………………..…. …………………….
Type væske-mat inntak Mengde
……………………………………………………………..…. …………………….
……………………………………………………………..…. …………………….
Økt 3 Kl. ………..……..
Type trening og intensitet Varighet ……………………………………………………………..…. …………………….
……………………………………………………………..…. …………………….
Type væske-mat inntak Mengde
……………………………………………………………..…. …………………….
……………………………………………………………..…. …………………….
Evt. kommentarer til kostregistrering/treningsregistrering: …………………………………………………………………………………………………...

94
AKTIVITETSREGISTRERING Dag 3
Her skal du registrere aktivitetsnivået ditt i løpet av døgnet. Fyll inn hva du gjør hvert 30 min i løpet av døgnet: for eksempel sove, dusje, kle på deg, lage mat, spise, kjøre bil, gå til buss, sitte på buss, sitte på jobb/skole, handle, gå tur etc. På de timene/minuttene du skriver trening, må du beskrive type trening og intensitet: for eksempel oppvarming løp/sykkel, utholdenhetstrening langdistanse, styrketrening 30 reps, styrketrening max, rolig teknikktrening etc. (du kan bruke de samme opplysningene som du har skrevet på treningsregistreringen).
Klokkeslett Type aktivitet - hva du gjør i hvert tidsrom 01.00-01.30 01.30-02.00 02.00-02.30 02.30-03.00 03.00-03.30 03.30-04.00 04.00-04.30 04.30-05.00 05.00-05.30 05.30-06.00 06.00-06.30 06.30-07.00 07.00-07.30 07.30-08.00 08.00-08.30 08.30-09.00 09.0009.30- 09.30-10.00 10.00-10.30 10.30-11.00 11.00-11.30 11.30-12.00 12.00-12.30 12.30-13.00 13.00-13.30 13.30-14.00 14.00-14.30 14.30-15.00 15.00-15.30 15.30-16.00 16.00-16.30 16.30-17.00 17.00-17.30 17.30-18.00 18.00-18.30 18.30-19.00 19.00-19.30 19.30-20.00 20.00-20.30 20.30-21.00 21.00-21.30 21.30-22.00 22.00-22.30 22.30-23.00 23.00-23.30 23.30-24.00 24.00-24.30 24.30-01.00

95
KOSTREGISTRERING Dag 4
Måltid 1 Kl. ..……….. Matvarer/retter Mengde ……………………………………………………… ……………………………. ……………………………………………………… ……………………………. ……………………………………………………… ……………………………. ……………………………………………………… ……………………………. ……………………………………………………… ……………………………. Måltid 2 Kl. ………….. Matvarer/retter Mengde ………………………………………………………… ……………………………. ………………………………………………………… ……………………………. ………………………………………………………… ……………………………. ………………………………………………………… ……………………………. ………………………………………………………… ……………………………. Måltid 3 Kl. ………….. Matvarer/retter Mengde ………………………………………………………… ……………………………. ………………………………………………………… ……………………………. ………………………………………………………… ……………………………. ………………………………………………………… ……………………………. ………………………………………………………… ……………………………. Måltid 4 Kl. ………….. Matvarer/retter Mengde ………………………………………………………… ……………………………. ………………………………………………………… ……………………………. ………………………………………………………… ……………………………. ………………………………………………………… ……………………………. ………………………………………………………… ……………………………. Måltid 5 Kl. ………….. Matvarer/retter Mengde ………………………………………………………… ……………………………. ………………………………………………………… ……………………………. ………………………………………………………… ……………………………. ………………………………………………………… ……………………………. ………………………………………………………… ……………………………. Måltid 6 Kl. ………….. Matvarer/retter Mengde ……………………………………………………… ……………………………. ……………………………………………………… ……………………………. ……………………………………………………… ……………………………. ……………………………………………………… ……………………………. ……………………………………………………… …………………………….

96
TRENINGSREGISTRERING Dag 4
NB! Skriv ned væskeinntak og matinntak (mengde og type) hvis du bruker det under trening Økt 1 Kl. ………..…….. Type trening og intensitet Varighet ……………………………………………………………..…. …………………….
……………………………………………………………..…. …………………….
Type væske-mat inntak Mengde
……………………………………………………………..…. …………………….
……………………………………………………………..…. …………………….
Økt 2 Kl. ………..…….. Type trening og intensitet Varighet ……………………………………………………………..…. …………………….
……………………………………………………………..…. …………………….
Type væske-mat inntak Mengde
……………………………………………………………..…. …………………….
……………………………………………………………..…. …………………….
Økt 3 Kl. ………..……..
Type trening og intensitet Varighet ……………………………………………………………..…. …………………….
……………………………………………………………..…. …………………….
Type væske-mat inntak Mengde
……………………………………………………………..…. …………………….
……………………………………………………………..…. …………………….
Evt. kommentarer til kostregistrering/treningsregistrering: …………………………………………………………………………………………………...

97
AKTIVITETSREGISTRERING Dag 4
Her skal du registrere aktivitetsnivået ditt i løpet av døgnet. Fyll inn hva du gjør hvert 30 min i løpet av døgnet: for eksempel sove, dusje, kle på deg, lage mat, spise, kjøre bil, gå til buss, sitte på buss, sitte på jobb/skole, handle, gå tur etc. På de timene/minuttene du skriver trening, må du beskrive type trening og intensitet: for eksempel oppvarming løp/sykkel, utholdenhetstrening langdistanse, styrketrening 30 reps, styrketrening max, rolig teknikktrening etc. (du kan bruke de samme opplysningene som du har skrevet på treningsregistreringen).
Klokkeslett Type aktivitet - hva du gjør i hvert tidsrom 01.00-01.30 01.30-02.00 02.00-02.30 02.30-03.00 03.00-03.30 03.30-04.00 04.00-04.30 04.30-05.00 05.00-05.30 05.30-06.00 06.00-06.30 06.30-07.00 07.00-07.30 07.30-08.00 08.00-08.30 08.30-09.00 09.0009.30- 09.30-10.00 10.00-10.30 10.30-11.00 11.00-11.30 11.30-12.00 12.00-12.30 12.30-13.00 13.00-13.30 13.30-14.00 14.00-14.30 14.30-15.00 15.00-15.30 15.30-16.00 16.00-16.30 16.30-17.00 17.00-17.30 17.30-18.00 18.00-18.30 18.30-19.00 19.00-19.30 19.30-20.00 20.00-20.30 20.30-21.00 21.00-21.30 21.30-22.00 22.00-22.30 22.30-23.00 23.00-23.30 23.30-24.00 24.00-24.30 24.30-01.00
98
Appendix 5: Written information about the SenseWear Pro2 Armband given to the participants
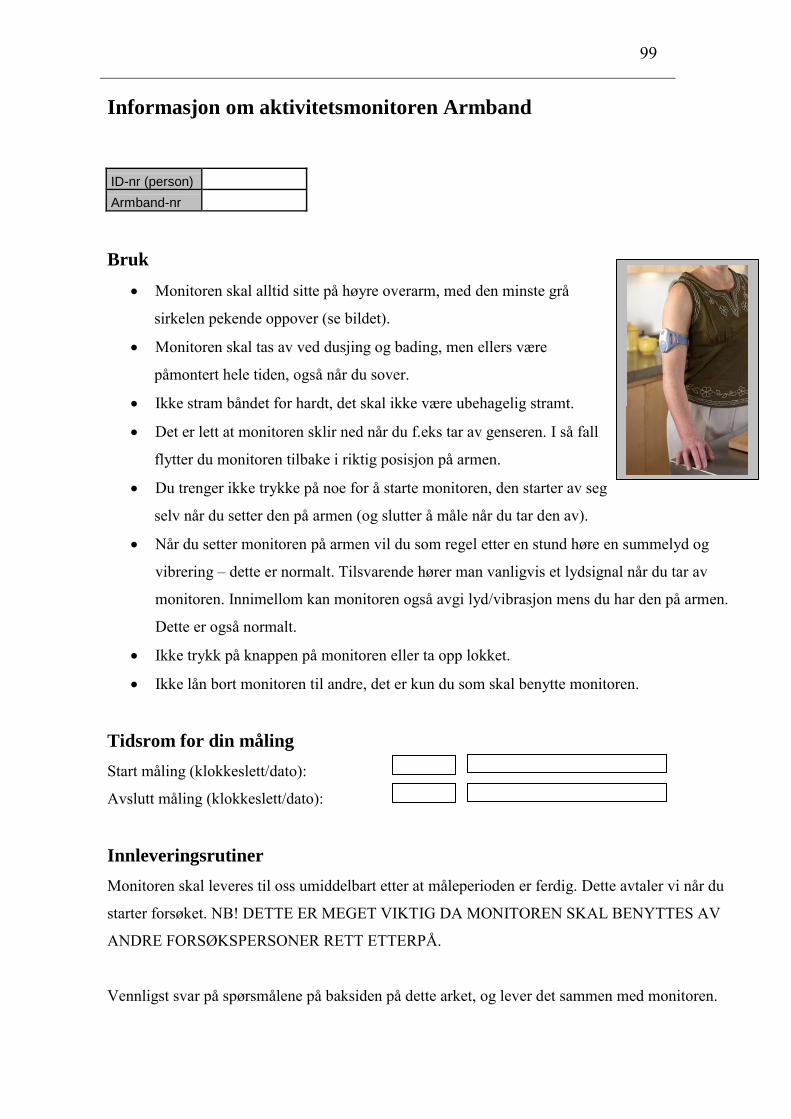
99
Informasjon om aktivitetsmonitoren Armband
ID-nr (person)
Armband-nr
Bruk
Monitoren skal alltid sitte på høyre overarm, med den minste grå
sirkelen pekende oppover (se bildet).
Monitoren skal tas av ved dusjing og bading, men ellers være
påmontert hele tiden, også når du sover.
Ikke stram båndet for hardt, det skal ikke være ubehagelig stramt.
Det er lett at monitoren sklir ned når du f.eks tar av genseren. I så fall
flytter du monitoren tilbake i riktig posisjon på armen.
Du trenger ikke trykke på noe for å starte monitoren, den starter av seg
selv når du setter den på armen (og slutter å måle når du tar den av).
Når du setter monitoren på armen vil du som regel etter en stund høre en summelyd og
vibrering – dette er normalt. Tilsvarende hører man vanligvis et lydsignal når du tar av
monitoren. Innimellom kan monitoren også avgi lyd/vibrasjon mens du har den på armen.
Dette er også normalt.
Ikke trykk på knappen på monitoren eller ta opp lokket.
Ikke lån bort monitoren til andre, det er kun du som skal benytte monitoren.
Tidsrom for din måling
Start måling (klokkeslett/dato):
Avslutt måling (klokkeslett/dato):
Innleveringsrutiner
Monitoren skal leveres til oss umiddelbart etter at måleperioden er ferdig. Dette avtaler vi når du
starter forsøket. NB! DETTE ER MEGET VIKTIG DA MONITOREN SKAL BENYTTES AV
ANDRE FORSØKSPERSONER RETT ETTERPÅ.
Vennligst svar på spørsmålene på baksiden på dette arket, og lever det sammen med monitoren.

100
Vennligst besvar følgende spørsmål
1. Har monitoren vært behagelig å gå med? (ett kryss)
Svært behagelig
Ganske behagelig
Noe ubehagelig
Svært ubehagelig
Hvis monitoren har vært svært eller noe ubehagelig å gå med – hva skyldes dette?
_______________________________________________________________________________________
_______________________________________________________________________________________
. Har du hatt monitoren på armen stort sett hele tiden i disse 4 dagene? (ett kryss)
2
Nei, jeg har hatt monitoren på armen i liten eller ingen grad
Det er en eller flere dager, eller lengre perioder, jeg ikke har hatt monitoren på armen
Jeg har stort sett hatt monitoren på armen, men tatt den av ved enkelte anledninger/kortere perioder
Jeg har hatt monitoren på armen tilnærmet hele tiden, unntatt ved dusjing/bading
Hvis du i lange perioder ikke har hatt monitoren på armen – hva skyldes dette?
_________________________________________________________________________________________
_________________________________________________________________________________________
3. Har du hatt monitoren på armen de samme 4 dagene som du har gjort veid kostregistrering?
Ja
Nei
Hvis nei – hva skyldes dette?
_________________________________________________________________________________________
_________________________________________________________________________________________
4. Ønsker du time hos ernæringsfysiolog for å få en vurdering av ditt kosthold, jernstatus og
kroppssammensetning, samt resultater fra målingen av din fysiske aktivitet (monitor-data)?
Ja
Nei
Ønsker kun å få resultatene tilsendt i posten
Ved spørsmål rundt bruken av Armband, ta kontakt med Marianne: [email protected].
917 72 858
TAKK FOR DIN DELTAGELSE OG INNSATS I PROSJEKTET!

101
Appendix 6: Control questions to the diet- and activity record
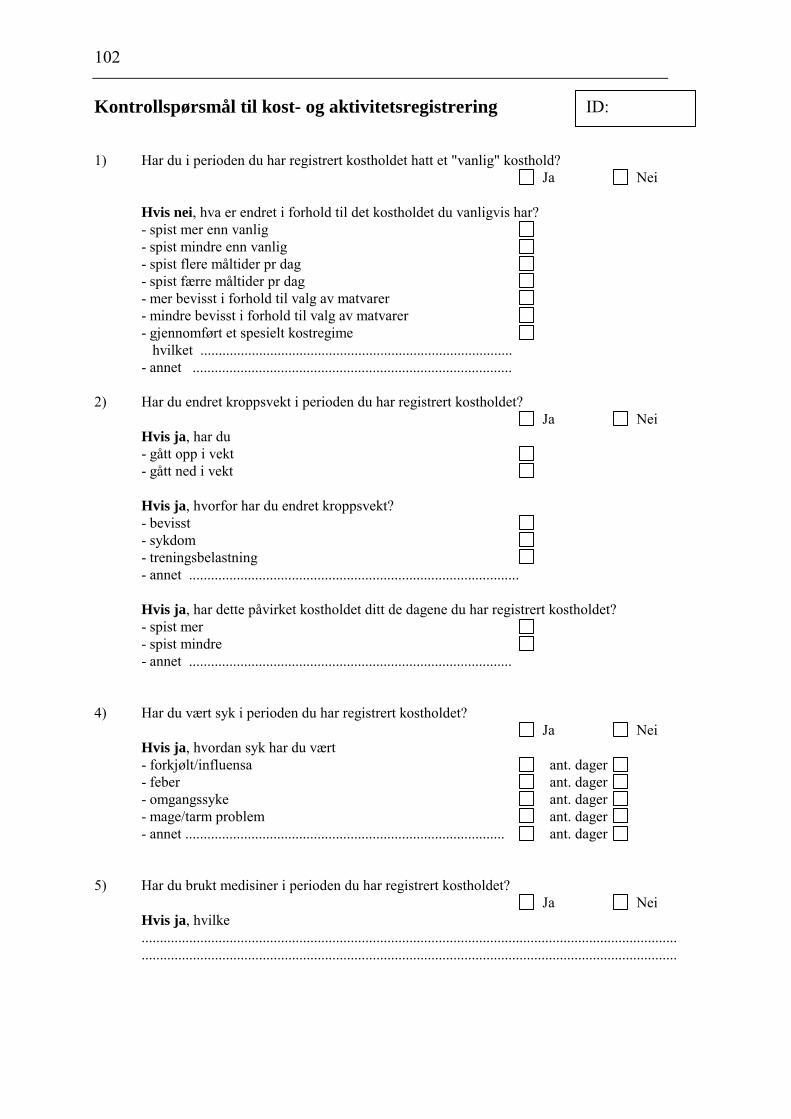
102
Kontrollspørsmål til kost- og aktivitetsregistrering 1) Har du i perioden du har registrert kostholdet hatt et "vanlig" kosthold? Ja Nei Hvis nei, hva er endret i forhold til det kostholdet du vanligvis har? - spist mer enn vanlig - spist mindre enn vanlig - spist flere måltider pr dag - spist færre måltider pr dag - mer bevisst i forhold til valg av matvarer - mindre bevisst i forhold til valg av matvarer - gjennomført et spesielt kostregime hvilket ..................................................................................... - annet ....................................................................................... 2) Har du endret kroppsvekt i perioden du har registrert kostholdet? Ja Nei Hvis ja, har du - gått opp i vekt - gått ned i vekt Hvis ja, hvorfor har du endret kroppsvekt? - bevisst - sykdom - treningsbelastning - annet .......................................................................................... Hvis ja, har dette påvirket kostholdet ditt de dagene du har registrert kostholdet? - spist mer - spist mindre - annet ........................................................................................ 4) Har du vært syk i perioden du har registrert kostholdet? Ja Nei Hvis ja, hvordan syk har du vært - forkjølt/influensa ant. dager - feber ant. dager - omgangssyke ant. dager - mage/tarm problem ant. dager - annet ....................................................................................... ant. dager 5) Har du brukt medisiner i perioden du har registrert kostholdet? Ja Nei Hvis ja, hvilke .................................................................................................................................................. ..................................................................................................................................................
ID:
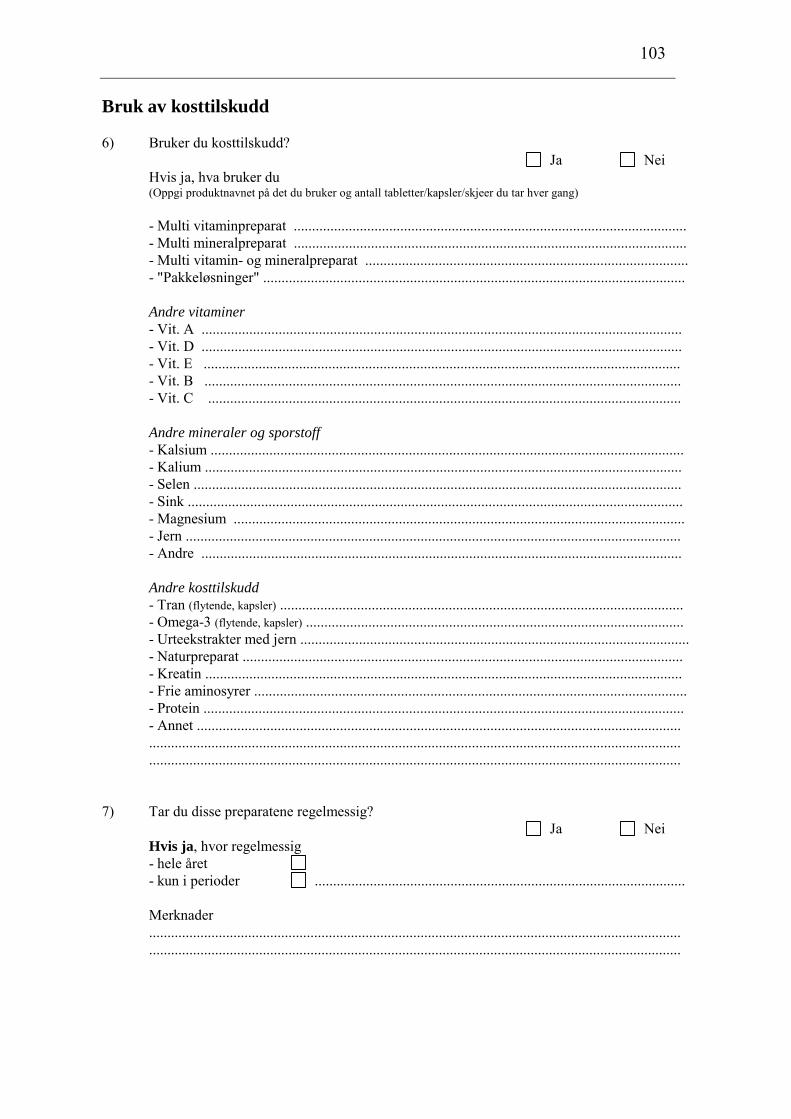
103
Bruk av kosttilskudd 6) Bruker du kosttilskudd? Ja Nei Hvis ja, hva bruker du (Oppgi produktnavnet på det du bruker og antall tabletter/kapsler/skjeer du tar hver gang)
- Multi vitaminpreparat ........................................................................................................... - Multi mineralpreparat ........................................................................................................... - Multi vitamin- og mineralpreparat ........................................................................................ - "Pakkeløsninger" ................................................................................................................... Andre vitaminer - Vit. A ................................................................................................................................... - Vit. D ................................................................................................................................... - Vit. E .................................................................................................................................. - Vit. B .................................................................................................................................. - Vit. C ................................................................................................................................. Andre mineraler og sporstoff - Kalsium ................................................................................................................................. - Kalium .................................................................................................................................. - Selen ..................................................................................................................................... - Sink ....................................................................................................................................... - Magnesium ........................................................................................................................... - Jern ....................................................................................................................................... - Andre ................................................................................................................................... Andre kosttilskudd - Tran (flytende, kapsler) .............................................................................................................. - Omega-3 (flytende, kapsler) .......................................................................................................
- Urteekstrakter med jern .......................................................................................................... - Naturpreparat ........................................................................................................................
- Kreatin .................................................................................................................................. - Frie aminosyrer ...................................................................................................................... - Protein ................................................................................................................................... - Annet .................................................................................................................................... ................................................................................................................................................. ................................................................................................................................................. 7) Tar du disse preparatene regelmessig? Ja Nei Hvis ja, hvor regelmessig - hele året - kun i perioder ..................................................................................................... Merknader ................................................................................................................................................. .................................................................................................................................................

104
8) Hvorfor tar du kosttilskudd? ................................................................................................................................................. ................................................................................................................................................. ................................................................................................................................................. 9) Er det noen som har anbefalt deg å ta kosttilskudd? Ja Nei Hvis ja, hvem ................................................................................................................................................. ................................................................................................................................................. 10) Hvor lenge har du brukt kosttilskudd? ................................................................................................................................................. ................................................................................................................................................. 11) Betaler du selv for preparatene? Ja Nei Hvis nei, hvem betaler for preparatene - familie/foreldre - særforbund/laget - produsent - andre ......................................................................................... 12) Bruker du sportsprodukter (sportsdrikke, sportsbar, restitusjonspulver etc)? Ja Nei Hvis ja, hvilke ……...............................................................................…...................................................... .....................................................................…........................................................................
Hvis ja, når ……...............................................................................…...................................................... .....................................................................…........................................................................ 13) Tar du spesielle kosthensyn i forbindelse med treningstidspunkt (før, under, etter)? Ja Nei
Hvis ja, hvilke Før: ...............................................................................…..............................................................
.....................................................................…........................................................................
Under: .................................................................................................................................................
..........................................................................…...................................................................
Etter: ..............................................................…...............................................................................
......................................................................…....................................................................... 14) Har du noen gang tidligere fått noen form for kostveiledning? Ja Nei Hvis ja, fra hvem .................................................................................................................................................
105
Appendix 7: An example of the feedback the participants received
106
Oslo, 12.01.2008 Kjære deltaker, tusen takk for flott innsats i forskningsprosjektet ”Validering av energiinntak målt med 4-dagers veid kostregistrering blant toppidrettsutøvere ved hjelp av energiforbruk målt med Senswear Pro Armband”. Vedlagt finner du en vurdering av kostholdet ditt, basert på de fire dagene du veide og registrerte inntaket ditt. Dersom du i tillegg målte kroppssammensetning (DXA) og jernstatus (blodprøve), står disse resultatene i henholdsvis tabell 3 og 4 på side 1. I tillegg til kostvurdering, får du også kopi av dine resultater fra målingen av energiforbruk. På siste side finner du forlaringer til hvordan du skal tolke disse resultatene. Hvis du har noen spørsmål vedrørende tilbakemeldingen eller ønsker å få en nærmere gjennomgang av resultatene dine, send mail til [email protected]. Det er fortsatt mulighet til å måle kroppssammensetning (DXA) for dere som ennå ikke har gjort det. Som nevnt tidligere er ikke det en obligatorisk del av studien, men noe vi oppfordrer dere til å gjøre. Det er en verdifull måling for alle toppidrettsutøvere, som gir tall på hvor mye muskelmasse og fettmasse du har, samt fordelingen av dette i kroppen. I tillegg måler den beintettheten din. Vennlig hilsen Marianne Udnæseth Christine Helle Masterstudent i klinisk ernæring Ernæringsfysiolog Universitetet i Oslo Olympiatoppen

107
Periode: Oktober 2008 Tabell 1: Inntak av næringsstoffer Ditt daglige inntak Anbefalt daglig inntak
Uten kosttilskudd Med kosttilskudd Energi (kcal) 5376 5634 Fett (g) 180,8 187,7 Protein (g) Protein (g per kg)
201,0 2,3
201,1 1,2-1,8
Karbohydrat (g) Karbohydrat (g per kg)
718,4 8,2
- 6-10
Kostfiber (g) 41,0 - 35
Jern (mg) 27,6 - 9
Kalsium (mg) 2217 - 800
Vitamin C (mg) 73 - 75 Vitamin D (µg) 5,8 - 7,5 Tabell 2: Fordeling av energigivende næringsstoffer
Forklaring til anbefalingene: Anbefalingene gjelder for mannlige utøvere i utholdenhetsidretter med minst 1 økt daglig. Anbefalingene for karbohydrat og protein uttrykt i gram pr kg kroppsvekt (tabell 1) angir ditt absolutte behov. Anbefalingene for karbohydrat, protein og fett uttrykt i prosent (tabell 2) viser hvor mye de tre næringsstoffene bør bidra med av ditt totale energiinntak. Anbefalingene for fordeling av de energigivende næringsstoffene angir den ideelle sammensetningen av kostholdet til idrettsutøvere. Det er først og fremst det absolutte behovet (tabell 1) det er viktig at du får dekket. Tabell 3: Kroppssammensetning (målt med DXA)
Tabell 4: Jernstatus (blodprøver)
Din fordeling Anbefalt fordeling
Protein (%) 15 12-20 Fett (%) - mettet fett (%) - umettet fett (%)
30 11 16
25-30 < 10 > 15
Karbohydrat (%) - sukker (%)
55 11
55-65 < 10
Alkohol (%) 0 0
Muskelvev (kg) 77,9
Fettvev (kg) Fettvev (%)
5,4 6,5
Beintetthet Høy
Din verdi Anbefalt verdi
Hemoglobin (g/100 mL) 14,7 13,4-17,0
Serum Ferritin (µg/L) 52 20-300
Tilbakemelding NN

108
Vurdering av kostholdet ditt Proteininntak: Av tabell 1 ser du at du får i deg nok proteiner gjennom den kosten du spiser. Rene fileter av kjøtt, fisk og kylling er bedre proteinkilder enn pølser, salami og kjøttdeig (blandingsprodukter). Melk, yoghurt,
I
egg og ost er også gode proteinkilder.
Karbohydratinntak: Karbohydratinntaket ditt er bra! Fortsett å velge gode karbohydratkilder som grovt brød, korn, pasta, ris, potet, frukt og grønnsaker.
Inntak av jern, kalsium, vitamin C og vitamin D: nntaket ditt av jern og kalsium er veldig bra, og du ser av tabell 1 at du dekker behovet ditt for disse
næringsstoffene. Vitamin C og vitamin D får du for lite av. Vitamin C inntaket kan du enkelt øke ved å spise mer frukt og grønnsaker (se kommentar under matvarevalg). Behovet for vitamin D kan være vanskelig å dekke via kosten, så sant man ikke spiser mye fet fisk som pålegg og til middag. Det kan derfor være lurt å ta et trantilskudd for å sikre at du får i deg nok vitamin D og omega-3 fettsyrer. I tillegg bør du prøve å få i deg gode vitamin D kilder fra kosten, slik som makrell, laks, ørret, margarin og ekstra lett melk.
Matvarevalg: Du velger mange bra matvarer som grovt brød, havregryn, kornblanding, margarin, lett melk, yoghurt, hvitost, leverpostei, kylling, fisk, juice og litt frukt og grønnsaker. Bær, frukt og grønnsaker bør du spise mer av for å sikre at du får i deg nok vitaminer og naturlige antioksidanter. Du spiser i gjennomsnitt 2 porsjoner frukt og under 1 porsjon grønnsaker per dag. Husk ”5 om dagen”! Drikk et glass appelsinjuice til frokost, pynt brødskivene med paprika, agurk og tomat, spis frukt og grønnsaker som mellommåltider og dessert etter måltider, og spis alltid en god porsjon salat/grønnsaker til middag. Du har en fin fordeling av næringsstoffer i kosten din (tabell 2). Du ligger noe over det anbefalte inntaket av sukker og mettet fett. Et litt høyt sukkerinntak skyldes bruk av mye søtpålegg som prim og brunost, samt inntak av brownies, muffins og brus. Varier med proteinrike pålegg som fisk, egg, hvitost og skinke- og kalkunpålegg, og begrens inntak av kaker og søtt. Mettet fett får du hovedsakelig i deg fra blandingsprodukter av kjøtt, som pølser og kjøttdeig, men også fra kaker og fete oster. Velg rene fileter av fisk, kjøtt og kylling, som inneholder mindre mettet fett og i tillegg er bedre proteinkilder.
Måltidsrytme: Du har en god måltidsrytme med mange måltider jevnt fordelt utover dagen.
Kostråd i forhold til treningsøktene: Det er viktig at du spiser nok før trening slik at du er i energibalanse på hele treningsøkten. Et karbohydratrikt måltid 1-3 timer før økten starter vil medføre en siste fylling av glykogenlagrene og regulering av blodsukkeret. Før økter med styrketrening eller lange utholdenhetsøkter bør du ha et bra proteininntak i tillegg til karbohydratinntaket for å sikre optimal proteinomsetning. Du har bra måltider de siste 1-3 timene før trening. drettsutøvere anbefales å drikke på alle økter som varer mer enn 30 minutter. Det er da viktig å drikke
så mye at du ikke har et væsketap som overstiger 2% av kroppsvekten. Du drikker 5-12 dl vann per time trening. Dette er tilstrekkelig i forhold til ditt væsketap. Du bør drikke minst 5 dl per time trening. varmt klima kan det være nødvendig å drikke mer.
Du har et karbohydratinntak under trening på 37 gram per time, når du har økter over 60 min. Dette er tilstrekkelig for å sikre høy kvalitet på lange og/eller harde økter. Karbohydratinntak under trening vil
I
I
109
øke arbeidskapasiteten din dersom du tømmer glykogenlagrene dine og/eller får lavt blodsukker i løpet av økten. For deg vil dette sannsynligvis være treningsøkter som varer mer enn 60-90 min., avhengig av intensiteten. Anbefalingen for slike økter er å innta 30-60 gram karbohydrat per time trening i form av en sportsdrikke med 4-6% karbohydrat (tilsvarer 4-6 gram per dl vann). Du kan også få dette karbohydratinntaket fra mat med høy glykemisk indeks (energibar, moden banan, rosiner, loff med syltetøy etc), men pass da på at du tygger maten godt og drikker vann til. Energibarer gir 20-40 gram karbohydrat (se på pakken), 1 banan gir 20-25 gram, 1 dl rosiner gir 40 gram og 1 skive loff med syltetøy gir 20-25 gram. Du er flink til å få i deg mat og drikke umiddelbart etter trening, noe som gir grunnlag for optimal restitusjon. Etter alle treningsøkter er det viktig å innta væske, karbohydrat og protein for at restitusjonsprosessene skal bli optimale. Du skal erstatte væsketapet ditt med 150% av væsketapet du har hatt i løpet av treningen. Det betyr at mengden du trenger vil avhenge av hvor mye du har drukket under økten. Prøv uansett å drikke minst 5 dl direkte etter økten og fortsette å drikke til du har tisset 2 ganger. Etter lange økter og i varmt klima må du sannsynligvis drikke vesentlig mer. Så bør du innta 1-1,5 gram karbohydrat pr kg kroppsvekt innen ½ time etter alle økter. Det kan du gjøre ved å spise et måltid med karbohydratrik mat og noe protein innen ½ time etter økten, for eksempel: a) 2-3 brødskiver med syltetøy og 1 glass melk; b) 2-3 brødskiver med proteinrikt pålegg (ost, fisk, kylling, kjøtt, egg) og 1 glass juice til; c) 1,5 dl kornblanding med 1 ss syltetøy og 2 dl melk eller yoghurt; d) varmrett med 150-200 gram pasta, ris eller poteter og litt fisk, kylling, kjøtt eller egg. Når du ikke har anledning til å spise et måltid innen ½ time, bør du få i deg noe karbohydratrik drikke og/eller mat (fruktjuice, frukt, energibar, rosinboller, brød, rosiner) innen ½ time. De følgende mengder gir deg 100 gram karbohydrat alene: 2 energibarer, 4 bananer, 2 dl rosiner, 3 rosinboller, 4 skiver loff med syltetøy. Deretter bør du spise et blandet måltid som også gir protein (melk, egg, fisk, kylling, kjøtt) raskest mulig (innen 2 timer etter avsluttet økt). Lykke til!

110

111
Generell informasjon om resultater fra aktivitetsmonitoren SWA
Nedenfor presenteres kort forklart hva de ulike verdiene fra aktivitetsmonitoren betyr. For å få ”godkjent” resultat, og bli innlemmet i gjennomsnittsdataene, må du ha gått med monitoren i minimum 4 dager, og 95 % av tiden. NB! Også i disse dataene er det en viss grad av unøyaktighet, spesielt med tanke på om dagene du brukte monitoren var representative/typiske for deg. Forklaringer til resultatene: Øverst på "InnerView report-arket" står det blant annet skrevet inn din høyde og vekt. Disse verdiene kan variere med noen hundre gram eller en halv centimeter fra de verdiene som er oppgitt på det andre resultatskjemaet. Grunnen til dette er at dataprogrammet til monitoren kun takler ”hele” kilogram- og centimeter. Hvis det står oppgitt at du er høyrehendt, men egentlig er venstrehendt, så betyr ikke dette noe for målingene. Vi har justert måleperioden til ”hele” dager, dvs at om du fikk på deg minitoren på formiddagen, så er timene fram til klokka 00.00 tatt bort. Tilsvarende har vi gjort på slutten av måleperioden. I øvre del av arket står det ”Duration of View”. Står det f.eks ”4 days” her, betyr det at du har gått med monitoren 4 dager. Ved siden av står det skrevet ”Duration on-body”. Dette betyr hvor mange prosent av tiden i løpet av disse 4 dagene du har gått med monitoren. Den tiden du ikke har hatt monitoren på armen, estimerer ("tipper") monitoren hvor mye du har vært i aktivitet (og da blir vanligvis aktivitetsnivået ditt underestimert). Jo nærmere 100 % tid på "duration on-body" du har, jo mer riktige blir dermed resultatene. Om METS: 1 MET tilsvarer den energimengden du forbruker hvis du sitter, ligger, sover eller er helt i ro. Hvis du f.eks går en tur jobber du med en intensitet som er i størrelsesorden 3-5 METS. Rask løping kan f.eks gi verdier på 10-18 METS. Total Energy Expenditure: Beskriver hvor mange kilokalorier (kcal/cal) du brukte. Personer med stor
kroppsvekt scorer normalt sett høyt her, jamfør lettere personer Average METS: Beskriver gjennomsnittlig METS-verdi. Høyere tall betyr høyt aktivitetsnivå.
Under 1,4 er lavt. Over 2,0 er høyt. Sedentary: Beskriver hvor mange timer og minutter du har sittet i tilnærmet ro (< 3
METS), f.eks soving, spising, TV-titting, kontorarbeid osv Number of Steps: Beskriver hvor mange skritt du har tatt. Over 10.000 per dag er meget bra. Active Energy Expenditure: Beskriver hvor mange kcal du har brukt ved å være i aktivitet > 3 METS Moderate: Beskriver hvor mange timer og minutter du har drevet med moderat aktivitet
(3-6 METS), som f.eks å gå, hagearbeid, snekring osv Lying Down: Beskriver hvor mange timer og minutter du har ligget og slappet av i f.eks
senga eller på sofaen, inklusiv søvn Physical Activity Duration: Beskriver hvor mange timer og minutter du var fysisk aktiv > 3 METS Vigourous: Beskriver hvor mange timer og minutter du har drevet med relativt hard fysisk
aktivitet (6-9 METS), f.eks jogging, arbeid som graving, løfting osv. Sleep Duration: Beskriver hvor mange timer og minutter du har sovet (NB - gjennomsnittet blir
litt for lite, pga at siste døgn ikke taes med, se heller på enkeltdagene) Duration on-body: Beskriver timer og minutter du har hatt monitoren på armen Very Vigourous: Beskriver hvor mange timer og minutter du har drevet med meget hard fysisk
aktivitet (> 9 METS), f.eks løping og annen hard trening.