die myosin-schwerketten-verteilung im sport und bei ... · verteilung im sport und bei muskulären...
TRANSCRIPT

Die Myosin-Schwerketten- Verteilung im Sport und bei
muskulären Herz- Unterstützungssystemen.
Prof. Dr. Norbert Guldner Klinik für Herz- und thorakale
Gefäßchirurgie Universität zu Lübeck

Skeletal muscle I

Muscle fiber
1 Myofibrille
1 Myofibrille

MyosinMyofilament
Myosinhexamer („ 2 x golf club shape“)
Heavy Chain + Light Chains (@ head) 1 x essential & 1 x regulative


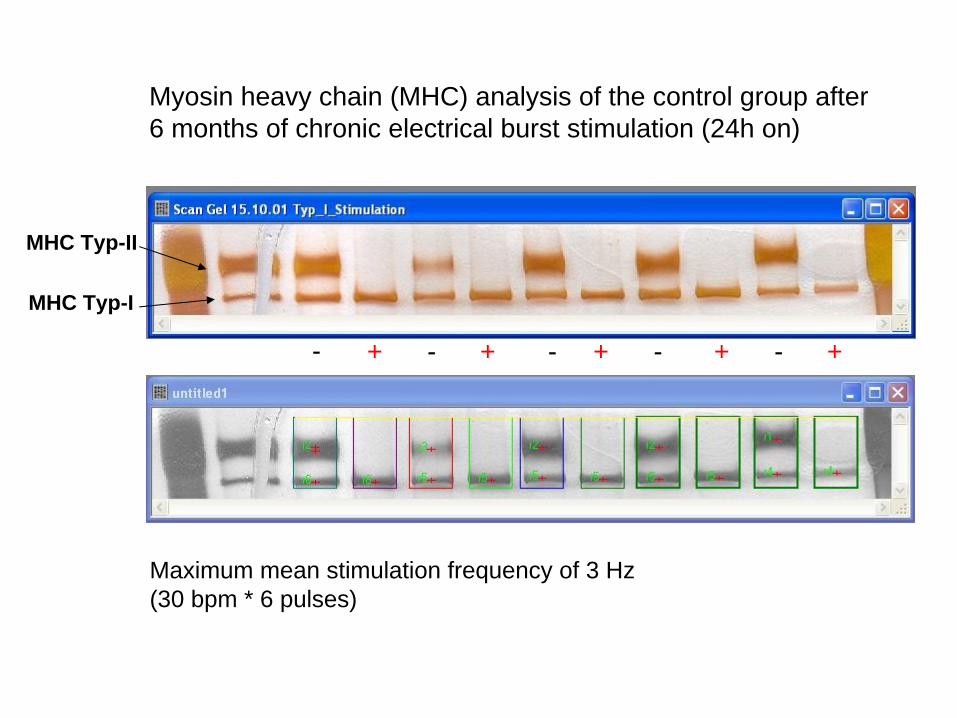
Myosin heavy chain (MHC) analysis of the control group after 6 months of chronic electrical burst stimulation (24h on)
- - - - -+ + + + +
Maximum mean stimulation frequency of 3 Hz(30 bpm * 6 pulses)
MHC Typ-II
MHC Typ-I

Force and power of an untrained and an electrically conditioned skeletal muscle
Force [N]
0
10
20
Velocity [mm/s]0 100 200 300
100
00
200
300
100 200 300 400Velocity [mm/s]
Power [W/kg]
11 weeks
electrical
conditioned
(orange marks) Musculus
tibialis
anterior
of a rabbit. From: Salmons S, Jarvis JC. The Working Capacity of Skeletal MuscleTransformed for Use in a Cardiac Assist Role. Transformed Muscle for Cardiac Assist. Chiu RCJ, Bougeois IM (eds). Future Publishing NY, 1990, p96

1. Beispiel 7 Sprinter, 6 Wochen Sprinttraining, 3-Sek-Ergometer-Sprints (S.Harrridge et al.J.Appl.Physiol.84(2):442-449, 1998)

• Beispiel 1:7-8% Kraftzunahme (Plantarflexoren) bei den 7 Sprintern (A)

Beispiel 1Vergrößerung der Faserquerschnitte

Beispiel 2. 19 Probanden mit 19-wöchigem Ergometertraining (schweres Widerstandstraining)


Beispiel 3: Probanden: 21-87 Jahre n=77, Leistungsfähigkeit (pro Faserquerschnittsfläche) nach 16 Wochen, 3-4Xpro Woche über 45 Minuten. K.J.Short et al. J Appl.Physiol.99: 95-102,2005

Isoformen schwerkettiger Myosine in Abhängigkeit
vom Alter.

Beispiel3: Änderungen der schwerkettigen Myosin-Isoformen nach 16 Wochen Ergometertraining (n=77), 3-4X pro Woche über 45 Minuten.

Biologische Therapieformen der terminalen Herzinsuffizienz
Indirekte Revaskularisation Stammzellpatch, „Girdling“
Biomechanisches Herz Herztransplantation

19
Muscle Powered Cardiac Assistance
Substitute of a failing myocardium with patients own skeletal muscle


GlandularStem CellCardio-Myopexy(GSCX)


Daily energy of a skeletal muscle ventricle after 5 months of chronic electrical burst stimulation
End stage stimulation 13 pulses/burst, 7 V, 210µs pulse width, 33Hz, 30 bpm
LV ~ 60kJ/d
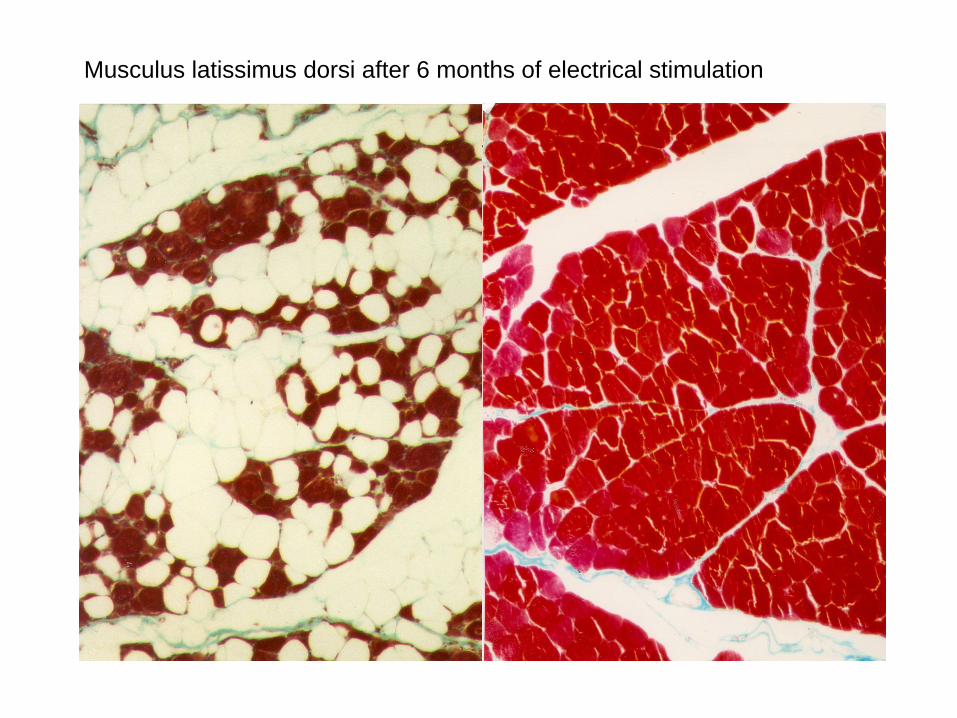
Musculus latissimus dorsi after 6 months of electrical stimulation

Ko. 0,21 0,42 1,25 2,5 5 10 SoleusMittlere Stimulationsfrequenz in Hz
Schwer-kettigeMyosinIsoformenin Prozent

Myosin heavy chain analysis (MHC) after 6 months of intermittened stimulation with a maximum mean
stimulation frequency of 0,7 Hz
- - - - -+ + + + +MHC Typ-II
MHC Typ-I

0
20
40
60
80
100
Initial Type I Initial Type II End stage Type I End Stage Type II
Control 3Hz Mean Stim. Freq.
Study Group 0,7 Hz Mean Stim. Freq.
ns
ns
p <0.001
p <0.001
Myosin heavy chain (MHC) analysis of group I and group II after 6 months of chronic electrical burst stimulation
*
*

Fluid dynamical results (1)
In the control group (n=5) with its fully transformed type I fibered muscle after 6 months of chronic electrical stimulation, stroke volumina between 10 to 15 ml could be measured. With a maximum contraction frequency of 30 beats per minute, a skeletal muscle ventricle output of 300 to 450 ml per minute is achieved in a permanent manner (mean stimulation frequency: 30bpm x 6 Pulse/Burst
3 Hz)
In group II (n=5) with 6 months of intermittened stimulation (day: 15 min on, 15 min off, night: off) and a mean stimulation frequency ~ 0,7 Hz, stroke volumina between 35 und 50 ml could be measured. At a frequency of 30 beats per minute, an output of up to 1,5 Liters was reached. Higher loading of the skeletal muscle ventricle was possible, but after 2 to 5 minutes, a reversible decline of the output to 50% and less was observed.
0
5
10
15
20
25
30
35
40
45
50
Stroke Volume[ml]
ControlStudy Group

Biomechnisches Herz mit biologischen Herzklappen


Das erste Biomechanische Herz

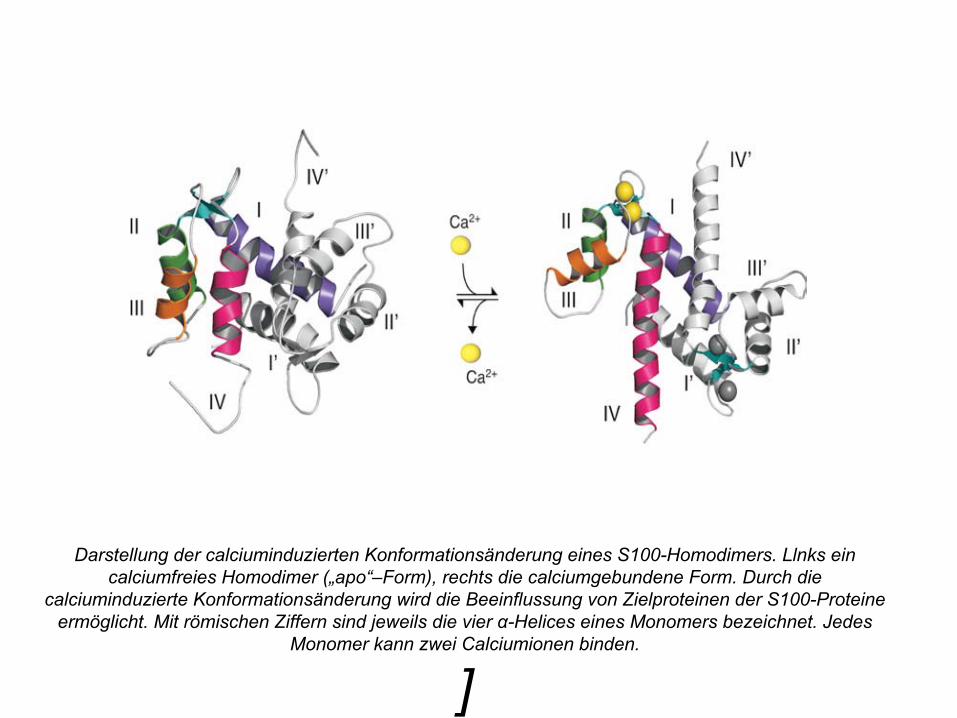
Darstellung der calciuminduzierten Konformationsänderung
eines S100-Homodimers. Llnks
ein calciumfreies Homodimer
(„apo“–Form), rechts die calciumgebundene Form. Durch die calciuminduzierte Konformationsänderung
wird die Beeinflussung von Zielproteinen der S100-Proteine ermöglicht. Mit römischen Ziffern sind jeweils die vier α-Helices
eines Monomers bezeichnet. Jedes Monomer kann zwei Calciumionen
binden.
]

Schematische Darstellung der unterschiedlichen Effekte von S100A1 innerhalb der Herzmuskelzelle. S100A1 führt über eine Bindung an den kardialen Ryanodinrezeptor (RyR2) zu einer verstärkten systolischen
Ca2+-Freisetzung aus dem sarkoplasmatischen
Retikulum
a). Die Interaktion von S100A1 mit Myofilamenten
reduziert deren Rigidität b), was zu einer gesteigerten Compliance
des Ventrikels
führt. Die Calciumsensitivität der Myofilamente
wird durch S100A1 herabgesetzt c). Dieses erlaubt eine schnellere diastolische Dissoziation des Calciums, mit der Folge einer gesteigerten
Lusitropie. S100A1 hebt die inhibitorische
Wirkung von Phospholamban
(PLB) auf die Sarkoendoplasmatische-
Retikulum-Calcium-ATPase
(SERCA) auf d), daraus resultiert eine verbesserte Calciumresequestration. Des Weiteren minimiert S100A1 die Öffnungswahrscheinlichkeit des RyR2 in der Diastole und verringert so das sarkoplasmatische
„Calciumleck“
e). In den Mitochondrien der Herzmuskelzelle wird durch S100A1 die Produktion von ATP gesteigert f).

0
100
200
300
400
500
600
700
800
-10 0 10 20 30 40 50 60 70 80
Transformationsgrad
S100
A1
[%]
Gruppe IGruppe IIRegression der Gruppen I und II
S100A1 [%] = f(TG) = 6,740 x TG + 82,85

0
10
20
30
40
50
60
0 100 200 300
S100A1 [%]
Schl
agvo
lum
en [m
l]
Gruppe IRegression der Gruppe I
SV [ml] = f(S100A1) = 0,142 x S100A1[%] + 6,61

Muskuläre Leistungsfähigkeit in Abhängigkeit vom Fasertyp und Transformationsgrad
Typ II
Typ I
Typ I Typ II
0
100
200
300
400
500
600
700
800
-10 0 10 20 30 40 50 60 70 80
Transformationsgrad
S100
A1
[%]
Gruppe IGruppe IIRegression der Gruppen I und II
0
10
20
30
40
50
60
0 100 200 300
S100A1 [%]
Schl
agvo
lum
en [m
l]
Gruppe IRegression der Gruppe I
Fasertyp