diatoms as water quality indicators: new jersey rivers and streams
TRANSCRIPT

Diatoms as Water Quality Indicators:
New Jersey Rivers and Streams
Don Charles
Patrick Center for Environmental ResearchAcademy of Natural Sciences
Philadelphia, PA

Questions / Outline
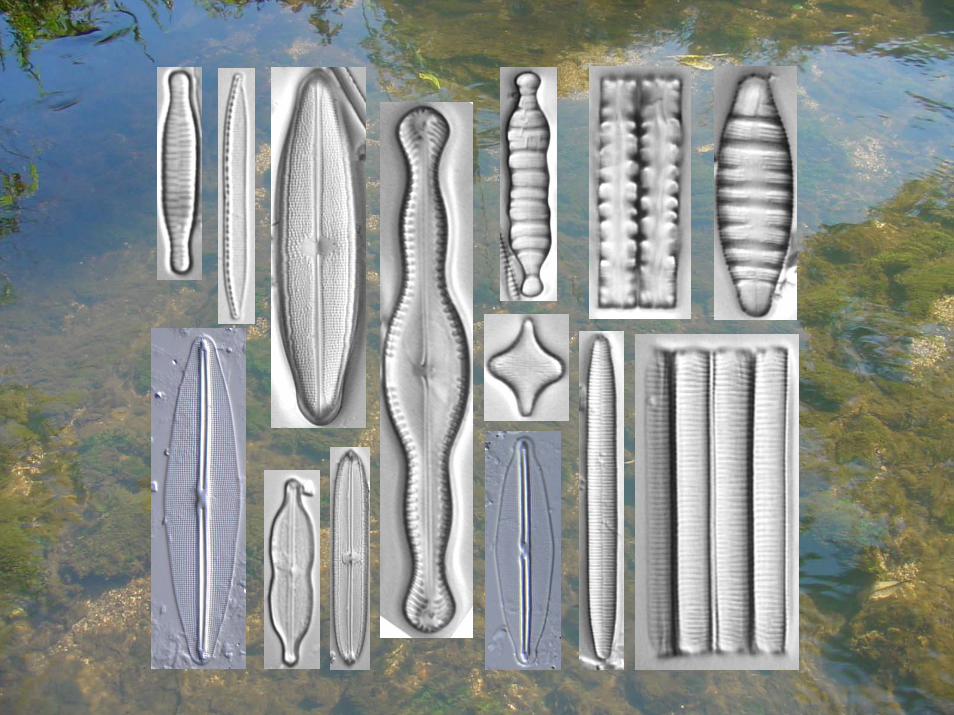
• What are diatoms? Why are they good indicators?
• How do you do the work? - field, lab, development and application of indicators
• New Jersey diatom research– Nutrient indicators
– Impairment indicators (BCG)

Diatoms
bytesizebio.net
THEACADEMY
OF NATURALSCIENCES PATRICK CENTER FOR ENVIRONMENTAL RESEARCH

THEACADEMY
OF NATURALSCIENCES PATRICK CENTER FOR ENVIRONMENTAL RESEARCH

Diatoms on Cladophora

Advantages of Diatoms as Ecological Indicators
l Important ecosystem componentsl Widely distributed in many habitatsl Siliceous remains preserve welll Identifiable to lowest taxonomic levell Many taxa / Large number of individualsl Strong correlations with environmental
characteristics / Sensitive to stressl Rapid response to change / Diagnosticl Efficient storage of representative assemblages

THEACADEMY
OF NATURALSCIENCES PATRICK CENTER FOR ENVIRONMENTAL RESEARCH
Northern NJSample substrate : rocks
KarinPonader

THEACADEMY
OF NATURALSCIENCES PATRICK CENTER FOR ENVIRONMENTAL RESEARCH
Southern New JerseySampling Substrate:Diatometer andSand / silt

Diatoms
(Morales)

THEACADEMY
OF NATURALSCIENCES PATRICK CENTER FOR ENVIRONMENTAL RESEARCH
“Tabulator” program for entering diatom counts and documentation information

North American Diatom Ecological Database - NADED Phycology Section, Patrick Center For Environmental Research - ANSP Diatom Count Report Water Body: Assumpink Creek Site Location ID: NJAN0118 Sample Label: NJ_118_1 Sample ID: NJ000009 Client Sample ID: AN0118 Date Sample Collected: 10/3/00 Count Finished: 3/6/01 Subsample ID: DT1 Slide Replicate ID: l Count Replicate ID: 1 Counted by: Karin C Ponader (KCP) Sample Type: Master NADED Number Taxon Name Percent Count 2015 Achnanthes lanceolata (Bréb. in Kütz.) Grun. 0.83 5 2224 Achnanthes lanceolata subsp. frequentissima Lange-Bert. 1.67 10 2026 Achnanthes pusilla (Grun.) DeT. 0.67 4 2132 Achnanthes subhudsonis var. kraeuselii Choln. 3.33 20 12001 Caloneis bacillum (Grun.) Cl. 1.17 7 20012 Cyclotella pseudostelligera Hust. 0.33 2 37197 Gomphonema kobayasii Kociolek & Kingston 29.50 177 37010 Gomphonema parvulum (Kütz.) Kütz. 1.00 6 130001 Luticola goeppertiana (Bleisch in Rabh.) Mann 7.50 45 44073 Melosira varians Ag. 0.17 1 46421 Navicula agrestis Hust. 0.17 1 46003 Navicula arvensis Hust. 0.33 2 46661 Navicula capitatoradiata Germain 0.17 1 46023 Navicula gregaria Donk. 8.00 48 46039 Navicula minima Grun. 19.00 114 46649 Navicula recens Lange-Bert. 0.33 2 46562 Navicula subminuscula Mang. 0.67 4 46400 Navicula symmetrica Patr. 0.33 2 48347 Nitzschia acidoclinata Lange-Bert. 0.50 3 48004 Nitzschia amphibia Grun. 3.83 23 48025 Nitzschia palea (Kütz.) W. Sm. 2.50 15 186008 Psammothidium subatomoides Hüst.) Bukht. et Round 1.17 7 57001 Rhoicosphenia curvata (Kütz.) Grun. ex Rabh. 0.67 4 170014 Sellaphora seminulum (Grun.) Mann 14.17 85 66053 Synedra delicatissima var. angustissima Grun. 0.67 4 66018 Synedra rumpens var. familiaris (Kütz.) Hust. 1.33 8 Report Date: 4/9/01 Total Number of Taxa: 26 Total Number Counted: 600
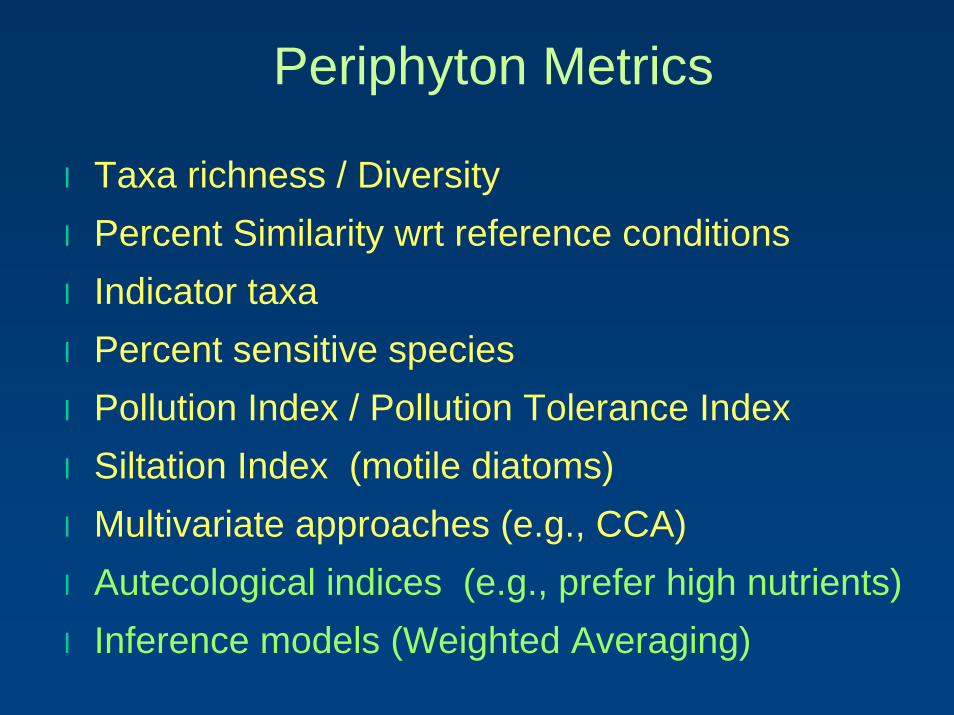
Periphyton Metrics
l Taxa richness / Diversityl Percent Similarity wrt reference conditionsl Indicator taxal Percent sensitive speciesl Pollution Index / Pollution Tolerance Indexl Siltation Index (motile diatoms)l Multivariate approaches (e.g., CCA)l Autecological indices (e.g., prefer high nutrients)l Inference models (Weighted Averaging)
THEACADEMY
OF NATURALSCIENCES PATRICK CENTER FOR ENVIRONMENTAL RESEARCH
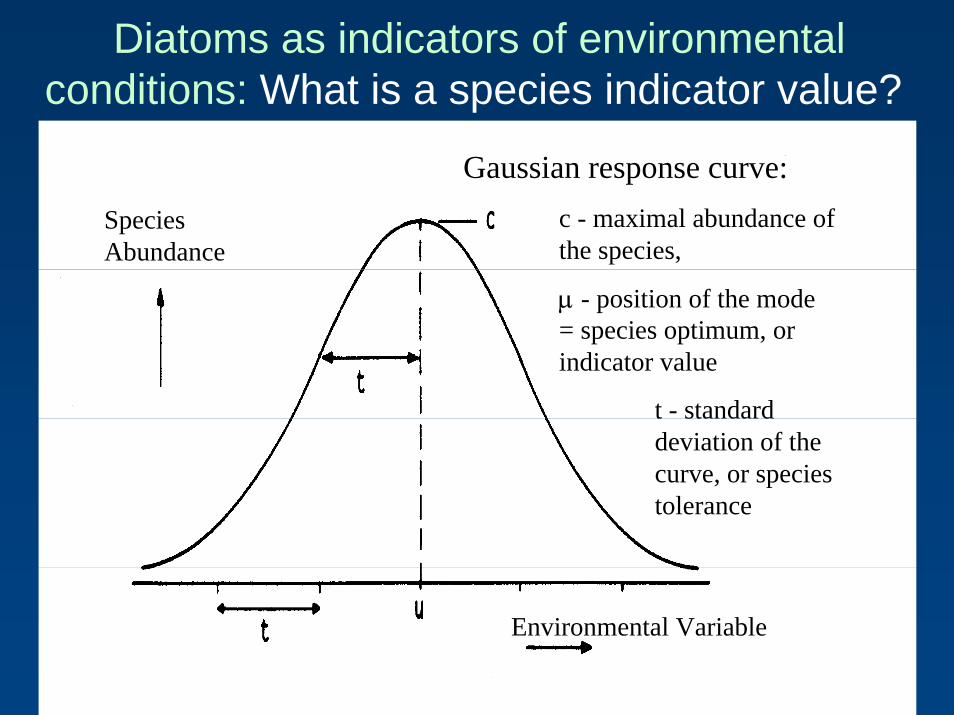
Diatoms as indicators of environmental conditions: What is a species indicator value?
Species Abundance
Environmental Variable
Gaussian response curve:c - maximal abundance of the species,
µ - position of the mode = species optimum, or indicator value
t - standard deviation of the curve, or species tolerance
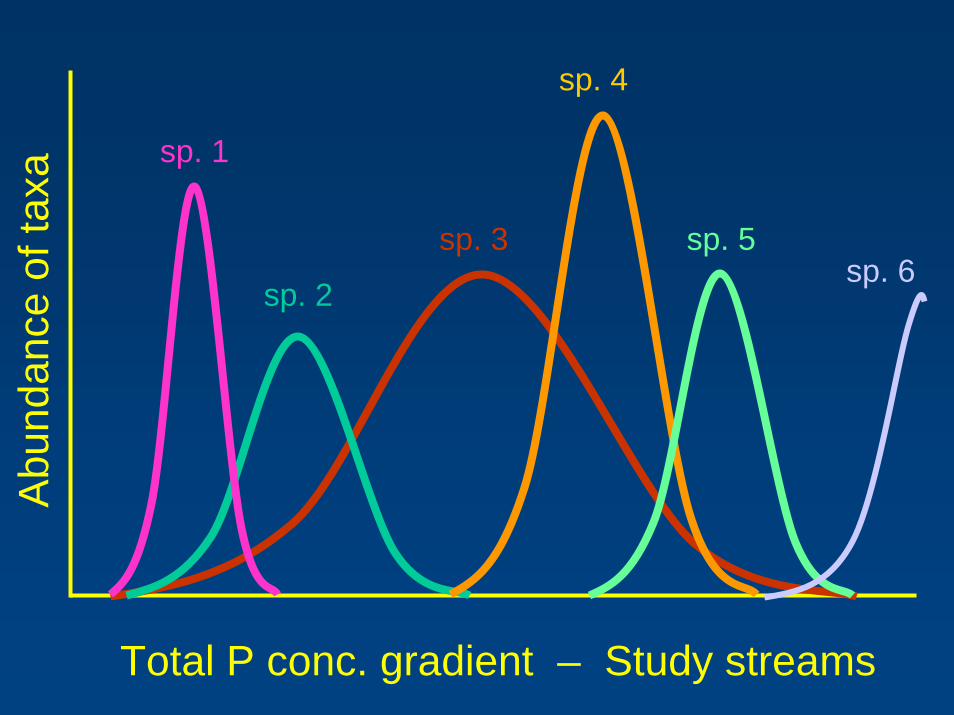
sp. 4
sp. 1
Abu
ndan
ce o
f tax
a
sp. 2
sp. 3 sp. 5sp. 6
Total P conc. gradient – Study streams

THEACADEMY
OF NATURALSCIENCES PATRICK CENTER FOR ENVIRONMENTAL RESEARCH
Ruth Patrick

Diatom Sample Sites – ANSP Database
Projects
USGS National Water Quality Assessment (NAWQA)States: DE, ID, ME, MD, MT, NM, NY, NJ, VAANSP River studies (R. Patrick)
Not shown
EPANational LakeAssessment
National River andStreamAssessment

ANSP Diatom Study Sitesin and near the Chesapeake Watershed
April 2009

THEACADEMY
OF NATURALSCIENCES PATRICK CENTER FOR ENVIRONMENTAL RESEARCH
Development ofDevelopment ofan Algae Indicator an Algae Indicator
Monitoring Program for Monitoring Program for New Jersey StreamsNew Jersey Streams
Nutrient indicatorsNutrient indicators
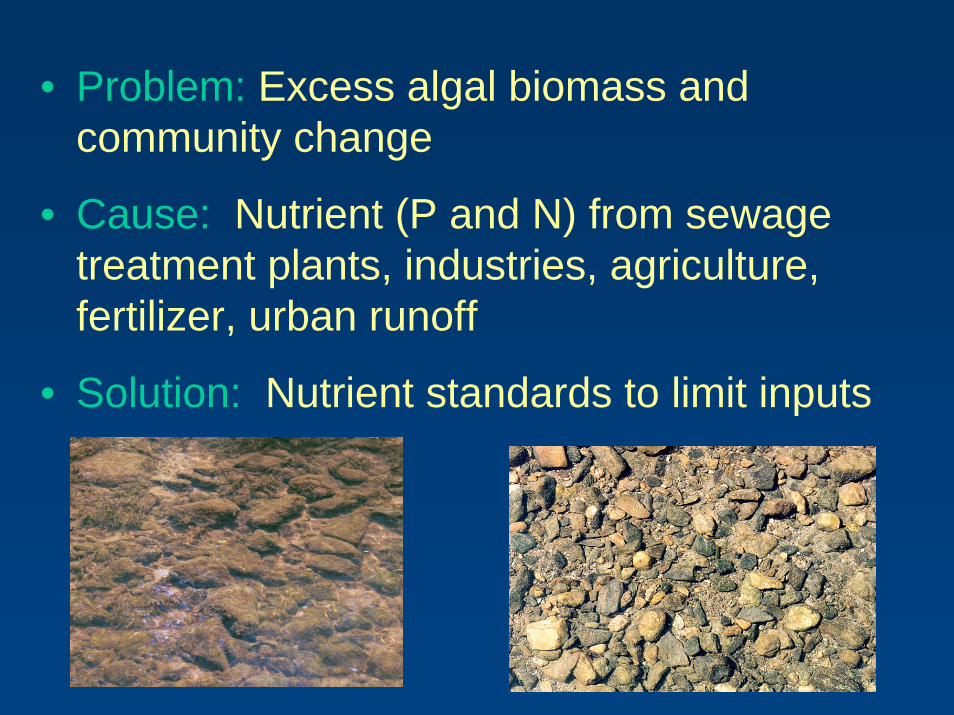
• Problem: Excess algal biomass and community change
• Cause: Nutrient (P and N) from sewage treatment plants, industries, agriculture, fertilizer, urban runoff
• Solution: Nutrient standards to limit inputs
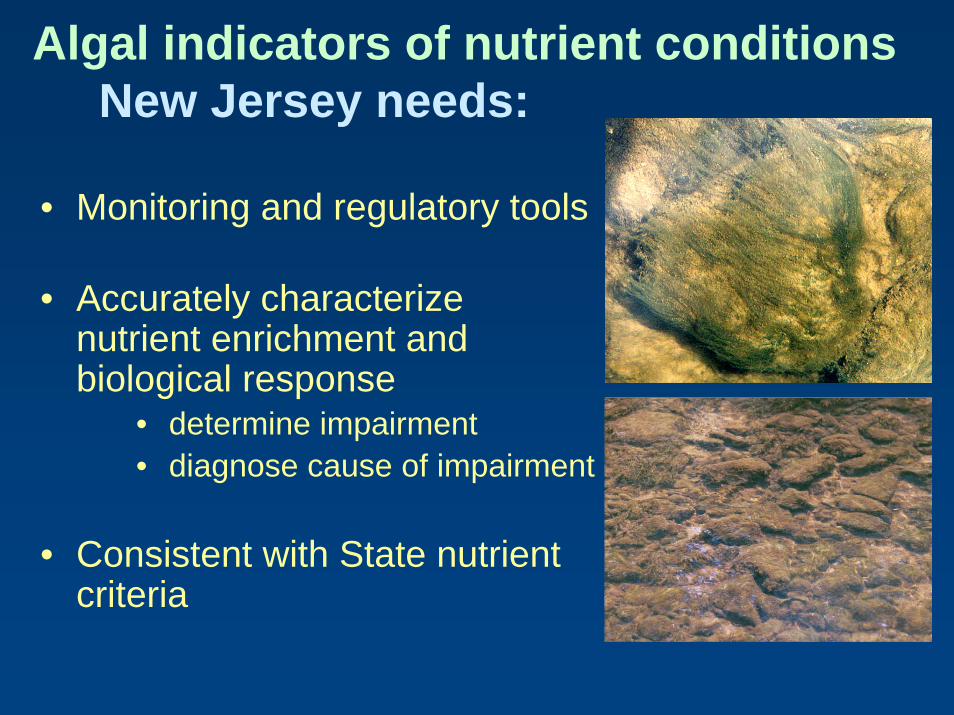
Algal indicators of nutrient conditionsNew Jersey needs:
• Monitoring and regulatory tools
• Accurately characterize nutrient enrichment and biological response
• determine impairment• diagnose cause of impairment
• Consistent with State nutrient criteria

THEACADEMY
OF NATURALSCIENCES PATRICK CENTER FOR ENVIRONMENTAL RESEARCH
Study sites2000 – 2004
Piedmont 28 Ridge & Val. 5Highlands 12Coastal Plain 34
Total:79 streams,
13 resampled

THEACADEMY
OF NATURALSCIENCES PATRICK CENTER FOR ENVIRONMENTAL RESEARCH

THEACADEMY
OF NATURALSCIENCES PATRICK CENTER FOR ENVIRONMENTAL RESEARCH

Field sampling
• Width, depth, velocity range• Substrate, canopy cover• Nutrients – several forms of N and P• Composite algal sample for chl a,
AFDM, and filamentous algae taxa• Composite sample for diatom analysis• Visual estimate of algal abundance
along transects

THEACADEMY
OF NATURALSCIENCES PATRICK CENTER FOR ENVIRONMENTAL RESEARCH
Studyarea
45 sites
101 samples

THEACADEMY
OF NATURALSCIENCES PATRICK CENTER FOR ENVIRONMENTAL RESEARCH
25-75 µg
75-100 µg
<25 µg
>100 µgNorthern NJTP WA-PLS model

THEACADEMY
OF NATURALSCIENCES PATRICK CENTER FOR ENVIRONMENTAL RESEARCH
NorthernNew Jersey
< 25 µg/L > 100 µg/L

Relationship between total phosphorus and diatom taxa composition is stronger than with chlorophyll a
Total Phosphorus (µg/L) log0.5 1.0 1.5 2.0 2.5 3.0
Chl
a (m
g/m
2 ) lo
g
0.0
0.5
1.0
1.5
2.0
2.5
3.0

New Jersey Diatom TALU
Using the Biological Condition Gradient Approach
Patrick Center for Environmental Research, Academy of Natural Sciences of Philadelphia
New Jersey Department of Environmental ProtectionTrenton, NJ

The Biological Condition Gradient – ConceptB
iolo
gic a
l Co n
d iti o
n
Increasing Effect of Human Activity
Natural structure & function of biotic community maintained
Minimal changes in structure & function
Evident changes in structure and minimal changes in function
Moderate changes in structure & minimal changes in function
Major changes in structure & moderate changes in function
Severe changes in structure & function
1122
33
44
55
66
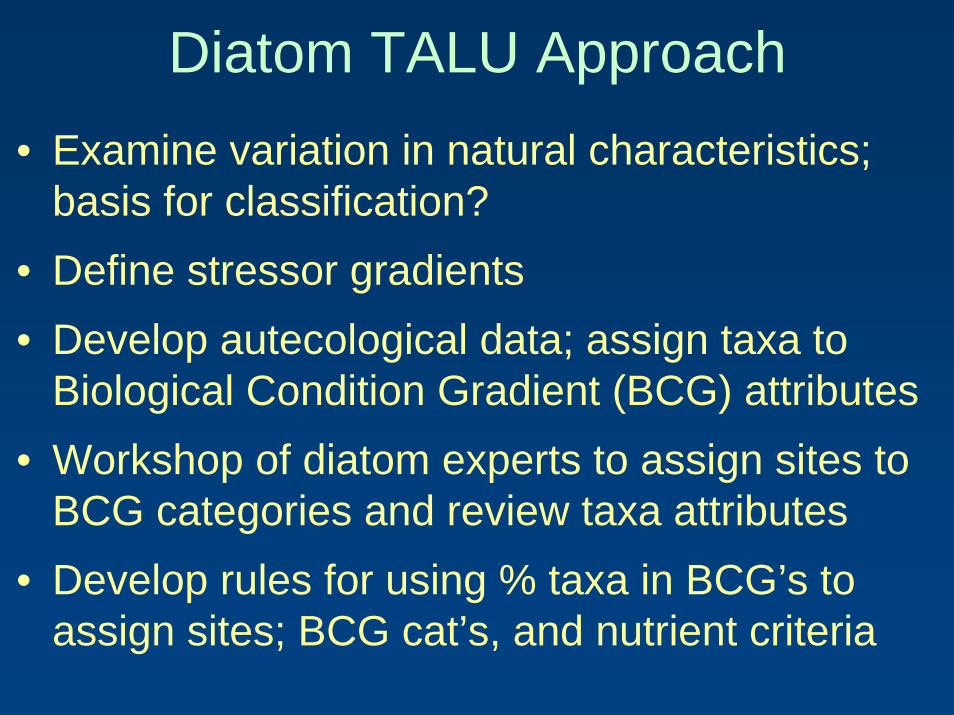
Diatom TALU Approach• Examine variation in natural characteristics;
basis for classification?• Define stressor gradients • Develop autecological data; assign taxa to
Biological Condition Gradient (BCG) attributes• Workshop of diatom experts to assign sites to
BCG categories and review taxa attributes• Develop rules for using % taxa in BCG’s to
assign sites; BCG cat’s, and nutrient criteria

THEACADEMY
OF NATURALSCIENCES PATRICK CENTER FOR ENVIRONMENTAL RESEARCH
Study sites2000 – 2004
Piedmont 28 Ridge & Val. 5Highlands 12Coastal Plain 34
Total:79 streams,
13 resampled

Lat
Long
pH-F Alk
WidthBasin km
Boulder
Bedrock
Cobble
Gravel
Sand
Silt-Cl
PCA AMNET 7 NatChars data not trans 27June09
Axis 1
Axi
s 2
EcoregionHighlandsPiedmontRidge-ValleyCoastal Plain
Classification of sites
Natural characteristics

THEACADEMY
OF NATURALSCIENCES PATRICK CENTER FOR ENVIRONMENTAL RESEARCH
For_wl%
Urb%
Ag%
BnkVegP
RipVegWi
Cl_NWISDO_mgl
TempNWIS
0
0
40 80
40
80
Axis 1
Axi
s 2
EcoregionRidge - ValleyPiedmontN. HighlandsCoastal Plain
PCA-StressorsLand-usePhysical habitatWater Chemistry

Bio
logi
cal
Con
ditio
n
1 Native or natural condition
2Minimal loss of species; some density changes may occur
3Some replacement of sensitive-rare species; functions fully maintained
4
Some sensitive species maintained but notable replacement by more tolerant taxa; altered distributions; functions largely maintained
5
6
Tolerant species show increasing dominance; sensitive species are rare; functions altered Severe alteration of
structure and function
Natural
Degraded
Stressor GradientLow High

0
0.0
4 8
1.0
2.0
NJ TALU taxa vs stressors - 140 diatom samples
PCA Str
PLc
onsp
i
lvl_3_ec58646784
Placoneis conspicua
PCA Stressor Score
Tolerant

0
0.0
40 80
1.0
2.0
NJ TALU taxa vs stressors - 140 diatom samples
Urb%
NA
min
ima
lvl_3_ec58646784
Navicula minima
Percent Urban Land-Use
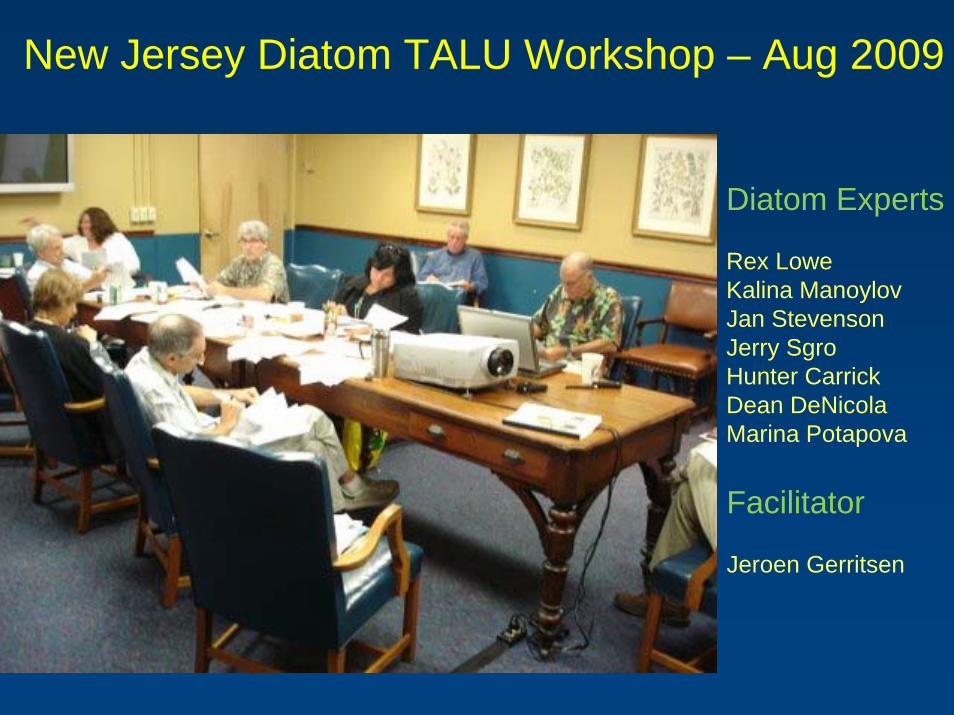
New Jersey Diatom TALU Workshop – Aug 2009
Diatom Experts
Rex LoweKalina ManoylovJan StevensonJerry SgroHunter CarrickDean DeNicolaMarina Potapova
Facilitator
Jeroen Gerritsen

THEACADEMY
OF NATURALSCIENCES PATRICK CENTER FOR ENVIRONMENTAL RESEARCH
ContributorsANSP NJ DEP and others
• Tom Belton• Tom Varnum• Kevin Berry• John Kennon• Bob Limbeck
• Karin Ponader• Diane Winter• Marina Potapova• David Velinsky• Andrew Tuccillo

From PEARL Website, Queen’s Univ.

THEACADEMY
OF NATURALSCIENCES PATRICK CENTER FOR ENVIRONMENTAL RESEARCH
Research funded by the NJ Research funded by the NJ Department of Environmental Department of Environmental
Protection (NJ DEP)Protection (NJ DEP)Many thanks to Tom Belton and other NJ DEP Many thanks to Tom Belton and other NJ DEP staff and PCER staff Josh Collins, Dan Mellott, staff and PCER staff Josh Collins, Dan Mellott, Erin Hagan, Mike Hoffmann, Eduardo Morales, Erin Hagan, Mike Hoffmann, Eduardo Morales,
Marina Potapova, Kathleen Sprouffske and Diane Marina Potapova, Kathleen Sprouffske and Diane Winter, Andrew Tuccillo, and many others.Winter, Andrew Tuccillo, and many others.
Acknowledgements:Acknowledgements:

THEACADEMY
OF NATURALSCIENCES PATRICK CENTER FOR ENVIRONMENTAL RESEARCH
End