diamond power infrastructure ltd detailed...
TRANSCRIPT

1
Oct 30th, 2010
Stock Data
Sector Capital Goods
Face Value(Rs) 10.00
52 wk. High/Low (Rs.) 264.20/113.40
Volume (2 wk. Avg.) 74000
BSE Code 522163
Market Cap(Rs in Mn) 6600.42
Financials (Rs.in.mn) FY10 FY11E FY12E
Net Sales 8476.60 13562.56 17631.33
EBIDTA 1182.84 1918.36 2353.80
PAT 615.26 1094.24 1374.19
EPS 21.92 38.99 48.97
P/E 10.73 6.03 4.80
Diamond Power Infrastructure Ltd BUY F
I
R
S
T
C
A
L
L
R
E
S
E
A
R
C
H
SYNOPSIS
Formerly known as Diamond Cables Limited, Diamond Power Infrastructure Ltd. was founded in 1970. The company began its journey, by setting up a small, ACSR conductor manufacturing facility in Vadodara, Central Gujarat.
Over the years, through focused growth, it has emerged as India’s largest and only integrated manufacturer of Power Transmission equipment and turnkey services provider (EPC).
Diamond Power Infrastructure, India's most diversified power transmission and Distribution Company has entered into an agreement with Skoda (India) and Schaltech Automation for execution of contracts in the power transmission distribution business upto 400 KV.
Approved Preferential Allotment of 44,160 Equity Shares to Kotak Investment Advisors Ltd. and Preferential Allotment 8,39,057 Equity Shares to Kotak India Private Equity Fund.
Net Sales and PAT of the company are
expected to grow at a CAGR of 36% and
35% over 2009 to 2012E respectively.
1 Year Comparative Graph
Diamond Power Infra Ltd BSE SENSEX
V.S.R. Sastry
Equity Research Desk
Dr. V.V.L.N. Sastry Ph.D.
Chief Research Officer
C.M.P: Target Price: Rs.235.20 Rs.270.00
Share Holding Pattern

2
Peer Group Comparison
Name of the company CMP(Rs.)
Market Cap.(Rs.Mn.) EPS(Rs.) P/E(x) P/BV(x) Dividend (%)
Diamond Power Infra 235.20 6600.42 21.92 10.73 2.34 10.00
Havells India 413.85 49801.40 19.19 21.57 4.39 75.00
Finolex Cables 58.65 8969.90 3.19 18.39 1.39 30.00
KEI Inds 35.10 2244.20 1.96 17.91 1.02 10.00
Investment Highlights
Q1 FY11 Results Update
Diamond Power Infrastructure Ltd disclosed results for the quarter ended
September 2010. Net sales for the quarter moved up 103% to Rs.3500.68 million
as compared to Rs.1726.42 million during the corresponding quarter last year.
During the quarter, the company Net Profit is increased of Rs. 277.58 million from
Rs.113.45 million in previous year same quarter. The Basic EPS of the company
stood at Rs. 7.46 for the quarter ended September 2010.
Quarterly Results – Standalone(Rs in mn)
As At Sep-10 Sep-09 %Change
Net sales 3500.68 1726.42 103%
PAT 277.58 113.45 145%
Basic EPS 7.46 5.39 38%
Equity Capital 372.06 210.47

3
Basic EPS of the company stood at Rs. 7.46

4
Break up of Expenditure
Expenditure for the quarter stood at Rs.3004.56mn, which is around 121%
higher than the corresponding period of the previous year. Raw material cost of
the company for the quarter accounts for 74% of the sales of the company and
stood at Rs.2829.52mn from Rs.1413.69mn of the corresponding period of the
previous year. Other Expenditure cost increased 45%YoY to Rs.67.32mn from
Rs.46.57mn and accounts for 2% of the revenue of the company for the quarter.
OPM and NPM for the quarter stood at 15% and 8% respectively from 14% and 7%
respectively of the same period of the last year.

5
Diamond Power Enters into an agreement with Skoda
Diamond Power Infrastructure, India's most diversified power transmission and
Distribution Company has entered into an agreement with Skoda (India) and
Schaltech Automation for execution of contracts in the power transmission
distribution business upto 400 KV.
Commencement of Trial Production
Diamond Power Infrastructure Ltd (DPIL), India's most diversified power
transmission and distribution (T&D) Company is pleased to announce the
commencement of Trial Production Ta Salvi Dist Vadodra the plant, which has been
set up at a cost of Rs 40 Cr. is capable of manufacturing all types of towers with a
capacity of 48,000 Mt. per annum.
Board recommends Dividend
Subject to the approval of the shareholders, the Board of Directors has
recommended 15% dividend to the all shareholders.
Preferential Allotment
Approved Preferential Allotment of 44,160 Equity Shares to Kotak Investment
Advisors Ltd. and Preferential Allotment 8,39,057 Equity Shares to Kotak India
Private Equity Fund.

6
Company Profile
Formerly known as Diamond Cables Limited, Diamond Power Infrastructure Ltd. was
founded in 1970. The company began its journey, by setting up a small, ACSR
conductor manufacturing facility in Vadodara, Central Gujarat. Over the years,
through focused growth, it has emerged as India’s largest and only integrated
manufacturer of Power Transmission equipment and turnkey services provider (EPC).
In another revolutionary innovation, Diamond introduced the Aerial Bunched Cables
(ABC), a combination of
Aluminum Conductors
Polyethelene Insulated Conductors
Alloy Conductors
This product was regarded by many to be a boon for a developing country like India
The expertise in the process of ‘Alloying’ enabled us to become the first conductor
manufacturer in Asia to have founded its own Alloy Rod Mill.
Existing Capacities Per Annum
Conductors : Aluminium and Alloy Rods - 32,000 MT
Conductors-Aluminium-Alloy, ACSR and All Aluminium - 50,500 MT
Cables : LT XLPE and PVC Cables up to 1.1KV -5500 Kms LT Speicality Cables up to 1.1KV - 3500 Kms
Power Cables : High Tension Power Cables up to 132KV - 2500 Kms LT Speicality Cables up to 1.1KV - 3500 Kms
Wires : Wires and Flexibles - 1,00,000 Kms
Power Transformers : 40MVA to 315MVA, up to 220KV - 7500MVA 5MVA to 40MVA, up to 220KV - 2500MVA
Distribution Transformers : 1KV to 5MVA, up to 33KV - 5000MVA

7
Business Groups
The Business of Power Cables
In a bid to extend it Conductors Business, the company set up a small LT power
cables manufacturing facility at Vadadala, Gujarat in 1994. The capacity of this
facility has grown in small phases and by 2006 it was 5500 Kms per annum. In 2007
the company took a major leap by setting up a 132KV HT Cables plant with a capacity
of 2800 Kms per annum and a large LT Cables Plant with a capacity over 15,000 Kms.
The company is now regarded as one of the top five power cables manufacturers in
India. Its manufacturing facility is supplied by premier international equipment
providers like SCHOLZ, TOURISTER and NOKIA- MAILLEFER. Top equipment
providers in India like SUPERMAC etc. This support goes a long way in making our
facility a world-class facility.
‘DICABS’ is the brand name for Diamond Power Cables and they are preferred by a
spectrum of utilities like Refineries, Cement Plants, Power Plants, Engineering
Industries, Pharmaceutical units among several others and are also sold through a
large dealer network
Conductors
The conductors business of Diamond Power Infrastructure Ltd. was founded in
Vadodara, Gujarat, in 1970. Through its 37 year old journey the Diamond conductor’s
business has become India’s second largest, with an installed capacity of over 50,500
MT. Diamond Power Infrastructure Ltd. now has two manufacturing facilities, one in
Savli, Gujarat and the second at Silvasa, in the Union Territory of Dadra and Nagar
Haveli. The company manufactures a range of conductors including 7 Strand to 90
Strand and from 11KV to HVDC lines

8
Transformer
The Transformers Business Group offers the clients end-to-end power solutions. Two
power transformer leaders, namely, APEX Electricals Ltd. and Diamond Power
Transformers Ltd (Formerly Western Transformers) are a part of this Group.
APEX and Diamond Power Transformers have more than four decades of experience in
the transformer industry before they became the company’s subsidiaries. They have
successfully manufactured and type tested transformers of ratings starting from 10KV
to 315MVA, right up to those of the 220KV class.
EPC - Trunkey Projects
The Power of Integration
Diamond Power Infrastructure Ltd. is the one-stop-shop for a range of end-to-end
power solutions.The company comprehensive portfolio of products are designed,
developed, and manufactured indigenously at state-of-the-art facilities. The extensive
range of products includes, but is not limited to, power cables, high strength alloy
conductors, HT/LT cables and wires, and integrated units for highly reliable power
and distribution transformers
Turnkey Products
Substation Projects
Rural and Urban Distribution Projects

9
Financials Results
12 Months Ended Profit & Loss Account (Standalone)
Value(Rs.in million) FY09A FY10A FY11E FY12E
12m 12m 12m 12m
Description
Net Sales 6979.04 8476.6 13562.56 17631.33
Other Income 16.95 13.07 19.61 26.47
Total Income 6995.99 8489.67 13582.17 17657.79
Expenditure -6082.12 -7306.83 -11663.8 -15303.99
Operating Profit 913.87 1182.84 1918.36 2353.8
Interest -221.72 -248.88 -279.53 -301.89
Gross Profit 692.15 933.96 1638.83 2051.91
Depreciation -50.87 -72.72 -75.63 -83.19
Profit before Tax 641.28 861.24 1563.2 1968.72
Tax -76.63 -245.98 -468.96 -594.55
Profit after Tax 564.65 615.26 1094.24 1374.16
Extraoridnary Items -0.18 -0.08 0 0
Net Profit 564.47 615.18 1094.24 1374.16
Equity Capital 210.47 280.63 280.63 280.63
Reserves 1925.6 2540.78 3635.02 5009.19
Face Value(Rs.) 10 10 10 10
EPS 26.83 21.92 38.99 48.97
*A=Actual, *E=Estimated

10
Quarterly Ended Profit & Loss Account (Standalone)
Value(Rs.in million) 31-Mar-10 30-Jun-10 30-Sep-10 30-Dec-10
3m(A) 3m(A) 3m(A) 3m(E)
Description
Net Sales 2952.73 3816.07 3500.68 3850.75
Other Income 6.32 8.95 2.91 3.2
Total Income 2959.05 3825.02 3503.59 3853.95
Expenditure -2565.38 -3270.16 -3004.56 -3311.64
Operating Profit 393.67 554.86 499.03 542.31
Interest -72.33 -71.85 -63.18 -66.97
Gross Profit 321.34 483.01 435.85 475.33
Depreciation -31.27 -15.43 -13.23 -13.89
Profit before Tax 290.07 467.58 422.62 461.44
Tax -66.68 -155.33 -145.04 -147.66
Profit after Tax 223.39 312.25 277.58 313.78
Extraoridnary Items -0.08 0 0 0
Net Profit 223.31 312.25 277.58 313.78
Equity Capital 280.63 280.63 372.06 372.06
Face Value(Rs.) 10 10 10 10
EPS 7.96 11.13 7.46 8.43
*A=Actual, *E=Estimated

11
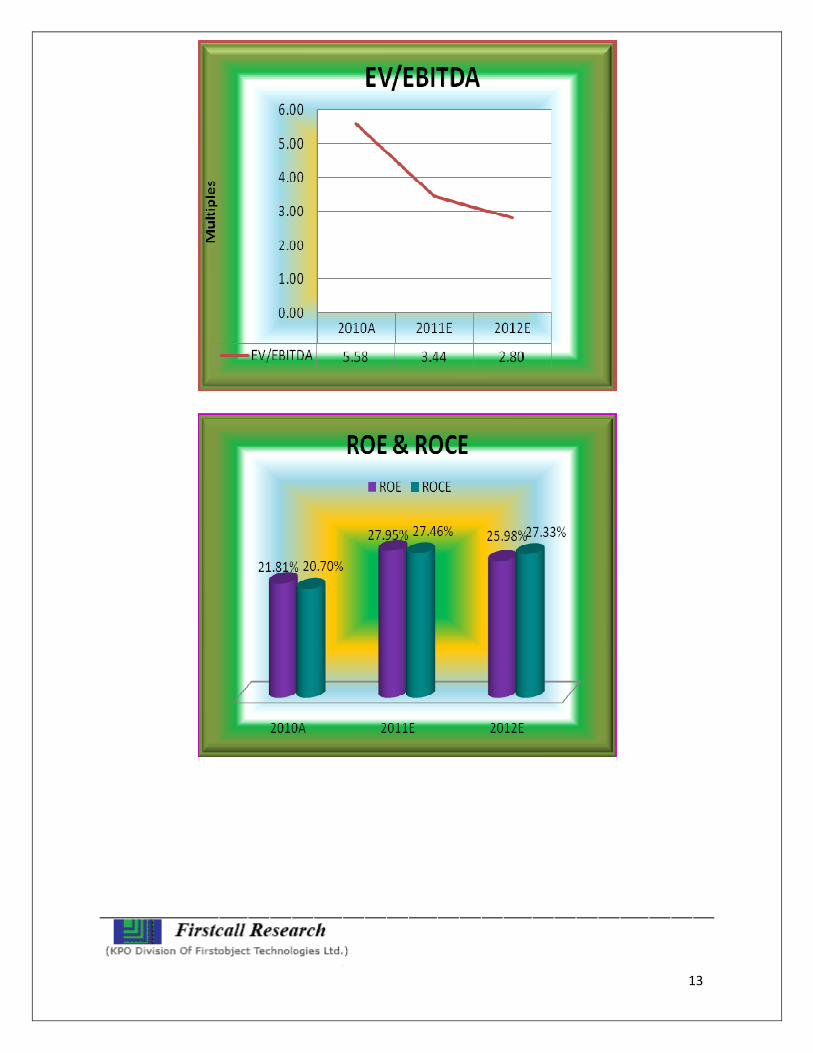
Key Ratios
Particulars FY09 FY10 FY11E FY12E
EPS (Rs.) 26.83 21.92 38.99 48.97
EBITDA Margin (%) 13.09% 13.95% 14.14% 13.35%
PAT Margin (%) 8.09% 7.26% 8.07% 7.79%
P/E Ratio (x) 7.19 10.73 6.03 4.8
ROE (%) 26.43% 21.81% 27.95% 25.98%
ROCE (%) 19.41% 20.70% 27.46% 27.33%
EV/EBITDA (x) 4.44 5.58 3.44 2.8
Debt-Equity Ratio 1.08 0.9 0.71 0.57
Book Value (Rs.) 101.49 100.54 139.53 188.5
P/BV 1.9 2.34 1.69 1.25
Charts:

12
13

14
Outlook and Conclusion
At the current market price of Rs.235.20, the stock is trading at 6.03 x FY11E
and 4.80 x FY12E respectively.
Price to Book Value of the stock is expected to be at 1.69 x and 1.25 x respectively for FY11E and FY12E.
Earning per share (EPS) of the company for the earnings for FY11E and FY12E is seen at Rs.38.99 and Rs.48.97 respectively.
Net Sales and PAT of the company are expected to grow at a CAGR of 36% and 35% over 2009 to 2012E respectively.
Diamond Power Infrastructure, India's most diversified power transmission and Distribution Company has entered into an agreement with Skoda (India) and Schaltech Automation for execution of contracts in the power transmission distribution business upto 400 KV.
Approved Preferential Allotment of 44,160 Equity Shares to Kotak Investment Advisors Ltd. and Preferential Allotment 8,39,057 Equity Shares to Kotak India Private Equity Fund.

15
Diamond Power Infrastructure Ltd (DPIL), India's most diversified power transmission and distribution (T&D) Company is pleased to announce the commencement of Trial Production Ta Salvi Dist Vadodra the plant, which has been set up at a cost of Rs 40 Cr. is capable of manufacturing all types of towers with a capacity of 48,000 Mt. per annum.
On the basis of EV/EBITDA, the stock trades at 3.44 x for FY11E and 2.80 x for FY12E.
DPIL pioneered introduction of Alloy aluminum Conductors and captive manufacturing of rods in India. The Company combines the expertise of electrical engineering technology (core business) and metallurgical and mechanical engineering manufacturing process, developed over the past 38 years. DPIL has excellent long standing supplier and customer relationships, vital to any business growth. The Companies Promoters having 40 years of Domain Experience in the Field of T&D EPC. We expect that the company will keep its growth story in the coming quarters also. We recommend ‘BUY’ in this particular scrip with a target price of Rs.270.00 for Medium to Long term investment.
Industry Overview
Engineering Sector : Market & Opportunities
Engineering sector
Heavy Engineering Light
engineering
Transport
equipment
Capital
goods
Other
machinery/
equipment

16
India's engineering industry is highly competitive with a number of players in each
segment. The engineering sector has been growing, driven by growth in end user
industries and the new projects being taken up in the power, railways, infrastructure
development, and private sector investments fields amongst others. The industry
attracted FDI inflows of US$ 1,196.7 million from August 1991-July 2006
India's exports of engineering goods are valued at US$ 27 billion during 2006-07
which represents a 6 per cent growth over the exports for 2005-06 (US$ 20 billion).
The engineering sector accounted for 14 per cent of the country's total exports. It is
also noteworthy that 40 per cent of India's engineering export is from the small and
medium enterprises (SME) sector. According to Engineering Exports Promotion
Council (EEPC), engineering exports could touch US$ 30 billion by 2008-09. In such a
scenario, India, driven by the engineering sector, will emerge as a key global
manufacturing hub
Industry demand is driven by investments in core sectors
The demand from this sector depends largely on GDP growth, which in turn is a
function of expenditure in core segments like power, railways, and infrastructure
development, private sector investments, and the speed at which projects are
implemented. The power sector is the largest contributor to the revenues of
engineering companies. Engineering majors like Bharat Heavy Electricals Limited
(BHEL) and ABB Limited derive a significant chunk of their revenues (69 per cent and
60 per cent, respectively) through the supply of equipment to the power sector.
Low-tech items
like castings,
forgings and
Highly sophisticated
Microprocessor-based
Process control
equipment, diagnostic

17
Infrastructure is another key area of operation. Larsen & Toubro Limited, for example,
garners around 35 per cent of itssales from infrastructure activities like engineering,
design and construction of industrial projects, social and physical projects like
housing, hospitals, information technology (IT) parks, expressways, bridges, ports, and
water/effluent treatment projects. The industrial segment contributes to around 30
per cent of the total revenues of the engineering sector. While India’s engineering
industry has capabilities in manufacturing the range of machinery required by the
different user sectors, the rapid rise in demand has led to a large part of the
machinery requirements being met through imports. This indicates the size of
opportunity for investment in the engineering and capital goods sector in India. The
engineering industry has attracted FDI inflows of US$ 1,196.73 million from August
1991-July 2006.
Indian Engineering goods are gaining acceptance in overseas markets
India’s exports of engineering goods are valued at US$ 27 billion during 2006-07
which represents a 36 per cent growth over the exports for 2005-06 US$ 20 billion).
The engineering sector accounted for 14 per cent of the country’s total exports. It is
also noteworthy that 40 per cent of India’s engineering export is from the small and
medium enterprises (SME) sector. A key driver for increased engineering exports is the
trend towards shifting of global manufacturing bases to countries like India that offer
lower costs and good engineering talent. This trend is expected to continue and boost
exports of engineering goods from India over the next 5 years. According to
Engineering Exports Promotion Council (EEPC), engineering exports could touch US$
30 billion by 2008-09. In such a scenario, India, driven by the engineering sector, will
emerge as a key global manufacturing hub.
The nature of Indian engineering exports is also changing with time. India is fast
moving from exporting low value goods to developing countries to more sophisticated
goods targeted at developed countries. Capital goods account for 27 per cent of total
engineering exports. Exports to European Union countries and North America
accounted for 19 per cent and 17 per cent respectively, of total engineering exports in
2005-06. Engineering goods worth US$ 3.34 billion were exported to USA alone in
April – Feb 2006-07

18
Growing Demand
Capacity creation and transformation in sectors such as infrastructure, power,
mining, oil & gas, refinery, steel, automotive, consumer durables are driving growth in
the engineering industry. The framework below captures some of the key factors that
are contributing to domestic and international demand for engineering goods from
India. Restructuring of the state electricity boards in different states, growth of private
sector players and focus on capacity creation have driven growth in the power sector.
Conclusion
The Engineering sector’s future outlook is promising. Drivers like power projects, other
infrastructure development activities, industrial growth and favorable policy
regulations will drive growth in manufacturing. The Indian engineering industry has
been witnessing significant level of capability enhancement over the years. As export
markets open up, this will help India develop a strong presence in global engineering
exports. Power sector contributes the largest to the engineering companies’ revenues.
Major players in this sector like ABB and BHEL derive 60 per cent and 69 per cent of
their revenues from supplying equipments to the power sector. Going forward, with
the Government clearing the blueprint for adding 100,000 MW in the tenth (2002-07)
and eleventh 2007-12) five-year plans, the potential is high for the engineering
majors. Emerging trends such as outsourcing of engineering services can provide new
opportunities for quantum growth. Engineering and design services such as new
product designing, product improvement, maintenance and designing manufacturing
systems are increasingly getting outsourced to countries like India and China. India’s
engineering sector has significant potential for future growth, in manufacturing as well
as services.
With development in associated sectors like automotive, one of the largest evolving
markets for engineering and industrial goods, and a well developed technical human
resources pool, India is poised to make significant strides in all segments of
engineering.

19
________ ____ _________________________ Disclaimer:
This document prepared by our research analysts does not constitute an offer or solicitation
for the purchase or sale of any financial instrument or as an official confirmation of any
transaction. The information contained herein is from publicly available data or other
sources believed to be reliable but do not represent that it is accurate or complete and it
should not be relied on as such. Firstcall India Equity Advisors Pvt. Ltd. or any of it’s
affiliates shall not be in any way responsible for any loss or damage that may arise to any
person from any inadvertent error in the information contained in this report. This document
is provide for assistance only and is not intended to be and must not alone be taken as the
basis for an investment decision.

20
Firstcall India Equity Research: Email – [email protected]
C.V.S.L.Kameswari Pharma
U. Janaki Rao Capital Goods
B.Harikrishna Banking
B. Prathap IT
D. Ashakirankumar Automobile
A. Rajesh Babu FMCG
H.Lavanya Oil & Gas
A.Prathibha Diversified
G.Bharani Bhukta Diversified
Kavita Singh Diversified
Nimesh Gada Diversified
Priya Shetty Diversified
Neelam Dubey Diversified
Firstcall India also provides
Firstcall India Equity Advisors Pvt.Ltd focuses on, IPO’s, QIP’s, F.P.O’s,Takeover
Offers, Offer for Sale and Buy Back Offerings.
Corporate Finance Offerings include Foreign Currency Loan Syndications,
Placement of Equity / Debt with multilateral organizations, Short Term Funds
Management Debt & Equity, Working Capital Limits, Equity & Debt
Syndications and Structured Deals.
Corporate Advisory Offerings include Mergers & Acquisitions(domestic and
cross-border), divestitures, spin-offs, valuation of business, corporate
restructuring-Capital and Debt, Turnkey Corporate Revival – Planning &
Execution, Project Financing, Venture capital, Private Equity and Financial
Joint Ventures
Firstcall India also provides Financial Advisory services with respect to raising
of capital through FCCBs, GDRs, ADRs and listing of the same on International
Stock Exchanges namely AIMs, Luxembourg, Singapore Stock Exchanges and
other international stock exchanges.
For Further Details Contact:
3rd Floor,Sankalp,The Bureau,Dr.R.C.Marg,Chembur,Mumbai 400 071
Tel. : 022-2527 2510/2527 6077/25276089 Telefax : 022-25276089
E-mail: [email protected]
www.firstcallindiaequity.com