diagnostic study - minnesota state university, mankato
TRANSCRIPT

Implementation Plan Chapter 7
141Chapter
7 Implementation Plan
Introduction
Analysis of data from the Diagnostic Phase of the Little Cottonwood River Restoration project shows that reductions in sediment, nitrate-nitrogen and phosphorous throughout the watershed would contribute to improvements in the Little Cottonwood and Minnesota River. The technical committee has identified several premeditative actions, which will result in lower amounts of these contaminants. This plan covers three years, we expect that these activities can be completed by spring of 2004.
Activities to reduce sediments (TSS)
Eight of our proposed implementation activities will contribute to a reduction in the amount of soil entering the LCR. Upland non-point source controls include retirement of marginal farmland into federal and state set-aside programs, installation of filter strips along ditches and creeks, installation of rock inlets in tiled areas and grass waterways in sloped areas, and promotion of reduced tillage systems. Within the riparian area, stream bank stabilization and stream fencing projects will help reduce bank erosion.
Activities to reduce nutrients
Some of the above projects will also result in lower amounts of nitrogen, phosphorus, and bacteria entering the LCR. Other activities with this goal in mind are: the establishment of nutrient management test plots, animal waste management promotions, barnyard runoff control construction, remote watering systems and water crossings for livestock pastured alongside the river, and upgrades for onsite sewage treatment systems.
Activities to provide overall water quality improvement
A few of our proposed remediations will provide substantial reductions in sediments and nutrients. Restoration of wetlands and the construction of sediment control basins will allow for settling of suspended solids and nutrient assimilation/deposition. Educational efforts, including promotion of lawn best management practices in the communities, are proposed to provide emphasis to non-agricultural non-point sources of contaminants. Other education is proposed to continue the long-term effort to raise public awareness of impacts on water resources.

Implementation Plan Chapter 7
142
Goals & Objectives
The goal of the LCR and the nine objectives are both continued from the Phase I project.
Little Cottonwood River Restoration Project Goal:
To encourage land use practices within the watershed that will reduce sediment and nutrient discharges to the river.
Project Objectives:
Identify pollutant issues that impact local water resources (groundwater, Little Cottonwood River tributaries, parks), on the Little Cottonwood, and ultimately on the Minnesota River.
Status: accomplished in Phase I project
Identify sources of pollutants.
Status: accomplished in Phase I or in other resource investigation projects
Nitrogen: agricultural applied fertilizers, manure, livestock pasturing adjacent to river & tributaries, non-complying Individual Sewage Treatment Systems (ISTS)
TSS: tillage practices, stream bank erosion, tile intakes
Phosphorus: agricultural applied fertilizers, manure, livestock pasturing adjacent to river & tributaries, non-complying Individual Sewage Treatment Systems (ISTS)
Identify pathways of pollutant delivery
Status: accomplished in Phase I or in other resource investigation projects
Nitrogen: field to ditch (no filter strips), tile intakes (no settling), ditch directly to river (no settling basins, attenuation by wetland vegetation)
TSS: (same as # 2 above)
Phosphorus: tied to soils and fresh sources (e.g. manure from human and stock animals)

Implementation Plan Chapter 7
143Define nutrient loading rates and concentrations for the river.
Status: accomplished in Phase I Project
Assess possible Best Management Practice solutions given sociopolitical constraints
Status: accomplished by U of M soil scientists, and during Phase I assessments
Develop load/concentration reduction goals (at the mouth of the watershed)
TSS: 25% reduction. Translates into a FWMC goal of 150 mg/l or 115 lbs./acre yield
Total Phosphorus: 30% reduction. Translates into a FWMC goal of .152 mg/l or .232 lbs./acre yield.
Nitrate: 30% reduction. Goal is to reduce surface water concentrations to levels below 10 mg/l. Translates into a FWMC goal of about 5 mg/l or 5.2 lbs./acre yield.
Fecal Coliform : Geometric Mean levels below 200col./100ml.
Develop an Implementation Plan
Status: accomplished during Phase I
Develop and implement a public awareness and education campaign
Status: This activity was begun during Phase I.
These activities will continue as an important part of the Phase II work plan.
Implement the most effective BMPs to reach reduction goals.
Status: this will be achieved during Phase II of the project.
Specific goals for the second phase activities, such as number of acres to be enrolled in retirement programs, number of buffer strip rods proposed, number of newsletters, etc. are included in the program element budget.

Implementation Plan Chapter 7
144
Summary of Project Goal Achievement Progress
Goal # Goal Accomplished in Phase I Phase II Both
1 Identify pollutant issues X
2 Identify pollutant sources X
3 Identify pollutant pathways X
4 Define nutrient loading rates & concentrations X
5 Assess BMP solutions X
6 Develop load/concentration reduction goals X
7 Develop an Implementation Plan X
8 Develop & implement public awareness & education X
9 Implement cost-effective BMPs X

Implementation Plan Chapter 7
145
Best Management Practices Proposed for LCR – Phase II
Best Management Practices (BMPs) are defined as those practices, techniques, or measures for preventing or reducing source pollution to a level compatible with water quality goals.1 BMPs are voluntary practices, which have been scientifically proven through public and private research to improve water quality while at the same time ensuring profit to the landowner and/or producer.
The basis for selecting the BMPs for the LCR implementation was based on the following factors:
Cost and water quality improvement effectiveness
Realistic adoption of the proposed voluntary BMPs by watershed residents
Secondary benefits. Habitat for wildlife, increase in plant and animal diversity, enhancing food production sustainability, and soil conservation.
Discussions with local SWCDs, NRCS employees, other conservation agencies, and watershed residents.
Most of the BMPs, design, site preparation, planting and maintenance would be in-kind contributions by federal, Minnesota state cost share and local SWCDs . However, to fill in gaps where existing BMPs fail to get adopted, CWP Phase II cost share funding would be secured to increase participation. Below is a list of BMPs selected for the LCR watershed. Where applicable, a general description of the practice is followed by specifics in how the BMPs will be utilized for the watershed.
Riparian Buffer Strips and Set-aside Programs
Riparian buffers consist of trees and other and other vegetation located in areas adjacent to streams and drainage ditches. The presence of permanent vegetation along a waterway is primarily designed to intercept surface runoff and help trap or remove nutrients, sediment, organic matter, pesticides, and other pollutants prior to entry of surface waters. Riparian buffers also serve to stabilize eroding banks and increase wildlife nesting and food habitat. Sediment delivery reductions up to 80% have been reported on 4% slopes where buffers have been installed
Implementation for LCR
The major component of the LCR Implementation is to facilitate the enrollment of agricultural land into federal and state set-aside programs. After numerous meetings with conservation groups and residents this program element was weighted heavily in terms of importance. Project staff will work individually with each producer to explain programs (CREP, CRP, Continuous CRP, RIM, WRP, LCR project programs, and others) to encourage participation, and to assist with program applications
1 Descriptions of BMPs taken from, Agriculture and Water Quality; Best Management Practices for Minnesota, and U. S. Department of Agriculture, Natural Resources Conservation Service, Conservation Choices.

Implementation Plan Chapter 7
146CREP
The Conservation Reserve Enhancement Program (CREP) gives producers within the MN River Basin the opportunity to retire frequently flooded or environmentally sensitive cropland from production in exchange for 15 years of CRP payments and a one time 40% RIM payment. To meet their target goal of 4,000 CREP acres the Brown SWCD is looking at utilizing additional staff from the Cottonwood River and Watonwan River Watershed projects to advertise and increase CREP enrollment. The Cottonwood and Watonwan cover 45% of the county. The northern (32% portion) of the county will be covered by NRCS and SWCD staff. The Brown SWCD and NRCS are weighing heavily on Little Cottonwood Phase II funding to place additional staff for enrollment purposes within the remaining 23% of the county. According to conservation staff the Little Cottonwood River Watershed has the greatest potential for CREP acres in the county and is considered a high priority for CREP targeting due to the extensive floodplain in the middle portion of the watershed. 1,000 acres have already been secured within the county leaving a remainder of 3,000 acres for the CREP goal. Half of the 3000 acres are assumed to come from the Little Cottonwood River Watershed. The remaining 1500 acres is assumed to come from the Watonwon, Cottonwood and Middle Minnesota Watersheds. Therefore, securing more CREP acres is and will be a major portion of the LCR implementation plan.
A committee between the SWCD, NRCS, Cottonwood Watershed CREP employee, Watonwan CREP employee, Brown county water planner, and LCR project has already been formed. A joint effort between the staff from the above agencies will help market, target, and sell CREP within the county. The strategy for increasing CREP will consist of:
Initial letter to all county landowners advertising the program and staff working with it. (All watersheds within the county) This will occur during the fall of 2000.
The mass county mailing will be followed by an actual $/acre calculation using GIS digital orthophotos, soil maps, and CREP excel spreadsheet. The calculations will show an air photo outlining eligible CREP acres on each individual’s property. A follow up phone call and visit to high priority areas will follow the mailing. The calculations will go out to all areas eligible for CREP enrollment within the watershed. A significant portion of staff time and financial resources will be devoted within this phase of the CREP promotion to work with prospective landowners within the watershed before the programs ends September 30 of 2001.
In addition promotional materials such as hats, radio advertisements, displays, and metal field signs will be used to advertise CREP and related watershed activities.
LCR Filter Strip
This conservation program is designed to be more flexible compared to the previous two programs, however does not pay as much per acre. This program was tailored to the needs of the Little Cottonwood Watershed and was designed to be flexible for the landowner therefore increasing overall participation. It was modeled after the very successful Lake Hanska Filter Strip Program.
A goal of 20 acres will be installed, mainly along cropped tributaries of the LCR. The vegetative buffer strip will be established for 10 years. SWCD Stage Cost-share paper work will be utilized for
Implementation Plan Chapter 7
147the contracts. A payment of $1000 per acre is the incentive payment for a minimum ten-year commitment. Strip widths between 33 and 200 feet will vary, depending on the width needed to be effective. Seeding will be of either warm season or cool season grasses. Unlike CREP and CRP this program allows the filter strip to be utilized for a hay crop if desired between August 1-15 with a minimum stubble height of 8”. Demand for this program would mainly come form dairy farmers near the middle and lower portion of the watershed.
Grassed Waterways
A grassed waterway is a natural or constructed channel, usually broad and shallow, that is planted with grass to protect soil from erosion by concentrated storm flow. Runoff water that flows down the drainage way flows across the grass rather than eroding soil and forming a gully. An outlet is often installed at the base of the drainage way to stabilize the waterway and prevent a new gully from forming.
Grassed waterways are estimated to reduce sediment losses from the flow area by 60% to 80%. Although grassed waterways act as a filter to remove sediment from runoff, waterways should not be utilized primarily as a filter strip because siltation leads to reduced filtering capacity. Likewise, the watershed above a waterway should be treated to control erosion before construction to prevent the waterway from prematurely filling in with sediment. Vegetation may be difficult to establish in a waterway, so erosion control barriers or mulching may be needed during vegetative establishment.
The TISWA survey indicated many areas within the lower section of the watershed where waterways would be especially effective in controlling sediment and nutrient runoff. A goal of 10 acres is proposed for the watershed. The LCR project would utilize it’s own program in addition to state cost share to increase enrollment.
Rock Inlets and other Tile Intake Alternatives
Rock Inlets
Surface, or open tile, inlets are believed to be a direct pathway for sediment and nutrients to reach surface water. Although they are a useful component of cropland drainage systems, they do not allow for adequate filtration of runoff.
A counter practice to surface inlets is that of rock inlets. There are several configurations of this practice, but most commonly, it requires a fabric-covered perforated tile placed in a trench and connected to the existing tile line. The trench is filled with varying sizes of rock to one foot above ground level. This system eliminates the above-ground tile inlet. Normally this trench is approximately twelve feet long by three feet wide and three feet deep. Runoff from the surrounding landscape is filtered through the trench rather than drained through a pipe as before. Preliminary research indicates that approximately one-half of the sediment delivered through surface inlets are delivered through rock inlets.
Because rock inlets do not substantially interfere with use of farm machinery, they are well received within the farming community. Crops can be planted over the inlets, but care should be taken around them when doing tillage. Maintenance needs are limited to removing and replacing the top twelve inches of rock after drainage efficiencies have decreased.

Implementation Plan Chapter 7
148Brown County is currently funding a 50% cost share on replacing open intakes with a Rock Inlet program modeled after Carver Co. SWCD the very successful Lake Hanska Project. The design is simple in that sediment and therefore attached Phosphorus is reduced since runoff is filtered through a bed of rock before reaching the tile line. Currently BWSR and NRCS is looking at cost share for this, but has not decided as of this date until further research has been completed in regard to the Rock Inlets longevity. The LCR would help increase the enrollment of rock inlets, and alternatives such as close pattern tiling to mitigate the negative effects of open intakes. As ongoing research through the University or Southwest Research and Outreach Center becomes available it will be incorporated into the promotion and use of this practice.
Livestock Waste Management
Waste Management
Livestock waste management practices are important methods of addressing nutrient concentrations in area streams. One cost effective way to keep runoff from feedlots entering waterways is through clean water diversion. By helping cost share roof gutters and other water diversion practices on barns and pole sheds, clean rainwater is kept away from stored manure sources. Constructing roof gutters on buildings near feedlots is a very cost effective an popular way in reducing potential manure runoff into waterways. Therefore roof gutter construction as part of waste management will be a focus during the implementation phase.
Stream Fencing
Livestock exclusion involves fencing off areas where uncontrolled access would otherwise degrade the water quality by increasing bacteria, turbidity, and stream bank erosion. In addition to stream fencing, special pasture management plans would incorporate controlled water access through rock cattle crossings, buffer strips, and mechanical pumps for watering. In the LCR, the middle portion and lower portion of the watershed was identified as having a high number of locations where beef and dairy cattle have free access to the river and tributaries. It was also discovered in this area that (especially site 3) fecal coliform and turbidity levels were above recommended levels. Through state cost share, CRP, as well as additional incentives through the LCR phase II, stream fencing demonstrations within priority areas will be a focus during the implementation phase.
Nutrient Management
Nutrient management involves careful management of all aspects of soil fertility, so that crop needs are met while minimizing losses to surface and groundwater supplies. This requires management of nutrients applied to the soil including commercial fertilizers and manure as well as in-place nutrients. Soil tests to determine existing nutrient levels are essential to nutrient management, and are necessary to determine the appropriate fertilizer requirements for a specific soil. The fertilizer application rate should be calculated by using soil test results and Minnesota Extension Service recommendations. The fertilizer application rate should consider the crop, soil type, previous crops, history of manure application, and method of fertilizer placement.

Implementation Plan Chapter 7
149Nutrient management has been shown to have a very beneficial effect on water quality. Through use of proper rates, placement and timing of fertilizer application, loss of nitrogen and phosphorus can be reduced by 50% to 90%. It is easily the most effective way to reduce transport of soluble forms of nutrients to surface and groundwater. Sound nutrient management also reduces input costs, thereby increasing the profitability of crop production.
After intensive review of other water quality projects and discussions with local NRCS and SWCD staff it was felt Nutrient Management projects on a small-scale within the watershed would help facilitate the adoption of nitrogen best management practices. Many producers as well as commercial applicators firmly believe that most land grant university recommendations are too conservative, as a result they frequently use nitrogen rates 20 to 60 lb/acre more than the crop can effectively use. In the St. Peter wellhead protection area a FANMAP survey by the Minnesota Department of Agriculture found, over 90% of the corn acres were receiving 30+ lbs./acre compared to UM recommendations. Convincing producers that lower rates recommended by the UM will perform under a variety of climatic conditions can be difficult. One effective method is to conduct “on-farm” strip trials over several growing seasons. The city of St Peter wellhead protection area is currently performing such nitrogen management test plots. The fields are planted in a corn and soybean rotation with variable rates of nitrogen fertilizer applied on the land going into corn. The strips are then harvested with a combine equipped with a GPS and a yield monitor. Strong interaction between soil type, N-rate and yields are found. Ultimately through these field trials the farmer will have more tendency to refine N-rates and request the changes from their Coop applicators. The LCR is planning field demonstrations within the upper and lower portion of the watershed. It will be modeled after the St Peter Wellhead protection N-Strip Protocol and will utilize agronomists and UM extension researchers from Waseca and Lamberton. As well it is proposed through the nutrient management phase of the LCR:
LCR would help pay for set number of soil and manure tests. Emphasis would be placed on reducing fertilizer costs through manure crediting.
Soil tests, manure tests and manure crediting demonstrations with extension. Targeted towards fertilizer dealerships, cooperatives and commercial applicators.
As suggested by Cottonwood County NRCS/ Soil and Water Staff, budgeting for assistance from a private agronomist would help in the overall facilitation of nutrient management test plots. The project along with other sources would provide financial and technical support for a nutrient manager to work one-one with agricultural producers, fertilizer dealers, and agronomy consultants.
Residue Management
Residue management is the practice of leaving last year’s crop residue on the soil surface by limiting tillage. Tillage practices (conservation tillage) that leave at least 30% of the soil surface covered with crop residue are suitable to achieve adequate residue management. No-till, mulch till, and ridge till are three of the various techniques used to meet the 30% residue coverage rate.
Conservation tillage is effective for controlling soil erosion and helps control loss of nutrients that are attached to soil particles. Time, energy and labor savings from fewer tillage trips are related benefits of reduced tillage. These savings can offset the cost of tillage equipment needed to achieve adequate residue management. Residue management also helps maintain or develop good soil health, improve water infiltration and reduce evaporation from the soil surface while providing food and cover for wildlife.

Implementation Plan Chapter 7
150The practice of residue management (>30% residue) does create additional challenges for the farmer. Factors such as crop sequence, soil texture and drainage, and climate must be considered. Under heavy residue conditions, well-drained soils are generally better suited to reduced tillage than poorly drained soils. Soil warming and drying can be delayed in the spring if high levels of residue are left on poorly drained soils.
Within the LCR watershed, loans from the AG BMP program will be used to help farmers purchase conservation tillage equipment at reduced rates. Through the water planning, and Cottonwood/Brown Extension, NRCS, and SWCDs conservation tillage field days will be held.
Wetland Restoration
Wetland restoration or development can be achieved through use of small structures such as dikes to add water or regulate water levels in an existing wetland. Restoration can also be achieved by filling a surface drain or removing a subsurface drain. County or judicial ditches can also be modified to temporarily impound water. This practice is consistent with M.S. 103E, and can be accomplished in a way that does not impede drainage functions.
Wetlands are efficient sediment traps, preventing soil particles and attached pollutants from reaching lakes and streams. They also provide some removal of dissolved nutrients from runoff during the growing season. Wetlands provide habitat for waterfowl and other wildlife species and serve an important storage function in the watershed to help reduce peak stream flow.
The best potential for wetland restoration is within the middle portion of the watershed. Currently no USFWS easements exist within the watershed. The USFWS in Windom has expressed interest in working with project staff in securing acres for wetland restoration and/or riparian buffer zones. There has also been some interest located within the upper reaches of the watershed west of Jeffers by Cottonwood County conservation employees. A goal of 10-20 acres of wetland restoration is planned.
Water and Sediment Control Basins
Water and sediment control basins are earthen embankments constructed across depressional areas of concentrated runoff. They perform a function very similar to that of terraces. Drainage areas controlled by these structures should be less than 50 acres. In many cases, a series of basins is needed to properly control erosion, and to be compatible with farm machinery.
This practice is very effective at preventing gully erosion, trapping sediment, and reducing downstream peak flows. They are capable of trapping up to 60% of total suspended solids contained in runoff. However, they are not effective at removing soluble pollutants.
Area II is currently assessing the feasibility of water control basins on three sites in Delton township of the watershed. The sites would store water and provide wildlife habiat. Cottonwood County is in full support of this, since it would help to mitigate the effects of JD 9 to downstream residents. LCR Phase II will continue to be a partner with Area II in establishing water storage within the watershed.
Livestock waste management
Livestock waste management refers to storage facilities, but it also includes practices such as buffer strips and livestock exclusion, where appropriate. If manure is not handled properly, it is a

Implementation Plan Chapter 7
151source of bacteria, nutrients, ammonia and total suspended solids. The impact of feedlot runoff on surface water depends on size and location, although feedlots distant from surface water can contribute pollution if runoff becomes channelized or reaches a ditch or tile. Generally, if a feedlot is large and close to a lake or stream, the impact is significant. If the feedlot is small and a long distance from a surface water body, the impact may be minimal.
A waste management system is a combination of practices used to temporarily store manure unit it can be properly applied to cropland. Examples include waste storage ponds, waste storage structures, and solid waste storage areas. Storage ponds are earthen structures that usually require liquid manure handling equipment for agitation, hauling, and field application. Storage structures are fabricated containment areas such as a pit below a confinement building or an above-ground structure. These also require equipment to handle liquid manure. Solid storage areas are usually concrete slabs designed to store solids and allow liquids to run off. They require some type of runoff containment to prevent polluted runoff from leaving the site.
Waste management systems typically achieve pollutant reductions in the range of 50% to 75%. Systems that totally control runoff can eliminate all pollutant discharges. Careful consideration must be given to design and construction of these systems to prevent groundwater contamination. Even with proper construction, however, a certain amount of seepage is expected from earthen ponds. Waste management systems can be relatively complex and expensive and, therefore, are not an attractive alternative to many farmers.
Runoff from feedlots can be controlled with several practices that may or may not be used in conjunction with a waste management system. Diversions prevent clean water from flowing over the feedlot. Roof water can be collected and routed away from the feedlot. Filter strips are another effective way to treat feedlot runoff by allowing it to pass over an area of vegetation.
Another way to manage livestock waste in a non-feedlot situation is through exclusion. Livestock exclusion involves fencing off areas where grazing would cause erosion of streambanks or allow water quality to be lowered by livestock activity in the stream. This practice can achieve a 50% to 90% reduction of suspended solids and phosphorus within a stream reach. Where applicable state cost share funds will be used within the watershed to educate and design waste management structures.
Implementation Plan Chapter 7
152Individual Sewage Treatment Systems (Septic Systems)
Septic systems are recognized as an acceptable means for treating wastewater. The system consists of a septic tank and drainfield. The septic tank provides a place for large solids to settle and to be decomposed by microorganisms. The drainfield removes fine solids and destroys accompanying bacteria. Effluent from a septic tank contains solids, phosphorus, nitrogen, chloride, bacteria, viruses, and organic chemicals. For this reason, it is illegal to discharge a septic tank directly to a tile line or other surface water.
Pollutants from a properly sited, installed, and maintained septic system will be adequately treated within two to three feet below the drain field. Soil characteristics are important considerations in the design and installation of septic systems. A poorly functioning septic system is a threat to the water quality of nearby streams, lakes, and groundwater. Routine maintenance is critical to prevent septic system failure. The tank should be inspected at least once every year, and, with ordinary use and care, the tank should be pumped every one to three years.
The implementation plan for the LCR requests over $150,000 in state revolving funds (SRF) or low interest loan money for upgrading non-complying septics. The program has been very successful in the past for updating septics and the grant request from the phase II is highly supportive by Brown and Cottonwood staff. The program would be administered through the Brown Co./Cottonwood Co. zoning and planning office and the money would be transferred into already established “septic systems upgrade” accounts.
Streambank Restoration
Stream bank erosion is a continually occurring natural condition that can be greatly accelerated by human activity. Over time, natural streams tend to reach equilibrium so that erosion at one location is roughly balanced by deposition at another. Human alterations to hydrologic and stream flow patterns can, however, upset this balance and lead to severe consequences. Streambank failure, defined as the collapse or slippage of a large mass of bank material into the steam, is one example of what happens when this balance is upset.
Because of the complexity of physical processes affecting streams, there is not one single type of streambank failure, but may different types. Consequently, streambank protection or restoration practices must be tailored to the specific causes of the streambank problem. Through and understanding of the problem’s cause and selection of the proper bank protection method, the likelihood of protecting an eroding streambank is significantly increased.
One of the most common techniques used for streambank protecting is rock riprap. It is a very effective method when used properly, but it is also very expensive. Riprap consists of rock material placed on the bank surface at the location of the erosion problem, and serves to protect the bank from erosion by protecting it from the erosive forces of the stream. The rock should extend far enough up on the bank to where natural vegetation can provide adequate protection.
The most common method of riprap is dumping the rock material onto the streambank. Careful placement of the rock material is often necessary, however, to avoid separation of the large and small stones.

Implementation Plan Chapter 7
153Bioengineering represents an attractive alternative to the use of rock riprap for streambank protection. This approach combines mechanical, biological, and ecological concepts to arrest and prevent shallow slope failures and erosion. Immediate soil reinforcement is achieved by specific plant arrangements at the site. In conjunction with the vegetative cover, structures (see Table 49) should also be used. Structures stabilize slopes during the critical time for seed germination and root growth. A well-established root zone will provide shear strength and resistance to sliding. Overall benefits of bioengineering practices include slope stabilization, improved infiltration, runoff filtration, excess moisture transpiration, ground temperature moderation, habitat improvement, and aesthetic enhancement.
Bioengineering techniques can be used to develop sustainable systems for slope or streambank protection. The combination of correct assessments of stream corridors along with bioengineering practices has proven to be cost effective and environmentally sensitive. Installations can be labor intensive, but less costly than conventional engineering solutions.
Within the watershed, “hot spots” where excessive stream bank erosion is occurring will be stabilized according to SWCD and NRCS recommendations.
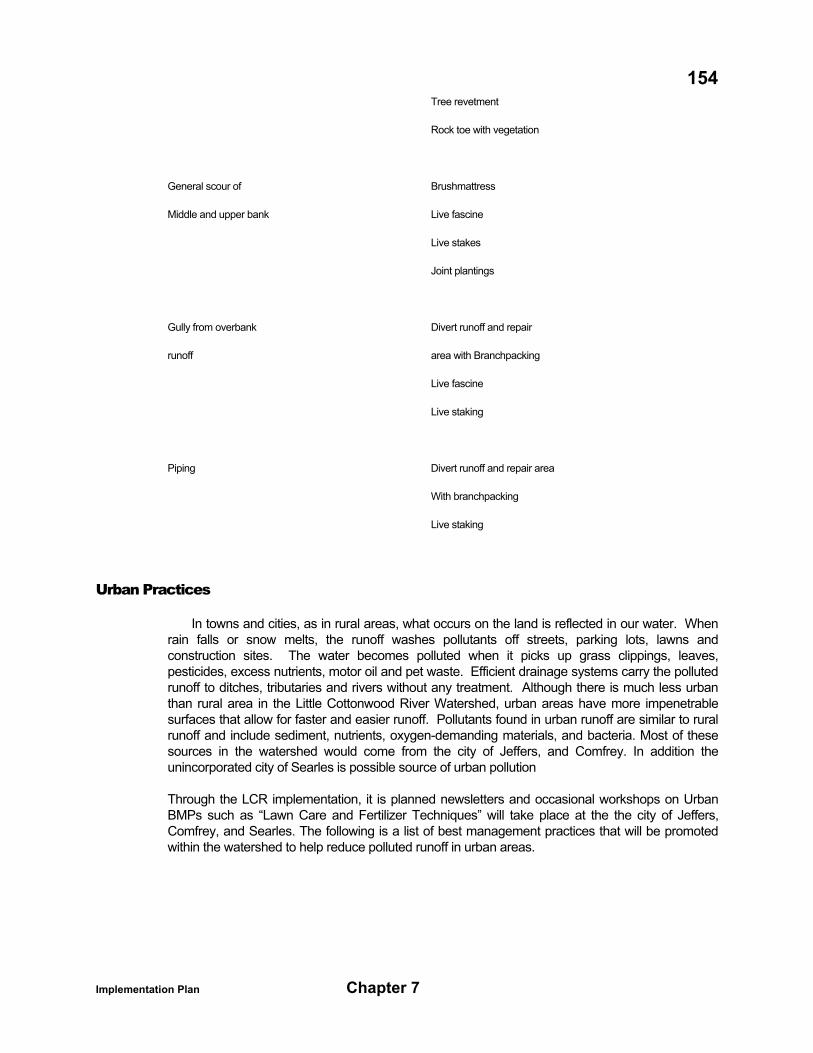
Table 49 lists major bioengineering practices and the problems for which they are most appropriate.
Table 49
Appropriate Bioengineering Streambank Protection Measures
Erosion Process Protection Measure
Headcutting and general Bioengineering not recommended
Bed degradation Grade control or bed armoring needed
Toe erosion and upper Live cribwall
Bank failure Brushmattress
Rock toe with vegetation
Joint Plantings
Local bank scouring Branchpacking
Live cribwall
Live fascine
Joint planting
Implementation Plan Chapter 7
154 Tree revetment
Rock toe with vegetation
General scour of Brushmattress
Middle and upper bank Live fascine
Live stakes
Joint plantings
Gully from overbank Divert runoff and repair
runoff area with Branchpacking
Live fascine
Live staking
Piping Divert runoff and repair area
With branchpacking
Live staking
Urban Practices
In towns and cities, as in rural areas, what occurs on the land is reflected in our water. When rain falls or snow melts, the runoff washes pollutants off streets, parking lots, lawns and construction sites. The water becomes polluted when it picks up grass clippings, leaves, pesticides, excess nutrients, motor oil and pet waste. Efficient drainage systems carry the polluted runoff to ditches, tributaries and rivers without any treatment. Although there is much less urban than rural area in the Little Cottonwood River Watershed, urban areas have more impenetrable surfaces that allow for faster and easier runoff. Pollutants found in urban runoff are similar to rural runoff and include sediment, nutrients, oxygen-demanding materials, and bacteria. Most of these sources in the watershed would come from the city of Jeffers, and Comfrey. In addition the unincorporated city of Searles is possible source of urban pollution
Through the LCR implementation, it is planned newsletters and occasional workshops on Urban BMPs such as “Lawn Care and Fertilizer Techniques” will take place at the the city of Jeffers, Comfrey, and Searles. The following is a list of best management practices that will be promoted within the watershed to help reduce polluted runoff in urban areas.

Implementation Plan Chapter 7
155 Recycle oil
Used oil from cars and motors should be carefully removed and put into a
leak-proof container. Every county has a hazardous waste removal day
that the used oil can be disposed at to eliminate improper dumping.
Direct downspouts to lawns
Runoff from roofs that eliminate water quickly also wash pollutants into
storm drains. When the water is directed onto a lawn, it irrigates the lawn
and provides an opportunity for slowing the water down by soaking into
the grass where a natural filtering process takes place.
Sweep paved areas to keep waste out of storm drains.
Water in the form of runoff picks up contaminants from paved areas and
carries them directly to a river or tributary. By keeping paved areas free
of litter and chemicals, it is possible to eliminate some of the pollutant
loading from runoff.
Keeping cars tuned, repair leaks
Fluids from automobiles pollute water when they leak from the car and
enter the river or tributary from a water source. It is possible to eliminate
this by checking for leaks and keeping a schedule of tune-ups to insure
a proper running car. Recycle auto fluids, such as oil, antifreeze, and
transmission fluid.
Limit fertilizer and pesticide use, leave grass clippings on the lawn
Soil testing before applying fertilizer will provide the best use of
Chemicals with the least amount of extra that could runoff into the river or
water source. Grass clippings left on the lawn are equal to one fertilizer
application per year. When leaves or grass clippings are left on paved
surfaces, they get washed into storm drains and are delivered directly to
a water source. As they decay, nutrients are released, which provide food
for unwanted growth in rivers, streams and lakes.
Clean up pet waste
Pet waste carries disease-causing bacteria. It should be thrown in the
Trash, flushed down the toilet or buried.

Implementation Plan Chapter 7
156 Dispose of toxic wastes properly
Properly dispose of car oil, antifreeze, thinners, solvents, paints, pesticides,
and don’t purchase more than what is necessary for the job. Do not wash
brushes under running water in the sink. Use hazardous waste pick-ups to
eliminate storing and possible leakage.
Wash cars on the lawn or at a car wash
To reduce the amount of runoff directly to a storm drain, wash the car on
the lawn so waste water has an opportunity to slowly filter through soil
and vegetation. Dirty water from a commercial car wash goes to a
wastewater treatment plant where pollutants are removed.
Use construction site erosion control
Erosion control is important for public building as well as private building.
Without erosion control measures, every acre under construction delivers
About a dump truck and a half of soil into a nearby water source.
Priority Management Areas
The watershed is small enough that many of the proposed activities listed above can be administered in any area. However, contributions of pollutants vary through segments of the watershed, thus BMPs will vary throughout areas of the watershed. Priority area segments are based on water quality monitoring sites. The selected BMPs are based on water the water quality, RUSLE Potential Erosion Modeling, TISWA results and watershed characteristics found in chapters 2 and 5. There are three sections labeled 1, 2 and 3. Where applicable, sub-watersheds are listed next to each BMP in effort to narrow priority management areas even further. See map 30 for management areas.
1. Near the headwaters. Upper watershed to water monitoring site 2. Mainly in Cottonwood County.
2. Area between water quality monitoring site 2 and 3. All within Brown County.
3. Area after site 3. Mainly Brown County and very small portion within Blue Earth County.
Section 1 -- Upper watershed to water quality monitoring site 2 (Upper Little Cottonwood - mainly within Cottonwood County)
Filter strip establishment 28080
Implementation Plan Chapter 7
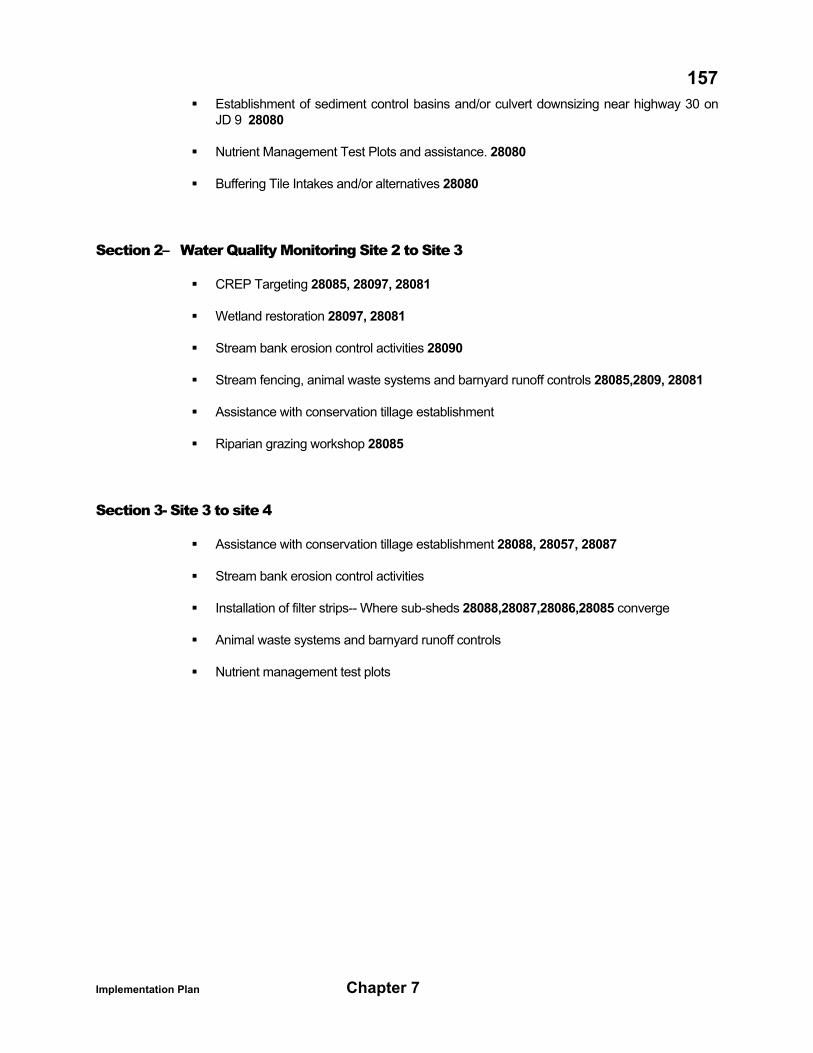
157 Establishment of sediment control basins and/or culvert downsizing near highway 30 on
JD 9 28080
Nutrient Management Test Plots and assistance. 28080
Buffering Tile Intakes and/or alternatives 28080
Section 2– Water Quality Monitoring Site 2 to Site 3
CREP Targeting 28085, 28097, 28081
Wetland restoration 28097, 28081
Stream bank erosion control activities 28090
Stream fencing, animal waste systems and barnyard runoff controls 28085,2809, 28081
Assistance with conservation tillage establishment
Riparian grazing workshop 28085
Section 3- Site 3 to site 4
Assistance with conservation tillage establishment 28088, 28057, 28087
Stream bank erosion control activities
Installation of filter strips-- Where sub-sheds 28088,28087,28086,28085 converge
Animal waste systems and barnyard runoff controls
Nutrient management test plots

Implementation Plan Chapter 7
158According to RUSLE, subsheds with highest soil erosion potential (Top Four)
1. 28057
2. 28087
3. 28080
4. 28085
According to feedlot statistics, sub-sheds with higher potential for runoff based on (Top Three)
1. 28087
2. 28085
3. 28080
According to TISWA, most impaired sub-sheds from field survey (Top Four)
1. 28085
2. 28088
3. 28086
4. 28084
Overall Highest Priority Sub-sheds for BMP implementation (Top Four) Based on RUSLE, feedlot statistics and analysis, TISWA, Isolated water quality loading rates.
1. 28085
2. 28057
3. 28087
4. 28080
5. 28088

Implementation Plan Chapter 7
159
$Z
$Z
$Z
$Z
28080
28081
28097
28091
28090
2808828085
28084
28087
28089
28057
28086
2
3
4
1
N
Brown Nicollet Cottonwood Water Board
Sub-WatershedsSub-WatershedsPriority Sub-Watersheds
Priority Management Areas for Best Management Practice Implementation
TributariesLittle Cottonwood River
$Z Water Quality Monitoring Sites
Counties
Little Cottonwood Watershed
#
Section 1
#
Section 2
#
Section 3
10 0 10 20 Miles
Implementation Plan Chapter 7
160
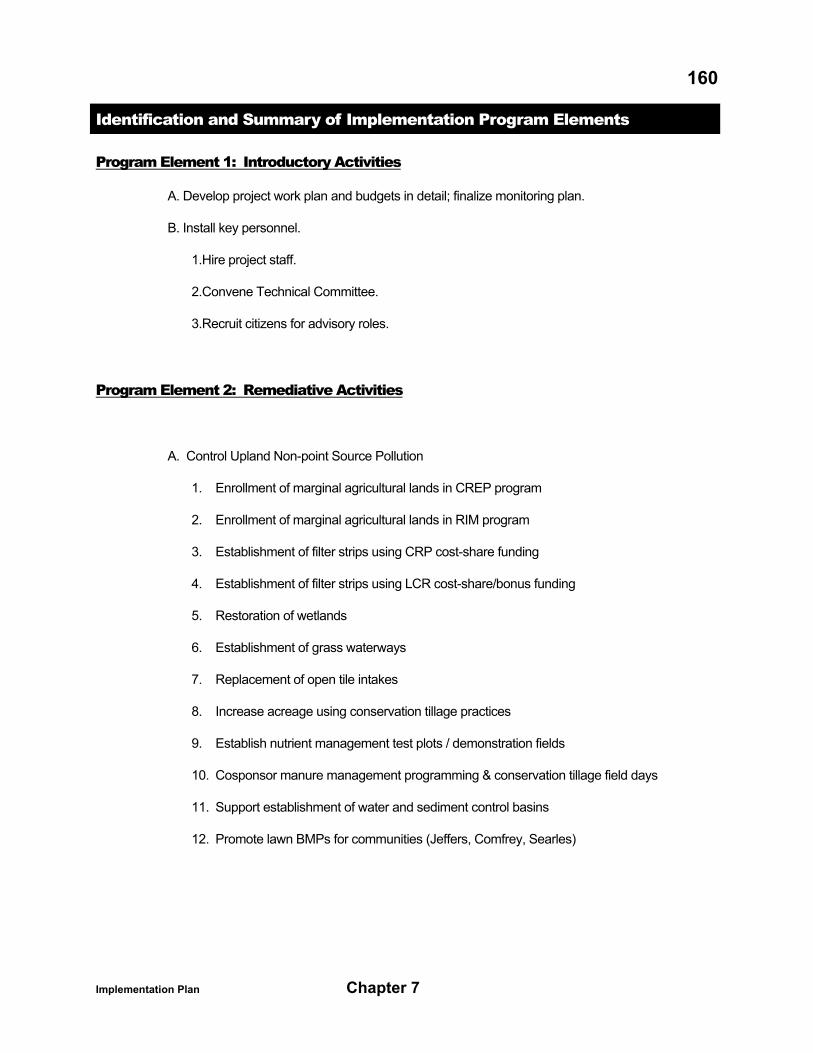
Identification and Summary of Implementation Program Elements
Program Element 1: Introductory Activities
A. Develop project work plan and budgets in detail; finalize monitoring plan.
B. Install key personnel.
1.Hire project staff.
2.Convene Technical Committee.
3.Recruit citizens for advisory roles.
Program Element 2: Remediative Activities
A. Control Upland Non-point Source Pollution
1. Enrollment of marginal agricultural lands in CREP program
2. Enrollment of marginal agricultural lands in RIM program
3. Establishment of filter strips using CRP cost-share funding
4. Establishment of filter strips using LCR cost-share/bonus funding
5. Restoration of wetlands
6. Establishment of grass waterways
7. Replacement of open tile intakes
8. Increase acreage using conservation tillage practices
9. Establish nutrient management test plots / demonstration fields
10. Cosponsor manure management programming & conservation tillage field days
11. Support establishment of water and sediment control basins
12. Promote lawn BMPs for communities (Jeffers, Comfrey, Searles)
Implementation Plan Chapter 7
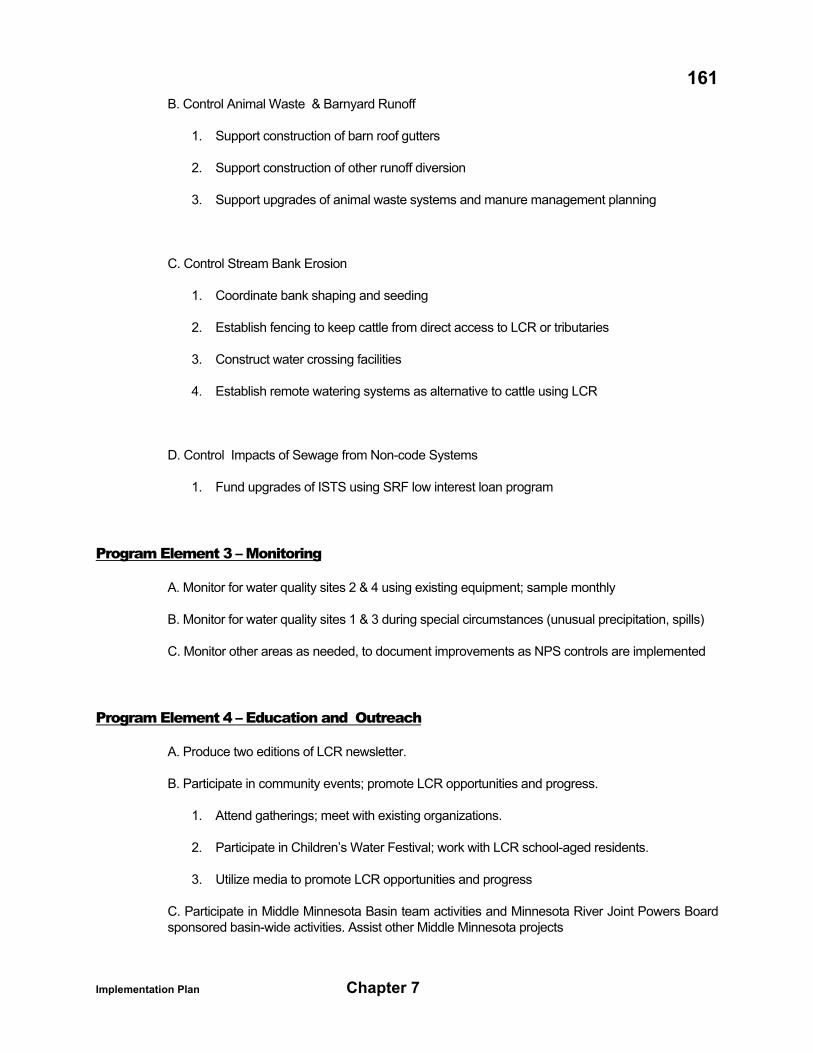
161B. Control Animal Waste & Barnyard Runoff
1. Support construction of barn roof gutters
2. Support construction of other runoff diversion
3. Support upgrades of animal waste systems and manure management planning
C. Control Stream Bank Erosion
1. Coordinate bank shaping and seeding
2. Establish fencing to keep cattle from direct access to LCR or tributaries
3. Construct water crossing facilities
4. Establish remote watering systems as alternative to cattle using LCR
D. Control Impacts of Sewage from Non-code Systems
1. Fund upgrades of ISTS using SRF low interest loan program
Program Element 3 – Monitoring
A. Monitor for water quality sites 2 & 4 using existing equipment; sample monthly
B. Monitor for water quality sites 1 & 3 during special circumstances (unusual precipitation, spills)
C. Monitor other areas as needed, to document improvements as NPS controls are implemented
Program Element 4 – Education and Outreach
A. Produce two editions of LCR newsletter.
B. Participate in community events; promote LCR opportunities and progress.
1. Attend gatherings; meet with existing organizations.
2. Participate in Children’s Water Festival; work with LCR school-aged residents.
3. Utilize media to promote LCR opportunities and progress
C. Participate in Middle Minnesota Basin team activities and Minnesota River Joint Powers Board sponsored basin-wide activities. Assist other Middle Minnesota projects

Implementation Plan Chapter 7
162D. Add LCR website link to Minnesota River Basin Data Center at University of MN-Mankato Water Resources Center for educational and data sharing purposes.
Program Element 5 – Data Management & Evaluation
A. Using GIS, track project activities, including installation of NPS controls
B. Using GIS, track project results, including monitoring
C. Utilizing Technical Committee assess progress, evaluate factors and rework plan as needed.
D. Compile final report.
Program Element 6 – Administration
Project Communications
Project Financial Management
Project Direction

Implementation Plan Chapter 7
163
Milestone Schedule
Program Element 3/01 9/01 3/02 9/02 3/03 9/03 3 /04
1-Introductory Activities x------------x
2-Remediative Activities
A. Upland NPS x-------------------------------------------------------------------------------x
B. Ag point-sources x-------------------------------------------------------------------x
C. Streak-bank erosion x--------------------------------------------------------x
D. Sewage x-----x x--------x x----------------------x
3-Monitoring x x x x x x x x x x x x x x x x xx
4-Education & Outreach x----------throughout project timeline----------------------x
5-Data Mgmt & Evaluation x--------------------------------------------------x
6-Administration x------------throughout project timeline--------------x