diagnostic accuracy of laser doppler flowmetry versus strain gauge plethysmography for segmental...
TRANSCRIPT

FromSuScDD
SuppJe
AuthRepV(e
Thetom
0741Cophttp
Diagnostic accuracy of laser Doppler flowmetryversus strain gauge plethysmography for segmentalpressure measurementChristian Høyer, MD,a,b Jes Sandermann, MD,c,d Jens Peder D. Paludan, BA,a Susanne Pavar, BA,a andLars J. Petersen, MD, DMSc,e,f Viborg, Aalborg, and Aarhus, Denmark
Objective: To assess the diagnostic accuracy of laser Doppler flowmetry (LDF) with mercury-in-silastic strain gaugeplethysmography (SGP) as a reference test for measuring the toe and ankle pressures in patients with known or suspectedperipheral arterial disease (PAD).Methods: This was a prospective, randomized, blinded diagnostic accuracy study. Toe and ankle pressures weremeasured using both methods in 200 consecutive patients, who were recruited at our vascular laboratory over a periodof 30 working days. Classification of PAD and critical limb ischemia (CLI) was made in accordance with TASC-IIcriteria.Results: The LDF method demonstrated 5.8 mm Hg higher mean toe pressures than the SGP method for the right limband 7.0 mm Hg for the left limb (both P < .001). There were no significant differences in the mean ankle pressures (bothP > .129). The limits of agreement for the differences (SGP L LDF) were L31.7 to 20.2 mm Hg for right toepressures, L28.0 to 14.0 mm Hg for left toe pressures, L25.5 to 22.8 mm Hg for right ankle pressures, and L26.9 to24.6 mm Hg for left ankle pressures. A correlation analysis of the absolute pressures using the two methods showed anintraclass correlation coefficient of 0.902 (95% confidence interval [CI], 0.835-0.938) for right toe pressures, 0.919 (95%CI, 0.782-0.960) for the left toe pressures, 0.953 (95% CI, 0.937-0.965) for right ankle pressures, and 0.952 (95% CI,0.936-0.964) for left ankle pressures. Cohen’s Kappa showed an agreement in the diagnostic classification of k [ 0.775(95% CI, 0.631-0.919) for PAD and k [ 0.780 (95% CI, 0.624-0.936) for CLI.Conclusions: LDF showed a good correlation with SGP over a wide range of toe and ankle pressures, as well as substantialagreement for the diagnostic classification of PAD including CLI. (J Vasc Surg 2013;58:1563-70.)
The diagnosis of peripheral arterial disease (PAD) isa well-described indicator for increased risks of cardiovas-cular disease and death,1 even in the absence of other cardio-vascular risk factors.2 According to intersociety consensusguidelines, PAD can be diagnosed non-invasively bymeasuring the ankle-brachial index (ABI) or the toe-brachial index (TBI).3,4 Furthermore, measuring the toeand ankle pressures can disclose important informationand aid in selecting the optimal treatment regime forpatients with critical limb ischemia (CLI).5 Because thesepatients have low distal limb pressures, it is imperative tohave reliable methods for pressure measurements. Cur-rently, a number of different techniques are used for this
the Department of Clinical Physiologya and Department of Vascularrgery,c Viborg Regional Hospital, Viborg; the Department of Healthience and Technology,b Department of Nuclear Medicine,e andepartment of Clinical Medicine,f Aalborg University, Aalborg; and theepartment of Clinical Medicine, Aarhus University, Aarhus.d
orted by The Morten Scheibel Foundation and The Rosa and Astansen Foundation.or conflict of interest: none.rint requests: Christian Høyer, MD, Department of Clinical Physiology,iborg Regional Hospital, Heibergs Allé 4, DK-8800 Viborg, Denmark-mail: [email protected]).editors and reviewers of this article have no relevant financial relationshipsdisclose per the JVS policy that requires reviewers to decline review of anyanuscript for which they may have a conflict of interest.-5214/$36.00yright � 2013 by the Society for Vascular Surgery.://dx.doi.org/10.1016/j.jvs.2013.06.057
purpose in vascular laboratories and have substantialdifferences in their methodologies.6 Factors such as edema,wounds, hyperemia, and tremor are often present inpatients with PAD, and can influence measurements.7 Thevarious methods in use have different strengths regardingthese entities, which makes diagnostic accuracy studiesusing an appropriate patient pool essential to assessinterchangeability.8
One of the methods for distal pressure measurements isthe mercury-in-silastic strain gauge plethysmography(SGP). This method is based on detection of volumechange and was introduced in the 1960s. It is still consid-ered the method of reference in many vascular laboratoriesin northern Europe, due to the ample validation againstintra-arterial pressure and angiographic findings.9 Anothermethod in use is laser Doppler flowmetry (LDF), which hasbeen applied in micro-vascular research for cutaneous flowmeasurement for three decades.10 LDF has increasinglybeen used for distal pressure measurements over the last10 years. LDF allows measuring capillary flow via the emis-sion of laser light carried by a fiber-optic probe. The lighthits moving blood cells, which leads to a change in thewavelength (the Doppler shift), and the scatter is detectedby a sensor. This method has been shown to be highlysensitive for the detection of low pressures (reducedsignal).11,12 The LDF method has previously beencompared with the SGP method in a small study withacceptable agreement.13 However, it remains unclear
1563

JOURNAL OF VASCULAR SURGERY1564 Høyer et al December 2013
whether these two techniques are fully interchangeable ina clinical setting using patients with a broad diseasespectrum.
METHODS
Design. The study was performed as a prospective,randomized, blinded study following the recommenda-tions of Standards for Reporting Diagnostic AccuracyStudies (STARD)14 and Cochrane Diagnostic Test Accu-racy (DTA)15 requirements in one center (Department ofClinical Physiology, Viborg Regional Hospital, Denmark).
Recruitment of patients. Consecutive patientsreferred for distal blood pressure measurements in theSpring of 2012 were screened for inclusion in the trial.Two hundred patients were scheduled for inclusion inthe study. The eligibility criteria were age >18 years andthe mental capacity for complying with the study proce-dures. Patients were excluded if time constraints from otherprocedures in the lab interfered with the study procedure.The study protocol was approved by the Central DenmarkRegion Committee on Biomedical Research Ethics (M-20110286) and the Danish Data Protection Agency(2007580010).
Demographics. Patient demographics, medication,and medical history were obtained by a questionnaire.The patients’ medical files were reviewed for prior vascularsurgery. The presence of diabetes, chronic kidney disease,and hypercholesterolemia were established based onbiochemical data, current medication, and/or patientrecords.
Experimental procedure. The patients rested ina supine position for at least 15 minutes prior to themeasurements. Adequate limb temperature was providedby heating the lower extremities with heating overlays(Action Shear Smart; Action Products Inc, Hagerstown,Md) at 35�C to 40�C. Room temperature was maintainedat an average of 25.4�C (60.6). Eligible patients wererandomized for measurements by both techniques in oneof the two sequences: (1) SGPtoe pressures�LDFtoe pressures�SGPankle pressures�LDFankle pressures or (2) LDFtoe pressures�SGPtoe pressures�LDFankle pressures�SGPankle pressures. Allpatients were randomized in blocks of four by using opa-que, sealed envelopes to determine the sequence. Measure-ments by the two methods were performed by twodifferent operators blinded to the results of the othertest. Pressure measurements at the toe or ankle level wereconducted in both limbs simultaneously. The same occlu-sion cuffs were used by both systems, and there was norepositioning of the cuffs between tests. The occlusioncuffs were connected to pressure controllers specific foreach device. Appropriately sized pneumatic occlusion cuffs,ranging from 90 to 130 mm � 15 to 25 mm, were used forthe toe pressure measurement, and cuffs ranging from 290to 420 mm � 120 mm were used for the ankle pressuremeasurements. Throughout the measurements, the detec-tors (strain gauge or LDF probe) were placed on thepulp of the toe. The preferred site for the detectors wasthe first toe. If amputations or other restrictions existed
that prevented applying the cuff to the first toe, measure-ments were performed on the second toe. All measure-ments were at least made in duplicate at each measuringsite. The measurements were repeated until two readingswere obtained with a maximum of 10 mm Hg of differ-ence. A maximum of five measurements was performedat each site. Following the measuring sequence, thesegmental pressures were calculated as an average of thetwo measurements with #10 mm Hg in difference. Incases with three pressures obtained with a difference #20mm Hg between the highest and lowest value, an averageof the three was used. The skin temperature of the firsttoe was measured using an infrared thermometer (TN1thermometer; Electronic Temperature Instruments Ltd,Worthing, UK). The operators consisted of 10 laboratorytechnicians who routinely perform distal blood pressuremeasurements in the lab. Their experience with the SGPmethod ranged from 2.8 to 29.3 years (median, 4.8 years).They had no prior experience with LDF but receiveddetailed training before and during the study. In situationswhere measurements could only be obtained by onemethod, that particular measuring site was excluded fromthe comparative analysis.
Diagnostic criteria. PAD was diagnosed accordingto the TASC-II criteria as ABI # 0.90 or TBI < 0.70.3
Findings of low segmental blood pressure (toe pres-sure <30 mmHg and/or ankle pressure <50 mmHg) andconcurrent clinical findings of ischemia (chronic ischemicrest pain, ulcers, or gangrene [ie, Fontaine III-IV]) definedCLI.3
Brachial blood pressure. Brachial blood pressureswere measured in the supine position using an automateddevice (Digital Blood Pressure Monitor, UA-852; A&DInstruments, Abingdon, UK). The blood pressure wasmeasured in both arms, and the side with the highestsystolic pressure was selected as the reference for the ABIand TBI calculations. The brachial pressure was acquiredconcurrently with all separate measurements of the toe andankle pressures.
Measurements with the index test (LDF). TheMoor VMS-LDF (Moor Inc, Axminster, Devon, UK)system was used for the LDF measurements. The twoprobes (VP-1; Moor Inc) were embedded in a moldedflexible socket and secured using adhesive discs. The tubesfrom the occlusion cuffs were connected to the pressurecontroller (Moor VMS-PRES; Moor Inc). Following thepositioning of the probe, an automated protocol wasinitiated that inflated the occlusion cuff (inflation time,approximately 3 seconds) to a pressure selected by theoperator (150-250 mm Hg), well above the systolic armpressure. After a hold period of 10 seconds, the proximalcuff deflated automatically (3 mm Hg/sec) with the probemeasuring skin blood flow throughout the deflation periodwith a sampling rate of 40 Hz. At least 3 months after thecompletion of the study, two independent techniciansreanalyzed the LDF curves without information aboutpatient history, signs, or symptoms. The observers receivedsupervised training in LDF curve interpretation during the

Fig 1. Flow diagram showing patient recruitment. *Not performed due to recent vascular surgery, major wounds, orfracture. LDF, Laser Doppler flowmetry; SGP, strain gauge plethysmography.
JOURNAL OF VASCULAR SURGERYVolume 58, Number 6 Høyer et al 1565
study period and additional training prior to the readings.If one of the two LDF readers deemed the curves fora measuring site unacceptable, this dataset was rejected.The pressure value used for comparison with the referencetest was the average of the pressures found by the twoobservers. The curves were read to the nearest one milli-meter of mercury.
Measurements with reference test (SGP). A Digit-matic DM2000 (Medimatic A/S, Hellerup, Denmark)was used for SGP. A mercury-in-silastic strain gauge waswrapped around the pulp of the toe for all SGP
measurements. Prior to filling the occlusion cuff (inflationtime, <1 second), 10 seconds of manual pressure wasapplied to the pulp of the toe to empty the vascular bed.Prior to inflation of the occlusion cuff at ankle level, thelower limbs were elevated at 50 to 70 cm for 30 secondsprior to inflation to reduce the peripheral blood volume.The deflation time for the occlusion cuff (average, 3 mmHg/sec) and the sensitivity were adjusted appropriately bythe primary technicians according to institutional practice.The pressures were assessed by reading the curves to thenearest 1 millimeter of mercury on site. Because identical

Table I. Patient demographics and clinical characteristics
Total (n ¼ 200)
Male/female 111/89Age, years 71.2 6 10.4Caucasian race 198 (99)BMI, kg/m2 26.0 6 5.4BP systolic, mm Hg 144 6 21BP diastolic, mm Hg 77 6 13Diabetes 52 (26)Chronic kidney insufficiency 49 (25)Arterial hypertension 151 (76)Hypercholesterolemia 167 (84)Myocardial infarction 35 (18)Smokers, current 55 (28)Smokers, former 98 (49)BMI >25 kg/m2 102 (51)Prior lower limb revascularization
Total 94 (47)<1 month 30 (15)
AmputationsToe 8 (4)Lower limb 12 (6)
SymptomsFontaine I 37 (18)Fontaine II 81 (40)Fontaine III 41 (21)Fontaine IV 41 (21)
Department of referralVascular surgery 159 (79)General practitioners 30 (15)Other 11 (6)
BMI, Body mass index; BP, brachial blood pressure; SD, standard deviation.Values are presented as mean 6 SD or number (%).
JOURNAL OF VASCULAR SURGERY1566 Høyer et al December 2013
results of the reading of SGP curves were recently shown inthe clinical situation with blinded reading of SGP curves,blinded re-readings of the SGP curves were not made.16
Statistical analysis. The data are presented as themeans 6 standard deviations. Agreement in diagnosticclassification (PAD/not PAD) was analyzed by using theCohen Kappa (k). A k value ranging from 0.41 to 0.60was considered to show moderate agreement, a valuebetween 0.61 and 0.80 indicated substantial agreement,and a value between 0.81 and 0.99 indicated almost perfectagreement.17 Agreement in pressure values and indices wasassessed using an intraclass correlation coefficient (absoluteagreement, single measures, two-way random model).Reproducibility was assessed using coefficient of variance.Difference-mean plots (Bland-Altman) were constructed toassess the discordance in the range of pressures.18 Limits ofagreement were compared by calculating a 95% confidenceinterval (CI) for upper and lower limits. A paired t-test wasused to compare the means of the variables of the twotechniques, and an unpaired t-test for intragroup compar-isons. A P value < .05 was considered to be statisticallysignificant. Statistical analysis was performed using SPSSsoftware version 20.0 (SPSS Inc, Chicago, Ill).
RESULTS
Patients. A total of 223 patients were screened, and200 patients (90% of referred patients) were included in
the study. The recruitment period lasted 30 working days,from February 20 to April 10, 2012. The patient flowchartis presented in Fig 1. Patient demographics and clinicalinformation are displayed in Table I. The skin temperaturesaveraged 30.8�C (6 1.9�C) during the toe pressuremeasurements and 29.8�C (6 1.8�C) during the anklepressure measurements with no significant difference be-tween the temperatures during the index and reference tests.
Rate of completion. It was possible to perform SGPmeasurements according to our reproducibility criteria in373/376 (99.2%) of the ankle pressure measurementsand in 385/386 (99.7%) of the toe pressure measurements.During the blinded reading of the LDF curves, bothobservers accepted the data quality in 367/376 (97.6%)of the ankle pressures and in 383/386 (99.2%) of the toepressure measurements.
Variation in brachial blood pressures. The meanbrachial blood pressure was 138 6 20 mm Hg duringthe SGP toe pressure measurements and 138 6 21 duringthe LDF toe pressure measurements with no significantdifference between the methods (P ¼ .107). The brachialblood pressure was significantly higher with SPG duringthe ankle measurements than with LDF (140 6 21 mmHg vs 137 6 21 mm Hg; P < .001).
Agreement in segmental pressures and indices. Theabsolute pressures and pressure indices obtained using thetwo methods are compared in Table II. The LDF methodmeasured significantly higher toe pressures than SGP onboth sides, with a mean difference of 5.8 mm Hg for rightlimbs and 7.0 mm Hg for left limbs (both P < .001). Therewere no significant differences between the two methodsregarding mean ankle pressures on either side (both P >.129). The LDF method showed higher values for TBI andABI compared with SGP for both limbs (for all, P < .002).The Bland-Altman plots for toe and ankle pressuremeasurements (Fig 2) did not reveal a systematic differencein any pressure range.
A subgroup analysis was performed for agreement ofpressures and indices in patients with diabetes (n ¼ 52)vs nondiabetics (n ¼ 148), overweight patients (bodymass index >25 kg/m2; n ¼ 102) vs nonoverweightpatients (body mass index <25 kg/m2; n ¼ 98), andpatients with Fontaine I-II (n ¼ 118) vs III-IV (n ¼ 82),respectively. No statistically significant systematic bias wasobserved for the mean difference for the various compari-sons in any of the four measuring sites (all P > .131) exceptfor right toe pressures in overweight patients (P ¼ .042).No significant differences were shown between the limitsof agreement except for significantly higher variation inoverweight vs nonoverweight patients for right toe pres-sures (�34.3-25.5 mm Hg vs �28.0-13.5 mm Hg) andright TBI (�0.28-0.21 vs �0.22-0.12).
A total of 10 ankle pressure measurements were classi-fied as incompressible vessels using the SGP method (ABI>1.40). Two of these were likewise categorized as incom-pressible vessels by LDF, four were categorized ascompressible, and four were rejected by at least oneobserver based on inadequate signal quality.
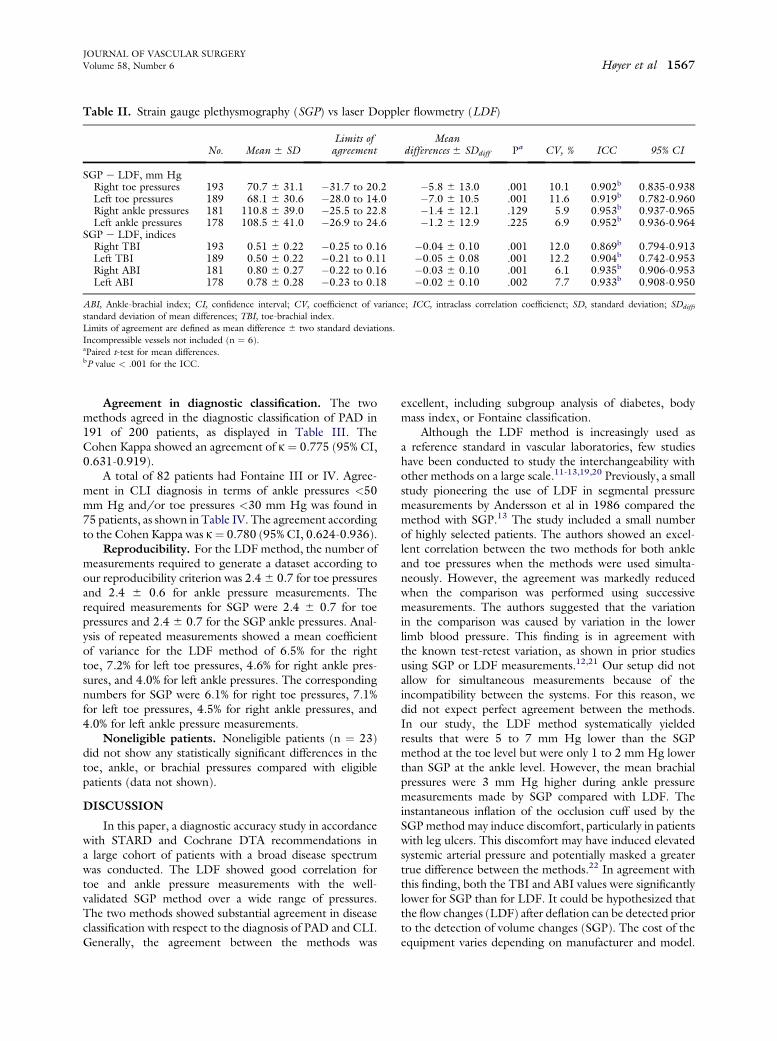
Table II. Strain gauge plethysmography (SGP) vs laser Doppler flowmetry (LDF)
No. Mean 6 SDLimits ofagreement
Meandifferences 6 SDdiff Pa CV, % ICC 95% CI
SGP e LDF, mm HgRight toe pressures 193 70.7 6 31.1 �31.7 to 20.2 �5.8 6 13.0 .001 10.1 0.902b 0.835-0.938Left toe pressures 189 68.1 6 30.6 �28.0 to 14.0 �7.0 6 10.5 .001 11.6 0.919b 0.782-0.960Right ankle pressures 181 110.8 6 39.0 �25.5 to 22.8 �1.4 6 12.1 .129 5.9 0.953b 0.937-0.965Left ankle pressures 178 108.5 6 41.0 �26.9 to 24.6 �1.2 6 12.9 .225 6.9 0.952b 0.936-0.964
SGP e LDF, indicesRight TBI 193 0.51 6 0.22 �0.25 to 0.16 �0.04 6 0.10 .001 12.0 0.869b 0.794-0.913Left TBI 189 0.50 6 0.22 �0.21 to 0.11 �0.05 6 0.08 .001 12.2 0.904b 0.742-0.953Right ABI 181 0.80 6 0.27 �0.22 to 0.16 �0.03 6 0.10 .001 6.1 0.935b 0.906-0.953Left ABI 178 0.78 6 0.28 �0.23 to 0.18 �0.02 6 0.10 .002 7.7 0.933b 0.908-0.950
ABI, Ankle-brachial index; CI, confidence interval; CV, coefficienct of variance; ICC, intraclass correlation coefficienct; SD, standard deviation; SDdiff,standard deviation of mean differences; TBI, toe-brachial index.Limits of agreement are defined as mean difference 6 two standard deviations.Incompressible vessels not included (n ¼ 6).aPaired t-test for mean differences.bP value < .001 for the ICC.
JOURNAL OF VASCULAR SURGERYVolume 58, Number 6 Høyer et al 1567
Agreement in diagnostic classification. The twomethods agreed in the diagnostic classification of PAD in191 of 200 patients, as displayed in Table III. TheCohen Kappa showed an agreement of k ¼ 0.775 (95% CI,0.631-0.919).
A total of 82 patients had Fontaine III or IV. Agree-ment in CLI diagnosis in terms of ankle pressures <50mm Hg and/or toe pressures <30 mm Hg was found in75 patients, as shown in Table IV. The agreement accordingto the Cohen Kappa was k¼ 0.780 (95% CI, 0.624-0.936).
Reproducibility. For the LDF method, the number ofmeasurements required to generate a dataset according toour reproducibility criterion was 2.46 0.7 for toe pressuresand 2.4 6 0.6 for ankle pressure measurements. Therequired measurements for SGP were 2.4 6 0.7 for toepressures and 2.4 6 0.7 for the SGP ankle pressures. Anal-ysis of repeated measurements showed a mean coefficientof variance for the LDF method of 6.5% for the righttoe, 7.2% for left toe pressures, 4.6% for right ankle pres-sures, and 4.0% for left ankle pressures. The correspondingnumbers for SGP were 6.1% for right toe pressures, 7.1%for left toe pressures, 4.5% for right ankle pressures, and4.0% for left ankle pressure measurements.
Noneligible patients. Noneligible patients (n ¼ 23)did not show any statistically significant differences in thetoe, ankle, or brachial pressures compared with eligiblepatients (data not shown).
DISCUSSION
In this paper, a diagnostic accuracy study in accordancewith STARD and Cochrane DTA recommendations ina large cohort of patients with a broad disease spectrumwas conducted. The LDF showed good correlation fortoe and ankle pressure measurements with the well-validated SGP method over a wide range of pressures.The two methods showed substantial agreement in diseaseclassification with respect to the diagnosis of PAD and CLI.Generally, the agreement between the methods was
excellent, including subgroup analysis of diabetes, bodymass index, or Fontaine classification.
Although the LDF method is increasingly used asa reference standard in vascular laboratories, few studieshave been conducted to study the interchangeability withother methods on a large scale.11-13,19,20 Previously, a smallstudy pioneering the use of LDF in segmental pressuremeasurements by Andersson et al in 1986 compared themethod with SGP.13 The study included a small numberof highly selected patients. The authors showed an excel-lent correlation between the two methods for both ankleand toe pressures when the methods were used simulta-neously. However, the agreement was markedly reducedwhen the comparison was performed using successivemeasurements. The authors suggested that the variationin the comparison was caused by variation in the lowerlimb blood pressure. This finding is in agreement withthe known test-retest variation, as shown in prior studiesusing SGP or LDF measurements.12,21 Our setup did notallow for simultaneous measurements because of theincompatibility between the systems. For this reason, wedid not expect perfect agreement between the methods.In our study, the LDF method systematically yieldedresults that were 5 to 7 mm Hg lower than the SGPmethod at the toe level but were only 1 to 2 mm Hg lowerthan SGP at the ankle level. However, the mean brachialpressures were 3 mm Hg higher during ankle pressuremeasurements made by SGP compared with LDF. Theinstantaneous inflation of the occlusion cuff used by theSGPmethod may induce discomfort, particularly in patientswith leg ulcers. This discomfort may have induced elevatedsystemic arterial pressure and potentially masked a greatertrue difference between the methods.22 In agreement withthis finding, both the TBI and ABI values were significantlylower for SGP than for LDF. It could be hypothesized thatthe flow changes (LDF) after deflation can be detected priorto the detection of volume changes (SGP). The cost of theequipment varies depending on manufacturer and model.

Fig 2. Bland-Altman plots showing the difference in toe pressures (top row) and ankle pressures (bottom row) obtainedby strain gauge plethysmography (SGP) vs laser Doppler flowmetry (LDF) for left limbs (left side) and right limbs (rightside), respectively. The lines show the mean (full line) 6 two standard deviations (dotted line).
Table III. Agreement in diagnostic classification ofperipheral arterial disease (PAD)
SGP
LDF
TotalPAD Not PAD
PAD 173 6 179Not PAD 3 18 21Total 176 24 200
LDF, Laser Doppler flowmetry; SGP, strain gauge plethysmography.
Table IV. Agreement in diagnostic classification of criticallimb ischemia (CLI) for patients with Fontaine III-IV
SGP
LDF
TotalCLI Not CLI
CLI 18 5 23Not CLI 2 57 59Total 20 62 82
LDF, Laser Doppler flowmetry; SGP, strain gauge plethysmography.
JOURNAL OF VASCULAR SURGERY1568 Høyer et al December 2013
Cost of common LDF equipment ranges from $20,000 to$50,000 USD. In comparison, the cost of various modelsfor SGP measurements is approximately $35,000 to$70,000 USD. The time to completion of a measurementwas not recorded in this study. The time to obtain onemeasurement was very similar for LDF and SGP, the latterrecently being reported.22
Previous studies on LDF toe pressure measurementshave shown good correlation with other methods, such asphoto-plethysmography.11,12,23,24 In most of these studies,LDF was shown to produce slightly higher pressure readingsthan photo-plethysmography. In general, the studies showeda more pronounced variation between the methods than weencountered in our study. The approach to limb heating

JOURNAL OF VASCULAR SURGERYVolume 58, Number 6 Høyer et al 1569
prior to the tests in the mentioned studies is markedly dif-ferent. Measurements of toe pressures have been shown tobe highly susceptible to distal temperature changes, and ithas been argued that insufficient heating can lead to diseasemisclassification.25 Thus, lower limb heating has been recom-mended to improve standardization.25,26 The LDF signalcan also be optimized by local heating in the vicinity of theprobe, as shown by Ubbink et al in 2004.11 However, thesole use of local heating would likely challenge the test-retest reproducibility due to the effects on limb temperatureby hyperemia induced by inflammation, recent surgery, orseasonal temperature changes, as the measured toe pressurescorrespond to the limb temperature.26 The impact of theselaboratory and clinical conditions on disease classification(PAD/not PAD) remains largely unknown.
Although the mechanism behind the various bloodflow detection systems differs, they share a signal curvethat reflects changes in absolute blood flow/volume incre-ment and return of pulsation.10 It is likely that weak ACsignals are better detected in some techniques than inothers. In agreement with this, LDF has been shown tobe a more sensitive detection method for low pressures(reduced signal) compared with photoplethysmogra-phy.11,12 Accuracy in low pressures is vital because diag-nosing CLI entails measuring toe pressures below 30 mmHg.3 In our study, which included a large proportion ofpatients with recent surgery and distal wounds, the comple-tion rate for the LDF was comparable to that of SGP.
In guideline recommendations, the methods used fortoe or ankle pressure measurements are generally consid-ered fully interchangeable.3,27 However, it is evident thata high level of variation is present among the different tech-niques. It remains undetermined whether that variation isdue to biological blood pressure variation, experimentaltest conditions, or technical variation in the different detec-tion systems. These features complicate the identificationof an optimal laboratory reference standard for themeasurement of segmental blood pressure. Additionally,in order to correctly interpret the readings from the variousmethods on patient management, future studies shouldinclude clinical outcome such as wound healing. SGP isthe only method that has been subjected to comparisonto the true reference standard, which is intra-arterial pres-sure measurement.9,28 However, the findings of our studyindicate a high degree of interchangeability between LDFand SGP for such measurements.
CONCLUSIONS
LDF showed good correlation with SGP over a widerange of toe and ankle pressures as well as substantial agree-ment in the diagnostic classification for PAD includingCLI. The LDF method yielded systematically higher TBIand ABI, as well as higher toe pressure readings thanSGP; however, no significant difference was found in abso-lute ankle pressure measurements.
The authors thank the involved laboratory techniciansfor their contribution and strong commitment to the study.
AUTHOR CONTRIBUTIONS
Conception and design: CH, JS, LPAnalysis and interpretation: CH, JS, JP, SP, LPData collection: CH, JP, SPWriting the article: CH, JS, LPCritical revision of the article: CH, JS, JP, SP, LPFinal approval of the article: CH, JS, JP, SP, LPStatistical analysis: CH, JS, LPObtained funding: Not applicableOverall responsibility: CH
REFERENCES
1. Fowkes FG, Murray GD, Butcher I, Heald CL, Lee RJ, Chambless LE,et al. Ankle brachial index combined with Framingham Risk Score topredict cardiovascular events and mortality: a meta-analysis. JAMA2008;300:197-208.
2. Aboyans V, McClelland RL, Allison MA, McDermott MM,Blumenthal RS, Macura K, et al. Lower extremity peripheral arterydisease in the absence of traditional risk factors. The Multi-EthnicStudy of Atherosclerosis. Atherosclerosis 2011;214:169-73.
3. Norgren L, Hiatt WR, Dormandy JA, Nehler MR, Harris KA,Fowkes FG, et al. Inter-Society Consensus for the Management ofPeripheral Arterial Disease (TASC II). Eur J Vasc Endovasc Surg2007;33(Suppl 1):S1-75.
4. Høyer C, Sandermann J, Petersen LJ. The toe-brachial index in thediagnosis of peripheral arterial disease. J Vasc Surg 2013;58:231-8.
5. Becker F, Robert-Ebadi H, Ricco JB, Setacci C, Cao P, de DG, et al.Chapter I: Definitions, epidemiology, clinical presentation and prog-nosis. Eur J Vasc Endovasc Surg 2011;42(Suppl 2):S4-12.
6. Alnaeb ME, Alobaid N, Seifalian AM, Mikhailidis DP, Hamilton G.Optical techniques in the assessment of peripheral arterial disease. CurrVasc Pharmacol 2007;5:53-9.
7. Wahlberg E, Olofsson P, Swedenborg J, Fagrell B. Effects of localhyperemia and edema on the biological zero in laser Doppler fluxmetry(LD). Int J Microcirc Clin Exp 1992;11:157-65.
8. Whiting PF, Rutjes AW, Westwood ME, Mallett S, Deeks JJ,Reitsma JB, et al. QUADAS-2: a revised tool for the quality assessmentof diagnostic accuracy studies. Ann Intern Med 2011;155:529-36.
9. Carter SA, Lezack JD. Digital systolic pressures in the lower limb inarterial disease. Circulation 1971;43:905-14.
10. Wright CI, Kroner CI, Draijer R. Non-invasive methods and stimuli forevaluating the skin’s microcirculation. J Pharmacol Toxicol Methods2006;54:1-25.
11. Ubbink DT. Toe blood pressure measurements in patients suspected ofleg ischaemia: a new laser Doppler device compared with photo-plethysmography. Eur J Vasc Endovasc Surg 2004;27:629-34.
12. de Graaff JC, Ubbink DT, Legemate DA, de Haan RJ, Jacobs MJ. Theusefulness of a laser Doppler in the measurement of toe blood pres-sures. J Vasc Surg 2000;32:1172-9.
13. Andersson S, Linderholm H, Rinnstrom O, Burlin L. A laser Dopplertechnique for measuring distal blood-pressure: a comparison withconventional strain-gauge technique. Clin Physiol 1986;6:329-35.
14. Bossuyt PM, Reitsma JB, Bruns DE, Gatsonis CA, Glasziou PP,Irwig LM, et al. Towards complete and accurate reporting of studies ofdiagnostic accuracy: the STARD initiative. Standards for Reporting ofDiagnostic Accuracy. Clin Chem 2003;49:1-6.
15. Reitsma JB, Rutjes AWS, Whiting P, Vlassov VV, Leeflang MMG,Deeks JJ. Assessing methodological quality. In: Deeks JJ, Bossuyt PM,Gatsonis C, editors. Cochrane Handbook for Systematic Reviews ofDiagnostic Test Accuracy. 1.0 edition. Oxford, UK: The CochraneCollaboration; 2009.
16. Høyer C, Pavar S, Pedersen BH, Manresa JA, Petersen LJ. Reliability ofmercury-in-silastic strain gauge plethysmography curve reading: influ-ence of clinical clues and observer variation. Scand J Clin Lab Invest2013;73:380-6.
17. Viera AJ, Garrett JM. Understanding interobserver agreement: thekappa statistic. Fam Med 2005;37:360-3.

JOURNAL OF VASCULAR SURGERY1570 Høyer et al December 2013
18. Bland JM, Altman DG. Measuring agreement in method comparisonstudies. Stat Methods Med Res 1999;8:135-60.
19. Beinder E, Hoffmann U, Franzeck UK, Huch A, Huch R, Bollinger A.Laser Doppler technique for the measurement of digital and segmentalsystolic blood pressure. Vasa 1992;21:15-21.
20. Perez-Martin A, Meyer G, Demattei C, Boge G, Laroche JP, Quere I,et al. Validation of a fully automatic photoplethysmographic device fortoe blood pressure measurement. Eur J Vasc Endovasc Surg 2010;40:515-20.
21. Arveschoug AK, Revsbech P, Brochner-Mortensen J. Sources of vari-ation in the determination of distal blood pressure measured using thestrain gauge technique. Clin Physiol 1998;18:361-8.
22. Høyer C, Sandermann J, Petersen LJ. Randomised diagnostic accuracystudy of a fully automated portable device for diagnosing peripheralarterial disease by measuring the toe-brachial index. Eur J VascEndovasc Surg 2013;45:57-64.
23. Wahlberg E, Gush R. A new automated toe blood pressure monitorfor assessment of limb ischemia. Eur J Vasc Endovasc Surg 2002;24:304-8.
24. Widmer LW, Vikatmaa P, Aho P, Lepantalo M, Venermo M. Reli-ability and repeatability of toe pressures measured with laser Doppler
and portable and stationary photoplethysmography devices. Ann VascSurg 2012;26:404-10.
25. McCollum PT, Stanley ST, Kent P, Grouden MC, Moore DJ,Shanik GD. Assessment of arterial disease using digital systolic pressuremeasurement. Ann Vasc Surg 1988;2:349-51.
26. Sawka AM, Carter SA. Effect of temperature on digital systolicpressures in lower limb in arterial disease. Circulation 1992;85:1097-101.
27. Rooke TW, Hirsch AT, Misra S, Sidawy AN, Beckman JA, Findeiss LK,et al; Society for Cardiovascular Angiography and Interventions,Society of Interventional Radiology, Society for Vascular Medicine,Society for Vascular Surgery. 2011 ACCF/AHA Focused Update ofthe Guideline for the Management of Patients with Peripheral ArteryDisease (updating the 2005 guideline): a report of the AmericanCollege of Cardiology Foundation/American Heart Association TaskForce on Practice Guidelines. J Am Coll Cardiol 2011;58:2020-45.
28. Lezack JD, Carter SA. The relationship of distal systolic pressures to theclinical and angiographic findings in limbs with arterial occlusivedisease. Scand J Clin Lab Invest Suppl 1973;128:97-101.
Submitted Apr 17, 2013; accepted Jun 12, 2013.