diagnosis-guided method for identifying … · diagnosis-guided method for identifying...
TRANSCRIPT

DIAGNOSIS-GUIDED METHOD FOR IDENTIFYING MULTI-MODALITY NEUROIMAGING BIOMARKERS ASSOCIATED WITH GENETIC RISK FACTORS IN ALZHEIMER’S DISEASE
XIAOKE HAO1,2, JINGWEN YAN2, XIAOHUI YAO2, SHANNON L. RISACHER2, ANDREW J. SAYKIN2, DAOQIANG ZHANG1, LI SHEN2, FOR THE ADNI
1College of Computer Science and Technology, Nanjing University of Aeronautics and Astronautics, Nanjing, 210016, China
2Department of Radiology & Imaging Science, School of Medicine, Indiana University, Indianapolis,46202,USA
Email: 1,[email protected], [email protected], [email protected], 2{srisache, asaykin}@iupui.edu, [email protected], [email protected]
Many recent imaging genetic studies focus on detecting the associations between genetic markers such as single nucleotide polymorphisms (SNPs) and quantitative traits (QTs). Although there exist a large number of generalized multivariate regression analysis methods, few of them have used diagnosis information in subjects to enhance the analysis performance. In addition, few of models have investigated the identification of multi-modality phenotypic patterns associated with interesting genotype groups in traditional methods. To reveal disease-relevant imaging genetic associations, we propose a novel diagnosis-guided multi-modality (DGMM) framework to discover multi-modality imaging QTs that are associated with both Alzheimer’s disease (AD) and its top genetic risk factor (i.e., APOE SNP rs429358). The strength of our proposed method is that it explicitly models the priori diagnosis information among subjects in the objective function for selecting the disease-relevant and robust multi-modality QTs associated with the SNP. We evaluate our method on two modalities of imaging phenotypes, i.e., those extracted from structural magnetic resonance imaging (MRI) data and fluorodeoxyglucose positron emission tomography (FDG-PET) data in the Alzheimer’s Disease Neuroimaging Initiative (ADNI) database. The experimental results demonstrate that our proposed method not only achieves better performances under the metrics of root mean squared error and correlation coefficient but also can identify common informative regions of interests (ROIs) across multiple modalities to guide the disease-induced biological interpretation, compared with other reference methods.
1. Introduction
Neuroimaging genetics emerges as one of the hottest research topics in recent studies, which identifies genetic variant associations with imaging phenotypes such as structural or functional imaging measures. Since neuroimaging plays an important role in characterizing the neurodegenerative process of many brain disease such as Alzheimer’s disease (AD) [1], the quantitative imaging phenotypes can provide valuable information so that it holds great promise for revealing the complex biological mechanisms of the disease.
Genome-wide association studies (GWAS) have been widely used to identify the associations between single nucleotide polymorphisms (SNPs) and the quantitative traits (QTs) such as neuroimaging measures. To address the high dimensionality of the GWAS data and small effect size of individual SNPs, in recent imaging genetic studies, researchers have developed several generalized multivariate linear regression analysis methods by considering the priori knowledge such as inherent structural information to boost the detection power [2, 3]. Although those methods may have the potential to help discover phenotypic imaging
Pacific Symposium on Biocomputing 2016
108

markers related to some candidate risk SNPs [4], another problem of existing methods in imaging genetics is that the subjects’ diagnosis information (e.g., class labels such as patients or healthy controls) is not fully used for revealing disease-specific imaging genetic associations. More recently, some diagnosis induced methods have been proposed to solve the imaging genetics problem [5, 6]. A two-step strategy was adopted by [5]: 1) initially, the authors identified the voxels that could provide an imaging signature of the disease with high classification accuracy using penalized linear discriminant analysis; 2) then they detected the SNPs associated with the multivariate phenotypic markers discovered in the first step. Moreover, a Bayesian framework for detecting genetic variants associated with a disease while exploiting imaging as an intermediate phenotype was proposed in [6], which was designed to jointly identify relevant imaging and genetic markers simultaneously. In addition, most of imaging genetic studies focus on discovering the associations between single imaging modality (e.g., magnetic resonance imaging (MRI)) and SNPs, while ignoring the underlying interacting relationships among multiple modalities.
With these observations, our general motivation is to identify multimodal imaging phenotypes serving as intermediate traits between a given AD genetic marker and disease status, where we hope to design a simple and powerful model to maximize disease-relevant imaging genetic associations. Accordingly, the ideas introduced in [7, 8] can be adopted and incorporated into the imaging genetics studies. Specifically in [7, 8], subjects’ similarity has been successfully used for designing more powerful multi-modal models on AD classification and clinical score regression solutions, which are inspired by multi-task modeling integrated with the priori relationship between sample data and the corresponding labels in machine learning community [9].
In this study, we propose a novel diagnosis-guided multi-modality (DGMM) framework that considers robust and common regions of interests (ROIs) as well as diagnosis labels such as patients or healthy controls to handle the multi-modality phenotype associations with an AD genetic risk factor. We evaluate our DGMM method on two modalities of phenotypes, i.e., voxel-based measures extracted from structural MRI and fluorodeoxyglucose positron emission tomography (FDG-PET)) scans, as well as apolipoprotein E (APOE) SNP rs429358 (the best known AD genetic risk factor [10, 11]) data from the Alzheimer’s Disease Neuroimaging Initiative (ADNI) cohort. The empirical results show that our method not only yield improved performances under the metrics of correlation coefficient and root mean squared error, but also detect a compact set of consistent and robust ROIs across two imaging modalities which are relevant to the studied genetic risk marker.
2. Method
2.1. Genotype and Phenotype Association
In this section, we systematically develop our computational models to explore the association between a candidate AD risk SNP and multimodal imaging phenotypes. That is, our proposed method mainly addresses the problem based on the general linear (least square) regression approach. Given imaging phenotypes X = [𝑥1, … , 𝑥n, … , 𝑥N]𝑇 ∈ RN×das input and a candidate risk SNP y= [y1, … , yn, … , yN]T ∈ RN as output in the regression model, where N is the number of participants (sample size) and d is the number of imaging phenotype ROIs (feature
Pacific Symposium on Biocomputing 2016
109

dimensionality). The association model is designed to solve:
min𝑤
1
2||𝑦 − X𝑤||2 + 𝜆𝑅(𝑤) (1)
where 𝑅(𝑤) is a regularization term and 𝜆 is the corresponding parameter. The weight vector w measures the relative importance of the imaging phenotypes (i.e., ROI measures) in predicting the response of the SNP.
In the work, the goal of the learned regression model is not to discover relevant SNPs, but to select biologically meaningful imaging phenotypes that are associated jointly with a given risk SNP and the disease status. Using the linear general regression model formulated by Eq (1), we aim to identify interesting imaging phenotypes that can serve as intermediate traits on the pathway from an AD genetic risk factor to the clinical diagnosis.
2.2. Diagnosis-Guided Single-modality Phenotype Association
In this study, we consider the relationship between imaging phenotypes and the diagnosis information among subjects which are not fully used in conventional association analysis methods. More specifically, we will utilize the relationship information among subjects with diagnosis labels, i.e., AD, mild cognitive impairment (MCI) or healthy controls (HC). That is, if subjects are similar to each other in the original diagnosis feature space, their respective response values should be also similar. To solve this problem, we induce a new regularization
term that can preserve the class level diagnosis information:
min𝑤
∑ ||f(xi) − f(xj)||22Sij
Ni,j = 2𝑤TXTLX𝑤 (2)
where S = [Sij] ∈ Rn×n denotes a similarity matrix that measures the similarity between every pair of samples. L = D − S represents a Laplacian matrix, where D is the diagonal matrix with element defined as Dii = ∑ Sij
Nj=1 . Then, the similarity matrix can be defined as:
Sij = { 1, if xi and xj are from the same class
0, otherwise (3)
The penalized term Eq. (2) enforces that, after being mapped into the label space, the distance between the within-class data will be small, which preserves the local neighborhood structure of the same class. We induce the diagnosis labels constraint into the single modality phenotypic solution and then formulate a diagnosis-guided single modality (DGSM) phenotype association model as follows:
min𝑤
1
2||𝑦 − X𝑤||2 + 𝛼𝑤TXTLX𝑤 (4)
The strength of DGSM method is that it explicitly models the priori diagnosis information
Pacific Symposium on Biocomputing 2016
110
among subjects in the objective function that minimize distance within each diagnosis class for selecting the disease-relevant QT associated with the SNP. Especially, the DGSM model can generalize and handle the progressive disease with multi-diagnosis status, comparing to the binary diagnosis analysis methods that were adopted in [5, 6].
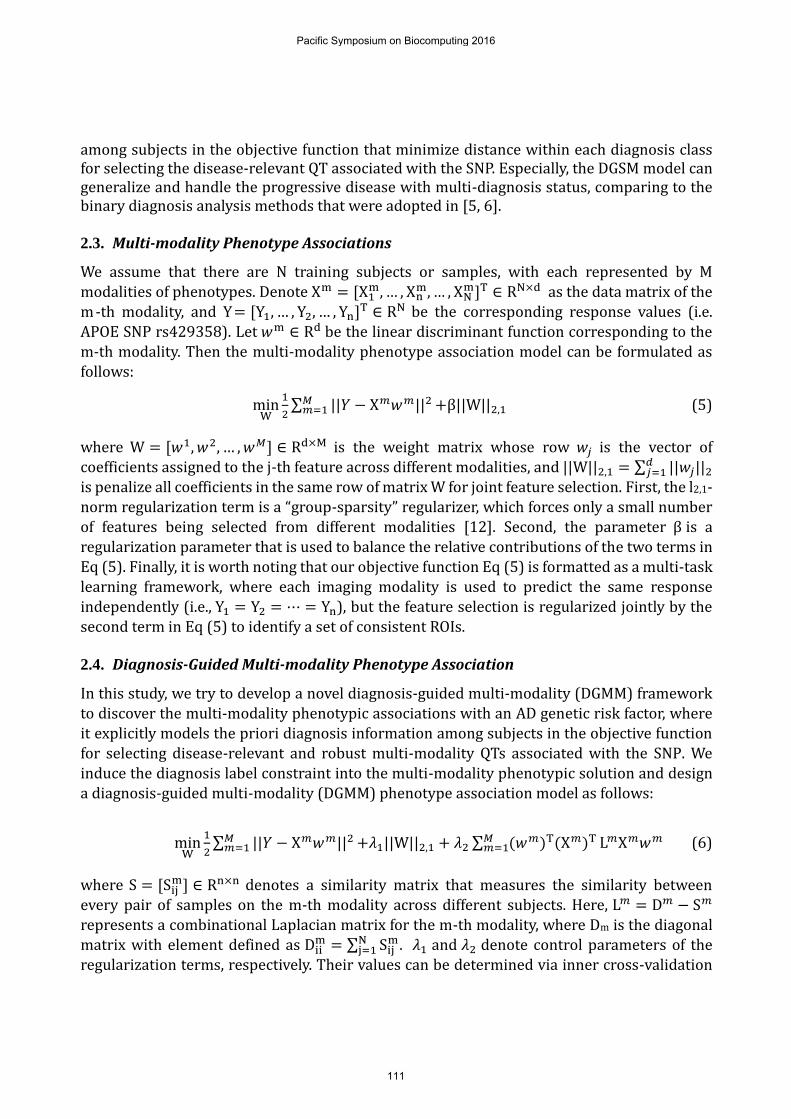
2.3. Multi-modality Phenotype Associations
We assume that there are N training subjects or samples, with each represented by M modalities of phenotypes. Denote Xm = [X1
m, … , Xnm, … , XN
m]T ∈ RN×d as the data matrix of the m -th modality, and Y= [Y1, … , Y2, … , Yn]T ∈ RN be the corresponding response values (i.e.
APOE SNP rs429358). Let 𝑤m ∈ Rd be the linear discriminant function corresponding to the m-th modality. Then the multi-modality phenotype association model can be formulated as follows:
minW
1
2∑ ||𝑌 − X𝑚𝑤𝑚||2𝑀
𝑚=1 +β||W||2,1 (5)
where W = [𝑤1, 𝑤2, … , 𝑤𝑀] ∈ Rd×M is the weight matrix whose row 𝑤𝑗 is the vector of coefficients assigned to the j-th feature across different modalities, and ||W||2,1 = ∑ ||𝑤𝑗||2
𝑑𝑗=1
is penalize all coefficients in the same row of matrix W for joint feature selection. First, the l2,1-norm regularization term is a “group-sparsity” regularizer, which forces only a small number of features being selected from different modalities [12]. Second, the parameter β is a
regularization parameter that is used to balance the relative contributions of the two terms in Eq (5). Finally, it is worth noting that our objective function Eq (5) is formatted as a multi-task learning framework, where each imaging modality is used to predict the same response independently (i.e., Y1 = Y2 = ⋯ = Yn), but the feature selection is regularized jointly by the second term in Eq (5) to identify a set of consistent ROIs.
2.4. Diagnosis-Guided Multi-modality Phenotype Association
In this study, we try to develop a novel diagnosis-guided multi-modality (DGMM) framework to discover the multi-modality phenotypic associations with an AD genetic risk factor, where it explicitly models the priori diagnosis information among subjects in the objective function for selecting disease-relevant and robust multi-modality QTs associated with the SNP. We
induce the diagnosis label constraint into the multi-modality phenotypic solution and design a diagnosis-guided multi-modality (DGMM) phenotype association model as follows:
minW
1
2∑ ||𝑌 − X𝑚𝑤𝑚||2𝑀
𝑚=1 +𝜆1||W||2,1 + 𝜆2 ∑ (𝑤𝑚)T(X𝑚)T𝑀𝑚=1 L𝑚X𝑚𝑤𝑚 (6)
where S = [Sijm] ∈ Rn×n denotes a similarity matrix that measures the similarity between
every pair of samples on the m-th modality across different subjects. Here, L𝑚 = D𝑚 − S𝑚 represents a combinational Laplacian matrix for the m-th modality, where Dm is the diagonal matrix with element defined as Dii
m = ∑ SijmN
j=1 . 𝜆1 and 𝜆2 denote control parameters of the regularization terms, respectively. Their values can be determined via inner cross-validation
Pacific Symposium on Biocomputing 2016
111

on training data. It is promising to find the better solution that is robust to noises or outliers via considering both multimodalities and the rich information inherent in the observations. The objective function can be efficiently solved using the Nesterov’s accelerated proximal
gradient optimization algorithm which was used in [7], which is shown in the Algorithm 1. Firstly, we separate the objective function into the smooth part Eq (7) and non-smooth
part Eq (8) as following:
f(W) =1
2∑ ||Y − Xmwm||2M
m=1 + λ2 ∑ (wm)T(xm)TMm=1 Lmwmxm (7)
g(W) = λ1||W||2,1 (8)
We define the approximation function Eq (9) as following, which is composited by the above smooth part and non-smooth one:
Ω(W, Wi) = f(Wi) + (W − Wi, ∇f(Wi)) +l
2||W − Wi||F
2 + g(W) (9)
where|| ∙ ||F2 denotes the Frobenius norm, ∇f(Wi) denotes the gradient of f(W) on point Wi at
the i-th iteration, and l is the step size. Then, the update step of Nesterov’s APG is defined as:
Wi+1 = arg minW
1
2||W − V||
F
2+
1
lg(W)=arg min
w1,w2,…,wd
1
2∑ ||wj − vj||2
2dj=1 +
λ2
l||wj||2 (10)
where wj and vj denote the j-th row of the matrix W and V, respectively. NAGP performs a simple step of gradient descent to go from Wi to V, and then it slide a little bit further than
V = Wi −1
l∇f(Wi) (11)
Therefore, through Eq (9), this problem can be decomposed into d separate sub-problems. The key of APG algorithm is how to solve the update step efficiently. The analytical solutions of
those sub-problems can be easily obtained:
wj∗ = {
(||vj||
2−
λ2l
||vj||2
) vj, if ||vj||2
>λ2
l
0, otherwise
(12)
Instead of performing gradient descent based on Wi, we compute the search point as:
Zi = (1 + αi)Wi − αiWi−1 (13)
Pacific Symposium on Biocomputing 2016
112
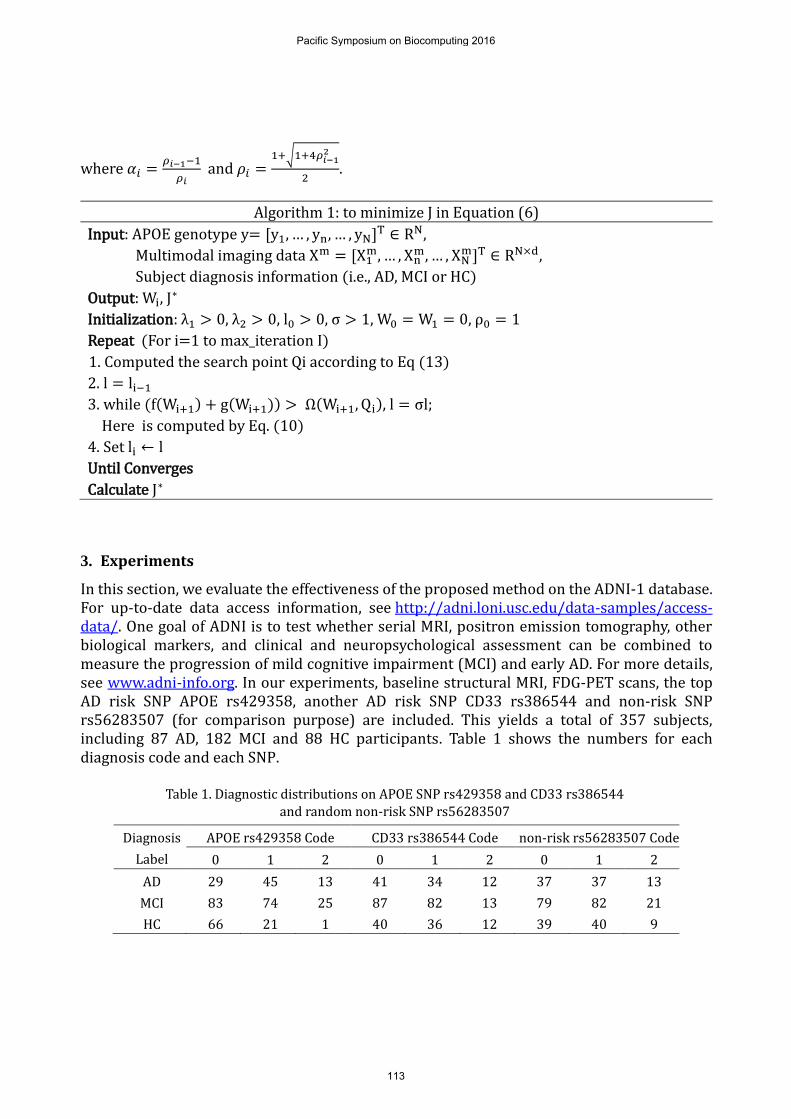
where 𝛼𝑖 =𝜌𝑖−1−1
𝜌𝑖 and 𝜌𝑖 =
1+√1+4𝜌𝑖−12
2.
Algorithm 1: to minimize J in Equation (6)
Input: APOE genotype y= [y1, … , yn, … , yN]T ∈ RN,
Multimodal imaging data Xm = [X1m, … , Xn
m, … , XNm]T ∈ RN×d,
Subject diagnosis information (i.e., AD, MCI or HC)
Output: Wi, J∗
Initialization: λ1 > 0, λ2 > 0, l0 > 0, σ > 1, W0 = W1 = 0, ρ0 = 1
Repeat (For i=1 to max_iteration I)
1. Computed the search point Qi according to Eq (13)
2. l = li−1
3. while (f(Wi+1) + g(Wi+1)) > Ω(Wi+1, Qi), l = σl;
Here is computed by Eq. (10)
4. Set li ← l
Until Converges
Calculate J∗
3. Experiments
In this section, we evaluate the effectiveness of the proposed method on the ADNI-1 database. For up-to-date data access information, see http://adni.loni.usc.edu/data-samples/access-data/. One goal of ADNI is to test whether serial MRI, positron emission tomography, other biological markers, and clinical and neuropsychological assessment can be combined to measure the progression of mild cognitive impairment (MCI) and early AD. For more details, see www.adni-info.org. In our experiments, baseline structural MRI, FDG-PET scans, the top AD risk SNP APOE rs429358, another AD risk SNP CD33 rs386544 and non-risk SNP rs56283507 (for comparison purpose) are included. This yields a total of 357 subjects, including 87 AD, 182 MCI and 88 HC participants. Table 1 shows the numbers for each diagnosis code and each SNP.
Table 1. Diagnostic distributions on APOE SNP rs429358 and CD33 rs386544 and random non-risk SNP rs56283507
Diagnosis
Label
APOE rs429358 Code CD33 rs386544 Code non-risk rs56283507 Code
0 1 2 0 1 2 0 1 2
AD 29 45 13 41 34 12 37 37 13
MCI 83 74 25 87 82 13 79 82 21
HC 66 21 1 40 36 12 39 40 9
Pacific Symposium on Biocomputing 2016
113

3.1. Imaging Phenotype Data
The SPM Statistical Parametric Mapping software package (SPM version 12, for more details, see www.fil.ion.ucl.ac.uk/spm/software/) was used to: (1) create normalized gray matter density maps from MRI data in the standard MNI space, and (2) register the FDG-PET scans into the same space. The MarsBaR ROI toolbox [13] was used to extract mean gray matter density and FDG-PET glucose utilization values for each of 116 MarsBaR ROIs. These measures were pre-adjusted for age, gender, handedness and education.
3.2. Genotype Data
APOE (located on chromosome 19) has a key role in coordinating the mobilization and redistribution of cholesterol, phospholipids, and fatty acids, and it is implicated in mechanisms such as neuronal development, brain plasticity, and repair functions [14]. In imaging genetics research experiments, several whole-brain studies focused on mapping this risk genetic variable [10, 11]. In this work, we focused on studying the susceptibility SNP rs429358, which was determined using APOE ɛ2/ɛ3/ɛ4 status information from the ADNI clinical database for each participant. We also selected another AD risk SNP CD33 rs386544 and a random non-risk SNP rs56283507 for the comparison purpose to evaluate the performance of the proposed model.
3.3. Experimental Settings
In our experiment, for the input of multimodal imaging phenotypes, we normalized the FDG and VBM whose ranges are -5.29 to 6.49 and -5.34 to 4.73, respectively. For the outcome, each SNP value is coded in an additive fashion as 0, 1 or 2, indicating the number of minor alleles. We have inserted this information in our revised manuscript. 5-fold cross-validation strategy was adopted to evaluate the effectiveness of our proposed method. As for parameters of regularization, we determined the values by nested 5-fold cross-validation on the training set. In current studies, we used SM (denoting single modality based method with Lasso [15] to detect a sparse significant subset from imaging phenotypic features (i.e., ROIs)), MC (denoting modalities concatenation with Lasso to detect a sparse subset from imaging phenotypes), MM (denoting multi-modality method to detect imaging phenotypes from a sparse subset of common ROIs), DGSM, DGMC and DGMM (the standard SM, MC and MM with DG, respectively, where DG denotes the diagnosis-guided strategy).
3.4. Results
We compare our proposed diagnosis-guided based methods (including DGSM, DGMC and DGMM) with conventional methods (including SM, MC and MM), respectively. The performance on each dataset is assessed with root mean squared error (RMSE) and correlation coefficient (CC) between actual and predicted response values, which are widely used in measuring performances of regression and association analysis. The average results of RMSE and CC among the 5-fold test on MRI-VBM and FDG-PET modalities are calculated respectively as shown in Table 2 and Table 3. The corresponding values on the whole test data entirety (denoted Ent for short) are included in both tables, where predicted values from all
Pacific Symposium on Biocomputing 2016
114

cross-validation trials are pulled together for calculating a single RMSE or CC. As shown in Table 2, the proposed DG based methods consistently outperform their non-
DG based methods in the RMSE performance measure. This demonstrates that diagnosis-guided information can help improve regression performance from imaging phenotypes to genotype. DGMM and DGMC methods yield the best RMSE values of 0.9097 and 0.9096. Compared with the DG strategy, the joint regularization across multiple modalities showed negative effects on the RMSE performance in some cases (e.g., from SM to MM). Regarding the CC results in Table 3, our proposed method shows the best CC of 0.1499 with the MRI-VBM modality. The best CC of 0.1471 is obtained by DGMM in terms of the FDG measure while the second best performance is 0.1140 by our DGMM method. These results demonstrate the proposed methods can take advantage of consistent and robust multimodality information to find more important associations. Compared with the joint regularization across multiple modalities, the DG strategy had very limited contributions in most cases except the DGMM on MRI-VBM (compared with MM).
Table 2. Comparison of regression performances of the competing methods in terms of Root Mean Square Error (RMSE)
Method MRI-VBM FDG-PET
(Mean ± Std) 5-fold Ent (Mean ± Std) 5-fold Ent
SM 1.0103±0.1123 1.0185 0.9538±0.0549 0.9569
DGSM 0.9097±0.0342 0.9107 0.9205±0.0446 0.9225
MC 0.9547±0.1088 0.9635 0.9127±0.0364 0.9138
DGMC 0.9096±0.0342 0.9635 0.9096±0.0342 0.9106
MM 1.3358±0.1081 1.3417 1.2267±0.0400 1.2280
DGMM 0.9097±0.0342 0.9107 0.9097±0.0342 0.9106
Table 3. Comparison of regression performances of the competing methods in terms of Correlation Coefficient (CC)
Method MRI-VBM FDG-PET
(Mean ± Std) 5-fold Ent (Mean ± Std) 5-fold Ent
SM -0.0154±0.1015 -0.0997 -0.1307±0.1323 -0.0557
DGSM 0.0090±0.1326 0.0039 -0.0322±0.0857 0.0363
MC -0.0913± 0.1609 0.0345 0.0164±0.0605 -0.1037
DGMC -0.0241±0.1318 -0.0650 -0.0354±0.1251 0.0525
MM 0.0928±0.0796 0.0886 0.1471±0.0804 0.1492
DGMM 0.1499±0.0384 0.1465 0.1140±0.0780 0.1002
We also selected another AD risk SNP CD33 rs386544 and a random SNP rs56283507 as
the comparison to evaluate the performance on the proposed model. As shown in Table 4, the DGMM method with APOE rs429358 yield the best RMSE and CC performance measures, which outperform the same method involved the CD33 rs386544 or the random SNP. This
Pacific Symposium on Biocomputing 2016
115

matches our expectation, since the APOE SNP has a larger effect size than the CD33 SNP and the random SNP. The originality of the work is to make full use of the risk genotype and corresponding disease samples to find the intermediate phenotype between an AD genetic marker and the disease status. For evaluation purpose, it is desired to select the top AD risk SNP to demonstrate our proposed model.
Table 4. Comparison performances (RMSEs and CCs) in our proposed model with top risk SNP APOE rs429358, another risk SNP CD33 rs386544, and a random non-risk SNP rs56283507.
Candidate SNPs MRI-VBM FDG-PET
RMSE CC RMSE CC
APOE-rs429358 0.9097±0.0342 0.1499±0.0384 0.9097±0.0342 0.1140±0.0780
CD33-rs386544 0.9123±0.0779 0.0582±0.1134 0.9123±0.0779 0.0960±0.0823
rs56283507 0.9628±0.0346 0.0677±0.1495 0.9628±0.0346 0.0125±0.0686
Besides the improved performances, one major goal of this study is to identify some
significant and robust phenotypes that are highly correlated to risk genotype marker to capture imaging genetics associations in AD research.
Fig. 1. Visualization of the top 10 VBM ROIs selected by the proposed method.
The top 10 selected MRI-VBM imaging features, as well as their average regression
coefficients on 5-fold test, are visualized in Fig. 1 by mapping them onto the human brain. The colors of the selected brain regions indicate the regression coefficients of the corresponding MRI-VBM markers. As expected, Hippocampus_Left, Hippocampus_Right and Amygdala_Left have been detected on top 10 ROIs associated with risk genotype biomarker by the proposed DGMM method. It’s worth noting that these stable markers are in accordance with the existing
Pacific Symposium on Biocomputing 2016
116
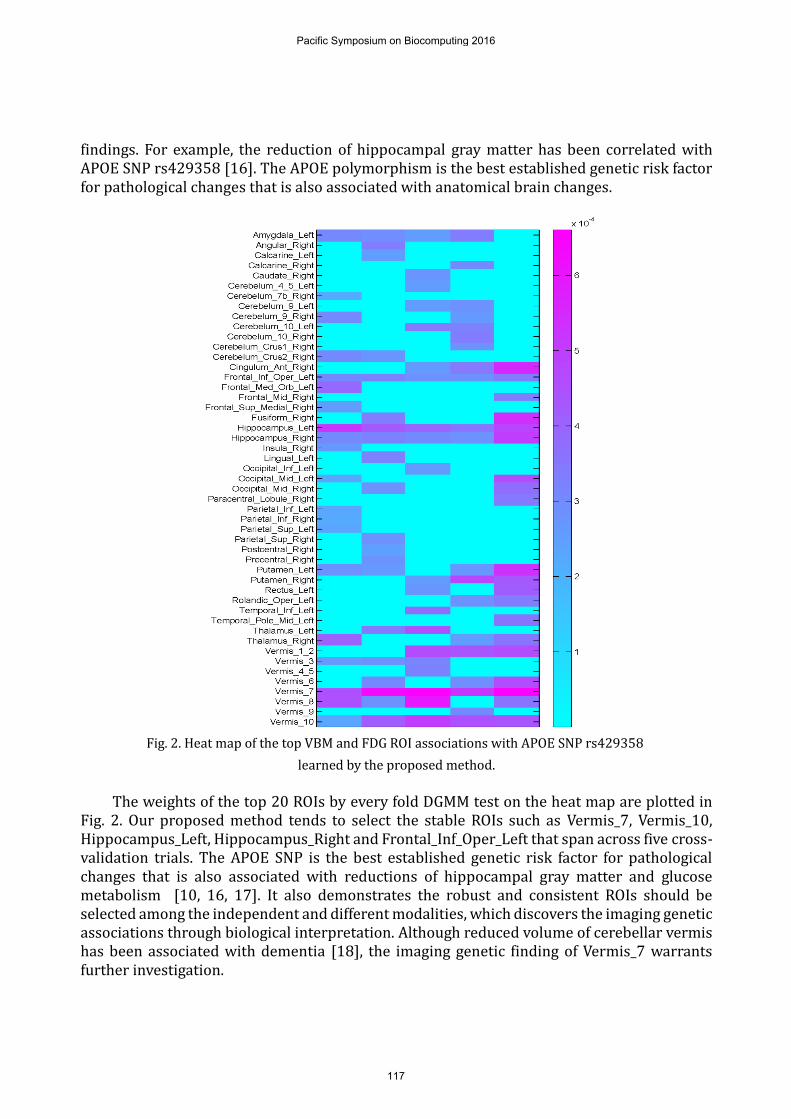
findings. For example, the reduction of hippocampal gray matter has been correlated with APOE SNP rs429358 [16]. The APOE polymorphism is the best established genetic risk factor for pathological changes that is also associated with anatomical brain changes.
Fig. 2. Heat map of the top VBM and FDG ROI associations with APOE SNP rs429358
learned by the proposed method.
The weights of the top 20 ROIs by every fold DGMM test on the heat map are plotted in
Fig. 2. Our proposed method tends to select the stable ROIs such as Vermis_7, Vermis_10, Hippocampus_Left, Hippocampus_Right and Frontal_Inf_Oper_Left that span across five cross-validation trials. The APOE SNP is the best established genetic risk factor for pathological changes that is also associated with reductions of hippocampal gray matter and glucose metabolism [10, 16, 17]. It also demonstrates the robust and consistent ROIs should be selected among the independent and different modalities, which discovers the imaging genetic associations through biological interpretation. Although reduced volume of cerebellar vermis has been associated with dementia [18], the imaging genetic finding of Vermis_7 warrants further investigation.
Pacific Symposium on Biocomputing 2016
117

4. Conclusion
In this study, we have developed a diagnosis-guided multi-modality (DGMM) framework for identifying neuroimaging phenotype associations with risk genetic biomarkers. This approach explicitly models the priori diagnosis information among subjects in the objective function for selecting the most relevant and robust multi-modality QTs (i.e., MRI-VBM and FDG-PET) associated with top risk SNP (i.e., APOE rs429358). Experimental results on the ADNI database showed that our proposed DGMM method not only achieved better prediction performances under the metrics of correlation coefficient and root mean squared error compared with other single modality and non-diagnosis-guided methods, but also detected a compact set of robust and consistent ROIs across the multimodal phenotypes among the populations to guide the disease-induced biological interpretation. The similar model can be also extended to the investigation of association analyses between multi-modal brain imaging measures and any other biomarkers such as those in cerebrospinal fluid. Furthermore, the DGMM framework can be applied to other genetic associated diseases to investigate the complex biological mechanisms from genetics to intermediate traits to diagnostic outcome. An interesting future direction is to improve the efficiency of our implementation and apply it to larger scale studies such as analyzing high dimensional voxel based imaging data as well as a comprehensive set of genetic risk factors.
Acknowledgements
Data collection and sharing for this project was funded by the Alzheimer's Disease Neuroimaging Initiative (ADNI) (National Institutes of Health Grant U01 AG024904) and DOD ADNI (Department of Defense award number W81XWH-12-2-0012). ADNI is funded by the National Institute on Aging, the National Institute of Biomedical Imaging and Bioengineering, and through generous contributions from the following: AbbVie, Alzheimer’s Association; Alzheimer’s Drug Discovery Foundation; Araclon Biotech; BioClinica, Inc.; Bio-gen; Bristol-Myers Squibb Company; CereSpir, Inc.; Eisai Inc.; Elan Pharmaceuticals, Inc.; Eli Lilly and Company; EuroImmun; F. Hoffmann-La Roche Ltd and its affiliated company Genentech, Inc.; Fujirebio; GE Healthcare; IXICO Ltd.; Janssen Alzheimer Immunotherapy Research & Development, LLC.; Johnson & Johnson Pharmaceutical Research & Development LLC.; Lumosity; Lundbeck; Merck & Co., Inc.; Meso Scale Diagnostics, LLC.; NeuroRx Research; Neurotrack Technologies; Novartis Pharmaceuticals Corporation; Pfizer Inc.; Piramal Imaging; Servier; Takeda Pharmaceutical Company; and Transition Therapeutics. The Canadian Institutes of Health Research is providing funds to support ADNI clinical sites in Canada. Private sector contributions are facilitated by the Foundation for the National Institutes of Health (www.fnih.org). The grantee organization is the Northern California Institute for Research and Education, and the study is coordinated by the Alzheimer's Disease Cooperative Study at the University of California, San Diego. ADNI data are disseminated by the Laboratory for Neuro Imaging at the University of Southern California. This research is supported by the NNSFC (Nos. 61422204, 61473149), the JNSFDYS (No. BK20130034), the SRFDPHE (No. 20123218110009), the NFRF (No. NE2013105), the Jiangsu Qinglan Project of China and NUAA Ph.D student short-term visiting scholar project. At Indiana University, this work was
Pacific Symposium on Biocomputing 2016
118

supported by NIH R01 LM011360, U01 AG024904, RC2 AG036535, R01 AG19771, P30 AG10133, UL1 TR001108, R01 AG 042437, and R01 AG046171; NSF IIS-1117335; DOD W81XWH-14-2-0151, W81XWH-13-1-0259, and W81XWH-12-2-0012; NCAA 14132004; and CTSI SPARC Program.
References
1. D. C. Glahn, P. M. Thompson and J. Blangero,Human Brain Mapping, 28, 488, (2007). 2. D. P. Hibar, O. Kohannim, J. L. Stein, M. C. Chiang and P. M. Thompson,Front Genet, 2, 73,
(2011). 3. T. Ge, G. Schumann and J. Feng,Quantitative Biology, 1, 227, (2013). 4. H. Wang, F. P. Nie, H. Huang, J. W. Yan, S. Kim, K. Nho, S. L. Risacher, A. J. Saykin, L. Shen and
A. s. D. N. Initi,Bioinformatics, 28, I619, (2012). 5. M. Vounou, E. Janousova, R. Wolz, J. L. Stein, P. M. Thompson, D. Rueckert, G. Montana and
A. D. N. Initia,Neuroimage, 60, 700, (2012). 6. N. K. Batmanghelich, A. V. Dalca, M. R. Sabuncu and G. Polina,Inf Process Med Imaging, 23,
766, (2013). 7. B. Jie, D. Q. Zhang, B. Cheng and D. G. Shen,Medical Image Computing and Computer-
Assisted Intervention (Miccai 2013), Pt I, 8149, 275, (2013). 8. X. F. Zhu, H. I. Suk and D. G. Shen,Medical Image Computing and Computer-Assisted
Intervention - Miccai 2014, Pt Iii, 8675, 401, (2014). 9. M. Belkin, P. Niyogi and V. Sindhwani,Journal of Machine Learning Research, 7, 2399,
(2006). 10. Y. Liu, J. T. Yu, H. F. Wang, P. R. Han, C. C. Tan, C. Wang, X. F. Meng, S. L. Risacher, A. J. Saykin
and L. Tan,J Neurol Neurosurg Psychiatry, 86, 127, (2015). 11. N. Filippini, A. Rao, S. Wetten, R. A. Gibson, M. Borrie, D. Guzman, A. Kertesz, I. Loy-English,
J. Williams, T. Nichols, B. Whitcher and P. M. Matthews,Neuroimage, 44, 724, (2009). 12. M. Yuan and Y. Lin,Journal of the Royal Statistical Society Series B-Statistical Methodology,
68, 49, (2006). 13. N. Tzourio-Mazoyer, B. Landeau, D. Papathanassiou, F. Crivello, O. Etard, N. Delcroix, B.
Mazoyer and M. Joliot,Neuroimage, 15, 273, (2002).
14. R. W. Mahley,Science, 240, 622, (1988). 15. R. Tibshirani,Journal of the Royal Statistical Society: Series B (Statistical Methodology), 73,
273, (2011). 16. H. A. Wishart, A. J. Saykin, T. W. McAllister, L. A. Rabin, B. C. McDonald, L. A. Flashman, R. M.
Roth, A. C. Mamourian, G. J. Tsongalis and C. H. Rhodes,Neurology, 67, 1221, (2006). 17. E. M. Reiman, R. J. Caselli, L. S. Yun, K. Chen, D. Bandy, S. Minoshima, S. N. Thibodeau and D.
Osborne,N Engl J Med, 334, 752, (1996). 18. L. Baldacara, J. G. Borgio, W. A. Moraes, A. L. Lacerda, M. B. Montano, S. Tufik, R. A. Bressan,
L. R. Ramos and A. P. Jackowski,Rev Bras Psiquiatr, 33, 122, (2011).
Pacific Symposium on Biocomputing 2016
119