diagnosing the weather-climate system
TRANSCRIPT

Earth System Research LaboratoryPhysical Sciences DivisionDiagnosing the weather-climate system
What does the Physical Sciences Division do for the nation?The Physical Sciences Division (PSD) of the Earth System Research Laboratory (ESRL) analyzes and interprets physical processes that influence weather and climate variations from days to decades, and works with partners in other federal and state agencies and universities to provide scientific information necessary for cost-effective decision making. A major effort is to improve predictions on weather-to-climate time scales by identifying early warning indicators in atmosphere and ocean patterns that could cause extreme events (such as floods, droughts, and heat waves). To do this we develop new tools including new observing technology and methods to evaluate the accuracy of computer models of the Earth System.
In-House PartnersPSD hosts the program management for the National Integrated Drought Information System (NIDIS), and the University of Colorado Western Water Assessment, part of NOAA’s Regional Integrated Science and Assessment (RISA) program. PSD also leads NOAA’s Hydrometeorology Testbed (HMT). These collocated activities motivate and link water research (prediction too much or too little water) to societal needs.
What does PSD do? • Leads national and international field programs to observe and measure the be-
havior of the atmosphere over land, oceans, ice, and snow.
• Studies Earth system processes in NOAA’s challenge areas of water, climate vari-ability, and extreme events.
• Identifies early warning indicators in the Earth system that can help improve pre-dictions at weather and climate time scales.
• Pioneers research to explain weather and climate extreme events based on rigor-ous evaluation of observed conditions and state-of-the-art computer simulations.
• Leads an innovative effort to reconstruct the Earth’s atmospheric weather and climate patterns using only surface pressure data back to 1870 that puts today’s weather and climate extremes in the context of the past.
• Develops observing technologies, data analyses, and applications that support decision making for water resource management and wind energy production.
• Advances numerical representations of physical processes in computer models and evaluates the performance of these models across weather and climate time scales.
• Helps NOAA formulate its scientific vision and contributes to national and interna-tional assessments (led four NOAA Science Challenge Workshops).
Improving our ability to observe the Earth system:
Advancing the goal of a network of networks for regional weather forecasting – applications to wind energy:
Water: Too much. Working with meteorologists, climatologists and others to improve observation and forecasting of severe land-falling storms that cause flooding in U.S. western coastal areas:
Other Partners• Bureau of Reclamation• California Dept. of Water Resources• Department of Energy/National
Renewable Energy Laboratory• NASA• National Drought Mitigation Center• NOAA National Marine Fisheries
Service/Fisheries Science Centers
• NOAA National Weather Service/ Climate Prediction Center and Office of Hydrological Development
• Scripps Institution of Oceanography• Sonoma County Water Agency• U. S. Army Corps of Engineers• U. S. Geological Survey• Western States Water Council
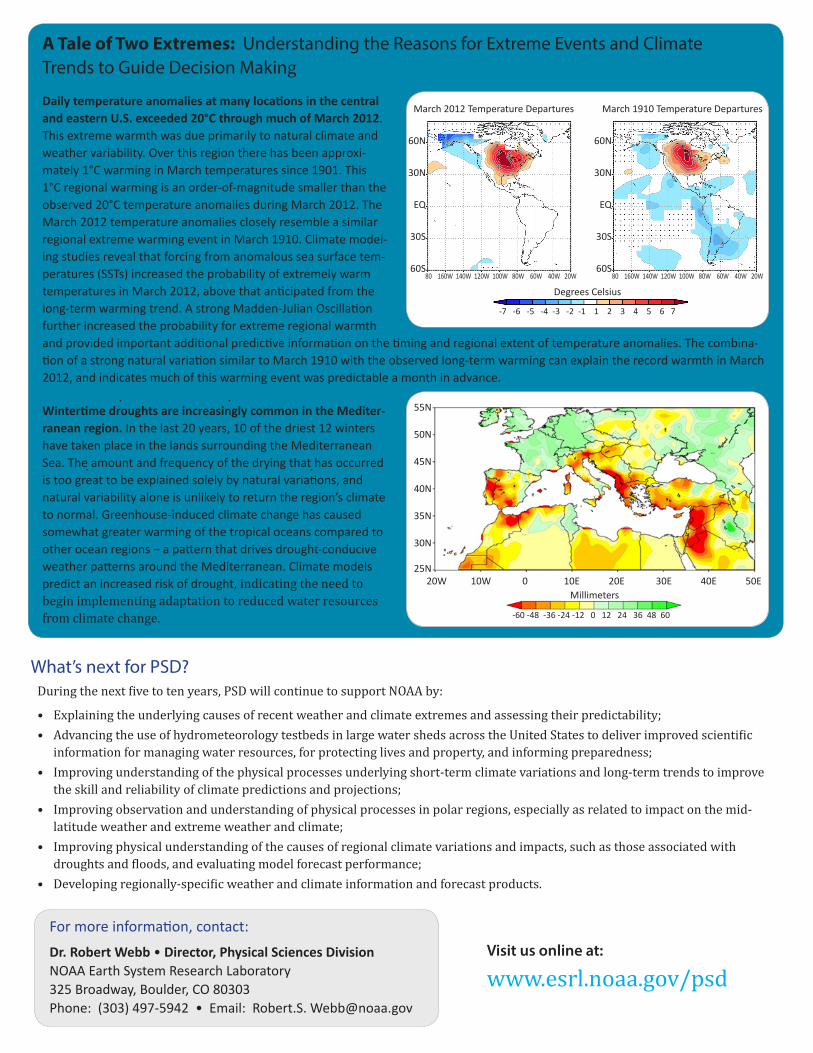
Daily temperature anomalies at many locations in the central and eastern U.S. exceeded 20°C through much of March 2012. This extreme warmth was due primarily to natural climate and weather variability. Over this region there has been approxi-mately 1°C warming in March temperatures since 1901. This 1°C regional warming is an order-of-magnitude smaller than the observed 20°C temperature anomalies during March 2012. The March 2012 temperature anomalies closely resemble a similar regional extreme warming event in March 1910. Climate model-ing studies reveal that forcing from anomalous sea surface tem-peratures (SSTs) increased the probability of extremely warm temperatures in March 2012, above that anticipated from the long-term warming trend. A strong Madden-Julian Oscillation further increased the probability for extreme regional warmth and provided important additional predictive information on the timing and regional extent of temperature anomalies. The combina-tion of a strong natural variation similar to March 1910 with the observed long-term warming can explain the record warmth in March 2012, and indicates much of this warming event was predictable a month in advance.
Wintertime droughts are increasingly common in the Mediter-ranean region. In the last 20 years, 10 of the driest 12 winters have taken place in the lands surrounding the Mediterranean Sea. The amount and frequency of the drying that has occurred is too great to be explained solely by natural variations, and natural variability alone is unlikely to return the region’s climate to normal. Greenhouse-induced climate change has caused somewhat greater warming of the tropical oceans compared to other ocean regions – a pattern that drives drought-conducive weather patterns around the Mediterranean. Climate models predict an increased risk of drought, indicating the need to begin implementing adaptation to reduced water resources from climate change.
What’s next for PSD?During the next five to ten years, PSD will continue to support NOAA by:
• Explaining the underlying causes of recent weather and climate extremes and assessing their predictability;• Advancing the use of hydrometeorology testbeds in large water sheds across the United States to deliver improved scientific
information for managing water resources, for protecting lives and property, and informing preparedness;• Improving understanding of the physical processes underlying short-term climate variations and long-term trends to improve
the skill and reliability of climate predictions and projections;• Improving observation and understanding of physical processes in polar regions, especially as related to impact on the mid-
latitude weather and extreme weather and climate;• Improving physical understanding of the causes of regional climate variations and impacts, such as those associated with
droughts and floods, and evaluating model forecast performance;• Developing regionally-specific weather and climate information and forecast products.
For more information, contact:
Dr. Robert Webb • Director, Physical Sciences DivisionNOAA Earth System Research Laboratory325 Broadway, Boulder, CO 80303Phone: (303) 497-5942 • Email: Robert.S. [email protected]
A Tale of Two Extremes: Understanding the Reasons for Extreme Events and Climate Trends to Guide Decision Making
www.esrl.noaa.gov/psdVisit us online at:
Degrees Celsius
-7 -6 -5 -4 -3 -2 -1 1 2 3 4 5 6 7
March 1910 Temperature DeparturesMarch 2012 Temperature Departures
60N
30N
EQ
30S
60S
60N
30N
EQ
30S
60S 80 160W 140W 120W 100W 80W 60W 40W 20W 80 160W 140W 120W 100W 80W 60W 40W 20W
Millimeters
-60 -48 -36 -24 -12 0 12 24 36 48 60
55N
50N
45N
40N
35N
30N
25N20W 10W 0 10E 20E 30E 40E 50E