diabetes associated with environmental exposure to...
TRANSCRIPT
Diabetes Associated with Environmental Exposure to Arsenic:
The Phenotype and Mechanisms
Miroslav Stýblo, PhD
Department of Nutrition
Gillings School of Global Public Health
University of North Carolina
at Chapel Hill

Outline
2. Metabolism of Inorganic Arsenic
3. Adverse Effects of iAs Exposure: Diabetes
1. Arsenic in the Environment: Sources of Exposure
4. Research at UNC Chapel Hill – ViCTER: a) Mechanistic studies using adipocytes b) Population studies in Mexico c) Animal studies d) Mechanistic studies using pancreatic islets e) Metabolomic and epigenetic profiling
5. Conclusions and Future Directions
6. Acknowledgements

Arsenic in the Environment: Sources of Exposure

Natural Sources of Arsenic: 20th most common element in Earth crust
• Metal ores, minerals, and geological formations
• Surface and underground water reservoirs
• Biosphere: microorganisms, animals and plants
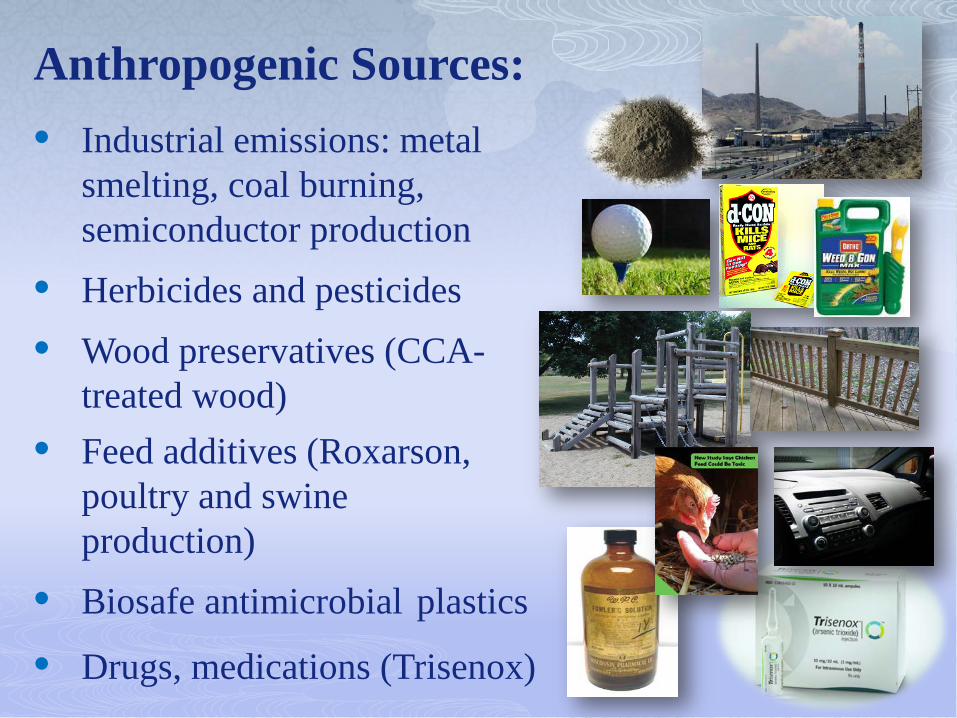
• Industrial emissions: metal smelting, coal burning, semiconductor production • Herbicides and pesticides • Wood preservatives (CCA- treated wood)
Anthropogenic Sources:
• Feed additives (Roxarson, poultry and swine production) • Biosafe antimicrobial plastics
• Drugs, medications (Trisenox)

Inorganic Arsenic (iAs) in Drinking Water Reservoirs
Over 40 million in Southeast Asia alone are exposed to As in drinking water; hundreds of thousands suffer of chronic arsenicosis

~14 million US residents drink water with arsenic levels >10 μg/L
Max. arsenic level = 800 ppb 1,436 wells contaminated above 10 ppb
Hundreds exceeded 50 ppb 43 million drink water from unregulated private wells
iAs in the U.S. Drinking Water Supplies…
North Carolina
75,000 people

Metabolism of Inorganic Arsenic

Metabolism = Detoxification of iAs (?)
Enzymatic reduction of iAsV to iAsIII and extrusion of iAsIII from the cell (E. coli; PO4
3+ transporters, ArsC, Grx, GSH, ArsA/B, ATP)
Prokaryotes:
Enzymatic reduction of iAsV to iAsIII and extrusion of iAsIII from the cell (S. cerevisiae; PO4
3+ transporters, Acr2p, Grx, GSH, Acr3p)
Eukaryotes:
Formation and accumulation of iAsIII(GS)3 in vacuoles (S. cerevisiae; Ycf1p, ATP)
Enzymatic methylation of iAsIII to yield MAs, DMAs, and TMAs (Mammals; AdoMet-dependent As+3-methyltransferase (AS3MT), AsV-reductases, GST, GSH) None of the above (Guinea pig, Marmoset, Chimpanzee) detoxification through protein binding ???)

iAsIII MAsV MAsIII DMAsV DMAsIII TMAsVO TMAsIII
AdoMet AdoHcy 2e AdoMet AdoHcy 2e AdoMet AdoHcy 2e
iAsIII iAsIII (GS)3 MAsIII (GS)2 DMAsIII (GS)
MAsIII DMAsIII
MAsV DMAsV
AdoMet AdoHcy AdoMet AdoHcy
GSH GSH GSH
GSH GSH
Metabolism of Inorganic Arsenic (iAs)
Oxidative Methylation
Reductive Methylation

Metabolism of iAs in Mammals
MTAsV MMTAsV DMMTAsV TMTAsV
DTAsV MDTAsV DMDTAsV
TTAsV MTTAsV
TeTAsV
(Thomas and Creed, unpublished data)
Thio-Arsenicals
AS3MT
The reduction of AsV to AsIII in the methylation pathway can be viewed as a mechanism for activation of iAs as a toxin and a carcinogen!
TOXIC
iAsV
iAsIII MAsIII DMAsIII
MAsV DMAsV TMAsV
Oxo-Arsenicals

Examples of As species identified in biological samples, including foods (K. Francesconi et al.; Chris Le et al)
Marine Biota
As-fatty acids

Adverse Effects of iAs Exposure:
Diabetes Mellitus

Typical Symptoms of Chronic Arsenicosis
Hypo/hyperpigmentation “Blackfoot disease”
Keratosis
Skin cancer

Diabetes mellitus – Type II (noninsulin dependent)
Diseases Associated with Chronic Exposures to Inorganic Arsenic (iAs)
Skin, urinary bladder, lung, and liver Cancers:
Prostate, kidney, buccal cavity, pharynx, bone, large intestine and rectum
Peripheral vascular diseases – Blackfoot disease Non-cancerous Diseases:
Cardiovascular and cerebrovascular diseases (hypertension)
Diseases of peripheral and central nervous systems Respiratory system dysfunctions

Prevalence of Diabetes and Obesity in the U.S.
15%–19% 20%–24% 25%–29% ≥30%
OBESITY
DIABETES
Could the environmental chemicals contribute to this epidemic?

Conclusion: 1. “The existing human data are “limited” to
“sufficient” in support of an association between As and diabetes in populations with high exposure levels (≥ 150 ppb)
2. “The evidence is currently “insufficient” to conclude that As is associated with diabetes in lower exposure areas.....”
3. The extent of the existing literature was insufficient to consider obesity as an outcome Maull et al., EHP, 2012

• Adult onset disease
• Lack of diabetic keto-acidosis
• Fasting hyperglycemia
• Impaired glucose tolerance (by OGTT)
• Increased levels of glycated hemoglobin (HbA1c)
• Glucosuria
• Little or no data on insulin resistance, β-cell function, or insulin secretion!
Arsenic-Induced Diabetes: Historically Characterized as Type 2 Diabetes Mellitus

Research at UNC Chapel Hill
Virtual Consortium for Translational/Transdisciplinary
Environmnetal Research (ViCTER)
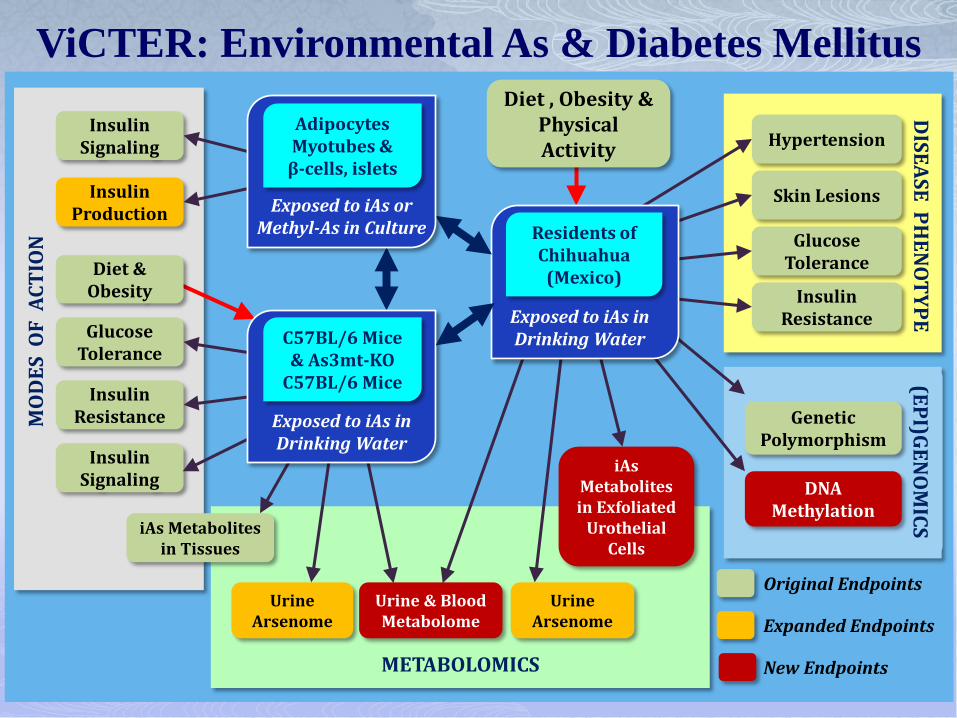
ViCTER: Environmental As & Diabetes Mellitus M
OD
ES O
F A
CTIO
N
(EPI)GENO
MICS
DISEASE PH
ENO
TYPE
Insulin Signaling
Insulin Production
Insulin Signaling
Insulin Resistance
Urine Arsenome
Urine & Blood Metabolome
iAs Metabolites in Tissues
Hypertension
Skin Lesions
Glucose Tolerance
Insulin Resistance
iAs Metabolites in Exfoliated
Urothelial Cells
Genetic Polymorphism
DNA Methylation
METABOLOMICS
Exposed to iAs in Drinking Water
Residents of Chihuahua
(Mexico)
Original Endpoints
Expanded Endpoints
New Endpoints
Glucose Tolerance
Diet , Obesity & Physical Activity
Urine Arsenome
Adipocytes Myotubes & β-cells, islets
Exposed to iAs or Methyl-As in Culture
Diet & Obesity
Exposed to iAs in Drinking Water
C57BL/6 Mice & As3mt-KO
C57BL/6 Mice

Mechanistic studies using cultured adipocytes

Trivalent Arsenicals Inhibit Insulin-Stimulated Glucose Uptake by Adipocytes
* p<0.05
0.1 1 10 100 1000 0
20
40
60
80
100
120
140
% o
f Con
trol
* *
* *
Cell viability
[iAsIII µM] [MAsIII µM] [DMAsIII µM]
*
*
iAsIII MAsIII DMAsIII
*
Glucose Uptake
~30 µM ~4 µM ~10 µM
Walton et al., TAAP, 2004

GLUT-4 Transporters in Plasma Membrane of Arsenic-Treated Adipocytes (4-hour exposure)
Paul et al., EHP, 2007
Control - Insulin
Control + Insulin
50 μM iAsIII
+ Insulin
2 μM MAsIII
+ Insulin

β β P P P
P
IRS P
Akt P
GLUT4
Insulin Glucose
Insulin Receptor
Cytoplasm
PIP3
PTEN
PIP2
+ Nucleus
+ PDK-1,2
− +
iAsIII
MAsIII
Carbohydrate Metabolism
Inhibition of Insulin Signaling by Arsenicals
DMAsIII
−
−
PI-3K
Paul et al., EHP, 2007
GLUT1

Human population studies in Mexico

Population Studies in Mexico
• iAs in drinking water: 3 - 215 ppb As (mean = 77.3 ppb)
• 258 subjects
Study 2: Chihuahua
• iAs in drinking water: 0.1 to 420 ppb As
• ~1,150 subjects (to date)
Study 1: Zimapan, Lagunera
The study areas within the region of Mexico with high levels of iAs in drinking water supplies

• Questionnaires: sources of drinking water, health, arsenic exposure, diet (FFQ), physical activity…
• Examination: skin lesions, fasting blood glucose, glucose tolerance, HbA1c, indicators of obesity (BMI), ….
Study Design: A B
C D
Skin disease among residents of Zimapan and Lagunera: (A) hypopigmentation, (B) hyperkeratosis, (C) Bowen’s disease, and
(D) epidermoid cancer
• Analyses: skin lesions, BMI, iAs metabolites in urine, genetic polymorphism, plasma and urine metabolomes, DNA methylation pattern in blood…..

Study 1: Subjects Recruited in
Zimapan and Lagunera
Total Lagunera ZimapánN (Mean) % (SD) N (Mean) % (SD) N (Mean) % (SD)
Population 258 100 111 43.0 147 57.0Female 174 67.4 65 58.6 109 74.2Age (34) (18.3) (40) (19.0) (29) (16.3)Water consumption (L/day) (1.9) (0.9) (2.2) (1.0) (1.8) (0.8)Use bottled water 144 55.8 24 21.6 120 81.6Skin lesions 61 23.6 11 9.9 50 34.0BMI>30 88 34.1 40 36.0 48 32.7Hypertensive 97 37.6 29 26.1 68 46.3Diabetic 23 8.9 15 13.51 8 5.44
Subjects by AgeZimapan: 5-15 years (30%)
16-30 years (22%)31-49 years (34%)50-64 years (14%)
Lagunera: 7-15 years (16%)16-30 years (15%)31-49 years (35%)50-64 years (27%)65-88 years (7%)
Del Razo et al., EH, 2011

iAs in water (ppb)
FBG Cases Non-
cases OR 95% CI p
<50 8 186 1.00 50-124.9 9 50 3.30 1.11 9.85 0.03
≥125 6 22 7.40 2.13 25.65 <0.01 iAs in water (ppb)
2HBG Cases Non-
cases OR 95% CI p
<50 9 177 1.00 50-124.9 9 41 2.89 0.97 8.56 0.06
≥125 6 16 7.01 2.02 24.44 <0.01
Association of diabetes classified by FBG or 2HBG with exposure to iAs in Zimapan and Lagunera, Mexico
(adjusted for age, sex, obesity and hypertension)
iAs Exposure Increases Risk of Diabetes
Del Razo et al., EH,
2011

HbA1c β 95% CI p
Water iAs 0.019 0.002 0.037 0.031
Urinary tAs 0.004 -0.015 0.023 0.660
Urinary iAsIII -0.001 -0.016 0.015 0.936
Urinary MAsIII 0.008 -0.011 0.028 0.393
Urinary DMAsIII 0.005 -0.007 0.016 0.398
Urinary iAsV 0.008 -0.005 0.020 0.230
Urinary MAsV 0.001 -0.017 0.020 0.879
Urinary DMAsV 0.004 -0.012 0.019 0.647
Urinary DMAs/MAs ratio 0.022 -0.013 0.056 0.215
Urinary MAs/iAs ratio 0.008 -0.019 0.034 0.561
HbA1c is Only Weakly Associated with As Exposure
(β and CI for 10 ppb As in water or 1 ng As/mL urine ) Del Razo et al., EH, 2011

Negative Associations of iAs Exposure with FPI & HOMA-IR (β and CI for 10 ppb As in water or 1 ng As/mL urine )
FPI HOMA-IR β 95% CI p β 95% CI p
Water iAs -0.208 -0.272 -0.145 <0.001 -0.164 -0.236 -0.092 <0.001
Urinary tAs -0.136 -0.207 -0.066 <0.001 -0.116 -0.193 -0.040 0.003
Urinary iAsIII -0.117 -0.176 -0.058 <0.001 -0.090 -0.153 -0.026 0.006
Urinary MAsIII -0.091 -0.166 -0.017 0.017 -0.048 -0.128 0.033 0.245
Urinary DMAsIII -0.085 -0.128 -0.042 <0.001 -0.063 -0.110 -0.017 0.008
Urinary iAsV -0.027 -0.076 0.022 0.287 -0.039 -0.092 0.013 0.141
Urinary MAsV -0.082 -0.152 -0.013 0.021 -0.057 -0.131 0.017 0.130
Urinary DMAsV -0.053 -0.110 0.005 0.074 -0.036 -0.098 0.025 0.247
DMAs/MAs ratio -0.118 -0.252 0.015 0.081 -0.109 -0.252 0.033 0.133
MAs/iAs ratio 0.104 0.003 0.206 0.044 0.139 0.034 0.245 0.010
Del Razo et al., EH, 2011

DMAsIII in Urine Increases Risk of Diabetes
OR increases by ~ 5% for every ng As/ml as DMAsIII (p = 0.041). After controlling for creatinine, OR increases by ~ 7% for every
ng As/ml as DMAsIII (p ≤0.016)
Diabetes classified by 2HBG, diagnosis or medication
Del Razo et al., EH, 2011

Associations with AS3MT(M287T) Polymorphism FBG 2HBG
HbA1c DMAsIII
287M
287M 287M
287M 287T
287T 287T
287T
Drobna et al., JESEE (in press)

Interaction of M287T (●) and G4965C (▲) polymorphisms and exposure to iAs in water
categorized at the 75th percentile (>52 ppb As in water)
287M
287T 287M
287T
Drobna et al., JESEE (in press)

Study 2: Associations of Diabetes classified by FPG≥126 mg/dl
with iAs Exposure and iAs Metabolism in the Chihuahua Study Population (n = 1,002)
(adjusted for age, sex, obesity and hypertension)
iAs in Water DMAs in UrineTAs in Urine
*
**
*
*
OD
DS
RA
TIO
OD
DS
RA
TIO
OD
DS
RA
TIO
ppb ppb ppb
OR and 95% CI are shown for the <50th, 50th-75th, 75th-95th, and >95th percentiles; *p ≤0.038.
Styblo’s team, unpublished data

y = 0.65x + 0.39R² = 0.27
-0.50.00.51.01.52.02.53.03.54.0
-0.5 0.5 1.5 2.5
Log
TAs
in B
ECs
(pg/
10,0
00 c
ells
)
Log TAs in Urine (ng/mL)
p < 0.0001
0
20
40
60
80
100
iAs MAs DMAs
% o
f To
tal
As
BECsUrine
Arsenic Metabolites in Exfoliated Urothelial Cells (BECs) from the Chihuahua Cohort
Hydride generation-
cryotrapping-ICP-MS analysis
0
20,000
40,000
60,000
80,000
100,000
0 10 20 30 40 50 60
Cou
nts
Per
Sec
ond
Time (seconds)
DI Water
BEC Sample
Correlation between tAs in urine & BECs As species in urine & in BECs
iAs
MAs DMAs
TMAs

Association Between As Metabolites in BEC and Diabetes (classified by FPG, 2HPG, diagnosis or medication)
BEC iAsIII
0-25
26-50
51-75
76-10
002468
10121416
* **
Percentile
OR
BEC MAsIII
0-25
26-50
51-75
76-10
002468
10121416
*
Percentile
OR
BEC DMAsIII
0-25
26-50
51-75
76-10
002468
10121416
*
Percentile
OR
BEC DMAs/MAs
0-25
26-50
51-75
76-10
00.0
0.5
1.0
1.5
2.0
* *
Percentile
OR
Odds Ratios by IQR. Age, gender and BMI were included in the logistic regression model. n = 374
Urine Specific Gravity
0-25
26-50
51-75
76-10
00
2
4
6
8
*
Percentile
OR

Animal studies

iAs Intake IPGTT
0 20 40 60 80 100
Time (min)
100
200
300
400
500
Bloo
d Gl
ucos
e (m
g/dl
)
*
**
0 20 40 60 80 100
Time (min)
100
200
300
400
500
Bloo
d Gl
ucos
e (m
g/dl
)
*
**
25 ppm 50 ppm 0
25
50
75
100
125
150
175
As In
take
(µg/
day)
* p<0.05
0 ppm iAs 25 ppm iAs 50 ppm iAs
No significant differences in Hb1Ac levels
Mouse Studies: Adult male C57BL/6 mice exposed to arsenite (0, 25 or 50 ppm As) in
drinking water and fed a regular, grain-bases laboratory diet (contains ~20-80 ppb As)
Paul et al., TAAP 2007

Mouse Studies, Role of Diet: Adult male C57BL/6 mice exposed to arsenite (0, 25 or 50 ppm As) in
drinking water and fed purified Low-Fat Diet or an obesogenic High-Fat Diet
Body Composition
(by MRI) After 20 Weeks
Control L
F
25 ppm LF
50 ppm LF
Control H
F
25 ppm HF
50 ppm HF
0
10
20
30
40
50Fat (g)Lean (g)
Gra
ms
* * *
Low-Fat Diet High-Fat Diet
Paul et al., EHP, 2011

Oral Glucose Tolerance Test (OGTT) after 20-week exposure
0 30 60 90 1200
100
200
300
400
500Con HFCon LF
** **
Time (min.)
Blo
od
Glu
co
se (
mg
/dl)
0 30 60 90 1200
100
200
300
400
50025 ppm HF25 ppm LF*
Time (min.)
Blo
od
Glu
co
se (
mg
/dl)
0 30 60 90 1200
100
200
300
400
50050 ppm HF50 ppm LF*
**
Time (min.)
Blo
od
Glu
co
se (
mg
/dl)
No Arsenic 25 ppm Arsenic 50 ppm Arsenic
High-Fat
Low-Fat
High-Fat High-Fat
Low-Fat Low-Fat
Paul et al., EHP, 2011 Control 25 ppm 50 ppm0
10000
20000
30000
40000
50000
a
a
b
b
c
c
OG
TT, A
rea
Und
er th
e C
urve
DArea under the OGTT Curve

Association Between iAs Exposure and Plasma Insulin (FPI) or HOMA-IR
0
250
500
750
1000
LFD HFDControl 25 ppm 50 ppm Control 25 ppm 50 ppm
a
a,c b
bcd
d,f,g
e,f
eg
Seru
m In
sulin
(pm
ol/L
) High-Fat Low-Fat
Control 25 ppm 50 ppm0
2
4
6
8
a
a,b
b
HO
MA
-IR (a
rbitr
ary
units
) Low-Fat Diet
High-Fat Diet
Paul et al., EHP, 2011
Fasting Fasting
15 min OGTT 15 min OGTT
Male C57BL/6 mice exposed for 20-weeks to 0, 25 or 50 ppm As in drinking water

Mechanistic studies using isolated pancreatic islets

Trivalent Arsenicals Inhibit Glucose Stimulated Insulin Secretion by Isolated Murine Pancreatic Islets
0
0.5
1
1.5
2
2.5
3
3.5
0 0.1 0.5 1.0 2.0 µM
Insu
lin (n
g/is
let)
* * *
* *
*
0 0.1 0.5 0 0.1 0.5 1.0 µM µM
2.5 mM glucose
16.7 mM glucose
iAsIII MAsIII DMAsIII
0
20
40
60
80
100
120
140
160
0 0.1 0.5 1 2
Viab
ility
(% o
f con
trol
)
Concentration (µM)
iAsIII
MAsIII
DMAsIII Islet
viability
48-hour exposure
Douillet et al., TAAP 2013
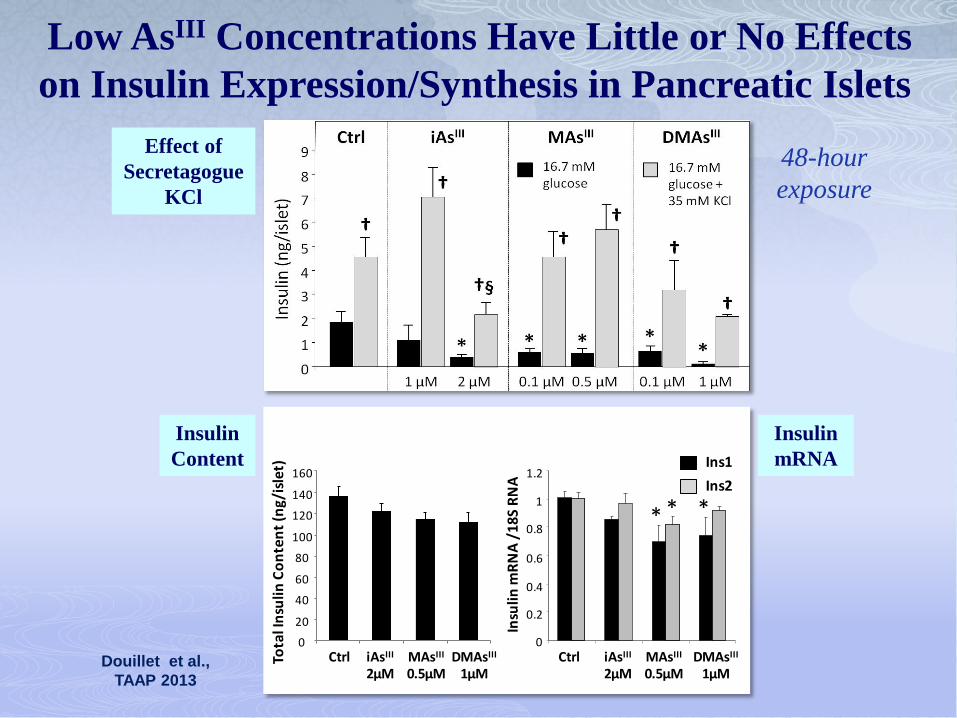
Low AsIII Concentrations Have Little or No Effects on Insulin Expression/Synthesis in Pancreatic Islets
0
20
40
60
80
100
120
140
160
Tota
l Ins
ulin
Con
tent
(ng/
islet
)
Ctrl iAsIII
2µMMAsIII
0.5µMDMAsIII
1µM
0
0.2
0.4
0.6
0.8
1
1.2
Insu
lin m
RNA
/18S
RN
A
Ctrl iAsIII
2µMMAsIII
0.5µMDMAsIII
1µM
* * *
Ins1Ins2
Insulin Content
Insulin mRNA
Effect of Secretagogue
KCl 48-hour exposure
Douillet et al., TAAP 2013

Arsenic Species in Mouse Tissues Regulating Glucose Homeostasis after Exposure to Arsenite:
4-week exposure to 50 ppm As in drinking water As species in tissue analyzed by HG-CT-AAS
0
500
1000
1500
2000
2500
3000
3500
4000
Liver
As, n
g As
/g ti
ssue
TMAODMAsVMAsViAsVDMAsIIIMAsIIIiAsIII
0
100
200
300
400
500
600
700
800
Pancreas SkeletalMuscle
Adipose
As, n
g As
/g ti
ssue
TMAODMAsVMAsViAsVDMAsIIIMAsIIIiAsIII
Currier et al., unpublished data

Insulin
MAsIII
iAsIII & MAsIII
iAsIII
iAsIII
iAsIII
Glucokinase
Glucose
GLU
T2
Glucose-6-P
Glucose
Pyruvate
ATP/ADP
Ca2+
Secretory Granule
Nucleus
K+
K+
Ca2+
ATP-sensitive K+ channel
Voltage dependent Ca2+ channel
Depolarization
cAMP
Calpain-10
+
Insulin
DNA
mRNA PDH
ATP
Hypothetical Mechanisms of the Inhibition of GSIS by AsIII
AsV
iAsIII

Hypothetical Mechanism of the Inhibition of GSIS by Arsenite (Fu et al., EHP, 2011)
iAsIII provokes a Nrf2/ARE mediated adaptive oxidative stress response that
increases antioxidant levels and dampens ROS signaling that is thought to be
essential for regulation of GSIS
Nrf2
ARE-luciferase activity

Metabolome and Epigenome associated with iAs exposure &
Diabetes
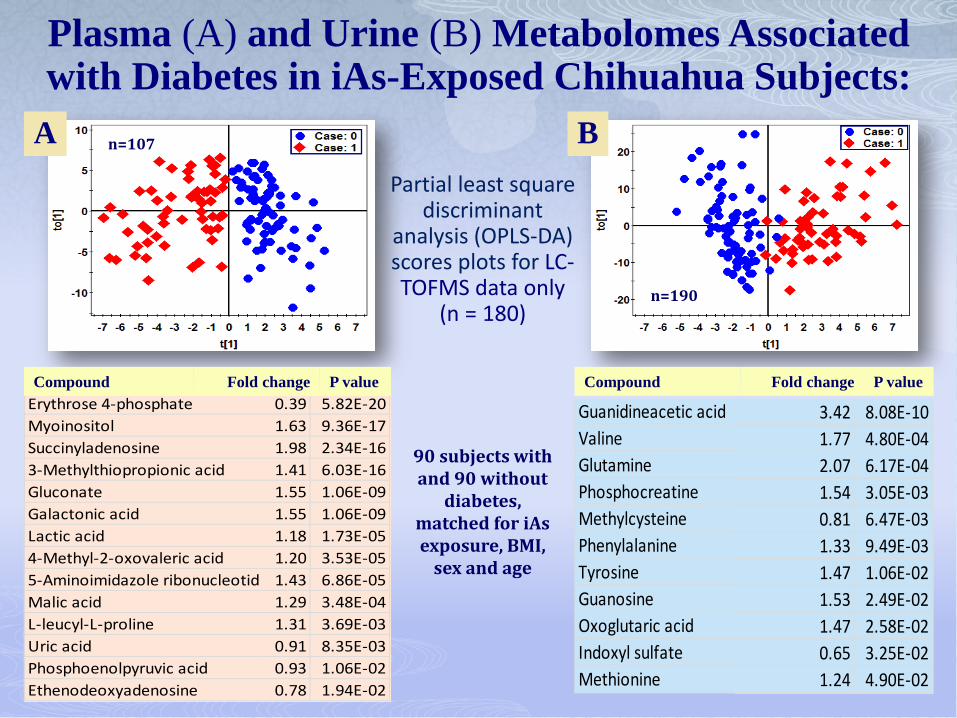
Plasma (A) and Urine (B) Metabolomes Associated with Diabetes in iAs-Exposed Chihuahua Subjects:
Guanidineacetic acidValineGlutaminePhosphocreatineMethylcysteinePhenylalanineTyrosineGuanosineOxoglutaric acidIndoxyl sulfateMethionine
3.42 8.08E-10
1.77 4.80E-042.07 6.17E-041.54 3.05E-030.81 6.47E-031.33 9.49E-031.47 1.06E-021.53 2.49E-02
1.47 2.58E-02 0.65 3.25E-02
1.24 4.90E-02
Partial least square discriminant
analysis (OPLS-DA) scores plots for LC-TOFMS data only
(n = 180)
A B
Compound Fold change P value Erythrose 4-phosphateMyoinositolSuccinyladenosine3-Methylthiopropionic acidGluconateGalactonic acidLactic acid4-Methyl-2-oxovaleric acid5-Aminoimidazole ribonucleotideMalic acidL-leucyl-L-prolineUric acidPhosphoenolpyruvic acidEthenodeoxyadenosine
0.39 5.82E-20
1.63 9.36E-171.98 2.34E-16
1.41 6.03E-161.55 1.06E-09
1.55 1.06E-09 1.18 1.73E-05
1.20 3.53E-05 1.43 6.86E-05
1.29 3.48E-041.31 3.69E-03
0.91 8.35E-03 0.93 1.06E-02
0.78 1.94E-02
Compound Fold change P value
90 subjects with and 90 without
diabetes, matched for iAs exposure, BMI,
sex and age
n=107
n=190

Plasma Metabolites Associated with Diabetes and/or Exposure to iAs
48 (37)* 66 (34)*
1. Gluconate (gluconic acid): product of glucose oxidation 2. 5-Aminoimidazole ribonucleotide: an intermediate/precursor of purine & pyrimidine nucleotide
biosyntheses and synthesis of TPP; also a substrate for a number of proteins, including scaffold attachment factor B2, multifunctional protein ADE2, pulmonary surfactant-associated protein B, tumor necrosis factor receptor superfamily member 2, etc.
3. Lanthionine is a sulfur-containing aminoacid formed by cystathionine gamma-lyase during condensation of 2 cysteines, yielding H2S; found in urine of subjects with homocysteinuria
4. Cystine formed by oxidation/dimerization of cysteine; preffered substrate for GSH synthesis in some cell types (e.g., macrophages, astrocytes)
Pearson's correlation: P ≤ 0.05 *P-values adjusted for multiple comparisons by the Bonferroni method

Urinary Metabolites Associated with Diabetes and/or Exposure to iAs
80 (73)* 69 (9)*
1. Methylcysteine: one of the bioactive substances in garlic. It has been suggested that it could protect partially oxidized and glycated LDL in plasma against further oxidative and glycative deterioration, which might benefit patients with diabetic-related vascular diseases
2. Aspartic acid (aspartate): a proteinogenic, non-essential amino acid, a major excitatory neurotransmitter, and a natural sweetener. Aspartic acid may also be a significant immunostimulant of the thymus.
Pearson's correlation: P ≤ 0.05 *P-values adjusted for multiple comparisons by the Bonferroni method

Epigenome Associated with Arsenicosis in Zimapan Population (Mexico)
(Smeester et al. Chem Res Toxicol. 2011, 24, 165–167)
Epigenetically modified (hypermethylated) iAs-induced networks: (B) Tumor suppressor protein p53 (tp53)-associated network.
(C) The iAs-induced tumor suppressorome - a complex of 17 tumor suppressors known to be silenced in human cancers

MKK4/7
IRF1
Antigen-presentingcell
PRKCD
PDX1
GAD1Pancreatic β cell
MacrophageCytotoxic CD8+ T cell
TRAF2 TRAF6
NF-kB
P38 MAPK
NO
STAT1STAT1
INSPRKCD
IRS SOCS6
ERK1/2
cellularproliferation
glycogen synthesisprotein synthesislipogenesis
nucleus
TNFR
TAK1
MAP3K1
JNK
NOS2
INS
IR
PI3K
PDK1
AKT
enzymekinase
phosphatase MMAs-associated gene
DMAs-associated gene
IRF1
TNFATNFBIFNGY
JAK-STAT signaling
IFNGR1
Apoptosis
TNFRSF1B
TNFA
TRAF2
PIP2
PIP3
PTEN
INPPL1
TAK1
MKK4/7
JNK
other
cytokine indirect interaction
direct interaction iAs-associated gene
obesity
A. B.
VAMP2
glucose transport
fatlivermuscle
positive association negative association
transmembrane receptor
transcriptional regulator
VAMP2
Epigenetic Changes in Genes Linked to Diabetes: Promoter methylation status correlates with urinary As metabolites
Bailey et al . JBMT 2013 (in press)
Type-1 Diabetes
Type-2 Diabetes

Conclusions 1. Exposures to moderate-to-high concentrations of iAs in
drinking water increase the risk of developing diabetes
2. iAs-induced diabetes is characterized by fasting hyperglycemia and impaired glucose tolerance but not necessarily by hyperinsulinemia or increased insulin resistance (HOMA-IR)
3. Human data and results of tissue culture studies suggest that iAs exposure impairs both insulin signaling and insulin production/secretion, with pancreatic β-cells being the primary target
4. The methylation by AS3MT activates iAs as a diabetogen
5. AS3MT(M287T) polymorphisms increases the risk of diabetes due to an increased production of DMAsIII

Future Prospective Study in Mexico • Goals:
1. To examine causality of the association between chronic iAs exposure and diabetes
2. To characterize phenotype of iAs-induced diabetes
• Longitudinal study in Chihuahua (Mexico): • Incidence of diabetes in the Chihuahua cohort over the next 5 years • Conversion rates from impaired glucose tolerance to diabetes • Characterization of the phenotype of iAs-induced diabetes
SUBJECTSFOLLOWEDANNUALLY
CURRENT PROJECT CONTINUATION PROJECT
4 5 1 2 3 4 5
SUBJECTSRECRUITEDANNUALLY
TOTALSUBJECTS
RECRUITED1003 1200 350 350 300
450 450 450 450 180TOTAL
SUBJECTSFOLLOWED
TOTALSUBJECTS
RECRUITED2200
1980
YEAR YEAR

Future Research Directions & Topics Molecular mechanisms of the diabetogenic effects of
iAs exposure, with focus on β-cells
Exposure to iAs (and other arsenicals) in the diet
Role of prenatal (in utero) exposure to iAs in the development of adult disease, including diabetes
Epigenetic processes affected by chronic exposure to iAs (cross-generational effects, role of iAs metabolism)
Effects of iAs exposure on urine and blood metabolome (implications for As-induced diabetes)
Further optimization and development of analytical techniques for detection and quantification of iAs and its (toxic) metabolites in the environment, foods and biological matrices

Acknowledgements UNC-Chapel Hill
Nutrition – Biochemistry (Styblo Lab) Zuzana Drobná, David Paul,
Felecia Walton, Christelle Douillet, Jenna Currier, Jesse Saunders
Nutrition - Epidemiology Michelle Mendez, Meg Mangan
Environmental Sciences & Engineering Rebecca Fry, Kathryn Bailey, Lisa Smeester
Medicine John Buse
IARC (Lyon, France) Dana Loomis
Grants NIH No. 5R01 ES015326-02, DK056350,
GIL No. 200710.0028, US EPA/STAR 832735
Mexico
CINVESTAV-IPN Luz María Del Razo
Luz Carmen Sánchez-Peña
Univ. Juárez del Estado de Durango Gonzalo García-Vargas
Hospital General “Dr. Manuel G. González” José Contreras-Ruiz
Universidad Autónoma de Chihuahua María Carmen González-Horta
María de Lourdes Ballinas Blanca Estela Sánchez Ramírez María Cecilia Ishida Gutierrez
Daniela Sarahí Gutiérrez Torres Roberto Hernández Cerón Damian Viniegra Morales
Francisco Andres Baeza Terrazas
Instituto Nacional de Salud Pública Juan Eugenio Hernández-Ávila
UNC-Greensboro Wei Jia

Thank You! Chihuahua, April 2010
Zimapan, January 2007