dia corporate · pdf fileand not reliance on the information contained in the presentation....
TRANSCRIPT

Corporate Presentation

Legal disclaimer
This document does not constitute or form part of any purchase, sales or Exchange offer, nor is it an invitation to draw up a purchase sales or exchange offer, or advice on any stock issued by
Distribuidora Internacional de Alimentación, S.A. (“DIA” or the “Company”). Nor shall this document or any part of it form part of any offer for sale or solicitation of any offer to buy any securities
the basis of or be relied on in connection with any contract or commitment to purchase shares.
DIA cautions that this document contains forward-looking statements and information relating to DIA and include, without limitation, estimates, projections or forecast relating to possible future
trends and performance of DIA that are based on the beliefs of its management as well as assumptions made and information currently available to the Company.
Such statements reflect the current views of the Company with respect to future events and are subject to risks, uncertainties and assumptions about the Company and its subsidiaries,
including, among other things. In light of these risks, uncertainties and assumptions, the events or circumstances referred to in the forward-looking statements may not occur. None of the future
projections, expectations, estimates, guidance or prospects in this presentation should be taken as forecasts or promises nor should they be taken as implying any indication, assurance or
guarantee that the assumptions on which such future projections, expectations, estimates, guidance or prospects have been prepared are correct or exhaustive or, in the case of the
assumptions, fully stated in the presentation.
These forward looking statements speak only as of the date on which they are made and the information, knowledge and views available on the date on which they are made; such knowledge,
information and views may change at any time. Forward-looking statements may be identified by words such as “expects”, “anticipates”, “forecasts”, “estimates” and similar expressions. Current
and future analysts, brokers and investors must operate only on the basis of their own judgment taking into account this disclaimer, as to the merits or the suitability of the securities for its
purpose and only on such information as is contained in such public information having taken all such professional or other advice as its considers necessary or appropriate in the circumstances
and not reliance on the information contained in the presentation. In making this presentation available, DIA gives no advice and makes no recommendation to buy, shell or otherwise deal in
shares in DIA or in any other securities or investments whatsoever.
These analysts, brokers and investors must bear in mind that these estimates, projections and forecasts do not imply any guarantee of DIA´s future performance and results, price, margins,
exchange rates, or other events, which are subject to risks, uncertainties and other factors beyond DIA´s control, such that the future results and the real performance could differ substantially
from these forecasts, projections and estimates.
The risks and uncertainties which could affect the information provided and very difficult to anticipate and predict. DIA does not assume the obligation of publicly reviewing or updating these
statements in case unforeseen changes or events occur which could affect these statements. DIA provides information on these and other factors which could affect the business and the
results in the documents it presents to the CNMV (Comisión Nacional de Mercado de Valores) in Spain.
Accordingly, these estimates, projections and forecast must not be taken as a guarantee of future results, and the directors or managers are not responsible for any possible deviation which
could arise in terms of the different factors which influence the future performance of the company.
None of the Company nor any of its employees, officers, directors, advisers, representatives, agents or affiliates shall have any liability whatsoever (in negligence or otherwise, whether direct or
indirect, in contract, tort or otherwise) for any loss howsoever arising from any use of this document or its contents or otherwise arising in connection with this document.
Certain information contained in this presentation is based on management accounts and estimates of the Company and has not been audited or reviewed by the Company’s auditors. Recipients
should not place undue reliance on this information.
This presentation includes certain non-IFRS financial measures or expressions (gross sales under banner, comparable growth of gross sales under banner, adjusted EBITDA, adjusted EBIT, etc.)
which have not been subject to a financial audit for any period.
The information contained in this presentation does not constitute investment, legal, accounting, regulatory, taxation or other advice and the information does not take into account your
investment objectives or legal, accounting, regulatory, taxation or financial situation or particular needs. You are solely responsible for forming your own opinions and conclusions on such
matters and the market and for making your own independent assessment of the information. You are solely responsible for seeking independent professional advice in relation to the
information contained herein and any action taken on the basis of the information contained herein. No responsibility or liability is accepted by any person for any of the information or for any
action taken by you or any of your officers, employees, agents or associates on the basis of such information.

Index
02 Key Investment Highlights 8
03 Financial review 25
01 Introduction 4
04 Appendix - additional information 28

Introduction
01

DIA at a glance
A story of profitable growth in food retail
Notes
1. Excluding France, Turkey and China; 2. Ex-currency; 3. Top 100 global franchises (Franchise Direct);
4. By # of publicly published franchised stores; 5) Weight in sales of FMCG in Spain
Continued growth profile1 (#, €m) Key facts
Global and diversified footprint Discounter of reference in largest markets
1. #1 global listed proximity discounter
2. Top 20 franchisor worldwide3/ #1 in food retail in Europe4
3. Loyal customer base (+75% sales through DIA card)
4. Innovation focus (+50% private label penetration5)
SIZABLE AND UNIQUE BUSINESS MODEL…
5. EUR10.3bn gross sales under banner / EUR8.7bn net sales
6. EUR628m adjusted EBITDA (7.2% margin)
7. 19.4% ROI and 1.4x net debt / adjusted EBITDA
…FUELLED BY INDUSTRY-LEADING FINANCIAL RESULTS
DISCOUNTERS MARKET POSITION
IBERIA EMERGING
FOOD RETAIL MARKET POSITION
#1
#3
#3
#5
#1
#4
#1
#5
Source:
Kantar Worldpanel, Nielsen
# STORES ADJUSTED EBITDA GROSS SALES
UNDER BANNER
34%
66%
2016 EUR10.3bn
19%
81%
2016 EUR628m
26%
74%
2016 7,420
49%
51%
2016 7,420
Company-owned
Franchise
Iberia
Emerging
7,420
4,355
2016
# STORES ADJUSTED EBITDA GROSS SALES
UNDER BANNER
2011 2016 2011
10,314
7,810
628
471
2016 2011
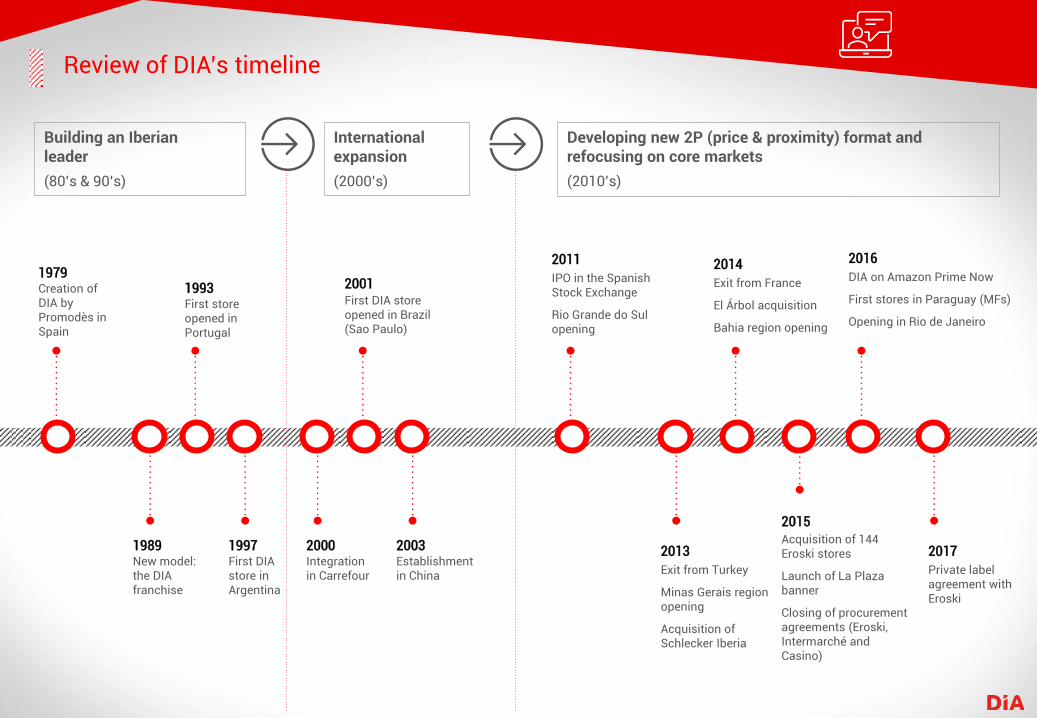
Review of DIA’s timeline
Building an Iberian leader
(80’s & 90’s)
International expansion
(2000’s)
Developing new 2P (price & proximity) format and refocusing on core markets
(2010’s)
1979 Creation of DIA by Promodès in Spain
1989 New model: the DIA franchise
1993 First store opened in Portugal
1997 First DIA store in Argentina
2000 Integration in Carrefour
2001 First DIA store opened in Brazil (Sao Paulo)
2003 Establishment in China
2011
IPO in the Spanish Stock Exchange
Rio Grande do Sul opening
2014
Exit from France
El Árbol acquisition
Bahia region opening
2013
Exit from Turkey
Minas Gerais region opening
Acquisition of Schlecker Iberia
2015 Acquisition of 144 Eroski stores
Launch of La Plaza banner
Closing of procurement agreements (Eroski, Intermarché and Casino)
2016
DIA on Amazon Prime Now
First stores in Paraguay (MFs)
Opening in Rio de Janeiro
2017
Private label agreement with Eroski
DIA’s geographical reach (December 2016)
Notes
1. Paraguay master franchise operations started in late 2016
Key facts
#Total Stores
#Franchises
Gross Sales(€m)
Discounter market position
623
256
848
#3
Key facts
# Total Stores
# Franchises
Gross Sales(€m)
Discounter market position
872
576
1,643
#1
Key facts
#Total Stores
#Franchises
Gross Sales(€m)
Discounter market position
1,050
671
1,857
#1
Key facts
#Total Stores
#Franchises
Gross Sales(€m)
Discounter market position
4,875
2,147
5,967
#1

Key Investment Highlights
02
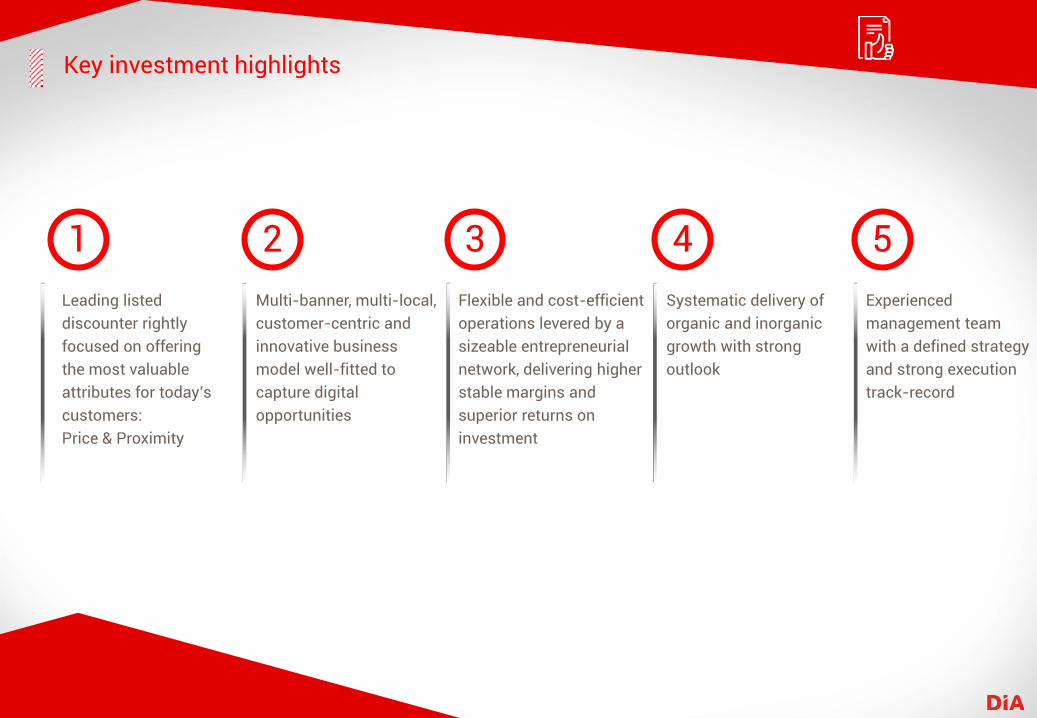
Key investment highlights
1
Leading listed
discounter rightly
focused on offering
the most valuable
attributes for today’s
customers:
Price & Proximity
2
Multi-banner, multi-local,
customer-centric and
innovative business
model well-fitted to
capture digital
opportunities
3
Flexible and cost-efficient
operations levered by a
sizeable entrepreneurial
network, delivering higher
stable margins and
superior returns on
investment
4
Systematic delivery of
organic and inorganic
growth with strong
outlook
5
Experienced
management team
with a defined strategy
and strong execution
track-record

Leading listed discounter…
[#1] listed discounter worldwide, having significantly gained market share in the last few years
1
Global discounters ranking (by # stores; ‘000)
Source Company fillings; Lidl and Aldi based on latest info available (2014)
#1
#3
10,006 9,937
7,420
6,146
3,107
DIA’s market share gain in its largest geographies
#1
#1
#1
#1
#1
#1
7.1% 2011
8.6% 2016
4.8% 2011
7.0% 2016
6.0% 2011
12.4% 2016
# DIA’s discounter position Top 5 players market share

…rightly focused on core customer values: Price & Proximity
Proximity stores as the most resilient format and expected to drive global food retail growth in the mid-term
Current trends in the global food retail sector… …support DIA’s long-term strategic positioning
Mature markets Emerging markets
• Ageing population • Higher shopping frequency • Less people per home /
reduced storage capacity • Stagnation of personal income
/ value-for-money approach • Unemployment remains high
in certain geographies • More women in the workforce
• Increased weight of modern distribution
• Rising of oil and energy costs
• Increase of urban population
• Rise of middle class
• Higher personnel costs
Source Euromonitor
SPAIN BRAZIL ARGENTINA
7%
5%
2%
(8%)
(2%) (1%)
11-16 CAGR 16-21 CAGR
8%
6% 6%
(9%)
(6%)
(2%)
11-16 CAGR 16-21 CAGR
6%
(3%)
(1%)
6%
11-16 CAGR 16-21 CAGR
6% 7%
Hard discounters
Hypermarkets
Supermarkets
Department stores
Convenience
Convenience & Discount Hypermarkets Supermarkets
1

Leading price image across all geographies
Price as a differentiating feature vs. competitors
-100
-80
-60
-40
-20
0
20
40
60
80
ma
y-1
3
no
v-1
3
ma
y-1
4
no
v-1
4
ma
y-1
5
de
c-1
5
ma
y-1
6
no
v-1
6
DIA Competitor A
Competitor B Competitor C
Competitor D Competitor E
Competitor F Competitor G
-40
-20
0
20
40
60
80
100
no
v-1
3
ma
y-1
4
no
v-1
4
ma
y-1
5
de
c-1
5
ma
y-1
6
no
v-1
6
DIA Competitor ACompetitor B Competitor CCompetitor D Competitor ECompetitor F Competitor GCompetitor H
Source DIA and Kantar
-30
-20
-10
0
10
20
30
40
50
60
70
Ma
y-y
y
No
v-y
y
Ma
y-y
y
No
v-y
y
Ma
y-y
y
De
c-y
y
Ma
y-y
y
No
v-y
y
DIA Competitor A
Competitor B Competitor C
Competitor D Competitor E
1 M
ay
-13
No
v-1
3
Ma
y-1
4
No
v-1
4
Ma
y-1
5
No
v-1
5
Ma
y-1
6
No
v-1
6
Ma
y-1
3
No
v-1
3
Ma
y-1
4
No
v-1
4
Ma
y-1
5
No
v-1
5
Ma
y-1
6
No
v-1
6
No
v-1
3
Ma
y-1
4
No
v-1
4
Ma
y-1
5
No
v-1
5
Ma
y-1
6
No
v-1
6
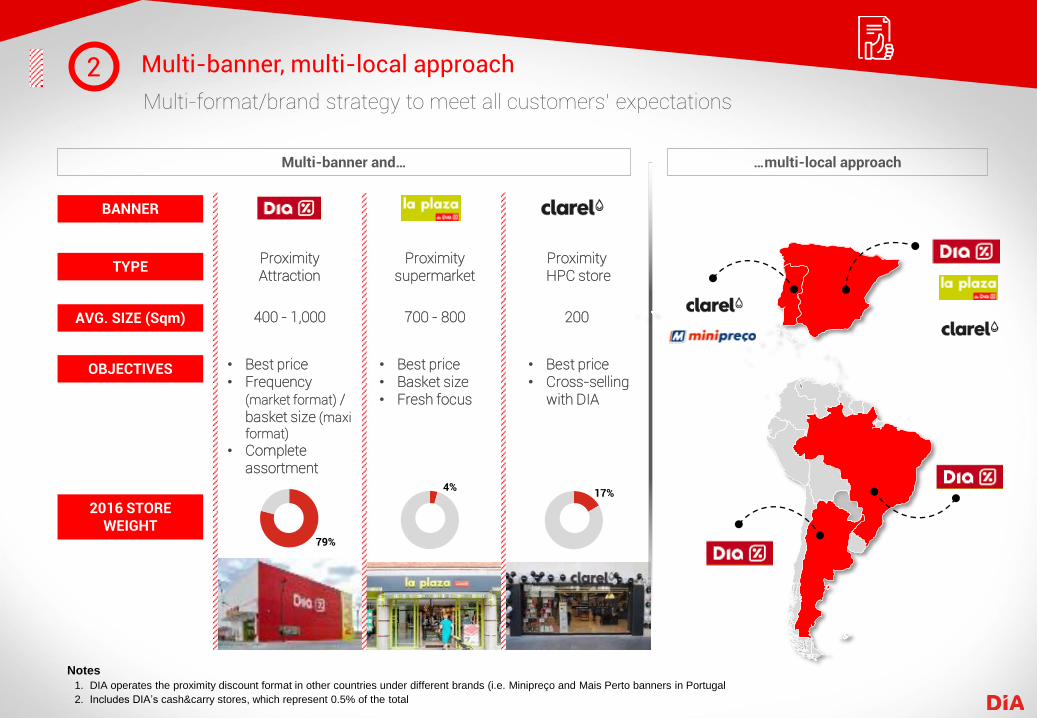
Multi-banner, multi-local approach
Multi-format/brand strategy to meet all customers’ expectations
2
Notes
1. DIA operates the proximity discount format in other countries under different brands (i.e. Minipreço and Mais Perto banners in Portugal
2. Includes DIA’s cash&carry stores, which represent 0.5% of the total
Multi-banner and… …multi-local approach
BANNER
TYPE
AVG. SIZE (Sqm)
Proximity Attraction
Proximity supermarket
Proximity HPC store
400 - 1,000 700 - 800 200
OBJECTIVES • Best price • Frequency
(market format) / basket size (maxi format)
• Complete assortment
• Best price • Basket size • Fresh focus
• Best price • Cross-selling
with DIA
2016 STORE WEIGHT
79%
4%17%
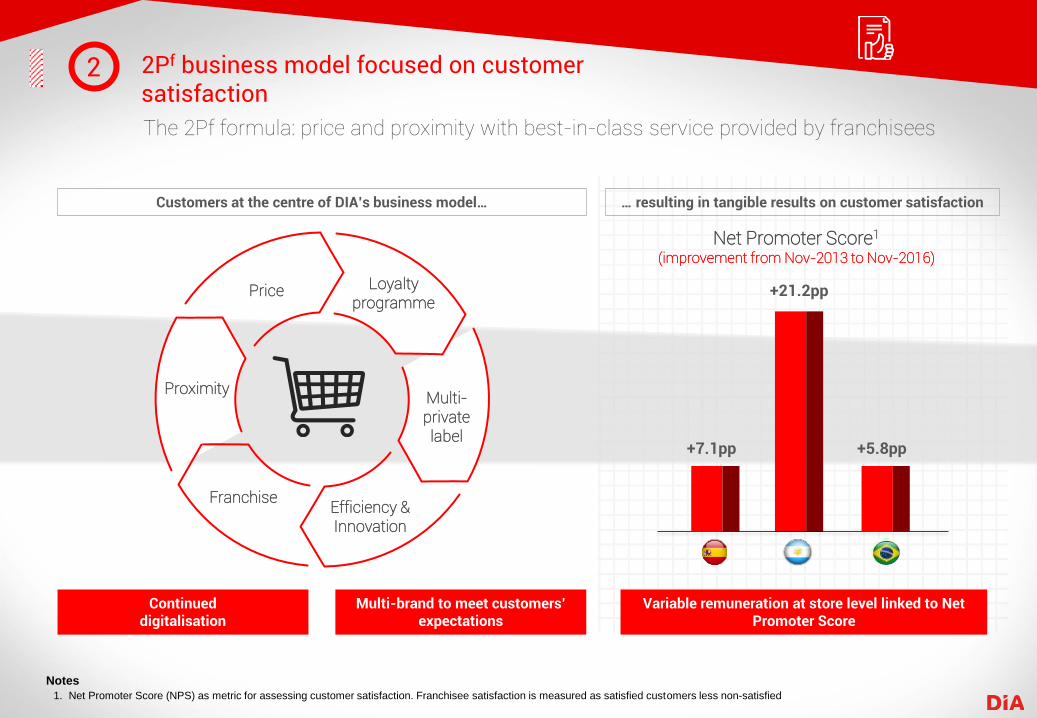
2Pf business model focused on customer satisfaction
The 2Pf formula: price and proximity with best-in-class service provided by franchisees
2
Customers at the centre of DIA’s business model… … resulting in tangible results on customer satisfaction
Notes
1. Net Promoter Score (NPS) as metric for assessing customer satisfaction. Franchisee satisfaction is measured as satisfied customers less non-satisfied
Variable remuneration at store level linked to Net Promoter Score
Net Promoter Score1
(improvement from Nov-2013 to Nov-2016)
Continued digitalisation
Multi-brand to meet customers’ expectations
Proximity
Price Loyalty programme
Franchise Efficiency & Innovation
Multi-private label
+21.2pp
+7.1pp +5.8pp
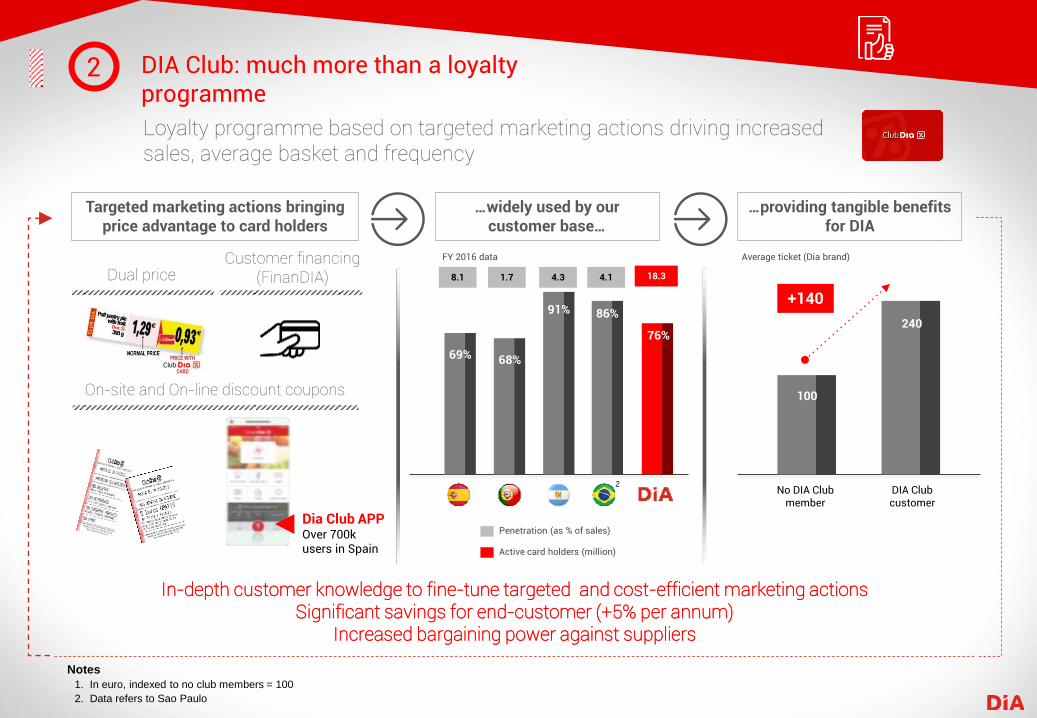
DIA Club: much more than a loyalty programme
Loyalty programme based on targeted marketing actions driving increased sales, average basket and frequency
2
Notes
1. In euro, indexed to no club members = 100
2. Data refers to Sao Paulo
Targeted marketing actions bringing price advantage to card holders
…widely used by our customer base…
…providing tangible benefits for DIA
In-depth customer knowledge to fine-tune targeted and cost-efficient marketing actions Significant savings for end-customer (+5% per annum)
Increased bargaining power against suppliers
Dual price
On-site and On-line discount coupons
Customer financing (FinanDIA)
Dia Club APP Over 700k users in Spain
69% 68%
91% 86%
76%
2
FY 2016 data
8.1 1.7 4.3 4.1 18.3
Penetration (as % of sales)
Active card holders (million)
Average ticket (Dia brand)
100
240
No DIA Club member
DIA Club customer
+140

Outstanding private label proposition backed-by strong innovation
Successful implementation of DIA’s private label in all countries driving superior price and quality image
2
A continued and cost-efficient innovation funnel… … with proven track record
Selection of base products
Testing
Manufacture
Finished products
• Choice and distribution of product • Description of quality specifications
Notes
1. Weight in Fast Moving Consumer Good sales
• Over 3,000 panel tests per year for validation and control
• Sourcing (selection of suppliers) • Logistics • Display • Multi-lingual packaging
• Systematic quality control at DIA warehouse labs
• Additional controls in external laboratories
Penetration1 of DIA’S private label vs. overall market (as a % of sales)
+44% SALES IN 2016 Latest launches
39%
53%
32%
54%
7% 5%
37% 35%
DIA PL share (%) Market PL share (%)

DIA poised for digital transformation
New measures have been implemented with a strong focus on improving operations for the 3 main pillars of the Company: customers, stores and local partners
2
Notes
1. Source Nielsen (Measured as satisfied less non-satisfied)
Customers Store management Franchisees
Digital transformation
> EUR120m sales in Spain in 2020 (x6 vs 2016)
Greater streamlining of tasks and improved quality of procedures
+ 9 pp improvement in franchise satisfaction1
• Store management: price, checks, offers
• Inventory: stock control, generation of files
• Logistic/Transport service: daily monitoring of service frequency and fleet
• Shopping list • Access to digitalised
discount coupons • Monthly expense control • Digital loyalty card • +3,000 Click&Collect points
• Franchisee App • Smart tracking of deliveries • Direct contact line with
Regional Centres

Franchise model: a fundamental pillar of the business
Unique franchise proposition supporting a flexible and efficient operation
3
Top 20 franchisor worldwide1/ #1 in food retail in Europe2 Well balanced store mix
…leading to a sustainable business model in the long run Continued increase of the franchising activity…
Notes
1. Top 100 global franchises (Franchise Direct); 2. By # of publicly published franchised stores; 3. Excludes China)
% of owned and franchised stores by segment
56%
44%
5,498
35% 65%
1,922
% Owned % Franchised
• Profitable capillarity
• Day-to-day management flexibility
• Efficient management of operational expenses
• Reduced personnel expenses
• Higher control of shrinkage
• Lower rotation of personnel vs. owned stores
• Higher commitment / top service
• Better knowledge of customers
Top franchise ranking by geography and years of experience in the country
#1
#1
Over 37 years retail and 27
franchising track-record
Over 23 years retail and 20
franchising track-record
#1
#1
Over 19 years retail and 15
franchising track-record
Over 15 years retail and 14
franchising track-record
#1
Weight of franchises (# stores)3
34% 34%
40% 40% 44% 44% 42%
52%
42%
55%
47%
60%
49%
61%
2011 2012 2013 2014 2015 2016 2010
DIA banner stores Total stores

Integrated and cost-efficient business model
Fully integrated and cost-effective supply chain based on our proprietary IT infrastructure resulting in recurrent industry-leading productivity and return on investment
3
Notes
1. DIA based on 2016 figures; Peers’ data based on 2015 figures; employees on a FTE basis
2. ROI as EBITDAR / Avg. invested capital; Avg. invested capital = Avg total assets exc cash + Avg D&A Avg account payables – Avg accrued liabilities + x5 Rent adjustment
3. Carrefour, Casino, Jeronimo Martins,, Metro, Morrison, Sainsbury, Sonae and Tesco
EBITDA per employee (k€)1 Efficient and integrated supply chain
Return on investment 2016 (%)1,2
Strong franchise platform Strict capital allocation process
14.7
10.2 Average peers3
+44%
19.4%
11.9% Average peers3
+750bps
Streamlined, fully integrated retail capabilities
Proprietary management system
End-to-end scope
Supplier
Warehouse
Transport
Owned Store /
Franchise

Efficient store portfolio management
Active store portfolio management to adapt to evolving customer requirements
3
Active Store Portfolio
Management
Continued rent negotiation
Refurbishment plans
Active store network
optimisation
Disciplined and smart capex allocation Rental flexibility
Continued effort towards sustainability Active network right-sizing
+1,400 transfers from COCO to COFO stores since 2011
+2,650 openings and
+1,300 closures
cumulated since 2011
• 90% Lease-hold
• Significant lessor
atomisation
• Contract flexibility < 1 year
commitment on average
• 7.0% rental per square
meter reduction in
2011-16 period
Notes
1. Includes rental costs related to property and equipment and revenue from lease agreements; Rents / AVG sqm Company owned company
operated + company owned franchise operated

Superior, resilient and consistent financial profile
4
Notes
1. Ex-currency
2. Defined as Net debt / Adjusted EBITDA
Gross sales under banner evolution (EURm) Stores (#)
Net debt & leverage2 evolution (EURm) Adjusted EBITDA (EURm)
2011 2012 2013 2014 2015 2016
4,355 4,617
6,102 6,938
7,337 7,420
2011 2012 2013 2014 2015 2016
7,810 8,587
9,096 9,199 10,306 10,314
2011 2012 2013 2014 2015 2016
466 529
581 589 614 628
2011 2012 2013 2014 2015 2016
576 629 651 533
1,132 878
1.2x 1.2x 1.1x 0.9x
1.9x
1.4x
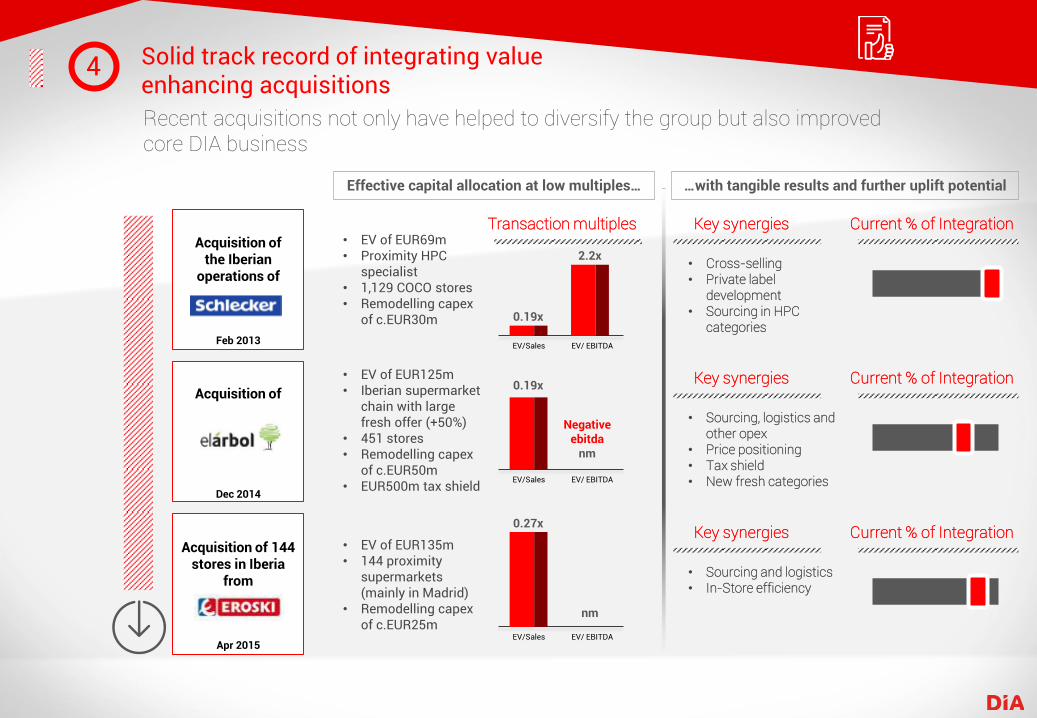
Solid track record of integrating value enhancing acquisitions
Recent acquisitions not only have helped to diversify the group but also improved core DIA business
4
Acquisition of the Iberian
operations of
Feb 2013
Acquisition of
Dec 2014
Acquisition of 144 stores in Iberia
from
Apr 2015
Effective capital allocation at low multiples… …with tangible results and further uplift potential
• EV of EUR69m • Proximity HPC
specialist • 1,129 COCO stores • Remodelling capex
of c.EUR30m
• EV of EUR125m • Iberian supermarket
chain with large fresh offer (+50%)
• 451 stores • Remodelling capex
of c.EUR50m • EUR500m tax shield
• EV of EUR135m • 144 proximity
supermarkets (mainly in Madrid)
• Remodelling capex of c.EUR25m
Key synergies Current % of Integration
• Cross-selling • Private label
development • Sourcing in HPC
categories
Key synergies Current % of Integration
• Sourcing, logistics and other opex
• Price positioning • Tax shield • New fresh categories
Key synergies Current % of Integration
• Sourcing and logistics • In-Store efficiency
Transaction multiples
EV/Sales EV/ EBITDA
0.19x
2.2x
EV/Sales EV/ EBITDA
0.19x
Negative ebitda
nm
EV/Sales EV/ EBITDA
0.27x
nm
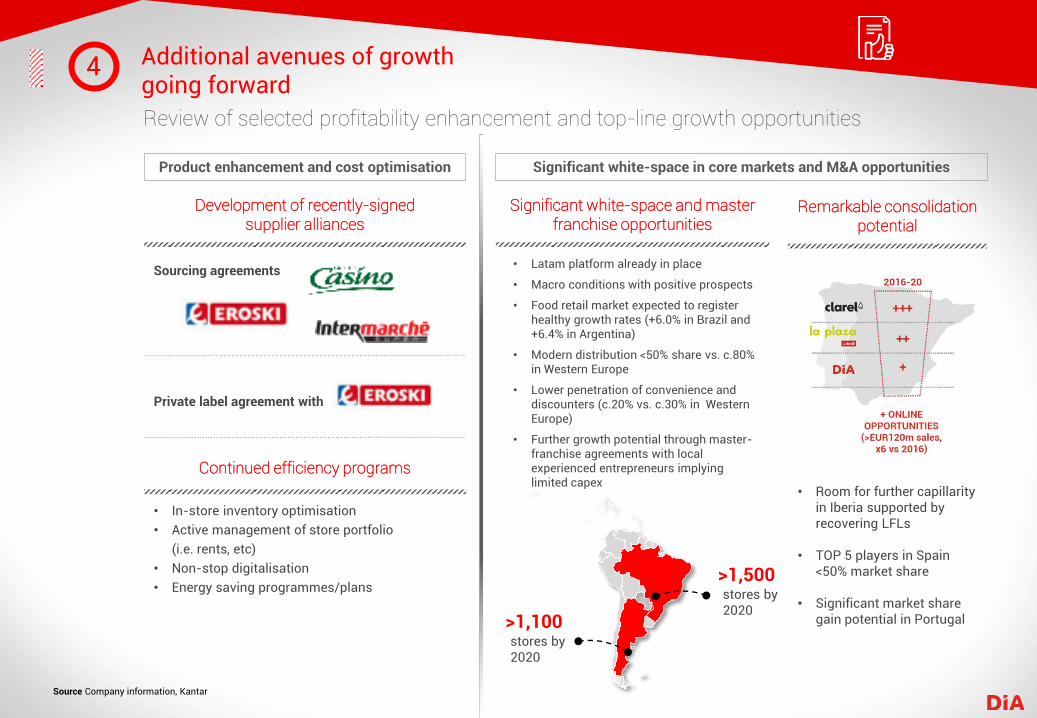
Additional avenues of growth going forward
Review of selected profitability enhancement and top-line growth opportunities
4
Source Company information, Kantar
Product enhancement and cost optimisation Significant white-space in core markets and M&A opportunities
Development of recently-signed supplier alliances
Sourcing agreements
Private label agreement with
Continued efficiency programs
• In-store inventory optimisation
• Active management of store portfolio
(i.e. rents, etc)
• Non-stop digitalisation
• Energy saving programmes/plans
Significant white-space and master franchise opportunities
Remarkable consolidation potential
• Latam platform already in place
• Macro conditions with positive prospects
• Food retail market expected to register healthy growth rates (+6.0% in Brazil and +6.4% in Argentina)
• Modern distribution <50% share vs. c.80% in Western Europe
• Lower penetration of convenience and discounters (c.20% vs. c.30% in Western Europe)
• Further growth potential through master-franchise agreements with local experienced entrepreneurs implying limited capex
• Room for further capillarity in Iberia supported by recovering LFLs
• TOP 5 players in Spain <50% market share
• Significant market share gain potential in Portugal >1,100
stores by 2020
>1,500 stores by 2020

Worked at P&G and Schweppes
Founder and CEO of Openbank and Director at British American Tobacco
Marketing manager at Cadbury Schweppes, Chairman & CEO of RJR Nabisco and Parques Reunidos
Worked at P&G for 33 years
Currently board member of Zinkia Entertainment
CEO at Dufry AG
Worked at TNT Leisure and Aldeasa
Worked at P&G , Ahold, Digsa, CEO of Toys R Us
Currently board member of Pascual
General Manager of Santander , CEO of Sabadell and VP and CEO of Caixabank
Current Board member of Société Générale
Worked at Cadbury, Coca Cola Schweppes, Debenhams and The Original Factory Shop
Currently board member of Brown Group
Worked at Bain, CEO of Microsoft Iberia and VP for EMEA of Microsoft Business solutions
Experienced management team supported by an industry-leading Board
DIA’s governing bodies as an example of the highest corporate governance standards
5
Key management Independent/External Directors of the Board
NAME
Ricardo Currás CEO
31 31
Diego Cavestany Chief Executive New Business DIA Spain Officer
29 29
Antonio Coto Executive Manager for Latin America and Partnerships
30 30
Juan Cubillo Business & Merchandise Executive Manager
23 23
Javier Lacalle Chief Resources Officer & China Executive
32 32
Amando Sánchez Chief Services Officer & Portugal Executive
5 20
Faustino Dominguez Chief Executive DIA Banner Spain Officer
26 26
YEARS AT DIA
YEARS OF INDUSTRY EXP.
NAME
Ana María Llopis Non-Executive Chairwoman
Mariano Martín Second Vice Chairman
Antonio Urcelay Board member
Juan María Nin Board member
Angela Spindler Board member
Richard Golding First Vice Chairman
Julián Díaz Board member
SELECTED PROFESSIONAL EXPERIENCE
María Garaña Board member
Former CFO at Inditex and El Corte Inglés Purchase Manager Borja de la Cierva Board member

Financial review
03
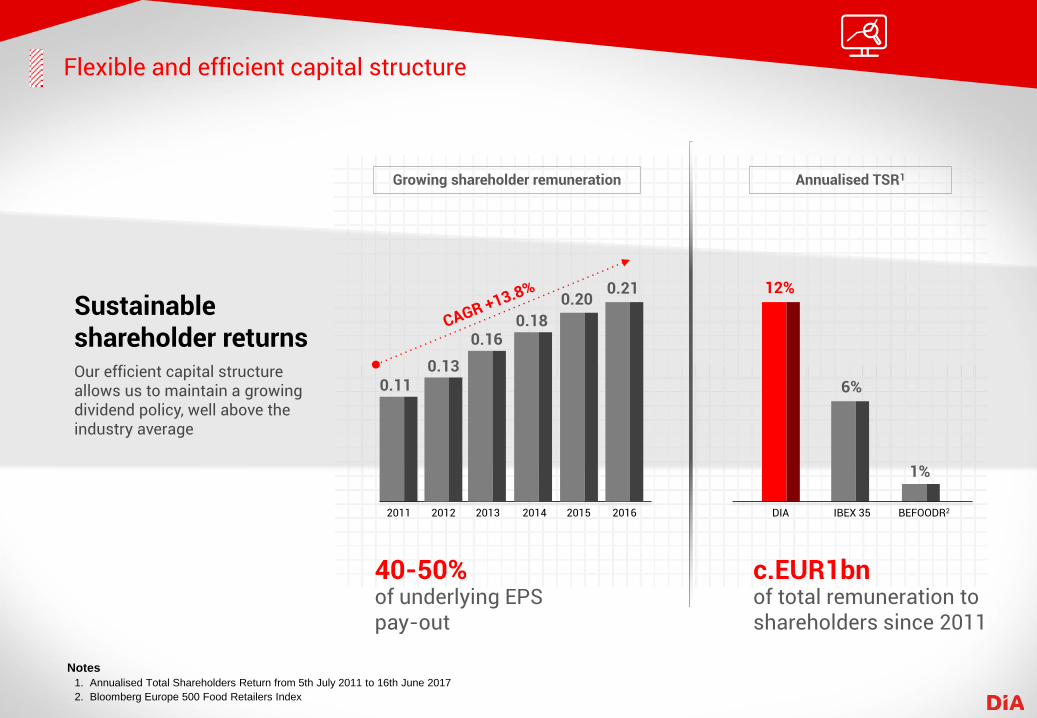
Flexible and efficient capital structure
Notes
1. Annualised Total Shareholders Return from 5th July 2011 to 16th June 2017
2. Bloomberg Europe 500 Food Retailers Index
Sustainable shareholder returns Our efficient capital structure allows us to maintain a growing dividend policy, well above the industry average
Growing shareholder remuneration Annualised TSR1
40-50% of underlying EPS pay-out
c.EUR1bn of total remuneration to shareholders since 2011
12%
6%
1%
DIA IBEX 35 BEFOODR2
0.11
2011 2012 2013 2014 2015 2016
0.13
0.16 0.18
0.20 0.21

Best-in-class financial metrics
DIA enjoys industry leading returns on investment and above average remuneration levels while maintaining a more conservative approach towards leverage than its peers
Notes
1. Return on Investment defined as EBITDAR/Average Invested Capital. Average Invested Capital defined as Equity + Net debt + 5x Rent adjustment + Accumulated D&A
2. Dividend yield based on current share price (as of April 24th 2017) and includes potential share buy backs already communicated to the market
3. Market average defined as the average for Carrefour, Casino, Jeronimo Martins, Metro, Morrisons, Sainsbury, Sonae and Tesco
2016 Return on Investment (ROI) (%)1
19.4%
11.9%
INDUSTRY AVERAGE3
DIA
+750bps
2016 Leverage (Net debt / Adjusted EBITDA)
1.9x
1.4x
INDUSTRY AVERAGE3
DIA
(0.5x)
2016 Expected dividend yield2 (%)
4.1%
2.9%
INDUSTRY AVERAGE3
DIA
+1.2%

Appendix Additional information
04

Definition of Alternative Performance Measures (APM)
• Gross sales under banner: total turnover value obtained in stores, including indirect taxes (sales receipt value) in all the company’s stores, both owned and franchised.
• Net sales: sum of the net sales generated in our integrated stores and sales to franchises.
• LFL sales growth under banner: growth rate of gross sales under banner at constant currency of the stores that have been operating for more than thirteen months under the same business conditions.
• Adjusted EBITDA: operating profit after adding back non-recurring costs, impairments, re-estimation of useful life and gains/losses arisen on the disposal of assets and depreciation and amortization of fixed assets.
• Adjusted EBIT: operating profit after adding back non-recurring costs, impairment and re-estimation of useful life and gains/losses arisen on the disposal of assets.
• Underlying net profit: net income calculated on net profit attributable to the parent company, excluding non-recurring items (restructuring costs, impairment and re-estimation of useful life, gain/losses on disposal of assets, tax litigations, exceptional financial expenses and equity derivatives), discontinued operations and the corresponding tax impact.
• Underlying EPS: fraction of the company’s profit calculated as underlying net profit divided by the weighted average number of shares.
• Cash From Operations (CFO): adjusted EBITDA less non-recurring cash items less capex on an organic basis.

Corporate Presentation