dhb hospital benchmark information reportfile/hbl0ct-dec2004.pdf · · 2014-08-01dhb hospital...
TRANSCRIPT

DHB
Hospital Benchmark Information
Report for the Quarter October-December 2004

Page 1
Ministry of Health. 2005. DHB Hospital Benchmark. Report for the Quarter October–December 2004.
Wellington: Ministry of Health
Published in May 2005 by the Ministry of Health
PO Box 5013, Wellington, New Zealand
ISSN 1176-9858 (Internet) HP 4119
This document is available on the Ministry of Health’s website: http://www.moh.govt.nz

DISCLAIMER
1. While every endeavour has been made to use accurate data in this Report, there are currently some variations in the way data is collected from District Health Boards that may result in errors, omissions and inaccuracies in the information contained in this Report Neither the Crown, Ministry of Health, its business units, nor their officers, employees and agents shall, under any circumstances, accept responsibility for or be liable in any way for any loss or direct, consequential, incidental, indirect or special damages of any kind, or any other damages howsoever arising (whether in negligence or otherwise) out of or in connection with the content and/or any omissions from the content, including, without limitation, those arising from:
i. the accuracy or completeness of any information available in this
Report; ii. any reliance of any kind whatsoever by users of any information
provided in this Report; iii. any responsibility or liability which may be incurred in respect of the
use of or reliance on information provided in this Report; iv. contingencies outside the control of the Crown, Ministry of Health, its
business units, or their officers, employees and agents; v. negligence of the Crown, Ministry of Health, its business units, or their
officers, employees and agents in procuring, complying, interpreting, editing, writing, reporting or delivering any content; or
vi. any other cause, except where liability is made non-excludable by legislation. Any clause, or part thereof, declared invalid shall be deemed severable and not affect the validity or enforceability of the remainder.
2. Users of this Report are advised to contact the relevant District Health Board or
District Health Boards or the Ministry of Health to confirm the accuracy of the information contained in this Report.
3. Each page of the Report must be read in conjunction with this disclaimer and
any other disclaimer which forms part of it.

Page 3
TABLE OF CONTENTS
DISCLAIMER............................................................................................................. 2 SECTION ONE—SUMMARY .................................................................................... 4
Introduction............................................................................................................. 4 Indicator summaries ............................................................................................... 5 DHB summaries...................................................................................................... 5
QUADRANT AND INDICATOR ANALYSIS .............................................................. 8 Organisational Health quadrant .......................................................................... 8
Staff Turnover ..................................................................................................... 8 Staff Stability ..................................................................................................... 10 Sick Leave ........................................................................................................ 11 Staff Work-related Injury or Illness .................................................................... 12
Quality and Patient Satisfaction quadrant........................................................ 14 Patient Satisfaction ........................................................................................... 14 Complaints Closed within 30 days .................................................................... 16 Hospital Acquired Blood Stream Infections ....................................................... 21
Process and efficiency quadrant....................................................................... 23 Resource Utilisation .......................................................................................... 23 Performance to Contract ................................................................................... 24 Average Length of Stay..................................................................................... 25 Daycase Surgery............................................................................................... 26
Financial quadrant.............................................................................................. 27 Operating Margins............................................................................................. 27 Revenue to Assets ............................................................................................ 29 Debt Ratio ......................................................................................................... 30
SECTION THREE—APPENDIX I: INDIVIDUAL DHB PERFORMANCE ................ 31 Northland DHB Hospitals ......................................................................................... 32 Waitemata DHB Hospitals........................................................................................ 35 Auckland DHB Hospitals .......................................................................................... 38 Counties Manukau DHB Hospitals ........................................................................... 41 Waikato DHB Hospitals ............................................................................................ 44 Bay of Plenty DHB Hospitals.................................................................................... 47 Lakes DHB Hospitals ............................................................................................... 50 Tairawhiti DHB ......................................................................................................... 53 Taranaki DHB Hospitals ........................................................................................... 56 Hawke’s Bay DHB Hospital ...................................................................................... 59 MidCentral DHB Hospitals........................................................................................ 62 Whanganui DHB Hospitals....................................................................................... 65 Capital & Coast DHB Hospitals ................................................................................ 68 Hutt Valley DHB Hospital ......................................................................................... 71 Wairarapa DHB Hospital .......................................................................................... 74 Nelson Marlborough DHB Hospitals......................................................................... 77 West Coast DHB Hospitals ...................................................................................... 80 Canterbury DHB Hospitals ....................................................................................... 83 South Canterbury DHB Hospitals ............................................................................. 86 Otago DHB Hospitals ............................................................................................... 89 Southland DHB Hospitals......................................................................................... 92 APPENDIX II: INDICATOR NOTES AND GLOSSARY........................................... 95

Introduction and summary
Page 4 Significance/significantly refers to statistical significance—see Appendix II
SECTION ONE—SUMMARY Introduction The Hospital Benchmark Information Report is compiled from data supplied by the hospital services in District Health Boards (DHB). The first Hospital Benchmark Information report was produced at the end of the March 2004 quarter. It evolved from the Balanced Scorecard Report that was originally developed by the Crown Company Monitoring and Advisory Unit (CCMAU) to monitor the hospitals of the then Hospital and Health Services. The information is divided into quadrants (Organisational Health, Quality and Patient Satisfaction, Process and Efficiency, Financial) that give different perspectives of the running of the DHBs. The data supplied by the DHBs is adjusted to give a comparable picture of DHBs’ performance. It is important that readers of the report differentiate between “raw” data such as the number of individual incidents eg, staff work-related injuries or illnesses, and the ‘Staff Work-related Injuries or Illnesses rate’, which is calculated dividing the number of individual incidents by the total number of hours worked by all employees. There are often significant differences among the 21 DHBs as they are not all the same size, cover different population needs and provide different services. Their populations, ages, ethnicities, and health status will all be unique. Therefore, comparisons using the Hospital Benchmark Information data must always be undertaken with caution. The DHBs are also structurally different, with the smallest DHB only having one hospital and emergency department, whereas other DHBs have several hospitals and emergency departments. For the Hospital Benchmark Information report, the data from all hospitals and emergency departments in a DHB is combined to give one result for each DHB. Favourable or unfavourable results can usually be explained by a variety of factors. The intention is that DHBs that have similarities should work with each other to understand why their results are different and take action when their results and subsequent investigations show their results are a significant outlier from the norm and/or sector standards. This report for the December 2004 quarter has taken a different format from previous reports. Results are given for all indicators and more contextual information is given. Users of this report are advised to contact the DHB or DHBs concerned, before drawing conclusions from the report.
Introduction and summary
Page 5 Significance/significantly refers to statistical significance—see Appendix II
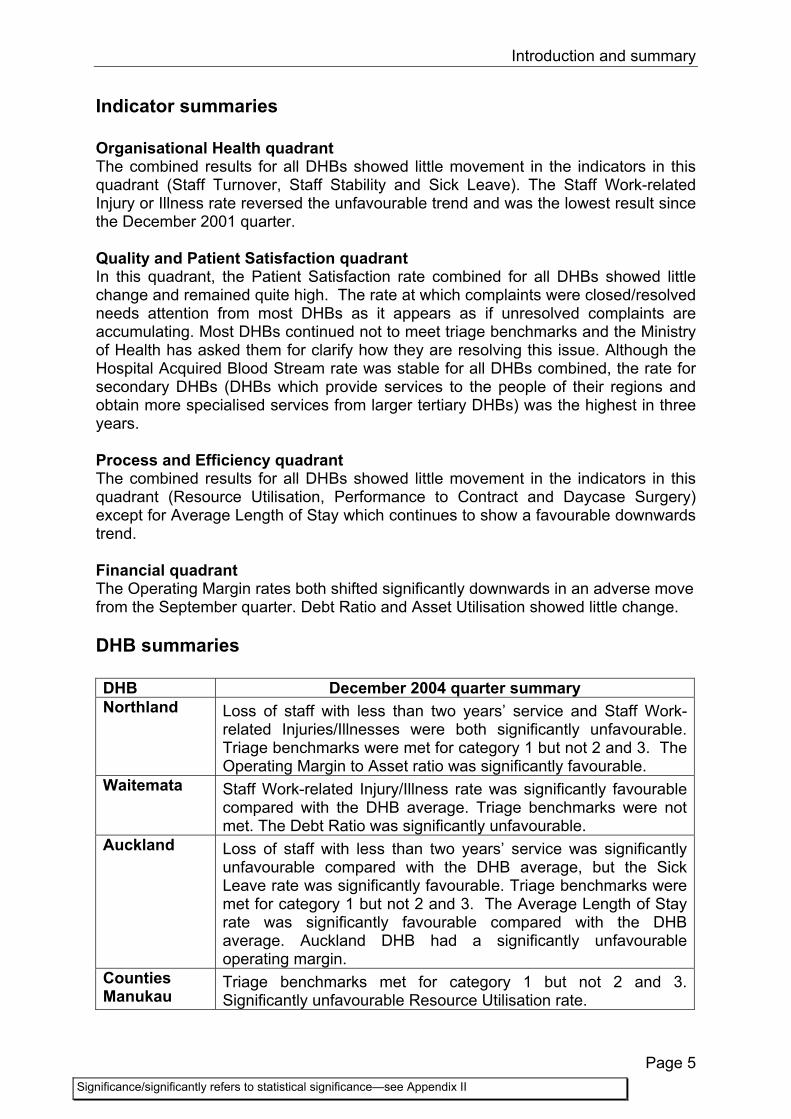
Indicator summaries Organisational Health quadrant The combined results for all DHBs showed little movement in the indicators in this quadrant (Staff Turnover, Staff Stability and Sick Leave). The Staff Work-related Injury or Illness rate reversed the unfavourable trend and was the lowest result since the December 2001 quarter. Quality and Patient Satisfaction quadrant In this quadrant, the Patient Satisfaction rate combined for all DHBs showed little change and remained quite high. The rate at which complaints were closed/resolved needs attention from most DHBs as it appears as if unresolved complaints are accumulating. Most DHBs continued not to meet triage benchmarks and the Ministry of Health has asked them for clarify how they are resolving this issue. Although the Hospital Acquired Blood Stream rate was stable for all DHBs combined, the rate for secondary DHBs (DHBs which provide services to the people of their regions and obtain more specialised services from larger tertiary DHBs) was the highest in three years. Process and Efficiency quadrant The combined results for all DHBs showed little movement in the indicators in this quadrant (Resource Utilisation, Performance to Contract and Daycase Surgery) except for Average Length of Stay which continues to show a favourable downwards trend. Financial quadrant The Operating Margin rates both shifted significantly downwards in an adverse move from the September quarter. Debt Ratio and Asset Utilisation showed little change. DHB summaries DHB December 2004 quarter summary Northland Loss of staff with less than two years’ service and Staff Work-
related Injuries/Illnesses were both significantly unfavourable. Triage benchmarks were met for category 1 but not 2 and 3. The Operating Margin to Asset ratio was significantly favourable.
Waitemata Staff Work-related Injury/Illness rate was significantly favourable compared with the DHB average. Triage benchmarks were not met. The Debt Ratio was significantly unfavourable.
Auckland Loss of staff with less than two years’ service was significantly unfavourable compared with the DHB average, but the Sick Leave rate was significantly favourable. Triage benchmarks were met for category 1 but not 2 and 3. The Average Length of Stay rate was significantly favourable compared with the DHB average. Auckland DHB had a significantly unfavourable operating margin.
Counties Manukau
Triage benchmarks met for category 1 but not 2 and 3. Significantly unfavourable Resource Utilisation rate.

Introduction and summary
Page 6 Significance/significantly refers to statistical significance—see Appendix II
DHB December 2004 quarter summary Waikato Triage benchmarks not met. Average Length of Stay rate was
significantly unfavourable compared with the DHB average. Debt Ratio was significantly unfavourable.
Bay of Plenty Loss of staff with less than two years’ service and Sick Leave rate both significantly unfavourable compared with the DHB average. Triage benchmarks not met. Currently Bay of Plenty is undertaking more work than it was contracted for, and has significantly favourable Operating Margin to Assets and Revenue to Assets ratios and Resource Utilisation rate.
Lakes The Sick Leave rate was significantly unfavourable. All three triage benchmarks were met and the Daycase Surgery rate was significantly favourable compared with the DHB average.
Tairawhiti Staff Turnover was significantly unfavourable compared with the DHB average, but the Sick Leave rate was significantly favourable. Triage benchmarks were not met for triage category 1 but met for 2 and 3. Currently Tairawhiti is undertaking more work than it was contracted for and the Resource Utilisation rate is significantly unfavourable. The Average Length of Stay and Daycase Surgery rates were significantly unfavourable compared with the DHB average.
Taranaki Staff Turnover and loss of staff with less than two years’ service were both significantly favourable compared with the DHB average. Triage benchmarks were met for category 1 but not 2 and 3. Currently Taranaki is undertaking more work than it was contracted for and the Operating Margin to Revenue was significantly favourable.
Hawke’s Bay Triage benchmarks met for category 1 but not 2 and 3. MidCentral Staff Turnover was significantly favourable compared with the
DHB average, but Sick Leave and Work-related Injury/Illness rates were both significantly unfavourable compared with the DHB average. Triage benchmarks were met for category 1 but not 2 and 3. The Daycase Surgery rate was significantly unfavourable compared with the DHB average. The Operating Margin to Asset ratio was significantly favourable.
Whanganui Triage benchmarks met for category 1 but not 2 and 3. Capital & Coast
Staff Turnover was significantly unfavourable compared with the DHB average, but the Sick Leave and Staff Work-related Injury/Illness rates were significantly favourable. Triage benchmarks were not met. The Average Length of Stay rate was significantly favourable compared with the DHB average. The Daycase Surgery rate was significantly unfavourable.
Hutt Staff Turnover was significantly unfavourable compared with the DHB average. Staff Work-related Injury/Illness rate was significantly favourable compared with the DHB average. Triage benchmarks were met for category 1 but not 2 and 3. Currently Hutt is undertaking more work than it was contracted for.
Introduction and summary
Page 7 Significance/significantly refers to statistical significance—see Appendix II
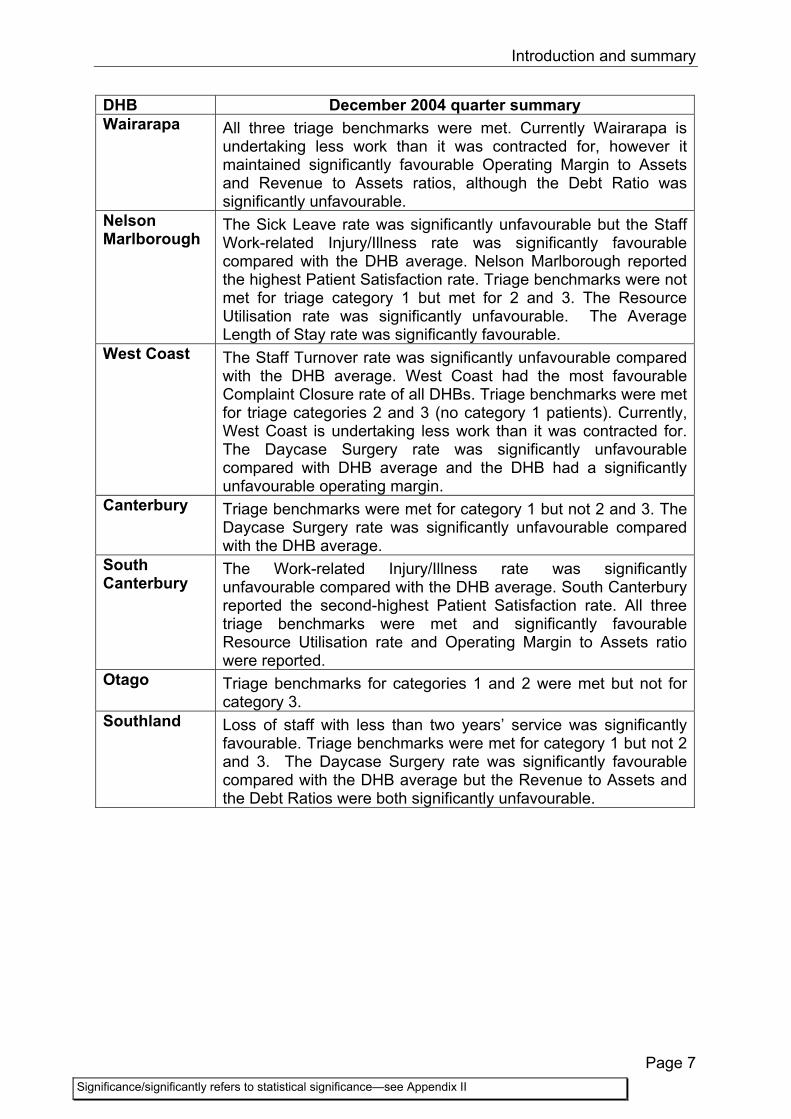
DHB December 2004 quarter summary Wairarapa All three triage benchmarks were met. Currently Wairarapa is
undertaking less work than it was contracted for, however it maintained significantly favourable Operating Margin to Assets and Revenue to Assets ratios, although the Debt Ratio was significantly unfavourable.
Nelson Marlborough
The Sick Leave rate was significantly unfavourable but the Staff Work-related Injury/Illness rate was significantly favourable compared with the DHB average. Nelson Marlborough reported the highest Patient Satisfaction rate. Triage benchmarks were not met for triage category 1 but met for 2 and 3. The Resource Utilisation rate was significantly unfavourable. The Average Length of Stay rate was significantly favourable.
West Coast The Staff Turnover rate was significantly unfavourable compared with the DHB average. West Coast had the most favourable Complaint Closure rate of all DHBs. Triage benchmarks were met for triage categories 2 and 3 (no category 1 patients). Currently, West Coast is undertaking less work than it was contracted for. The Daycase Surgery rate was significantly unfavourable compared with DHB average and the DHB had a significantly unfavourable operating margin.
Canterbury Triage benchmarks were met for category 1 but not 2 and 3. The Daycase Surgery rate was significantly unfavourable compared with the DHB average.
South Canterbury
The Work-related Injury/Illness rate was significantly unfavourable compared with the DHB average. South Canterbury reported the second-highest Patient Satisfaction rate. All three triage benchmarks were met and significantly favourable Resource Utilisation rate and Operating Margin to Assets ratio were reported.
Otago Triage benchmarks for categories 1 and 2 were met but not for category 3.
Southland Loss of staff with less than two years’ service was significantly favourable. Triage benchmarks were met for category 1 but not 2 and 3. The Daycase Surgery rate was significantly favourable compared with the DHB average but the Revenue to Assets and the Debt Ratios were both significantly unfavourable.

Quadrant and indicator analysis Organisational health quadrant
Page 8 The symbol # after a DHB name means the result is significantly higher or lower than the average for all DHBs. (Significance/significantly refers to statistical significance—see Appendix II) The symbols « and » after a DHB name indicate significantly adverse («) or significantly favourable (») movement compared with other DHBs since the previous quarter (see Appendix II).
QUADRANT AND INDICATOR ANALYSIS Organisational Health quadrant
Staff Turnover Indicator Description Voluntary resignation is when an employee formally notifies the organisation that they are voluntarily ceasing employment with the organisation, including retirement. The Voluntary Staff Turnover rate is calculated by dividing the number of employees who voluntarily resign during the quarter by the total number of employees at the beginning of the quarter. These numbers exclude Resident Medical Officers, casual and temporary employees and consultants or contracted personnel paid by another organisation. The rate counts only those resignations that were processed within the quarter. Comparison with last Quarter There was a 10.0% rise in the December 2004 quarter compared with the September 2004 quarter (Figure). This increase, however, is consistent with previous years’ trends where there have been increases in the December quarter. Comparison with the December 2003 quarter Compared to the December 2003 quarter, there was little change in Voluntary Staff Turnover rates. The four period moving average (Figure) shows that the trend was reasonably stable. Figure 2 shows that while staff numbers have increased since the June 2003 quarter, the number of staff resigning remained relatively constant. It must be noted that although the number of individual staff members increased, actual hours worked may not have increased at the same rate as a number of the staff will be working part-time.
2
3
4
5
Dec-01
Mar-02
Jun-0
2
Sep-02
Dec-02
Mar-03
Jun-0
3
Sep-03
Dec-03
Mar-04
Jun-0
4
Sep-04
Dec-04
Turn
over
as
% o
f sta
ff
Four period moving average
Figure 1. Staff Turnover—all DHBs
All DHBs
44,500
45,000
45,500
46,000
46,500
47,000
47,500
48,000
48,500
49,000
49,500
Dec-01
Mar-02
Jun-02
Sep-02
Dec-02
Mar-03
Jun-03
Sep-03
Dec-03
Mar-04
Jun-04
Sep-04
Dec-04
Tota
l sta
ff at
sta
rt o
f qua
rter
0
500
1,000
1,500
2,000
2,500
Res
igna
tions
Staff #s begQ (P Axis)
Staff Resigd # (S Axis)
Figure 2. Staff numbers and resignations—all DHBs

Quadrant and indicator analysis Organisational health quadrant
Page 9 The symbol # after a DHB name means the result is significantly higher or lower than the average for all DHBs. (Significance/significantly refers to statistical significance—see Appendix II) The symbols « and » after a DHB name indicate significantly adverse («) or significantly favourable (») movement compared with other DHBs since the previous quarter (see Appendix II).
Outliers Two DHBs had results showing significantly favourable movement while three DHBs had significantly higher (unfavourable) Voluntary Staff Turnover rates this quarter (Figure 3).
0 1 2 3 4 5 6
Tairaw hiti# West Coast#«
Capital & Coast# Hutt Valley#
Haw ke's Bay «Auckland
Otago Wairarapa
Canterbury All DHBs
Nelson Marlborough Counties Manukau
Lakes Whanganui «
Bay of Plenty Waitemata Southland
South Canterbury »Waikato
Northland MidCentral#»
Taranaki#
`
Figure 3. Staff Turnover—each DHB

Quadrant and indicator analysis Organisational health quadrant
Page 10 The symbol # after a DHB name means the result is significantly higher or lower than the average for all DHBs. (Significance/significantly refers to statistical significance—see Appendix II) The symbols « and » after a DHB name indicate significantly adverse («) or significantly favourable (») movement compared with other DHBs since the previous quarter (see Appendix II).
Staff Stability Indicator Description The Staff Stability indicator investigates the proportion of staff who have resigned within two years of their appointment. The Staff Stability rate is calculated by dividing the number of staff leaving the organisation with less than two years’ service during the quarter by the total number of staff with the organisation at the beginning of the quarter. This section also looks at the number of staff resigning with less than two years’ service as a proportion of total resignations. The definitions of “staff” and “resignation” are the same as those used in the Voluntary Staff Turnover indicator (see previous section). Comparison with last Quarter Figure 4 shows staff resigning with less than two years’ service as a percentage of total resignations. In the December 2004 quarter, this was 44.2%, a 2.6% drop from the September 2004 quarter (45.4%). Comparison with the December 2003 quarter There has been little change in both staff resigning with less than two years’ service as a percentage of all resignations and Voluntary Staff Turnover since the December 2003 quarter (Figure 4). Outliers Figure 5 shows the DHB ranking for staff resignations with less than two years’ service as a percentage of total resignations. Two DHBs showed significantly favourable movements this quarter (ie, a decrease in the rate), while two showed significantly adverse movements (ie, an increase in the rate).
40
42
44
46
48
50
52
54
Dec-01
Mar-02
Jun-02
Sep-02
Dec-02
Mar-03
Jun-03
Sep-03
Dec-03
Mar-04
Jun-04
Sep-04
Dec-04
Staf
f Res
gn <
2 yr
s se
rv, %
of a
ll R
esgn
0
1
2
3
4
5
Staff T/O R
ate®, %
Staff Resgn <2 yrs serv, % of allResgnStaff T/O Rate®, %
Figure 4. Staff resignations less than 2 yrs & Staff Turnover—all DHBs
0 20 40 60 80
Auckland # Northland #
Bay of Plenty # Hutt Valley
Haw ke's Bay «Whanganui «
Lakes Capital & Coast
West Coast All DHBs
Tairaw hiti »South Canterbury
Waitemata Wairarapa
Counties Manukau NelsonOtago
MidCentral Waikato
Canterbury Southland #»
Taranaki #
Figure 5. Staff resignations less than 2yrs/total resignations—each DHB

Quadrant and indicator analysis Organisational health quadrant
Page 11 The symbol # after a DHB name means the result is significantly higher or lower than the average for all DHBs. (Significance/significantly refers to statistical significance—see Appendix II) The symbols « and » after a DHB name indicate significantly adverse («) or significantly favourable (») movement compared with other DHBs since the previous quarter (see Appendix II).
Sick Leave Indicator Description This indicator measures the proportion of employees’ contracted work hours that are lost to sick leave. It is calculated by dividing the total number of hours of paid and unpaid sick leave taken by employees during the quarter by the total number of contracted employee hours at the beginning of the quarter. Unlike the Staff Stability and Voluntary Staff Turnover indicators, the definition of staff includes Resident Medical Officers and temporary staff. The definition of Sick Leave includes all paid and unpaid hours recorded as sick leave, including partial shift hours. A limitation of this indicator is that it does not distinguish between sick and domestic leave. Comparison with last Quarter Following seasonal trends, the Sick Leave rate for all DHBs combined for the December 2004 quarter was 2.94%, which was 22.0% lower than in the September 2004 quarter (3.77%) (Figure 6). Comparison with the December 2003 quarter Sick Leave shows strong cyclic peaks and troughs. When quarterly variations are removed, a stable trend tending slightly upwards can be seen. Outliers Three DHBs had significantly favourable movements in the Staff Sick Leave rate this quarter, while three DHBs showed significantly adverse movements. There is a sizeable range in the Staff Sick Leave rate among DHBs (Figure 7).
2.0
2.5
3.0
3.5
4.0
Dec-01
Mar-02
Jun-02
Sep-02
Dec-02
Mar-03
Jun-03
Sep-03
Dec-03
Mar-04
Jun-04
Sep-04
Dec-04
Staf
f Sic
kL R
ate®
, %
Four period moving average
Figure 6. Sick Leave rate—all DHBs
0 1 2 3 4 5
Bay of Plenty #«Nelson Marlborough #«
Lakes # MidCentral #
Otago Canterbury Hutt Valley »Northland
West Coast «All DHBs Taranaki
Southland Waikato »
South Canterbury Haw ke's Bay
Counties Manukau Wairarapa »Waitemata
Capital & Coast # Auckland # Tairaw hiti #
`
Figure 7. Staff Sick Leave rates—each DHB

Quadrant and indicator analysis Organisational health quadrant
Page 12 The symbol # after a DHB name means the result is significantly higher or lower than the average for all DHBs. (Significance/significantly refers to statistical significance—see Appendix II) The symbols « and » after a DHB name indicate significantly adverse («) or significantly favourable (») movement compared with other DHBs since the previous quarter (see Appendix II).
Staff Work-related Injury or Illness Indicator Description A work-related injury or illness relates to an injury or occupational illness, which arises out of, or in the course of employment and which has been medically certified. The Staff Work-related Injury/Illness rate is the ratio of all occurrences of work related injury or illness, which results in time lost from work to the total number of hours worked by all employees. The ratio is multiplied by 1,000,000 to improve the comparability among organisations of different size. The limitation with this indicator is that the numerator does not include all work-related injury or illness—only those that result in time lost from work. Figure 8 shows the rate for all DHBs combined and the table below shows the actual number of injuries or illnesses for the last four quarters. Staff work-related injury /illness numbers
Dec 04 Sep 04 Jun 04 Mar 04
All DHBs 159 218 183 212 Because there is a relatively small number of staff work-related injuries or illnesses reported, 159 in the December quarter (see table above) from all DHBs—minor fluctuations in the number of accidents or illnesses can cause large variations in the reported rate. Comparison with last quarter The Staff Work-related Injury or Illness rate for all DHBs combined dropped from 10.35% in the September quarter to 7.54% for the December quarter (Figure 8) and reached its lowest point since the December 2001 quarter.
6
9
12
15
Dec-01
Mar-02
Jun-0
2
Sep-02
Dec-02
Mar-03
Jun-0
3
Sep-03
Dec-03
Mar-04
Jun-0
4
Sep-04
Dec-04St
aff I
nj ra
te®
. In
jurie
s pe
r milli
on h
ours
wor
ked
Four period moving average
Figure 8. Staff Work-related Injury or Illness—all DHBs
0 5 10 15 20 25
MidCentral # Northland #
South Canterbury # Canterbury
Lakes Bay of Plenty
Southland Taranaki «
Wairarapa «Counties Manukau
West Coast All DHBs Auckland
Haw ke's Bay Waikato
Otago Tairaw hiti
Whanganui Waitemata # Hutt Valley #
Nelson Marlborough # Capital & Coast #
Figure 9. Staff Work-related Injury/Illness—each DHB

Quadrant and indicator analysis Organisational health quadrant
Page 13 The symbol # after a DHB name means the result is significantly higher or lower than the average for all DHBs. (Significance/significantly refers to statistical significance—see Appendix II) The symbols « and » after a DHB name indicate significantly adverse («) or significantly favourable (») movement compared with other DHBs since the previous quarter (see Appendix II).
Comparison with the December 2003 quarter Compared with the December 2003 quarter the Staff Work-related Injury/Illness rate decreased in the December 2004 quarter. The actual number of injuries/illnesses for all DHBs combined decreased from 161 for the December 2003 quarter to 159 for the December 2004 quarter while the number of worked hours increased. Outliers The DHBs with the lowest and highest rates of Staff Work-related Injury or Illness for the last four quarters (Figure 9) remained similar to previous quarters. Figure 9 highlights the wide range between the highest and lowest reported rates. This quarter, no DHBs had significantly favourable movements, but two DHBs had significantly adverse movements.

Quadrant and indicator analysis Quality and Patient Satisfaction quadrant
Page 14 The symbol # after a DHB name means the result is significantly higher or lower than the average for all DHBs. (Significance/significantly refers to statistical significance—see Appendix II) The symbols « and » after a DHB name indicate significantly adverse («) or significantly favourable (») movement compared with other DHBs since the previous quarter (see Appendix II).
Quality and Patient Satisfaction quadrant
Patient Satisfaction Indicator description The sending out of patient satisfaction questionnaires commenced for all public hospitals in 1993. The questionnaires are made up of a number of questions that differ slightly between inpatients and outpatients (also includes patients admitted for day procedures). It is intended that the questionnaires are sent out to a number of inpatients and outpatients after their hospital stay or visit. The number sent out is proportional to the total number of patients. DHBs are expected to receive enough responses to give a 95% confidence level that the questionnaires returned give an accurate picture of the total number of patients. The response to the question “Overall, how satisfied were you with our service?” is measured on a Likert scale, ranging from 1 to 5. A rate is calculated for both inpatients and outpatients. These rates are the weighted sum of the percentage of responses that fall into each of the five categories “very poor”, “poor”, “average”, “good” and “very good”. There is anecdotal evidence to suggest that factors such as age and ethnicity may influence how patients rate their satisfaction level on the questionnaire. Therefore, the characteristics of DHB populations must be considered when comparing satisfaction ratings. Comparison with last quarter Review of literature from the United States and Finland suggests that Patient Satisfaction surveys in health services produce quite favourable results. This is no different in New Zealand. If a benchmark for performance of 87.5% is used so that, on average, patient satisfaction is halfway between ‘good’ and ‘very good’, 13 DHBs met that benchmark in the December 2004 quarter. The combined result for all DHBs in the Patient Satisfaction indicator improved slightly in the December quarter from the September quarter. Since March 2002, the average for all DHBs has remained above the benchmark of 87.5% described above. Comparison with the December 2003 quarter The majority of DHBs have improved on their patient satisfaction results from the same quarter last year.
86.0
86.5
87.0
87.5
88.0
88.5
Dec-01
Mar-02
Jun-0
2
Sep-02
Dec-02
Mar-03
Jun-0
3
Sep-03
Dec-03
Mar-04
Jun-0
4
Sep-04
Dec-04
Pat S
at ra
te®
, as
a p
erce
ntag
e Four period moving average
Figure 10. Patient Satisfaction rate—all DHBs

Quadrant and indicator analysis Quality and Patient Satisfaction quadrant
Page 15 The symbol # after a DHB name means the result is significantly higher or lower than the average for all DHBs. (Significance/significantly refers to statistical significance—see Appendix II) The symbols « and » after a DHB name indicate significantly adverse («) or significantly favourable (») movement compared with other DHBs since the previous quarter (see Appendix II).
Patient satisfaction
rates December 04 quarter %
Comparison of Dec 04 with Dec 03 results
Patient satisfaction rates December 03 quarter %
Better Worse Northland 87.08 86.94 Waitemata 85.61 86.23 Auckland 84.59 83.07 Counties Manukau 86.56 85.95 Waikato 89.19 86.48 Bay of Plenty 87.28 87.87 Lakes 86.49 81.85 Tairawhiti 90.13 89.52 Taranaki 88.42 88.03 Hawke’s Bay 87.93 86.92 MidCentral 88.64 88.14 Whanganui 90.58 89.77 Capital and Coast 85.41 85.12 Hutt 89.77 90.07 Wairarapa 90.41 89.38 Nelson Marlborough 92.96 92.32 West Coast 89.66 92.56 Canterbury 90.27 89.39 South Canterbury 90.81 87.08 Otago 89.54 90.95 Southland 85.80 85.50 All DHBs 88.04 87.65
Table 1. Patient Satisfaction rate changes Dec 03 to Dec 04—each DHB
Outliers Figure 11 shows the range between the highest and lowest patient satisfaction rate. The required confidence level of 95% was achieved for inpatients by five DHBs and for outpatients by six DHBs. This means that most DHBs are not receiving enough valid responses to represent the patients, so there is a need either to send out more patient satisfaction questionnaires or to improve the return rate. The question on the inpatient questionnaire that received the lowest satisfaction rate was about hospital food. The only DHB to score above 80% was West Coast, but the confidence level in this result is only 54% (because of the DHB’s low response rate). Two DHBs scored in the high seventies, these being Nelson Marlborough and Waikato.
80 85 90 95
Auckland Capital & Coast
Waitemata Southland «
Lakes »Counties Manukau
Northland «Bay of Plenty Haw ke's Bay
All DHBs Taranaki
MidCentral Waikato
Otago West Coast Hutt Valley Tairaw hiti »
Canterbury Wairarapa «
Whanganui South Canterbury # Nelson Marlborough
Figure 11. Patient Satisfaction rate—each DHB

Quadrant and indicator analysis Quality and Patient Satisfaction quadrant
Page 16 The symbol # after a DHB name means the result is significantly higher or lower than the average for all DHBs. (Significance/significantly refers to statistical significance—see Appendix II) The symbols « and » after a DHB name indicate significantly adverse («) or significantly favourable (») movement compared with other DHBs since the previous quarter (see Appendix II).
Complaints Closed within 30 days Indicator description In the Health and Disability Commissioner’s Code of Health and Disability Services Consumers’ Rights Regulation 1996, Right 10 outlines the rights of patients to complain. The right states that providers must facilitate “fair, simple, speedy, and efficient resolution”. Ideally a high proportion of complaints should be closed within 30 days. When calculating the rate for this indicator, the numerator is the number of complaints resolved within 30 days of receipt, while the denominator is the total number of complaints received during the quarter. Complaints are considered to be “resolved” when the DHB determines this is so. Currently it is up to a DHB to determine customer satisfaction with respect to the resolution of their complaint. A high number of complaints or an increasing trend can be associated with an increased level of dissatisfaction but, conversely, an increase could be a sign of an efficiently operating complaints system where people see effective change and so feel it is worthwhile to complain.
Comparison with last quarter Complaints received and complaints resolved/closed continued to run parallel (Figure 12) with quite a wide separation suggesting that unresolved/unclosed complaints are accumulating in DHBs as new complaints come in.
December 04 quarter September 04 quarter Complaints resolved within 30 days
Complaints received
Complaints resolved within 30 days
Complaints Resolved/Closed Complaints
received Number % Number %
All DHBs 1855 1310 70.62 1979 1321 66.75 Comparison with the December 2003 quarter Over the last four quarters the number of complaints has been increasing and, although the closure rate was higher in the December 2004 quarter than the other quarters in 2004, the number of complaints closed was lower for 2004 than it was for 2003.
0
500
1,000
1,500
2,000
2,500
Dec-01
Mar-02
Jun-02
Sep-02
Dec-02
Mar-03
Jun-03
Sep-03
Dec-03
Mar-04
Jun-04
Sep-04
Dec-04
Num
ber o
f com
plai
nts
Compl Closd in 30 days (L Axis)
Compl Recvd (L Axis)
Figure 12. Complaints received and resolved-all DHBs

Quadrant and indicator analysis Quality and Patient Satisfaction quadrant
Page 17 The symbol # after a DHB name means the result is significantly higher or lower than the average for all DHBs. (Significance/significantly refers to statistical significance—see Appendix II) The symbols « and » after a DHB name indicate significantly adverse («) or significantly favourable (») movement compared with other DHBs since the previous quarter (see Appendix II).
December 04 quarter December 03 quarter
Complaints resolved within 30days
Complaints received
Complaints resolved within 30days
DHB Complaints received
Number % Number % All DHBs 1855 1310 70.62 1721 1162 67.52
Outliers The only significant outlier in the December 2004 quarter results was West Coast, which reported a very high closure rate because it received fewer complaints than the previous quarter, and it closed a large number of complaints from the December quarter and also some that had been received towards the end of the previous quarter.
0 50 100 150 200 250
Wairarapa Canterbury
Auckland Nelson Marlborough
Capital & Coast Waitemata
Haw ke's Bay Whanganui
All DHBs Lakes
Waikato Northland Southland
Bay of Plenty Otago
Tairaw hiti Taranaki
MidCentral Hutt Valley
South Canterbury Counties Manukau
West Coast #»
`
Figure 13. Complaints resolved/closed—each DHB

Quadrant and indicator analysis Quality and Patient Satisfaction quadrant
Page 18 The symbol # after a DHB name means the result is significantly higher or lower than the average for all DHBs. (Significance/significantly refers to statistical significance—see Appendix II) The symbols « and » after a DHB name indicate significantly adverse («) or significantly favourable (») movement compared with other DHBs since the previous quarter (see Appendix II).
Triage Indicator description On arrival in an emergency department (ED), patients are assessed by a nurse trained in triage, and assigned a triage code. This code refers to the urgency with which patients need to receive treatment for the best possible outcome. The order in which patients are seen a doctor is influenced largely by the patients’ triage codes. Only codes 1-3 are reviewed in the Hospital Benchmark Information report, although ED staff also record codes 4-5.
Triage Code
Time interval between triage and seeing doctor
Examples of conditions in this triage code
1 immediate These patients tend to have an immediate “life or limb threat”, such as immediate risk to airway, breathing or circulation, or deeply unconscious. For example, those in need of resuscitation, not breathing, heart not beating, major trauma.
2 10 mins These patients tend to have a potential, or imminent, threat to “life or limb”. For example, serious head injury, moderately severe trauma, massive bleeding, chest pain-suspected heart attack, any conditions with a high potential to deteriorate.
3 30 mins These patients tend to have conditions, which need urgent management, or are associated with significant symptoms. For example, fractures, breathlessness, severe pain, bleeding.
Details of the triage definitions and examples can be found on the Australasian College for Emergency Medicine (ACEM) website (www.acem.org.au ) under ‘Policies and Guidelines’. Doctors cannot always see the patients within the timeframes listed above because of fluctuation in the numbers of patients presenting to an ED, the seriousness of their conditions and other pressures on an ED’s resources. In acknowledgement of these fluctuations, benchmarks are set that indicate the acceptable percentage of patients who will be seen by a doctor within the ideal time for their triage category. These benchmarks allow for periods of heavy demand when the ideal times cannot be achieved. However, the ideal times should be achieved most of the time, and more consistently for the more urgent triage categories. The Hospital Benchmark Information report uses the ACEM benchmarks. These benchmarks are recognised by ED clinicians as being quite high. If EDs are not meeting the benchmarks, this means that doctors are not seeing the “acceptable percentage of patients” in time, and there are more patients waiting for longer than the ideal time to see a doctor.
Triage Code
ACEM benchmarks: Percentage of patients who should be seen by the doctor in the required time interval, if the ED is performing to the required standard.
1 100% of all patients coded as 1 seen immediately. 2 80% of all patients coded as 2 seen within 10 minutes. 3 75% of all patients coded as 3 seen within 30 minutes.
Currently, triage reporting systems vary across DHBs and so comparison amongst DHBs is difficult. An example of these variations is that some DHBs are including patients, who are referred by General Practitioners (GP), in the numbers of patients reported as attending the EDs, whereas other DHBs exclude these patients.

Quadrant and indicator analysis Quality and Patient Satisfaction quadrant
Page 19 The symbol # after a DHB name means the result is significantly higher or lower than the average for all DHBs. (Significance/significantly refers to statistical significance—see Appendix II) The symbols « and » after a DHB name indicate significantly adverse («) or significantly favourable (») movement compared with other DHBs since the previous quarter (see Appendix II).
Some DHBs have several hospitals with EDs, For the HBI report, the triage results are aggregated to give one figure for any DHB. Some DHBs may not reach the benchmark, but will have many patients seen by a doctor soon after the triage time. These figures do not state whether patients, on average, waited a long time or a short time after the triage time had expired. Some DHBs have processes and pathways for patient care involving clinicians other than doctors (nurse initiated care, for example) and, in the majority of cases, the patients are being monitored by nurses while waiting for a doctor. It should be emphasised that these waiting times reflect the time to see a doctor and, in many cases, good clinical care is in place prior to a doctor seeing a patient. Consequently, the triage indicator figures for a DHB are a gross measure of performance, and should prompt a DHB to examine its own systems for specific elements that may need improvement. Comparison with last quarter In the December 2004 quarter, seven DHBs did not meet the benchmark for triage category 1 (all patients to be seen immediately), 14 did not meet the benchmark for triage category 2 (80% of patients to be seen within 10 minutes) and 15 did not meet the benchmark for triage category 3 (75% of patients to be seen within 30 minutes). This is a similar picture to the previous quarter (September 2004). Comparison with the December 2003 quarter The average results for all DHBs combined have shown little change over the last three years (Figure 14). Outliers The four DHBs that met all three triage benchmarks for the December 2004 quarter were: Lakes (Taupo and Rotorua EDs), Wairarapa (Masterton ED), South Canterbury (Timaru ED) and West Coast (Grey, Buller and Reefton EDs).
40
50
60
70
80
90
100
Dec-01
Mar-02
Jun-0
2
Sep-02
Dec-02
Mar-03
Jun-0
3
Sep-03
Dec-03
Mar-04
Jun-0
4
Sep-04
Dec-04
Perc
enta
ge
Triage 1
Triage 2
Triage 3Triage 3 Th h ld 75
Triage 2
Triage 1
Figure 14. Triage times—all DHBs

Quadrant and indicator analysis Quality and Patient Satisfaction quadrant
Page 20 The symbol # after a DHB name means the result is significantly higher or lower than the average for all DHBs. (Significance/significantly refers to statistical significance—see Appendix II) The symbols « and » after a DHB name indicate significantly adverse («) or significantly favourable (») movement compared with other DHBs since the previous quarter (see Appendix II).
Triage Dec 2004 Triage Sep 2004 1 2 3 1 2 3
DHB No % No % No % No % No % No %
Northland 48 100.00 767 77.71 2516 71.54 25 100.00 433 70.90 1461 56.54 Waitemata 69 50.72 1890 29.63 5698 29.06 44 100.00 572 98.25 1736 95.39 Auckland 386 100.00 2551 33.99 6751 39.95 400 100.00 2735 33.97 7957 38.65 Counties Manukau 110 100.00 2113 63.18 6953 43.65 97 100.00 2118 64.64 8188 42.54 Waikato 93 95.70 1429 56.19 7107 42.94 94 95.74 1592 45.98 7872 37.84 Bay of Plenty 125 98.40 1448 52.35 5678 44.73 99 88.89 1497 46.03 6036 38.88 Lakes * 9 100.00 320 84.06 2279 75.82 14 100.00 359 84.40 2562 70.69 Tairawhiti 9 88.89 137 97.08 644 98.45 7 100.00 134 97.01 515 99.03 Taranaki 12 100.00 315 70.79 2631 70.85 10 100.00 358 70.95 2490 67.59 Hawke’s Bay 75 100.00 529 71.27 2653 50.06 51 94.12 581 62.48 2807 48.45 MidCentral 34 100.00 781 59.67 3227 58.10 48 100.00 752 37.50 3719 33.02 Whanganui 6 100.00 72 79.17 869 73.99 4 100.00 94 81.91 837 80.88 Capital and Coast 78 98.72 1297 69.78 3409 57.20 90 98.89 1165 64.46 3115 48.57 Hutt 30 100.00 568 77.82 2359 46.38 43 100.00 644 72.67 2862 42.70 Wairarapa * 11 100.00 293 100.00 1514 100.00 17 100.00 291 100.00 1513 100.00 Nelson Marlborough 7 71.43 592 81.59 2500 77.80 8 87.50 533 87.62 2467 78.07 West Coast * 0 0 52 84.62 1080 75.09 1 100.00 50 96.00 1309 75.63 Canterbury 169 94.67 2028 49.16 8209 42.21 169 90.53 2067 51.33 8550 41.92 South Canterbury * 6 100.00 154 80.52 1105 79.64 15 93.33 174 77.01 1275 80.24 Otago 53 100.00 1051 81.07 2844 54.82 48 100.00 1147 79.86 3058 47.06 Southland 22 100.00 276 68.12 1799 60.20 12 100.00 257 75.88 2012 65.41
No = number of patients in the triage category attending EDs in the quarter % = percentage of patients seem within the triage time * = met all 3 triage benchmarks in December 2004
Table 2. Triage data December and September 2004 quarters—each DHB

Quadrant and indicator analysis Quality and Patient Satisfaction quadrant
Page 21 The symbol # after a DHB name means the result is significantly higher or lower than the average for all DHBs. (Significance/significantly refers to statistical significance—see Appendix II) The symbols « and » after a DHB name indicate significantly adverse («) or significantly favourable (») movement compared with other DHBs since the previous quarter (see Appendix II).
Hospital Acquired Blood Stream Infections Indicator description In New Zealand, and in other developed countries, approximately 10% of hospital patients acquire an infection that was neither present, nor incubating, when they were admitted to hospital. Of all hospital-acquired infections, blood stream infections are associated with the greatest rates of illness and death.
Not all hospital acquired blood stream infections are avoidable. There are several factors that increase the risk of patients acquiring a blood stream infection. The factors include the number of intravenous or intra-arterial lines patients have—the greater the number, the higher the risk. Another factor is the status of the patient’s immune system (ie, the body’s defence system against infection). The immune system can be affected either by illnesses like leukaemia or treatments such as chemotherapy. Tertiary hospitals (those that provide specialised care to patients from other DHBs as well as general services to the people of their own districts) generally have higher numbers of patients with higher risks of acquiring blood stream infections.
Monitoring (surveillance) of hospital acquired infections requires co-operation among various staff with Infection Control responsibilities, including laboratory technicians, nurses and doctors. All DHB hospitals have to have some form of surveillance as required by the New Zealand Standard 8142:2000—Infection Control.
Currently the Ministry of Health and DHBs are considering the feasibility of a national surveillance system.
For the Hospital Acquired Blood Stream Infections rate, significance ratings are calculated only on changes between periods.
The criteria for hospital acquired blood stream Infections reported in the Hospital Benchmark Information report are: • a blood test more than 48 hours after admission to hospital shows an infection • there is no evidence the infection was present on admission (unless the patient
had been in the same hospital recently) • when blood tests show bacteria normally found on skin, two tests are required to
confirm there is an infection (unless a clinician deems there is a blood stream infection, in which case one test is enough).
Some hospital acquired blood stream infections are not diagnosed either because blood tests are not taken, or because the patient is discharged from hospital before the symptoms are evident.
The denominator used for this indicator is the number of patients recorded at the hospital’s midnight census.
Because of the generally low number of infections, small changes in absolute numbers can lead to large apparent changes in performance and, for this reason the analysis looks at results over the last four quarters.

Quadrant and indicator analysis Quality and Patient Satisfaction quadrant
Page 22 The symbol # after a DHB name means the result is significantly higher or lower than the average for all DHBs. (Significance/significantly refers to statistical significance—see Appendix II) The symbols « and » after a DHB name indicate significantly adverse («) or significantly favourable (») movement compared with other DHBs since the previous quarter (see Appendix II).
Comparisons must be made with caution for various reasons. A higher than average reported infection rate may be due to an efficient surveillance system rather than poor practice. Also, there is some evidence that the definition of hospital acquired blood stream infection is not interpreted consistently by different hospital staff. Comparison with last quarter There were no significant changes to performance in the Hospital Acquired Blood Stream Infection rate in the December quarter. The actual total of individual infections reported from all DHBs went up by 12 infections (December quarter—405, September quarter—393). Comparison with the December 2003 quarter The overall results for all DHBs for the December 2004 quarter were lower than the December 2003 quarter (see table below).
*HABSI - December 2004 *HABSI – December 2003 *HABSI number rate number rate
All DHBs 405 3.06 408 3.18 *HABSI=Hospital acquired blood stream infection
However, the results for secondary DHBs only—the total number of infections (92) and the Hospital Acquired Blood Stream Infection rate (1.57), were both the highest in three years Outliers West Coast and Taranaki showed a significant movement in results. In both cases, this was a worsening of the rate, but this was due to only two more actual infections in both DHBs.
0
2
4
6
Dec
-01
Mar
-02
Jun-
02
Sep-
02
Dec
-02
Mar
-03
Jun-
03
Sep-
03
Dec
-03
Mar
-04
Jun-
04
Sep-
04
Dec
-04
Last
4 Q
HAB
SI-R
ate®
. Pe
r 1,0
00 In
Pat a
t Qtr
star
t+In
pat a
dmis
sion
s in
Qtr Terti
All
Secondar
Figure 15. Hospital Acquired Bloodstream
Infections—all DHBs
0 2 4 6 8
Whanganui Wairarapa
Lakes South Canterbury
Hutt Valley Northland Taranaki «
Nelson Marlborough Tairawhiti
West Coast «Southland
Waitemata Hawke's Bay Bay of Plenty
MidCentral Counties Manukau
Canterbury Otago
Waikato Capital & Coast
Auckland All DHBs
Tertiary
Secondary
Figure 16. Hospital Acquired Blood Stream
Infections—each DHB

Quadrant and indicator analysis Process and efficiency quadrant
Page 23 The symbol # after a DHB name means the result is significantly higher or lower than the average for all DHBs. (Significance/significantly refers to statistical significance—see Appendix II) The symbols « and » after a DHB name indicate significantly adverse («) or significantly favourable (») movement compared with other DHBs since the previous quarter (see Appendix II).
Process and efficiency quadrant
Resource Utilisation
Indicator description The Resource Utilisation ratio is a financial measure that compares the value of “output” (work done) against the cost associated with producing that output. It is calculated by dividing the value of the actual outputs produced during a quarter by the net operating costs of that quarter. The desirable rate is greater than 100% indicating that the value of outputs is greater than the costs of producing them. It is expected that, if the contributing factors are well managed, then the indicator result should either at least stay the same or gradually improve (ie, increase) and, for that reason, it is most useful to look at trends rather than individual results. Comparison with last quarter It is difficult to compare Resource Utilisation across quarters as there tends to be variance during individual financial years. For example, the first quarter in the financial year is during winter when demand can peak, and resources are likely to be fully utilised. Comparison with the December 2003 quarter The more robust comparison examines the reported changes over time in Resource Utilisation, rather than the levels themselves from quarter to quarter (Figure 18). Outliers Nelson Marlborough, Counties Manukau and Tairawhiti all have significantly lower Resource Utilisation rates. Bay of Plenty has had a substantial increase in its rate year on year.
75 80 85 90 95 100 105
Nelson Marlborough # Counties Manukau #
Tairawhiti #«Capital & Coast
Auckland Wairarapa »Hutt Valley
West Coast «All DHBs
Southland Whanganui
Northland MidCentral »Waitemata
Lakes Waikato
Canterbury Otago
Taranaki Hawke's Bay »
South Canterbury # Bay of Plenty #»
Figure 17. Resource Utilisation rate last 4 quarters—each DHB
-10% -5% 0% 5% 10%
Tairaw hiti «West Coast «
Auckland Waitemata Hutt Valley
Counties Manukau Lakes
Capital & Coast Waikato
Nelson Marlborough All DHBs
South Canterbury Canterbury Whanganui Southland Northland
Otago Taranaki
MidCentral »Haw ke's Bay »
Wairarapa »Bay of Plenty »
`
Figure 18. Change in resource utilisation—
each DHB

Quadrant and indicator analysis Process and efficiency quadrant
Page 24 The symbol # after a DHB name means the result is significantly higher or lower than the average for all DHBs. (Significance/significantly refers to statistical significance—see Appendix II) The symbols « and » after a DHB name indicate significantly adverse («) or significantly favourable (») movement compared with other DHBs since the previous quarter (see Appendix II).
Performance to Contract Indicator description Performance to Contract measures a hospital’s outputs relative to what it is contracted to provide. Ideally, for the financial year, a DHB undertakes exactly what it has contracted to provide. To account for the unpredictable demand placed upon DHBs, a rate that falls within 98%–102% of contract over the financial year is acceptable. This measure provides a financial perspective of the outputs of the providers compared with the value set in the contract.
Comparison with last quarter The current financial year to date results are shown in Figure 19 and can be compared with the rate for the same time in the 2003/04 financial year (Figure 20). Comparison with the December 2003 quarter Figure 20 shows most DHBs finished the 2003/04 financial year with a Performance to Contract percentage equal to, or higher than, their rate at the end of the December 2003 quarter. This can be a warning for this financial year. Outliers Half way through the 2004/05 financial year Taranaki, Tairawhiti, Hutt Valley and Bay of Plenty have over-produced, while West Coast and the Wairarapa have under-produced.
94 96 98 100 102 104
West Coast
Wairarapa
South Canterbury
Hawke's Bay
Whanganui
Nelson Marlborough
Waikato
Capital & Coast
Counties Manukau
Southland
Lakes
MidCentral
Waitemata
All DHBs
Northland
Auckland
Otago
Canterbury
Bay of Plenty
Hutt Valley
Tairawhiti
Taranaki
Figure 19. Performance to contract for first 6 months 2004/05
Performance to contract
96
98
100
102
104
106
Wai
rara
pa
Cou
ntie
sM
anuk
au
All D
HBs
Haw
ke's
Bay
Mid
Cen
tral
Sout
hC
ante
rbur
y
Wha
ngan
ui
Nel
son
Mar
lbor
ough
Bay
ofPl
enty
Can
terb
ury
Wai
kato
Wes
t Coa
st
Sout
hlan
d
Wai
tem
ata
Auck
land
Hut
t Val
ley
Nor
thla
nd
Cap
ital &
Coa
st
Ota
go
Taira
whi
ti
Lake
s
Tara
naki
%
2003 (6 months to December) 2003 / 04
Figure 20. Performance to Contract for full 2003/04 financial year compared with status after December 2003 quarter—each DHB (compare with Figure 19 for the December 2004 quarter status).

Quadrant and indicator analysis Process and efficiency quadrant
Page 25 The symbol # after a DHB name means the result is significantly higher or lower than the average for all DHBs. (Significance/significantly refers to statistical significance—see Appendix II) The symbols « and » after a DHB name indicate significantly adverse («) or significantly favourable (») movement compared with other DHBs since the previous quarter (see Appendix II).
Average Length of Stay Indicator Description The Average Length of Stay rate uses the patient admission rate (total number of discharged patients divided by the total number of individual patients) to adjust average length of stay. Secondly, the Average Length of Stay is case-mix weighted to adjust for differences in procedures undertaken at different hospitals. This is done by a complex calculation, which provides a “weight” for each group of conditions (diagnostic related group) using the average length of stay for each group of conditions and the total length of stay for all relevant patients. The individual DHB Average Length of Stay rate is then calculated using the “weight” for each group of conditions and the proportions of different conditions treated in each DHB. Comparison with last Quarter There was a positive trend this quarter for Average Length of Stay with a 4.8% drop from 3.28 days for the September quarter to 3.13 days for the December quarter over all DHBs combined (Figure 21). Only one DHB showed an increase in Average Length of Stay for the December 2004 quarter. Comparison with the December 2003 quarter The December 2004 quarter’s rate was 3.1% lower than the previous December quarter (3.23), a significant difference. Only three DHBs showed an increase (worsening) in Average Length of Stay over this time. Outliers Three DHBs had results moving in a significantly favourable direction and three in an adverse direction.
3.0
3.1
3.2
3.3
3.4
3.5
3.6
Dec-01
Mar-02
Jun-02
Sep-02
Dec-02
Mar-03
Jun-03
Sep-03
Dec-03
Mar-04
Jun-04
Sep-04
Dec-04
ALO
S-In
patie
nt®
, day
sFour period moving average
Figure 21.Average Length of Stay—all DHBs
2.0 2.5 3.0 3.5 4.0
Tairawhiti #«Hawke's Bay #«
Waikato # Lakes «
Canterbury Bay of Plenty
MidCentral Whanganui
South Canterbury West Coast
All DHBs Waitemata
Otago Taranaki
Counties Manukau Southland
Hutt Valley Northland
Wairarapa »Auckland #»
Capital & Coast #»Nelson Marlborough #
`
Figure 22. Average length of stay—each DHB

Quadrant and indicator analysis Process and efficiency quadrant
Page 26 The symbol # after a DHB name means the result is significantly higher or lower than the average for all DHBs. (Significance/significantly refers to statistical significance—see Appendix II) The symbols « and » after a DHB name indicate significantly adverse («) or significantly favourable (») movement compared with other DHBs since the previous quarter (see Appendix II).
Daycase Surgery Indicator Description The question this indicator asks is “Of the surgical procedures that can be performed as a daycase (ie, eligible), how many actually are?” The rate is calculated by dividing the number of eligible surgical procedures (a list of procedures suitable for daycase surgery was originally drafted by the Ministry with a team of clinical specialists and is currently under review) performed on a daycase basis during the 12 months to the end of each quarter by the number of eligible surgical procedures performed during the 12 months to the end of each quarter. A limitation of this indicator is that it only includes the procedures outlined in the list and not all operations. Some of the surgical procedures identified as suitable for daycase surgery cannot always be carried out on the same day because of a patient’s other conditions, such as diabetes and coronary heart disease. Comparison with last quarter 71% of all eligible elective surgery was performed on a daycase basis (Figure 23). This shows little change from the September quarter (72%). Comparison with the December 2003 quarter The December 2004 quarter Daycase Surgery rate shows a 1.6% increase from the previous December quarter (Figure 23). When looking at the four period moving average, the results are relatively stable. Outliers Four DHBs showed significantly positive movements in Daycase Surgery, while two showed unfavourable movements (Figure 24).
66
67
68
69
70
71
72
73
Dec-01
Mar-02
Jun-02
Sep-02
Dec-02
Mar-03
Jun-03
Sep-03
Dec-03
Mar-04
Jun-04
Sep-04
Dec-04
DC
Surg
Elig
%®
Four period moving average
Figure 23. Eligible surgery performed as daycase—all DHBs
0 20 40 60 80 100
Canterbury # Tairaw hiti #«
Capital & Coast # West Coast # MidCentral #
Waikato Haw ke's Bay
All DHBs Otago
Auckland Hutt Valley
Nelson Marlborough «South Canterbury »
Bay of Plenty Wairarapa »
Counties Manukau Whanganui
Taranaki »Northland
Waitemata Lakes #
Southland #»
Figure 24. Eligible surgery performed as
daycase—each DHB

Quadrant and indicator analysis Financial quadrant
Page 27 The symbol # after a DHB name means the result is significantly higher or lower than the average for all DHBs. (Significance/significantly refers to statistical significance—see Appendix II) The symbols « and » after a DHB name indicate significantly adverse («) or significantly favourable (») movement compared with other DHBs since the previous quarter (see Appendix II).
Financial quadrant
Operating Margins Indicator Description Sustainable organisations need to generate surpluses sufficient to at least cover all costs of capital (ie, both interest on debt and obligatory, (for DHBs) capital charge) that arise from the ownership of assets in the short and long term. It is a key expectation of the Crown that DHBs will do so. The Operating Margin indicators measure financial performance before accounting for the costs of interest and capital charge. This report looks at Operating Margin from two perspectives: • the scale of the assets
employed by the organisation (Operating Margin to Assets)
• the scale of the current activities of the organisation (Operating Margin to Revenue).
Operating Margin to Assets ratios that are lower than the weighted average cost of capital (averaged at 9.1% for this indicator) indicate that an organisation is not generating as much value from the use of its asset base as the capital related costs of providing that asset base. The overall asset base of the DHBs has increased, as can be seen by Figure 26.
Operating margin to Revenue looks at the scale of the current activities of an organisation. It asks “Are sufficient margins being made on revenue earned to contribute to overall financial sustainability?” Both of these ratios are driven by the trends in their numerator, the operating margin (shown in Figure 26). They allow comparison between different sized DHBs, as the margins are relative to the financial size of the organisation.
-2,900,000
-2,700,000
-2,500,000
-2,300,000
-2,100,000
-1,900,000
-1,700,000
-1,500,000
Dec-01
Mar-02
Jun-02
Sep-02
Dec-02
Mar-03
Jun-03
Sep-03
Dec-03
Mar-04
Jun-04
Sep-04
Dec-04
NFE
$
Figure 25. Net Funds Employed—all DHBs
-200,000
-150,000
-100,000
-50,000
0
50,000
100,000
150,000
200,000
Dec-01
Mar-02
Jun-02
Sep-02
Dec-02
Mar-03
Jun-03
Sep-03
Dec-03
Mar-04
Jun-04
Sep-04
Dec-04
Op
Mar
g $
Ann
lsd
Figure 26. Operating Margin (annualised)—all DHBs

Quadrant and indicator analysis Financial quadrant
Page 28 The symbol # after a DHB name means the result is significantly higher or lower than the average for all DHBs. (Significance/significantly refers to statistical significance—see Appendix II) The symbols « and » after a DHB name indicate significantly adverse («) or significantly favourable (») movement compared with other DHBs since the previous quarter (see Appendix II).
Comparison with last quarter On both of the Operating Margins ratios, the significance analysis is distorted due to the poor financial results of Auckland and its large negative operating margin.
Comparison with the December 2003 quarter The year to date Operating Margin is $17.5M, down $33M on the December quarter for the 2003/04 year.
Outliers West Coast and Auckland both moved further into the negative and Lakes dropped below zero for the first time in over two years. Wairarapa and Taranaki saw significant positive change.
-10 -5 0 5 10 15 20
Auckland# West Coast#«
Lakes «Waitemata
All DHBs Otago
Capital & Coast Southland
Whanganui Tairaw hiti
Waikato Hutt Valley
Nelson Marlborough Taranaki »
Counties Manukau Canterbury
Haw ke's Bay Northland#
MidCentral# Bay of Plenty#
South Canterbury# Wairarapa#»
`
Figure 27. Operating Margin to Net Funds
Employed—each DHB
-5 0 5 10
Auckland# West Coast#
Lakes «Otago
All DHBs Waitemata
Capital & Coast Whanganui
Bay of Plenty Tairaw hiti
Waikato Haw ke's Bay
Nelson Marlborough Wairarapa »
Counties Manukau Northland
Hutt Valley MidCentral
Canterbury Southland
South Canterbury Taranaki#»
Figure 28. Operating Margin to Revenue—
each DHB

Quadrant and indicator analysis Financial quadrant
Page 29 The symbol # after a DHB name means the result is significantly higher or lower than the average for all DHBs. (Significance/significantly refers to statistical significance—see Appendix II) The symbols « and » after a DHB name indicate significantly adverse («) or significantly favourable (») movement compared with other DHBs since the previous quarter (see Appendix II).
Revenue to Assets Indicator description This indicator provides a measure of asset efficiency by looking at total revenues received in relation to the net funds employed. It considers whether sufficient revenues are being earned on a DHB’s overall capital investment to contribute to its ongoing financial sustainability. For example, a low ratio could indicate a hospital has excess capacity relative to its operational needs. When looking at the long term developments in this indicator, consideration needs to be given to the change in reporting made in June 2003. Since then, DHBs have had higher asset valuations, and further emphasis is given to the acquisition and retention of capital resources. Comparison with last quarter There was no significant change from the September 2004 quarter in the combined rates for all DHBs. Comparison with the December 2003 quarter As can be seen in Figure 30, the average is lower than the December 2003 quarter. However, this is not a significant change. Outliers Bay of Plenty and Wairarapa are performing well. Waikato and Waitemata have had significant reductions in their ratios. (See Figure 29.)
0 2 4 6 8
Southland # Waitemata «
Capital & Coast Taranaki
Auckland Hutt Valley Tairaw hiti All DHBs
Canterbury Waikato «
Nelson Marlborough Counties Manukau
Whanganui West Coast MidCentral
Haw ke's Bay South Canterbury
Otago Northland
Lakes Wairarapa #»
Bay of Plenty #
`
Figure 29. Revenue to Assets—each DHB
1.5
1.6
1.7
1.8
1.9
2.0
Dec-01
Mar-02
Jun-02
Sep-02
Dec-02
Mar-03
Jun-03
Sep-03
Dec-03
Mar-04
Jun-04
Sep-04
Dec-04
Rev
enue
to A
sset
s®, %
Four period moving average
Figure 30. Revenue to Net Funds Employed—All DHBs

Quadrant and indicator analysis Financial quadrant
Page 30 The symbol # after a DHB name means the result is significantly higher or lower than the average for all DHBs. (Significance/significantly refers to statistical significance—see Appendix II) The symbols « and » after a DHB name indicate significantly adverse («) or significantly favourable (») movement compared with other DHBs since the previous quarter (see Appendix II).
Debt Ratio Indicator description This ratio provides an indication of the DHB levels of debt financing. In commercial environments, high levels of debt increase financial risk because interest payments cannot (normally) be deferred. Dividend payments, however, which represent financial returns on equity typically can be deferred. For DHBs, though, the equity return (in the form of capital charge) is mandatory. Therefore, DHBs will tend to prefer the lower cost of debt (up to 7%) to the higher cost of equity (11%). However, DHBs are expected to operate in a manner consistent with normal commercial financial ratios, equity is expected to be maintained at prudent levels and not exceed the 65% limit accepted by the Residual Health Management Unit (RHMU). A downside of having a high ratio could be that the need to refinance occupies a disproportionate amount of DHB staff members’ time. Comparison with last quarter In the last quarter none of the DHBs exceeded the 65% upper limit. In the December quarter there were three DHBs with ratios over 65%. Overall, however, there was not a significant shift in debt levels from the September 2004 quarter. Comparison with the December 2003 quarter Figure 32 shows a non-significant upward trend after the reporting changes of June 2003. Outliers Different combinations of debt and equity capital are suitable for different organisations. The range between the highest and lowest rate was 43 percentage points. There are some significant outliers—Waitemata, Wairarapa and Waikato, whose debt ratios have exceeded the recommended ratios. Of particular note is Wairarapa, which had an 82% increase.
0 20 40 60 80
Waitemata # Wairarapa #«
Waikato # Southland #
Taranaki Capital & Coast
Otago South Canterbury
All DHBs Haw ke's Bay
Nelson Marlborough MidCentral
Counties Manukau West Coast
Auckland »Tairaw hiti
Canterbury Hutt Valley Whanganui »
Lakes Bay of Plenty
Northland
`
Figure 31. Debt Ratios—each DHB
30.0
35.0
40.0
45.0
50.0
55.0
60.0
Dec-01
Mar-02
Jun-02
Sep-02
Dec-02
Mar-03
Jun-03
Sep-03
Dec-03
Mar-04
Jun-04
Sep-04
Dec-04
Deb
t rat
io®
, %
Four period moving average
Figure 32. Long-term trends in debt ratios—all DHBs

Appendix II Individual DHB Performance
Page 31
SECTION THREE—APPENDIX I: INDIVIDUAL DHB PERFORMANCE

Appendix II Northland DHB
Page 32
Significance/significantly refers to statistical significance—see Appendix II
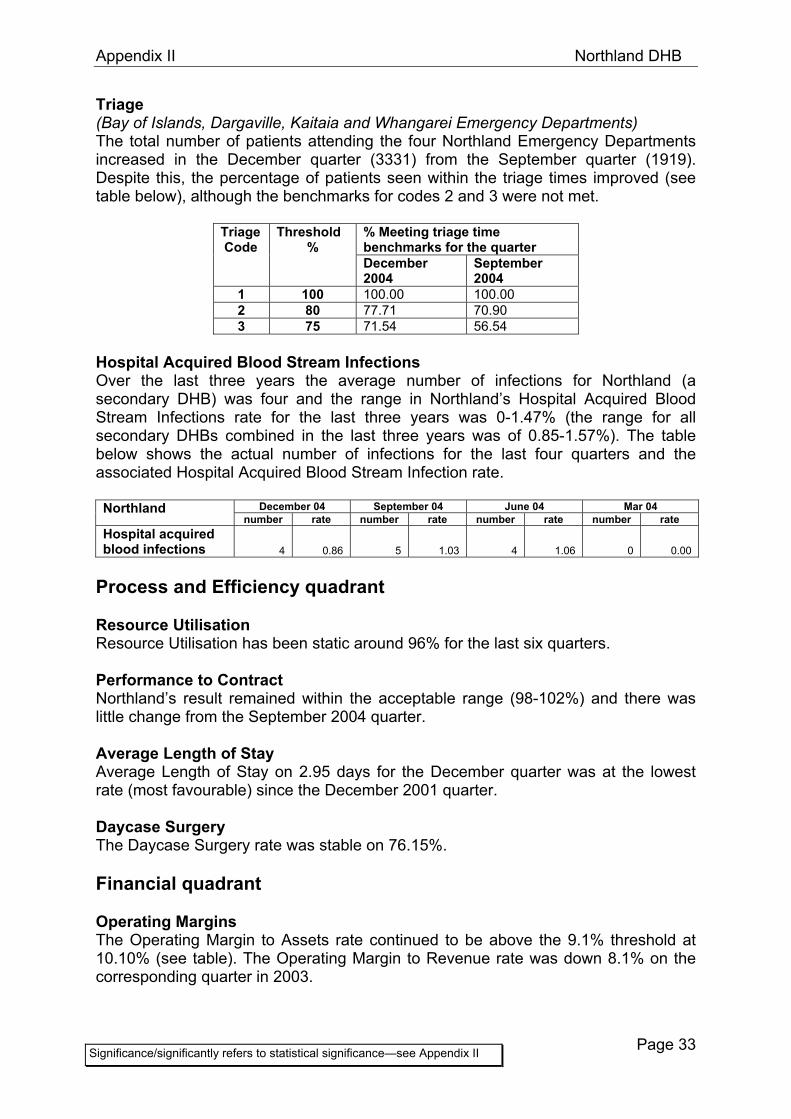
NORTHLAND DHB HOSPITALS (Bay of Islands Hospital, Dargaville Hospital, Kaitaia Hospital, Northern Base
Hospital—Whangarei) Organisational Health quadrant Voluntary Staff Turnover Voluntary Staff Turnover rate for the December quarter was 2.82. While there was small improvement (-4.6%) from the previous quarter, the rate improved by 17.4% from the December 2003 quarter. Staff Stability Staff Stability rate was 55.56 for the December quarter. This was a 23.5% increase from the previous quarter, and a 6.5% increase from the December 2003 quarter. Staff Sick Leave As the table below shows, sick leave followed previous years’ trends and was down in the December quarter when compared to the September quarter.
Northland Dec 04 Sep 04 Jun 04 Mar 04 Sick leave 3.01 3.74 3.24 2.42
Staff Work-related Injury or Illness The Staff Work-related Injury or Illness rate dropped to 10.53, down 37.3% on the previous quarter and 41.8% from the December 2003 quarter. The table below shows the actual number of injuries or illnesses in the last four quarters.
Northland Dec 04 Sep 04 Jun 04 Mar 04 Number of injuries/illnesses
8 12 16 17
Quality and Patient Satisfaction quadrant Patient Satisfaction DHBs are expected to receive enough responses to the patient satisfaction questionnaire to give a 95% confidence level that the questionnaires returned give an accurate picture of all the patients seen by the DHB in that quarter. Northland’s confidence level for this quarter was 80% for inpatients and 84% for outpatients. The overall satisfaction rate for the quarter was 87.08%, significantly worse than the September quarter’s satisfaction rating (88.98%). For all individual inpatient questions the DHB achieved satisfaction ratings above 70% except for the question “Please rate how much you liked the food we gave you” (65.8%). The ratings for all the outpatient questions were all above 75%. Complaints Closed within 30 days The number of complaints received (94) this quarter decreased by seven complaints and the complaint closure rate improved 10.7% from the last quarter to 72.34%.
Appendix II Northland DHB
Page 33
Significance/significantly refers to statistical significance—see Appendix II
Triage (Bay of Islands, Dargaville, Kaitaia and Whangarei Emergency Departments) The total number of patients attending the four Northland Emergency Departments increased in the December quarter (3331) from the September quarter (1919). Despite this, the percentage of patients seen within the triage times improved (see table below), although the benchmarks for codes 2 and 3 were not met.
% Meeting triage time benchmarks for the quarter
Triage Code
Threshold %
December 2004
September 2004
1 100 100.00 100.00 2 80 77.71 70.90 3 75 71.54 56.54
Hospital Acquired Blood Stream Infections Over the last three years the average number of infections for Northland (a secondary DHB) was four and the range in Northland’s Hospital Acquired Blood Stream Infections rate for the last three years was 0-1.47% (the range for all secondary DHBs combined in the last three years was of 0.85-1.57%). The table below shows the actual number of infections for the last four quarters and the associated Hospital Acquired Blood Stream Infection rate.
December 04 September 04 June 04 Mar 04 Northland number rate number rate number rate number rate
Hospital acquired blood infections 4 0.86 5 1.03 4 1.06 0 0.00
Process and Efficiency quadrant Resource Utilisation Resource Utilisation has been static around 96% for the last six quarters. Performance to Contract Northland’s result remained within the acceptable range (98-102%) and there was little change from the September 2004 quarter. Average Length of Stay Average Length of Stay on 2.95 days for the December quarter was at the lowest rate (most favourable) since the December 2001 quarter. Daycase Surgery The Daycase Surgery rate was stable on 76.15%. Financial quadrant Operating Margins The Operating Margin to Assets rate continued to be above the 9.1% threshold at 10.10% (see table). The Operating Margin to Revenue rate was down 8.1% on the corresponding quarter in 2003.

Appendix II Northland DHB
Page 34
Significance/significantly refers to statistical significance—see Appendix II
Northland Dec 04 Sep 04 Jun 04 Mar 04 Dec 03 Sep 03 Jun 03 Mar 03 Operating Margin /Revenue
3.82 4.89 4.01 4.36 4.16 2.48 0.64 -0.72
Operating Margin/Assets
10.10 12.86 9.47 10.14 9.69 5.69 1.35 -1.78
Asset Utilisation Ratio showed steady growth, 13.4% on the same time last year (see table).
Northland Dec 04 Sep 04 Jun 04 Mar 04 Dec 03 Sep 03 Jun 03 Mar 03 Asset Utilisation 2.64 2.63 2.36 2.33 2.33 2.30 2.14 2.50
Debt ratio Continues to be very low, at less than 30% of its capital. Result Achieved a small surplus of $0.1M for the financial year to date up to December 31.

Appendix II Waitemata DHB
Page 35
Significance/significantly refers to statistical significance—see Appendix II
WAITEMATA DHB HOSPITALS (North Shore Hospital, Mason Clinic, Taharoto Hospital, Te Atarau Unit, Wilson
Centre, Carrington Hospital) Organisational Health quadrant Voluntary Staff Turnover Voluntary Staff Turnover rate was stable at 2.82 for the December quarter. Staff Stability Staff Stability rate remained stable for the quarter. Staff Sick Leave Following previous years’ trends, sick leave was down in the December quarter (2.66) when compared to the September quarter (3.48). Staff Work-related Injury or Illness The Staff Work-related Injury or Illness rate increased to 5.46, up 27.2% on the previous quarter and 17.1% on the December 2003 quarter. The table below shows the actual number of injuries or illnesses for the last four quarters. Waitemata Dec 04 Sep 04 Jun 04 Mar 04 Number of injuries/illnesses
9 7 5 5
Quality and Patient Satisfaction quadrant Patient Satisfaction DHBs are expected to receive enough responses to the patient satisfaction questionnaire to give a 95% confidence level that the questionnaires returned give an accurate picture of all the patients seen by the DHB in that quarter. Waitemata’s confidence level for this quarter was 89% for inpatients and 93% for outpatients. The overall satisfaction rate for the quarter was 85.61%. For all individual inpatient questions the DHB achieved satisfaction ratings above 70% except for the questions relating to food (58.8%) and the information that is given in the Emergency Department about how long they will have to wait (69.4%). The responses for the outpatient questionnaires were all above 70%, except for the question “Please rate our staff on telling you how long you would wait, when you arrived” (67.8%). Complaints Closed within 30 days The number of complaints received (147) this quarter decreased by 25 complaints, and the complaint closure rate improved by 6.9% from the last quarter to 57.82 %.

Appendix II Waitemata DHB
Page 36
Significance/significantly refers to statistical significance—see Appendix II
Triage (North Shore Emergency Department) Waitemata reported difficulties collecting triage data, which is impacting on the quality of the data. The results published in the September quarter’s Report were incorrect, and these have now been corrected. The total number of patients attending the North Shore Hospital Emergency Department increased dramatically in the December quarter (7657) from the September quarter (2352). This was associated with a large drop in the percentage of patients seen within the triage times, and meant that the DHB did not meet any of the benchmarks.
% meeting triage time for the quarter
Triage Code
Benchmark%
December 2004
September 2004
1 100 50.72 100.00 2 80 29.63 98.25 3 75 29.06 95.39
Hospital Acquired Blood Stream Infections Over the last three years, the average number of infections for Waitemata was 13, indicating that the September quarter result (shown in the table below) was an anomaly and that the rates for 2004 were higher than average. The range in the Hospital Acquired Blood Stream Infections rate for Waitemata (a secondary DHB) for the last three years (excluding the September 2004 quarter) was 0.9-1.78% (compared with the range in results for all secondary DHBs combined for the last three years which was 0.85-1.57%).
December 04 September 04 June 04 Mar 04 Waitemata number rate number rate number rate number rate
Hospital acquired blood infections 15 1.42 24 2.13 15 0.99 14 1.42
Process and Efficiency quadrant Resource Utilisation Resource utilisation rates were down 4% on the year to date results for the same quarter last year. Performance to Contract The Performance to Contract rate was in the acceptable 98-102% range and changed little from the September 2004 quarter. Average Length of Stay Average Length of Stay of 3.06 days was down 4.5% from the previous quarter. Daycase Surgery After a high result for the September quarter, the Daycase Surgery rate dropped this quarter (by 5.6%). However, it was up 4.9% from the December 2003 quarter on 76.19%.

Appendix II Waitemata DHB
Page 37
Significance/significantly refers to statistical significance—see Appendix II
Financial quadrant Operating Margins Waitemata registered substantial drops in both Operating Margin ratios from the September quarter (see table below).
Waitemata Dec 04 Sep 04 Jun 04 Mar 04 Dec 03 Sep 03 Jun 03 Mar 03 Operating Margin/Assets
1.24 3.93 0.10 2.32 3.10 4.68 0.13 1.99
Operating Margin/Revenue 1.08 2.87 0.09 2.06 2.32 4.08 0.12 1.47
Asset Utilisation Waitemata’s ratio took a significant negative movement in the December 2004 quarter.
Waitemata Dec 04 Sep 04 Jun 04 Mar 04 Dec 03 Sep 03 Jun 03 Mar 03 Asset Utilisation 1.14 1.37 1.09 1.13 1.33 1.15 1.12 1.35
Debt Ratio Waitemata’s proportion of debt increased on the September quarter, and was well above the recommended 65% level at 70.95%. Result The hosptials recorded a deficit of $7.7M for the current financial year up until December 31.

Appendix II Auckland DHB
Page 38
Significance/significantly refers to statistical significance—see Appendix II
AUCKLAND DHB HOSPITALS (Auckland City Hospital including Women’s Health and Starship Children’s Health
and Greenlane Clinical Centre) Organisational Health quadrant Voluntary Staff Turnover There was little change in Voluntary Staff Turnover rate this quarter, up 8.5% from the previous quarter to 4.56. Staff Stability The Staff Stability rate worsened a little this quarter up to 9.7% to 67.10. Staff Sick Leave Following previous years’ trends, sick leave was down in the December quarter (2.25) when compared to the September quarter (3.07). Staff Work-related Injury or Illness The Staff Work-related Injury or Illness rate for the December quarter was 7.40, this was an improvement of 4.7% from the rate for the September quarter and of 26.1% from the December 2003 quarter although, as the table below shows, the actual number of injuries or illnesses was the same for the last two quarters. Auckland Dec 04 Sep 04 Jun 04 Mar 04 Number of injuries/illnesses
24 24 29 20
Quality and Patient Satisfaction quadrant Patient Satisfaction DHBs are expected to receive enough responses to the patient satisfaction questionnaire to give a 95% confidence level that the questionnaires returned give an accurate picture of all the patients seen by the DHB in that quarter. Auckland’s confidence level for this quarter was 96% for inpatients and 97% for outpatients. The overall satisfaction rate for the quarter was 84.59%, similar to the September quarter’s satisfaction rating (84.93%). The DHB achieved satisfaction ratings above 74% for all individual inpatient questions except for the questions relating to food (60%) and the information that is given in the Emergency Department to patients who are admitted to hospital about how long they will have to wait (69.2%). The responses for the outpatient questionnaires were all above 80% except for the question “Please rate our staff on telling you how long you would wait, when you arrived” (63.5%). Complaints Closed within 30 days The number of complaints received (207) this quarter decreased by 53 complaints and the complaint closure rate improved by 22.5% from the last quarter to 56.52%.

Appendix II Auckland DHB
Page 39
Significance/significantly refers to statistical significance—see Appendix II
Triage (Auckland City Hospital Emergency Department and Child—Emergency Department) The total number of patients attending the Auckland City Hospital Emergency Departments decreased in the December quarter (9688) from the September quarter (11,092), but there was little change in the percentage of patients seen within the triage times and, again, the benchmarks for codes 2 and 3 were not met.
% meeting triage time for the quarter
Triage Code
Benchmark%
December 2004
September 2004
1 100 100.00 100.00 2 80 33.99 33.97 3 75 39.95 38.65
Hospital Acquired Blood Stream Infections Over the last three years the average number of infections for Auckland was 111 and the range in the Hospital Acquired Blood Stream Infections rate was 5.06-7.99% (compared with the combined average for tertiary DHBs of 3.65-5.06%).
December 04 September 04 June 04 Mar 04 Auckland number rate number rate number rate number rate
Hospital acquired blood infections 101 5.94 125 6.87 101 7.99 129 7.71
Process and Efficiency Quadrant Resource Utilisation The Resource Utilisation rate was slightly up from the same time in the previous financial year. Performance to Contract Auckland’s Performance to Contract rate was within the acceptable range of 98-102% and there was little change from the September 2004 quarter. Average Length of Stay The Average Length of Stay rate was down 8.7% on the previous quarter (3.15), with 2.88 days recorded for the quarter. Daycase Surgery The Daycase Surgery rate for the December quarter was 71.75%. This was stable and consistent with previous months.

Appendix II Auckland DHB
Page 40
Significance/significantly refers to statistical significance—see Appendix II
Financial quadrant Operating Margins Auckland’s financial results continue to trend down, mainly driven by its negative operating margin. Figure 33 shows this has been steadily trending downward since the September 2003 quarter.
Auckland Dec 04 Sep 04 Jun 04 Mar 04 Dec 03 Sep 03 Jun 03 Mar 03 Operating Margin/Assets
-14.52 -14.21 -9.71 -8.71 -6.90 -2.02 -14.71 -15.86
Operating Margin/Revenue -10.83 -10.21 -7.46 -6.41 -4.63 -1.30 -9.10 -8.67
Asset Utilisation Little change from the September 2004 quarter. Debt Ratio Auckland had a significant positive shift in its debt ratio to be at the recommended ratio of approximately 50/50 debt to equity. Result Auckland Hospitals recorded a deficit of $39.5M for the financial year until to December 31.
-200,000
-150,000
-100,000
-50,000
0
50,000
100,000
150,000
200,000
Dec-01
Mar-02
Jun-02
Sep-02
Dec-02
Mar-03
Jun-03
Sep-03
Dec-03
Mar-04
Jun-04
Sep-04
Dec-04
$000
All DHBs (P Axis)Auckland (P Axis)
Figure 33. Operating margins—Auckland and all DHBs

Appendix II Counties Manukau DHB
Page 41
Significance/significantly refers to statistical significance—see Appendix II
COUNTIES MANUKAU DHB HOSPITALS (Middlemore Hospital, Manukau Superclinic, Manukau Surgery Centre, Botany Superclinic, Botany Maternity, Pukekohe Maternity, Pukekohe
Geriatric Hospital, Papakura Maternity, Franklin Geriatric Hospital, and Otara Spinal unit)
Organisational Health quadrant Staff Turnover There was little change (3.7%) in the Staff Turnover rate this quarter, with the result for the December quarter being 3.48. Staff Stability The Staff Stability rate worsened with an increase of 34.3% from the previous quarter to reach 52.5 for the December quarter. Staff Sick Leave Following previous years’ trends, sick leave was down in the December quarter (2.84) when compared to the previous September quarter (3.79). Staff Work-related Injury or Illness The Staff Work-related Injury or Illness rate for the December quarter was 7.23, down from both the previous quarter (49.4%) and the December 2003 quarter (65.2%). The table below shows that actual numbers of injuries or illnesses. Counties Manukau Dec 04 Sep 04 Jun 04 Mar 04 Number of injuries/illnesses
12 23 9 19
Quality and Patient Satisfaction quadrant Patient Satisfaction DHBs are expected to receive enough responses to the patient satisfaction questionnaire to give a 95% confidence level that the questionnaires returned give an accurate picture of all the patients seen by the DHB in that quarter. Counties Manukau’s confidence level for this quarter was 98% for inpatients and 99% for outpatients. The overall satisfaction rate for the quarter was 86.56%, similar to the September quarter’s satisfaction rating (86.23%). The DHB achieved satisfaction ratings above 75% for all individual inpatient questions except for the questions relating to food (66.5%) and the information that is given in the Emergency Department to patients who are admitted to hospital about how long they will have to wait (68.6%). The responses for the outpatient questionnaires were all above 80%, except for the question “Please rate our staff on telling you how long you would wait, when you arrived” (71.3%).

Appendix II Counties Manukau DHB
Page 42
Significance/significantly refers to statistical significance—see Appendix II
Complaints Closed within 30 days The number of complaints received (171) this quarter increased by 10 complaints, but the complaint closure rate improved by 20.8% from the last quarter to 90.06%. The DHB has recently reviewed the complaints data and updated the results for the last seven quarters. Triage (Middlemore Hospital Emergency Department) The total number of patients attending Middlemore Hospital Emergency Department decreased in the December quarter (9176) from the September quarter (10,403); there was little change in the percentage of patients seen within the triage times, and again the benchmarks for codes 2 and 3 were not met.
% meeting triage time for the quarter
Triage Code
Benchmark%
December 2004
September 2004
1 100 100.00 100.00 2 80 63.18 64.64 3 75 43.65 42.54
Hospital Acquired Blood Stream Infections Over the last three years, the average number of infections for Counties Manukau was 31, (this includes the unusually high result—44 for June 02) and the range in the Hospital Acquired Blood Stream Infections rate (excluding June 02) was 1.52-2.81% (compared with the combined average for tertiary DHBs of 3.65-5.06%).
December 04 September 04 June 04 Mar 04 Counties Manukau number rate number rate number rate number rate Hospital acquired blood infections 32 2.32 25 1.66 32 1.83 25 1.81
Process and Efficiency quadrant Resource Utilisation The rate for Counties Manukau had slipped back to 74% this quarter after spending the preceding three quarters over 80%. Performance to Contract Counties Manukau’s Performance to Contract remained within the acceptable 98-102% for the six months of the financial year to date, but composed of two variable quarters, with the September quarter over-performing at 104% and the December quarter under-performing at 95%.

Appendix II Counties Manukau DHB
Page 43
Significance/significantly refers to statistical significance—see Appendix II
Average Length of Stay The Average Length of Stay rate for the December quarter was 3.02 days. This was down 3.8% on the previous quarter, and follows the downward trend that began in June 2004. Daycase Surgery The Daycase Surgery rate was stable and consistent with previous months on 74.79%. Financial quadrant Operating Margin As the table below shows there was little change in Operating Margins from the September 2004 quarter.
Counties Manukau Dec 04 Sep 04 Jun 04 Mar 04 Dec 03 Sep 03 Jun 03 Mar 03 Operating Margin/Assets
8.23 8.72 7.91 8.16 10.62 9.68 -8.54 -6.65
Operating Margin/Revenue 3.81 4.36 4.44 4.44 5.70 6.25 -5.83 -4.99
Asset Utilisation. There was an increase of 8% on the September quarter and 16% on the December 03 quarter.
Counties Manukau Dec 04 Sep 04 Jun 04 Mar 04 Dec 03 Sep 03 Jun 03 Mar 03 Asset Utilisation 2.16 2.00 1.78 1.84 1.86 1.55 1.47 1.33
Debt ratio The DHB has had consistent ratios for the last five quarters with an average of 56%. Result The hospitals recorded a deficit of $0.5M for the financial year up to December 31.

Appendix II Waikato DHB
Page 44
Significance/significantly refers to statistical significance—see Appendix II
WAIKATO DHB HOSPITALS (Matariki Hospital, Rhodo Reid Hospital, Taumaranui Hospital, Te Kuiti
Hospital, Thames Hospital, Tokoroa Hospital, Waikato Hospital) Organisational Health quadrant Voluntary Staff Turnover The Voluntary Staff Turnover rate for the December quarter was 2.87 and showed a 14.9% drop from the December 2003 quarter. Staff Stability There was little change in the Staff Stability rate (31.51) this quarter. However, it was down by 28.8% from the December 2003 quarter. Staff Sick Leave Following previous years’ trends, sick leave was down in the December quarter (2.86) when compared to the September quarter (4.03). It also dropped (9.2%) when compared to the previous December 2003 quarter. Staff Work-related Injury or Illness The Staff Work-related Injury or Illness rate was down from both the previous quarter (by 74.8%) and the December 2003 quarter (by 74.2%), and now sits at 2.77. The table below shows the rates and the actual numbers of illnesses or injuries over the last four quarters. Waikato Dec 04 Sep 04 Jun 04 Mar 04 Number of injuries/illnesses
5 21 11 17
Quality and Patient Satisfaction quadrant Patient Satisfaction DHBs are expected to receive enough responses to the patient satisfaction questionnaire to give a 95% confidence level that the questionnaires returned give an accurate picture of all the patients seen by the DHB in that quarter. Waikato’s confidence level for this quarter was 94% for inpatients and 94% for outpatients. The overall satisfaction rate for the quarter was 89.19%, similar to the September quarter’s satisfaction rating (89.04%). The DHB achieved satisfaction ratings above 80% for all individual inpatient questions except for the questions “Please rate how much you liked the food we gave you” (77.9%) and “Please rate our Emergency Department staff on: telling you how the Emergency Department would treat your problem” (77%) and “…keeping you informed about how long you could expect to wait” (74.9%). The responses for the outpatient questionnaires were all above 80% except for the question “Please rate our staff on telling you how long you would wait, when you arrived” (72.3%).

Appendix II Waikato DHB
Page 45
Significance/significantly refers to statistical significance—see Appendix II
Complaints Closed within 30 days The number of complaints received (257) this quarter increased by 13 complaints, but the complaint closure rate improved by 5.8% from the last quarter to 71.98%. Triage (Taumaranui Hospital, Te Kuiti Hospital, Thames Hospital, Tokoroa Hospital and Waikato Hospital Emergency Departments) The total number of patients attending the five Waikato Emergency Departments decreased in the December quarter (8629) from the September quarter (9558), and there was an associated slight improvement in the percentage of patients seen within the triage times, although none of the benchmarks were met.
% meeting triage time for the quarter
Triage Code
Benchmark%
December 2004
September 2004
1 100 95.70 95.74 2 80 56.19 45.98 3 75 42.94 37.84
Hospital Acquired Blood Stream Infections Over the last three years the average number of infections for Waikato (a tertiary DHB) was 58 and the range in the Hospital Acquired Blood Stream Infections rate for the last three years was 3.41-5.92% (compared with the range of 3.65–5.06% over the last three years for all tertiary DHBs combined).
December 04 September 04 June 04 Mar 04 Waikato number rate number rate number rate number rate
Hospital acquired blood infections 74 5.49 66 4.66 74 4.65 71 5.92
Process and Efficiency quadrant Resource Utilisation The Resource Utilisation rate averaged over 100% for the first six months of the 2004/05 financial year. Performance to Contract The Performance to Contract rate was within the acceptable 98-102% range and changed little from the September 2004 quarter. Average Length of Stay The Average Length of Stay rate was fairly static on 3.50 days for the December quarter. Daycase Surgery After a high result for the September quarter (72.11%), the Daycase Surgery rate deteriorated a little to 67.47%. Financial quadrant

Appendix II Waikato DHB
Page 46
Significance/significantly refers to statistical significance—see Appendix II
Operating Margins As can be seen in the table below Operating Margin to Assets slipped 50% to 5.49 (beneath the 9.1% threshold), and there was also a 45% reduction in overall Operating Margin to Revenue percentage.
Waikato Dec 04 Sep 04 Jun 04 Mar 04 Dec 03 Sep 03 Jun 03 Mar 03 Operating Margin/Assets
5.49 12.50 5.42 7.41 8.72 14.52 4.88 5.54
Operating Margin/Revenue 2.77 5.03 2.30 3.24 4.38 5.82 2.34 2.47
Asset Utilisation Significant drop of 20% from the September quarter.
Waikato Dec 04 Sep 04 Jun 04 Mar 04 Dec 03 Sep 03 Jun 03 Mar 03 Asset Utilisation 1.98 2.49 2.36 2.29 1.99 2.49 2.08 2.24
Debt Ratio Waikato’s debt ratio of 68.3%, exceeded the 65% maximum suggested, and was a 50% increase on the December 2003 quarter’s figure. Result The hospitals achieved a small surplus of $1M for the current financial year up to December 31.

Appendix II Bay of Plenty DHB
Page 47
Significance/significantly refers to statistical significance—see Appendix II
BAY OF PLENTY DHB HOSPITALS (Awhina, Murupara Health, Tauranga Hospital, Whakatane Hospital)
Organisational Health quadrant Staff Turnover The Staff Turnover rate for the December quarter was 3.35, representing a 12.4% drop from the September quarter. Staff Stability The Staff Stability rate increased by 7.4% from the September quarter, and now sits at 49.23. Staff Sick Leave The Sick Leave rate for the December quarter was 4.29. While this was an improvement on the previous quarter (see table below), it was worse, up by 30.2%, than the rate in the December 2003 quarter. Bay of Plenty Dec 04 Sep 04 Jun 04 Mar 04 Sick leave 4.29 5.02 3.63 2.94 The Staff Work-related Injury or Illness rate for the December quarter was 13.35. This rate was down from both the previous quarter (by 10.6%) and the December 2003 quarter (by 17.1%). The table below shows the range and the actual numbers of injuries or illnesses in the last four quarters. Bay of Plenty Dec 04 Sep 04 Jun 04 Mar 04 Number of injuries/illnesses
12 13 8 11
Quality and Patient Satisfaction quadrant Patient Satisfaction DHBs are expected to receive enough responses to the patient satisfaction questionnaire to give a 95% confidence level that the questionnaires returned give an accurate picture of all the patients seen by the DHB in that quarter. Bay of Plenty tends to send considerably more patient satisfaction questionnaires than is required. The DHB reports that it does this so that it receives a good number of responses from Mäori. The overall satisfaction rate for the quarter was 87.28%, similar to the September quarter’s satisfaction rating (87.63%). The DHB achieved satisfaction ratings above 76% for all individual inpatient questions, except for the questions “Please rate how much you liked the food we gave you” (66.4%) and “Please rate our Emergency Department staff on: keeping you informed about how long you could expect to wait” (73.3%). The responses for the outpatient questionnaires were all above 80%, except for the question “Please rate our staff on telling you how long you would wait, when you arrived” (73.9%).
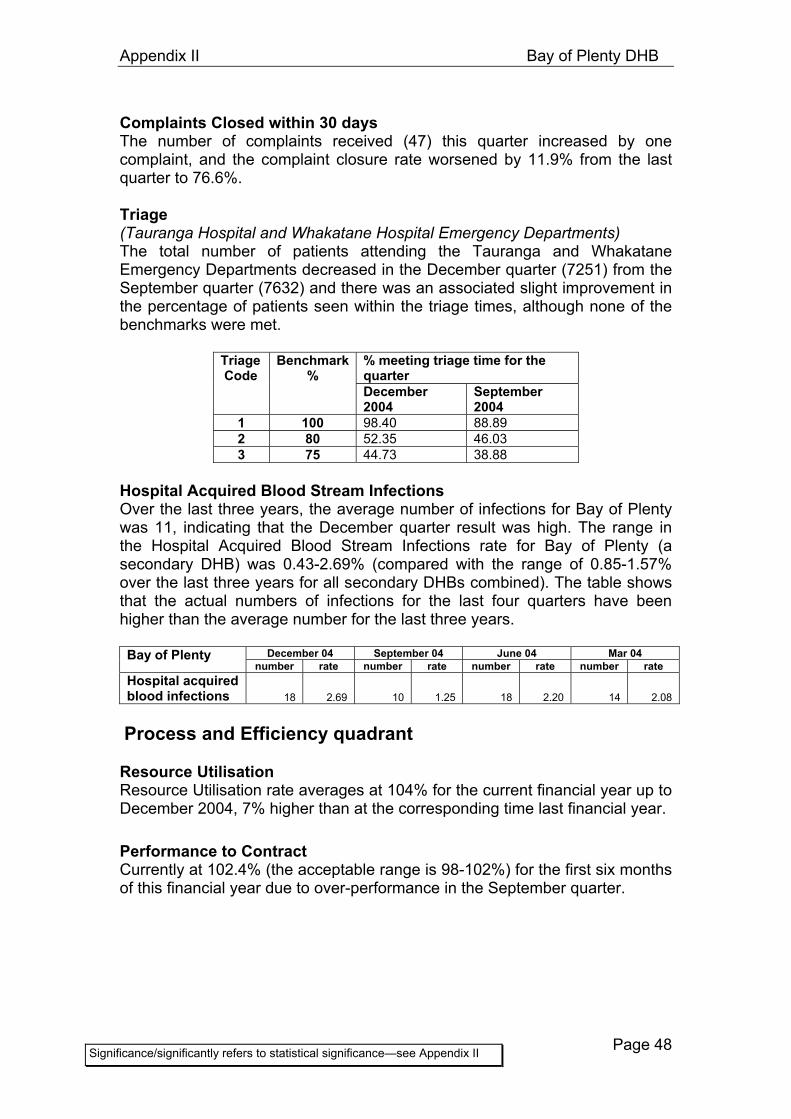
Appendix II Bay of Plenty DHB
Page 48
Significance/significantly refers to statistical significance—see Appendix II
Complaints Closed within 30 days The number of complaints received (47) this quarter increased by one complaint, and the complaint closure rate worsened by 11.9% from the last quarter to 76.6%. Triage (Tauranga Hospital and Whakatane Hospital Emergency Departments) The total number of patients attending the Tauranga and Whakatane Emergency Departments decreased in the December quarter (7251) from the September quarter (7632) and there was an associated slight improvement in the percentage of patients seen within the triage times, although none of the benchmarks were met.
% meeting triage time for the quarter
Triage Code
Benchmark%
December 2004
September 2004
1 100 98.40 88.89 2 80 52.35 46.03 3 75 44.73 38.88
Hospital Acquired Blood Stream Infections Over the last three years, the average number of infections for Bay of Plenty was 11, indicating that the December quarter result was high. The range in the Hospital Acquired Blood Stream Infections rate for Bay of Plenty (a secondary DHB) was 0.43-2.69% (compared with the range of 0.85-1.57% over the last three years for all secondary DHBs combined). The table shows that the actual numbers of infections for the last four quarters have been higher than the average number for the last three years.
December 04 September 04 June 04 Mar 04 Bay of Plenty number rate number rate number rate number rate
Hospital acquired blood infections 18 2.69 10 1.25 18 2.20 14 2.08
Process and Efficiency quadrant Resource Utilisation Resource Utilisation rate averages at 104% for the current financial year up to December 2004, 7% higher than at the corresponding time last financial year. Performance to Contract Currently at 102.4% (the acceptable range is 98-102%) for the first six months of this financial year due to over-performance in the September quarter.

Appendix II Bay of Plenty DHB
Page 49
Significance/significantly refers to statistical significance—see Appendix II
Average Length of Stay The Average Length of Stay rate was down when compared to both the previous quarter (by 4.9%) and the December 2003 quarter (by 3.5%) with 3.31 days recorded for the December quarter. Daycase Surgery The Daycase Surgery rate was stable on 74.03%. Financial quadrant Operating Margins Bay of Plenty has apparently good results on its financial measures. However, comparisons with the other DHBs on the three indicators that have a Net Funds Employed component requires caution due to the method in which Bay of Plenty reports its financial information. Figure 34 shows a marked change in results after the June 03 quarter which was due to changes in the DHB’s reporting. In the one indicator that does not incorporate Net Funds Employed—Operating Margin to Revenue, Bay of Plenty’s results slipped with a 50% reduction in its rate (see table below).
Bay of Plenty Dec 04 Sep 04 Jun 04 Mar 04 Dec 03 Sep 03 Jun 03 Mar 03 Operating Margin/Assets
12.32 25.77 13.48 21.67 17.06 29.04 0.14 6.25
Operating Margin/Revenue 1.99 4.28 2.30 3.97 2.99 6.58 0.05 2.10
Asset Utilisation The DHB results (see table below) were a significant outlier at the top of the table, with a 2.7% increase on the September quarter.
Bay of Plenty Dec 04 Sep 04 Jun 04 Mar 04 Dec 03 Sep 03 Jun 03 Mar 03 Asset utilisation 6.18 6.02 5.85 5.45 5.70 4.41 3.05 2.97
Debt Ratio The Debt Ratio was less than 30% in each of the last four quarters. Result The Bay of Plenty hospitals recorded a surplus of $0.5M for the first half of the financial year.
-60,000
-50,000
-40,000
-30,000
-20,000
-10,000
0
Dec-01
Mar-02
Jun-02
Sep-02
Dec-02
Mar-03
Jun-03
Sep-03
Dec-03
Mar-04
Jun-04
Sep-04
Dec-04
NFE
$
NFE $ (P Axis)
Figure 34. Bay of Plenty net funds employed

Appendix II Lakes DHB
Page 50
Significance/significantly refers to statistical significance—see Appendix II
LAKES DHB HOSPITALS (Rotorua Hospital and Taupo Hospital)
Organisational Health quadrant Voluntary Staff Turnover Voluntary Staff Turnover dropped by 15.6% from the previous quarter and was 3.44. Staff Stability The Staff Stability rate for the December quarter was 51.52. This result was a 95.8% increase (deterioration) from the previous quarter’s result but that was because the September 04 quarter result was lower than usual. Staff Sick Leave Following previous years’ trends, sick leave was down in the December quarter (3.71), when compared to the September quarter (4.96). Staff Work-related Injury or Illness The Staff Work-related Injury or Illness rate for the December quarter was 8.66. This was down from both the previous quarter (by 37.8%) and the December 2003 quarter (by 27.4%). The actual numbers of individual injuries or illnesses and the rates for the last four quarters are given in the table below. Lakes Dec 04 Sep 04 Jun 04 Mar 04 Number of injuries/illnesses
4 6 6 7
Quality and Patient Satisfaction quadrant Patient Satisfaction DHBs are expected to receive enough responses to the patient satisfaction questionnaire to give a 95% confidence level that the questionnaires returned give an accurate picture of all the patients seen by the DHB in that quarter. Lakes’ confidence level for this quarter was 94% for inpatients and 94% for outpatients. The overall satisfaction rate for the quarter was 86.49%, a significant improvement on the September quarter’s satisfaction rating (84.7%). The DHB achieved satisfaction ratings above 76% for all individual inpatient questions except for the questions “Please rate how much you liked the food we gave you” (68%) and “Please rate our Emergency Department staff on: keeping you informed about how long you could expect to wait” (72%). The responses for the outpatient questionnaires were all above 74% except for the question “Please rate our staff on telling you how long you would wait, when you arrived” (68.1%).

Appendix II Lakes DHB
Page 51
Significance/significantly refers to statistical significance—see Appendix II
Complaints Closed within 30 days The number of complaints received (46) this quarter increased by 17 complaints, while the complaint closure rate improved by 9.5% from the last quarter to 71.74%. Triage (Rotorua and Taupo Hospital Emergency Departments) The total number of patients attending the Rotorua and Taupo Emergency Departments decreased in the December quarter (2608) from the September quarter (2935) and there was an associated slight improvement in the percentage of patients seen within the triage times resulting in Lakes being one of the four DHBS that met all three triage benchmarks this quarter. This is the first time in three years that Lakes has met all the benchmarks.
% meeting triage time for the quarter
Triage Code
Benchmark%
December 2004
September 2004
1 100 100.00 100.00 2 80 84.06 84.40 3 75 75.82 70.69
Hospital Acquired Blood Stream Infections Over the last three years, the average number of infections for Lakes was three indicating that the December quarter result of six was high. The range in the Hospital Acquired Blood Stream Infections for Lakes (a secondary DHB) over the last three years was 0-1.83% (compared with the range of 0.85-1.57% for the last three years for all secondary DHBs combined). The table below shows the actual numbers of infections and the rates for the last four quarters.
December 04 September 04 June 04 Mar 04 Lakes number rate number rate number rate number rate
Hospital acquired blood infections 6 1.83 0 0.00 0 0.00 2 0.60
Process and Efficiency quadrant Resource Utilisation Resource utilisation has been trending very slightly downwards over the last four quarters. Performance to Contract Within the performance bracket, little change from the September 2004 quarter. Average Length of Stay The Average Length of Stay rate was stable on 3.38 days. This was consistent with previous quarters.

Appendix II Lakes DHB
Page 52
Significance/significantly refers to statistical significance—see Appendix II
Daycase Surgery The Daycase Surgery rate has been trending very slightly in a favourable direction since the June 2004 quarter on 78.84%. Financial quadrant Operating Margin The Lakes Operating Margin moved to the negative (see table below) for the first time since the July 02 quarter, leading to poorer performances on both ratios.
Lakes Dec 04 Sep 04 Jun 04 Mar 04 Dec 03 Sep 03 Jun 03 Mar 03 Operating Margin/Assets
-1.02 3.03 9.20 9.65 9.73 11.40 3.11 4.48
Operating Margin/Revenue -0.37 1.12 3.05 3.82 3.91 4.28 1.63 1.37
Asset Utilisation There was a 12% increase in Asset Utilisation in comparison to the December 2003 quarter.
Lakes Dec 04 Sep 04 Jun 04 Mar 04 Dec 03 Sep 03 Jun 03 Mar 03 Asset utilisation 2.79 2.69 3.01 2.53 2.49 2.66 1.91 3.26
Debt ratio Lakes has maintained a ratio of under 30% for the last six quarters. Result The hospitals recorded a deficit of $1.6M for the current financial year to December 31.

Appendix II Tairawhiti DHB
Page 53
Significance/significantly refers to statistical significance—see Appendix II
TAIRAWHITI DHB (Gisborne Hospital)
Organisational Health quadrant Voluntary Staff Turnover There was little change (-1.3%) in Voluntary Staff Turnover this quarter, with rates being around 5.5 for the last two quarters. Staff Stability There was little change in the Staff Stability rate this quarter from the previous quarter. Staff Sick Leave Following previous years’ trends, Sick Leave was down in the December quarter (2.04) when compared to the September quarter (3.47). Staff Work-related Injury or Illness The Staff Work-related Injury or Illness rate was 9.62 for the December quarter. Although the number of individual incidents was the same (see table below) this represented a drop in the Staff Work-related Injury or Illness rate of 15.7% from the previous quarter (because the denominator—total number of hours worked—was higher). The result for the December 2004 quarter was 153.4% higher than the result for the December 2003 quarter. Tairawhiti Dec 04 Sep 04 Jun 04 Mar 04 Number of injuries/illnesses
3 3 0 2
Quality and Patient Satisfaction quadrant Patient Satisfaction DHBs are expected to receive enough responses to the patient satisfaction questionnaire to give a 95% confidence level that the questionnaires returned give an accurate picture of all the patients seen by the DHB in that quarter. Tairawhiti’s confidence level for this quarter was 82% for inpatients and 81% for outpatients. The overall satisfaction rate for the quarter was 90.13%, a significant improvement on the September quarter’s satisfaction rating (85.21%). The DHB achieved satisfaction ratings above 78% for all individual inpatient questions, except for the questions relating to food (67%) and the information that is given in the Emergency Department to patients who are admitted to hospital about how long they will have to wait (70%). The responses for the outpatient questionnaires were all above 79% except for the question “Please rate our staff on telling you how long you would wait, when you arrived” (67.8%). Complaints Closed within 30 days

Appendix II Tairawhiti DHB
Page 54
Significance/significantly refers to statistical significance—see Appendix II
The number of complaints received (29) this quarter decreased by two complaints, but the complaint closure rate worsened by 1.7% from the last quarter to 79.31%. Triage (Gisborne Hospital Emergency Department) The total number of patients attending Gisborne Emergency Department increased slightly in the December quarter (790) from the September quarter (659). There was little change in the percentage of patients seen within the triage times, and the benchmarks were again met for codes 2 and 3, but not code 1.
% meeting triage time for the quarter
Triage Code
Benchmark%
December 2004
September 2004
1 100 88.89 100.00 2 80 97.08 97.01 3 75 98.45 99.03
Hospital Acquired Blood Stream Infections Since the June 2002 quarter, the average number of infections for Tairawhiti was one. The table below shows that for the last four quarters the actual number of infections was two for all but the September 2004 quarter. The range in the rate of Hospital Acquired Blood Stream Infections for Tairawhiti DHB (a secondary DHB) was 0-1.5% over the last two years (compared with the range in the rate for all for secondary DHBs combined of 0.85-1.57%).
December 04 September 04 June 04 Mar 04 Tairawhiti number rate number rate number rate number rate
Hospital acquired blood infections 2 1.11 1 0.49 2 0.57 2 1.10
Process and Efficiency quadrant Resource Utilisation Resource utilisation was 4% lower than the year to date figure from the last financial year. Performance to Contract The rate was above 102% maximum for the financial year to date, due to over-performance in the December quarter. Average Length of Stay The Average Length of Stay rate of 3.67 days was up by 3.8%, when compared to both the previous quarter and the December 2003 quarter. Daycase Surgery The Daycase Surgery rate of 59.39% was down by 7.4% from the December 2003 quarter.

Appendix II Tairawhiti DHB
Page 55
Significance/significantly refers to statistical significance—see Appendix II
Financial quadrant Operating Margin 50% reductions in both ratios from the September 2004 quarter (see table below), and at 4.6%, well off the 9.1% target for Operating Margins to Assets.
Tairawhiti Dec 04 Sep 04 Jun 04 Mar 04 Dec 03 Sep 03 Jun 03 Mar 03 Operating Margin/Assets
4.57 8.70 6.42 8.32 12.09 13.05 1.40 3.01
Operating Margin/Revenue 2.75 5.41 4.05 5.41 7.91 8.45 1.00 1.48
Asset Utilisation No real change from the last quarter (see table below), but a 9% increase on the December 2003 quarter result.
Tairawhiti Dec 04 Sep 04 Jun 04 Mar 04 Dec 03 Sep 03 Jun 03 Mar 03 Asset utilisation 1.66 1.61 1.59 1.54 1.53 1.54 1.40 2.04
Debt Ratio Very consistent debt ratio, with a last four quarter average of 44.3%. Result The hospital recorded a deficit of $0.85M for the current financial year to December 31.

Appendix II Taranaki DHB
Page 56
Significance/significantly refers to statistical significance—see Appendix II
TARANAKI DHB HOSPITALS (Hawera Hospital, Taranaki Base Hospital-New Plymouth)
Organisational Health quadrant Voluntary Staff Turnover While there was little change (-1.5%) in Voluntary Staff Turnover this quarter, there was a 25.5% decrease from the December 2003 quarter. The result for this quarter was 2.29. Staff Stability The Staff Stability rate for the December quarter was 28.57. This was 28.6% lower than the December 2003 quarter. Staff Sick Leave Following previous years’ trends, sick leave was down in the December quarter (2.91) when compared to the September quarter (3.37). Staff Work-related Injury or Illness The Staff Work-related Injury or Illness rate for the December quarter was 11.01. This was down 18.7% from the previous quarter, but it was 137.8% higher than the December 2003 quarter. The table below shows that actual number of injuries or illnesses in the last four quarters. Taranaki Dec 04 Sep 04 Jun 04 Mar 04 Number of Injuries/Illness
5 6 6 5
Quality and Patient Satisfaction quadrant Patient Satisfaction DHBs are expected to receive enough responses to the patient satisfaction questionnaire to give a 95% confidence level that the questionnaires returned give an accurate picture of all the patients seen by the DHB in that quarter. Taranaki’s confidence level for this quarter was 84% for inpatients and 89% for outpatients. The overall satisfaction rate for the quarter was 88.42%, similar to the September’ quarter’s satisfaction rating (88.71%). The DHB achieved satisfaction ratings above 75% for all individual inpatient questions, except for the question “Please rate how much you liked the food we gave you” (70.4%). The responses for the outpatient questionnaires were all above 80%, except for the question “Please rate our staff on telling you how long you would wait, when you arrived” (76.2%).
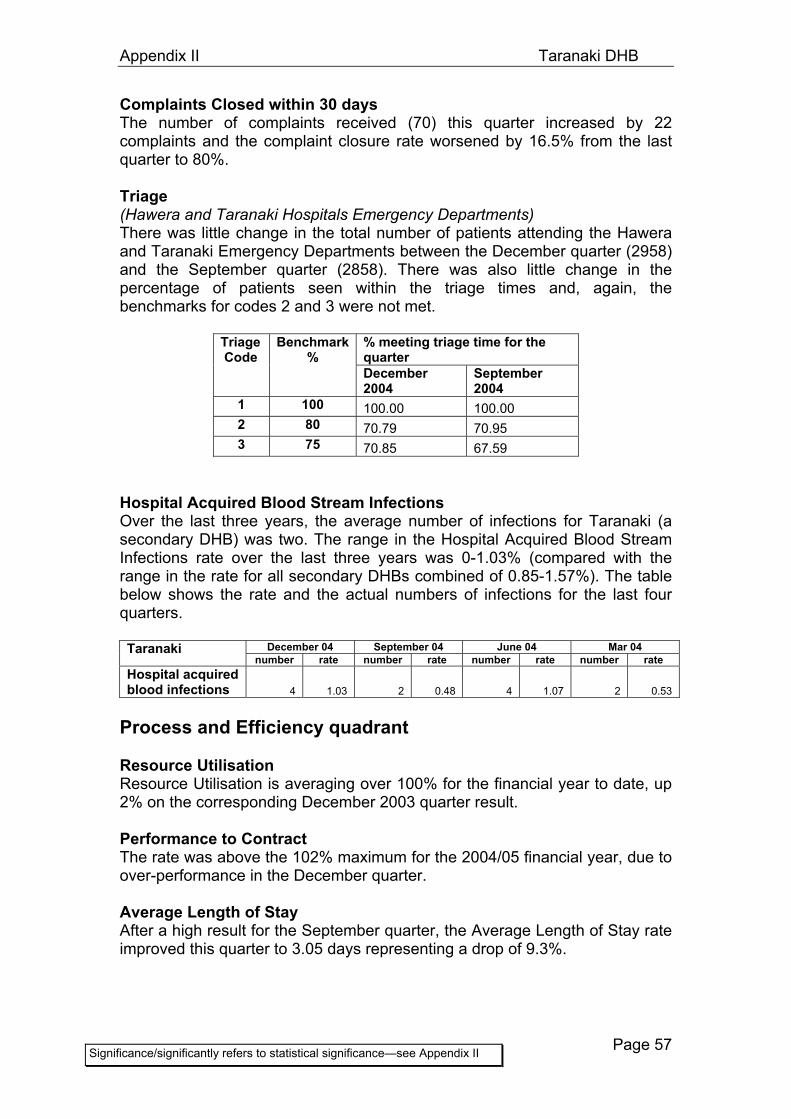
Appendix II Taranaki DHB
Page 57
Significance/significantly refers to statistical significance—see Appendix II
Complaints Closed within 30 days The number of complaints received (70) this quarter increased by 22 complaints and the complaint closure rate worsened by 16.5% from the last quarter to 80%. Triage (Hawera and Taranaki Hospitals Emergency Departments) There was little change in the total number of patients attending the Hawera and Taranaki Emergency Departments between the December quarter (2958) and the September quarter (2858). There was also little change in the percentage of patients seen within the triage times and, again, the benchmarks for codes 2 and 3 were not met.
% meeting triage time for the quarter
Triage Code
Benchmark%
December 2004
September 2004
1 100 100.00 100.00 2 80 70.79 70.95 3 75 70.85 67.59
Hospital Acquired Blood Stream Infections Over the last three years, the average number of infections for Taranaki (a secondary DHB) was two. The range in the Hospital Acquired Blood Stream Infections rate over the last three years was 0-1.03% (compared with the range in the rate for all secondary DHBs combined of 0.85-1.57%). The table below shows the rate and the actual numbers of infections for the last four quarters.
December 04 September 04 June 04 Mar 04 Taranaki number rate number rate number rate number rate
Hospital acquired blood infections 4 1.03 2 0.48 4 1.07 2 0.53
Process and Efficiency quadrant Resource Utilisation Resource Utilisation is averaging over 100% for the financial year to date, up 2% on the corresponding December 2003 quarter result. Performance to Contract The rate was above the 102% maximum for the 2004/05 financial year, due to over-performance in the December quarter. Average Length of Stay After a high result for the September quarter, the Average Length of Stay rate improved this quarter to 3.05 days representing a drop of 9.3%.

Appendix II Taranaki DHB
Page 58
Significance/significantly refers to statistical significance—see Appendix II
Daycase Surgery The Daycase Surgery rate was 76.06%. This was an improvement on the rate for the previous quarter (up by 4.9%) and the December 2003 quarter (up by 10.1%). Financial quadrant Operating Margin The table below shows that the DHB made significant increases on both margins compared with the September quarter. Margins were also higher than the same quarter last year.
Taranaki Dec 04 Sep 04 Jun 04 Mar 04 Dec 03 Sep 03 Jun 03 Mar 03 Operating Margin/Assets
8.00 6.20 5.47 5.09 5.57 6.46 -1.19 -0.01
Operating Margin/Revenue 6.03 4.65 4.36 4.14 4.47 5.61 -1.03 -0.01
Asset Utilisation Taranaki’s weakest financial result is in Revenue to Assets, with little change over the last few quarters. Debt Ratio This crept up to the 60% mark for the December quarter, after four quarters below 55%. Result The Taranaki hospitals showed a small surplus of $0.3M at the end of the first half of the current financial year.

Appendix II Hawke’s Bay DHB
Page 59
Significance/significantly refers to statistical significance—see Appendix II
HAWKE’S BAY DHB HOSPITAL (Central Hawke’s Bay Health Centre (Waipukurau), Hawke’s Bay Hospital (Hastings), Napier Health Centre, Wairoa Health Centre, Chathams Health
Centre) Organisational Health quadrant Voluntary Staff Turnover Voluntary Staff Turnover rate was 4.78 this was up 54.6% from the December 2003 quarter. This indicator is trending up in an unfavourable direction. Staff Stability The December quarter Staff Stability rate was 33.63, which was an improvement on the higher rate in the September quarter. Staff Sick Leave Following previous years’ trends, sick leave was down in the December quarter (2.85) when compared to the September quarter (3.63). Staff Work-related Injury or Illness The Staff Work-related Injury or Illness rate was 7.90 for the December quarter. There was little change from the previous quarter. The table below shows the actual numbers of injuries or illnesses in the last four quarters. Hawke's Bay Dec 04 Sep 04 Jun 04 Mar 04 Number of injuries/illnesses
6 6 7 4
Quality and Patient Satisfaction quadrant Patient Satisfaction DHBs are expected to receive enough responses to the patient satisfaction questionnaire to give a 95% confidence level that the questionnaires returned give an accurate picture of all the patients seen by the DHB in that quarter. Hawke’s Bay’s confidence level for this quarter was 87% for inpatients and 90% for outpatients. The overall satisfaction rate for the quarter was 87.93%, a slight improvement on the September quarter’s satisfaction rating (86.98%). The DHB achieved satisfaction ratings above 70% for all but one of the individual questions. The lowest rating (67.7%) was for the question “Please rate our Emergency Department staff on: keeping you informed about how long you could expect to wait”. The responses for the outpatient questionnaires were all above 79%, except for the question “Please rate our staff on telling you how long you would wait, when you arrived” (67.2%).

Appendix II Hawke’s Bay DHB
Page 60
Significance/significantly refers to statistical significance—see Appendix II
Complaints Closed within 30 days The number of complaints received (108) this quarter increased by seven complaints, and the complaint closure rate worsened by 7.9% from the last quarter to 61.11%. Triage (Hawke’s Bay Hospital—Hastings Emergency Department) The total number of patients attending the Hastings Emergency Department decreased very slightly in the December quarter (3257) from the September quarter (3439). There was an improvement in the percentage of patients seen within the triage times, but the benchmarks for triage code 2 and 3 were again not met.
% meeting triage time for the quarter
Triage Code
Benchmark%
December 2004
September 2004
1 100 100.00 94.12 2 80 71.27 62.48 3 75 50.06 48.45
Over the last three years, the average number of infections for Hawke’s Bay was six. The range in the Hospital Acquired Blood Stream Infections rate for Hawke’s Bay (a secondary DHB) over the last three years was 0.57-2.6% (compared with the range of the results for all secondary DHBs combined which was 0.85-1.57% over the last three years). These figures indicate that the results for the last two quarters have been high (see table below).
December 04 September 04 June 04 Mar 04 Hawke’s Bay number rate number rate number rate number rate
Hospital acquired blood infections 12 2.60 10 1.96 7 1.42 3 0.64
Process and Efficiency quadrant Resource Utilisation Resource Utilisation rate was stable at a little over 99%. Performance to Contract The Performance to Contract rate was within the acceptable range of 98-102% and there was little change from the September 2004 quarter. Average Length of Stay The Average Length of Stay rate was stable on 3.65 days. This was consistent with previous months. Daycase Surgery After a high result in the September quarter, the Daycase Surgery rate reduced and so worsened by 5.7% and was 70.1% for the December quarter.

Appendix II Hawke’s Bay DHB
Page 61
Significance/significantly refers to statistical significance—see Appendix II
Financial quadrant Operating Margin Hawke’s Bay saw 40% reductions in both ratios from the September quarter, with the Operating Margin to Assets at 8.5% (see table below) below the cost of capital.
Hawke's Bay Dec 04 Sep 04 Jun 04 Mar 04 Dec 03 Sep 03 Jun 03 Mar 03 Operating Margin/Assets
8.51 14.09 6.01 7.32 6.84 14.10 -1.19 1.17
Operating Margin/Revenue 3.41 5.83 2.75 3.40 2.97 6.70 -0.76 0.58
Asset Utilisation Asset utilisation is trending upward, with an 8% increase on the December 2003 quarter.
Hawke's Bay Dec 04 Sep 04 Jun 04 Mar 04 Dec 03 Sep 03 Jun 03 Mar 03 Asset utilisation 2.50 2.42 2.19 2.15 2.30 2.11 1.57 2.00
Debt Ratio Positive movement, with debt ratios moving to under 55% for the two quarters of this financial year compared to the previous financial year when the rates were closer to 60%. Result Small deficit recorded of $0.07M for the current financial year to December 31.

Appendix II MidCentral DHB
Page 62
Significance/significantly refers to statistical significance—see Appendix II
MIDCENTRAL DHB HOSPITALS (Clevely Health Centre, Horowhneua Hospital, Palmerston North Hospital,
Kimberley Centre) Organisational Health quadrant Voluntary Staff Turnover Voluntary Staff Turnover rate for the December quarter was 2.33. This was down by 28% from the previous quarter, and by 38.1% from the December 2003 quarter. Staff Stability There was little change in Staff Stability rate this quarter. Staff Sick Leave Following previous years’ trends, sick leave was down in the December quarter (3.62), when compared to the September quarter (5.49). Staff Work-related Injury or Illness The Staff Work-related Injury or Illness rate for the December quarter was 15.88. While this was down by 46.7% from the previous quarter, it was 38.1% higher (worse) than the December 2003 quarter. The table below shows the actual number of illnesses or injuries in the last four quarters. MidCentral Dec 04 Sep 04 Jun 04 Mar 04 Number of injuries/illnesses
14 27 19 17
Quality and Patient Satisfaction quadrant Patient Satisfaction DHBs are expected to receive enough responses to the patient satisfaction questionnaire to give a 95% confidence level that the questionnaires returned give an accurate picture of all the patients seen by the DHB in that quarter. MidCentral’s confidence level for this quarter was 92% for inpatients and 95% for outpatients. The overall satisfaction rate for the quarter was 88.64%, similar to the September quarter’s satisfaction rating (88.92%). The DHB achieved satisfaction ratings above 76% for all individual inpatient questions except for the questions “Please rate how much you liked the food we gave you” (65.2%) and “Please rate our Emergency Department staff on: keeping you informed about how long you could expect to wait” (76.4%). The responses for the outpatient questionnaires were all above 82% except for the question “Please rate our staff on telling you how long you would wait, when you arrived” (71%).

Appendix II MidCentral DHB
Page 63
Significance/significantly refers to statistical significance—see Appendix II
Complaints Closed within 30 days The number of complaints received (120) this quarter decreased by six complaints and the complaint closure rate improved by 4% from the last quarter to 84.17%. Triage (Palmerston North Hospital Emergency Department) The total number of patients attending the Palmerston North Emergency Department in the December quarter (4042) decreased from the September quarter (4519). There was a slight improvement in the percentage of patients seen within the triage times but the benchmarks for triage codes 2 and 3 were not met again this quarter.
% meeting triage time for the quarter
Triage Code
Benchmark%
December 2004
September 2004
1 100 100.00 100.00 2 80 59.67 37.50 3 75 58.10 33.02
Hospital Acquired Blood Stream Infections Over the last three years, the average number of infections for MidCentral was 11. The range in the Hospital Acquired Blood Stream Infections rate for MidCentral (a secondary DHB) was 0.93-4.62% over the last three years (compared with the range of 0.85-1.57% over the same time period for all secondary DHBs combined). The table below shows the actual numbers of infections over the last four quarters.
December 04 September 04 June 04 Mar 04 MidCentral number rate number rate number rate number rate
Hospital acquired blood infections 19 4.29 12 2.56 19 2.38 19 4.62
Process and Efficiency quadrant Resource Utilisation The Resource Utilisation rate for the financial year to date was up by 4% on the same period last year. Performance to Contract The Performance to Contract rate was 101% for the December quarter, which was within the acceptable range of 98-102%. The rate was up by 1.6% from the September quarter. Average Length of Stay The Average Length of Stay rate improved by dropping to 3.24 days for the quarter. This was down by 5.8% from the previous quarter and by 5.0% on the December 2003 quarter.

Appendix II MidCentral DHB
Page 64
Significance/significantly refers to statistical significance—see Appendix II
Daycase Surgery After a high result in the September quarter, the Daycase Surgery rate dropped 7.4% for the December quarter to 64.68%. This was the lowest rate since the December 2001 quarter. Financial quadrant Operating Margin There were 50% reductions in both ratios in comparison to the September quarter (see table below). However the margins were still over the 9.1% weighted average cost of capital.
MidCentral Dec 04 Sep 04 Jun 04 Mar 04 Dec 03 Sep 03 Jun 03 Mar 03 Operating Margin/Assets
10.37 20.26 5.76 7.84 8.96 15.52 -2.22 -1.52
Operating Margin/Revenue 4.28 8.91 2.83 3.85 4.56 7.44 -1.15 -0.71
Asset Utilisation There was a 23% increase in Asset Utilisation on the result for the December 2003 quarter.
MidCentral Dec 04 Sep 04 Jun 04 Mar 04 Dec 03 Sep 03 Jun 03 Mar 03 Asset utilisation 2.42 2.27 2.03 2.04 1.97 2.09 1.97 2.16
Debt ratio The ration was consistent with the average of 54% for the last four quarters. Result The MidCentral providers achieved a small surplus of $0.45M for the current financial year to December 31.

Appendix II Whanganui DHB
Page 65
Significance/significantly refers to statistical significance—see Appendix II
WHANGANUI DHB HOSPITALS (Whanganui Hospital, Taihape Hospital, Rangitiki Health Centre, Taihape
Health Centre, Waimarino Health Centre) Organisational Health quadrant Voluntary Staff Turnover Voluntary Staff Turnover for the December quarter was 3.36. This was up by 46.4% from the previous quarter and 86.1% higher than the December 2003 quarter. Staff Stability While the Staff Stability rate (51.72), decreased slightly on the previous quarter it is trending upwards and was 37.9% higher than the December 2003 quarter’s result. Staff Sick Leave Whanganui provided no sick leave data for this quarter. Staff Work-related Injury or Illness There were no Staff Work-related Injuries or Illnesses resulting in time off work reported in Whanganui for this quarter. Quality and Patient Satisfaction quadrant Patient Satisfaction DHBs are expected to receive enough responses to the patient satisfaction questionnaire to give a 95% confidence level that the questionnaires returned give an accurate picture of all the patients seen by the DHB in that quarter. Whanganui’s confidence level for this quarter was 90% for inpatients and 94% for outpatients. The overall satisfaction rate for the quarter was 90.58%, similar to the September quarter’s satisfaction rating (89.84%). The DHB achieved satisfaction ratings above 80% for all individual inpatient questions, except for the questions “Please rate how much you liked the food we gave you” (72.6%) and “Please rate our Emergency Department staff on: keeping you informed about how long you could expect to wait” (76.6%). The responses for the outpatient questionnaires were all above 80%, except for the question “Please rate our staff on telling you how long you would wait, when you arrived” (72.3%). Complaints Closed within 30 days The number of complaints received (34) this quarter decreased by one complaint, and the complaint closure rate improved by 2.9% from the last quarter to 64.71%.

Appendix II Whanganui DHB
Page 66
Significance/significantly refers to statistical significance—see Appendix II
Triage (Whanganui Hospital Emergency Department) The total number of patients attending the Whanganui Emergency Department in the December quarter (947) was similar to the September quarter (935). There was a slight worsening in the percentage of patients seen within the triage times, resulting in the benchmarks for triage codes 2 and 3 not being met this quarter, although they were met in the previous three quarters.
% meeting triage time for the quarter
Triage Code
Benchmark%
December 2004
September 2004
1 100 100.00 100.00 2 80 79.17 81.91 3 75 73.66 80.88
Hospital Acquired Blood Stream Infections Over the last three years, the average number of infections for Whanganui has been one. The table below shows that there has only been one infection reported for each of the last four quarters. The range in the rate of Hospital Acquired Blood Stream Infections in Whanganui (a secondary DHB) for the last three years was 0-0.62% (compared with the range for the last three years of 0.85-1.57% for all secondary DHBs combined).
December 04 September 04 June 04 Mar 04 Whanganui number rate number rate number rate number rate
Hospital acquired blood infections 1 0.27 1 0.25 1 0.00 1 0.33
Process and Efficiency quadrant Resource Utilisation Whanganui’s Resource Utilisation rates were up by 2.5% for this financial year to date compared with the rates at the same time in the last financial year. Performance to Contract The Performance to Contract rate was within the acceptable range of 98-102%, after a good performance in the December 2004 quarter following an under-performing September quarter. Average Length of Stay The Average Length of Stay rate was stable on 3.22 days. This was consistent with previous months. Daycase Surgery After high results for the last five quarters, the Daycase Surgery rate dropped this quarter to 75.55%.

Appendix II Whanganui DHB
Page 67
Significance/significantly refers to statistical significance—see Appendix II
Financial quadrant Operating Margin There were reductions in both Operating Margin ratios in comparison to the September quarter, and the December 2004 quarter results were 15% down on the December 2003 quarter results. Asset Utilisation A 20% increase from the September 2004 quarter, but slightly down on the same time last financial year.
Whanganui Dec 04 Sep 04 Jun 04 Mar 04 Dec 03 Sep 03 Jun 03 Mar 03 Asset utilisation 2.17 1.81 1.73 2.06 2.36 1.96 1.91 1.87
Debt Ratio The ratio decreased by 24% reduction in its debt ratio from the September quarter to sit below 30%. Result Whanganui hospitals recorded a deficit of $1.0M for the current financial year to December 31.

Appendix II Capital & Coast DHB
Page 68
Significance/significantly refers to statistical significance—see Appendix II
CAPITAL & COAST DHB HOSPITALS (Wellington Hospital, Kenepuru Hospital)
Organisational Health quadrant Voluntary Staff Turnover Voluntary Staff Turnover was stable for this quarter on 5.15. Staff Stability The Staff Stability rate was down by 11.6% from the previous quarter, and is now on 41.36. Staff Sick Leave The Sick Leave rate was 2.47, which is down 29.9% from the previous quarter (see table below). Capital and Coast Dec 04 Sep 04 Jun 04 Mar 04 Sick leave 2.47 3.52 3.11 2.34 Staff Work-related Injury or Illness The Staff Work-related Injury or Illness rate for the December quarter was 1.89, which was a favourable reduction on both the previous quarter (by 27.4%) and the December 2003 quarter (by 67.0%). The table below shows the actual numbers of injuries or illnesses that occurred over the last four quarters. Capital and Coast Dec 04 Sep 04 Jun 04 Mar 04 Number of injuries/illnesses
3 4 2 7
Quality and Patient Satisfaction quadrant Patient Satisfaction DHBs are expected to receive enough responses to the patient satisfaction questionnaire to give a 95% confidence level that the questionnaires returned give an accurate picture of all the patients seen by the DHB in that quarter. Capital & Coast’s confidence level for this quarter was 97% for inpatients and 95% for outpatients. The overall satisfaction rate for the quarter was 85.41%, similar to the September quarter’s satisfaction rating (84.58%). The DHB achieved satisfaction ratings above 75% for all individual inpatient questions except for the questions “Please rate how much you liked the food we gave you” (65.5%) and “Please rate our Emergency Department staff on: keeping you informed about how long you could expect to wait” (70.5%). The responses for the outpatient questionnaires were all above 78% except for the question “Please rate our staff on telling you how long you would wait, when you arrived” (65.7%).
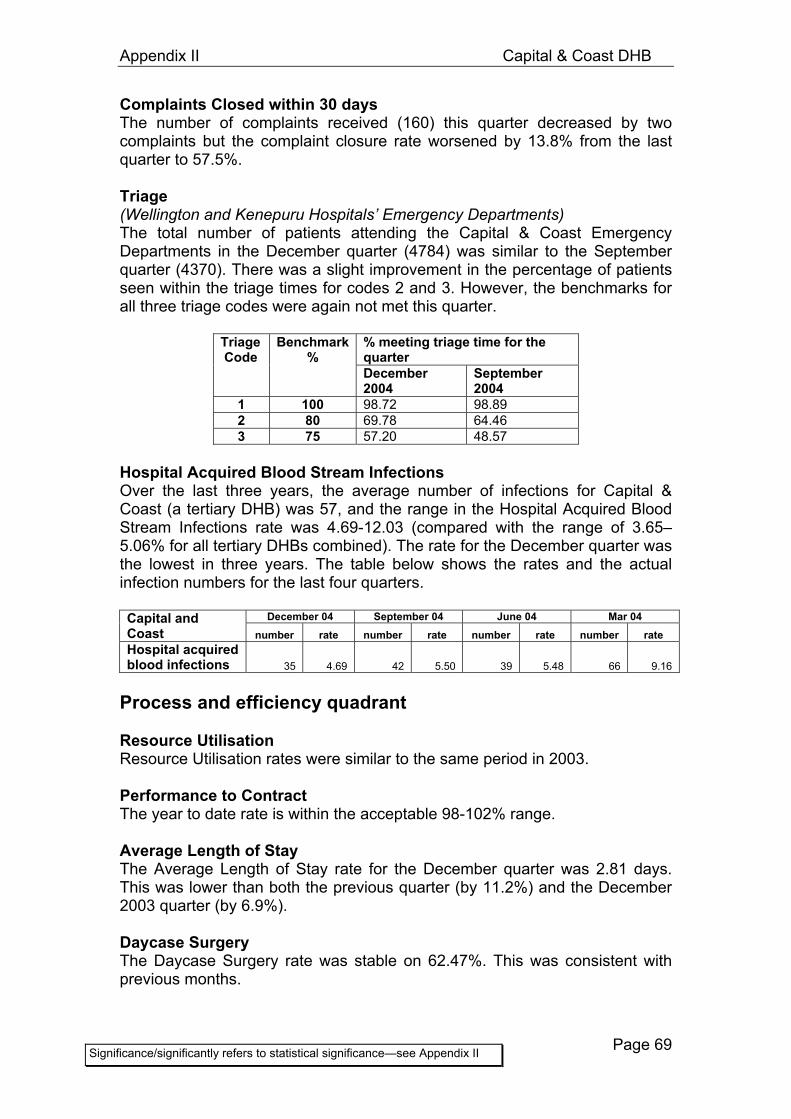
Appendix II Capital & Coast DHB
Page 69
Significance/significantly refers to statistical significance—see Appendix II
Complaints Closed within 30 days The number of complaints received (160) this quarter decreased by two complaints but the complaint closure rate worsened by 13.8% from the last quarter to 57.5%. Triage (Wellington and Kenepuru Hospitals’ Emergency Departments) The total number of patients attending the Capital & Coast Emergency Departments in the December quarter (4784) was similar to the September quarter (4370). There was a slight improvement in the percentage of patients seen within the triage times for codes 2 and 3. However, the benchmarks for all three triage codes were again not met this quarter.
% meeting triage time for the quarter
Triage Code
Benchmark%
December 2004
September 2004
1 100 98.72 98.89 2 80 69.78 64.46 3 75 57.20 48.57
Hospital Acquired Blood Stream Infections Over the last three years, the average number of infections for Capital & Coast (a tertiary DHB) was 57, and the range in the Hospital Acquired Blood Stream Infections rate was 4.69-12.03 (compared with the range of 3.65–5.06% for all tertiary DHBs combined). The rate for the December quarter was the lowest in three years. The table below shows the rates and the actual infection numbers for the last four quarters.
December 04 September 04 June 04 Mar 04 Capital and Coast number rate number rate number rate number rate Hospital acquired blood infections 35 4.69 42 5.50 39 5.48 66 9.16
Process and efficiency quadrant Resource Utilisation Resource Utilisation rates were similar to the same period in 2003. Performance to Contract The year to date rate is within the acceptable 98-102% range. Average Length of Stay The Average Length of Stay rate for the December quarter was 2.81 days. This was lower than both the previous quarter (by 11.2%) and the December 2003 quarter (by 6.9%). Daycase Surgery The Daycase Surgery rate was stable on 62.47%. This was consistent with previous months.

Appendix II Capital & Coast DHB
Page 70
Significance/significantly refers to statistical significance—see Appendix II
Financial quadrant Operating Margin Both ratios saw decreases from the September 2004 quarter (see table below). However, the results this quarter were vastly better than the December 2003 quarter’s ratios, which were negative.
Capital and Coast Dec 04 Sep 04 Jun 04 Mar 04 Dec 03 Sep 03 Jun 03 Mar 03 Operating Margin/Assets
1.69 2.78 4.46 1.56 -0.16 1.35 4.29 7.05
Operating Margin/Revenue 1.40 2.15 3.32 1.12 -0.11 0.97 3.08 4.52
Asset Utilisation Down on the September 2004 quarter and the December 2003 quarter (see table below).
Capital & Coast Dec 04 Sep 04 Jun 04 Mar 04 Dec 03 Sep 03 Jun 03 Mar 03 Asset 1.20 1.29 1.34 1.39 1.39 1.39 1.40 1.56
Debt Ratio The Debt ratio is on the rise during this financial year at over 50%, having spent the previous financial year around the 47% mark. Result The hospitals recorded a deficit of $2.7M for the financial year to date up until December 31.

Appendix II Hutt DHB
Page 71
Significance/significantly refers to statistical significance—see Appendix II
HUTT VALLEY DHB HOSPITAL (Hutt Hospital)
Organisational Health quadrant Voluntary Staff Turnover Voluntary Staff Turnover was 4.95, up 47.9% from the previous quarter, which follows a trend similar to the December 2003 quarter. Staff Stability The Staff Stability rate followed previous years’ trends with a lower result in the December quarter (47.37) compared to the other quarters for the year. Staff Sick Leave Following previous years’ trends, Sick Leave was down in the December quarter (3.17) when compared to the previous quarter (3.74). It shows a positive trend down by 13.9% from the December 2003 quarter. Staff Work-related Injury or Illness The Staff Work-related Injury or Illness rate on 2.76 was down from both the previous quarter (by 29.9%) and the December 2003 quarter (by 14.3%). The table below shows the actual number of illnesses or injuries in the last four quarters. Hutt Valley Dec 04 Sep 04 Jun 04 Mar 04 Number of injuries/illnesses
2 3 2 4
Quality and Patient Satisfaction quadrant Patient Satisfaction DHBs are expected to receive enough responses to the patient satisfaction questionnaire to give a 95% confidence level that the questionnaires returned give an accurate picture of all the patients seen by the DHB in that quarter. Hutt Valley’s confidence level for this quarter was 91% for inpatients and 86% for outpatients. The overall satisfaction rate for the quarter was 89.77%, similar to the September quarter’s satisfaction rating (89.5%). The DHB achieved satisfaction ratings above 80% for all individual inpatient questions except for the questions “Please rate how much you liked the food we gave you” (71.3%) and the “Please rate our Emergency Department staff on keeping you informed about how long you could expect to wait” (73.7%). The responses for the outpatient questionnaires were all above 79% except for the question “Please rate our staff on telling you how long you would wait, when you arrived” (72.3%).

Appendix II Hutt DHB
Page 72
Significance/significantly refers to statistical significance—see Appendix II
Complaints Closed within 30 days The number of complaints received (73) this quarter increased by six complaints, and the complaint closure rate worsened by 9.7% from the last quarter to 84.93%. Triage The total number of patients attending the Hutt Emergency Department in the December quarter (2957) decreased from the September quarter (3549). There was a very slight improvement in the percentage of patients seen within the triage times, but the benchmarks for triage codes 2 and 3 were again not met this quarter.
% meeting triage time for the quarter
Triage Code
Benchmark%
December 2004
September 2004
1 100 100.00 100.00 2 80 77.82 72.67 3 75 46.38 42.70
Hospital Acquired Blood Stream Infections Over the last three years, the average number of infections for Hutt was four. The range in the Hospital Acquired Blood Stream Infections rate for Hutt (a secondary DHB) over the last three years was 0-1.44% (compared with the range in the rate of 0.85-1.57% over the same time period for all secondary DHBs). This was the first quarter in three years where no infections were reported (see table below).
December 04 September 04 June 04 Mar 04 Hutt number rate number rate number rate number rate
Hospital acquired blood infections 0 0 4 0.89 5 1.14 3 0.70
Process and Efficiency quadrant Resource Utilisation Resource utilisation rates were up by 1% on the first six months of 2003. Performance to Contract Performance to Contract was above the upper limit of the acceptable range (98-102%) for the financial year to date. This is a similar picture to the last three years when the DHB has over-produced in the first three quarters of the financial year and then balanced this with under-production in the last quarter. Average Length of Stay The Average Length of Stay rate was stable on 2.96 days, down slightly (2.9%) from the previous quarter. Daycase Surgery The Daycase Surgery rate for the December quarter was 72.90%, up by 3.9% from the previous quarter and by 3.0% from the December 2003 quarter.

Appendix II Hutt DHB
Page 73
Significance/significantly refers to statistical significance—see Appendix II
Financial quadrant Operating Margins There was 25% reduction in both ratios from the September quarter (see table below) and 50% downturn in the results from the December 2003 quarter.
Hutt Valley Dec 04 Sep 04 Jun 04 Mar 04 Dec 03 Sep 03 Jun 03 Mar 03 Operating Margin/Assets
6.18 8.23 8.90 10.32 12.26 12.87 6.04 10.24
Operating Margin/Revenue 4.07 5.50 6.05 7.16 8.87 9.16 4.92 5.43
Asset Utilisation Slowly trending up with a 10% increase on the December 2003 quarter result.
Hutt Valley Dec 04 Sep 04 Jun 04 Mar 04 Dec 03 Sep 03 Jun 03 Mar 03 Asset utilisation 1.52 1.50 1.47 1.44 1.38 1.41 1.24 1.91
Debt ratio Consistently low average, sitting around the 31% mark so far this financial year. Result Recorded a deficit of $1.4M for the first half of the current financial year to December 31.

Appendix II Wairarapa DHB
Page 74
Significance/significantly refers to statistical significance—see Appendix II
WAIRARAPA DHB HOSPITAL (Masterton Hospital)
Organisational Health quadrant Voluntary Staff Turnover Voluntary Staff Turnover on 4.29 was up by 29.8% from the previous quarter, and by 22.8% from the December 2003 quarter. Staff Stability The Staff Stability rate decreased by 24.4% from the December 2003 quarter on 44.44. Staff Sick Leave Staff Sick Leave for the December quarter was 2.72, down by 19.1% from the previous quarter and by 18.8% from the December 2003 quarter. Staff Work-related Injury or Illness The Staff Work-related Injury or Illness rate of 5.42 was down from both the previous quarter (by 50.7%) and the December 2003 quarter (by 49.2%). The table below shows the actual numbers of individual injuries or illnesses for the last four quarters. Wairarapa Dec 04 Sep 04 Jun 04 Mar 04 Number of injuries/illnesses
1 2 3 2
Quality and Patient Satisfaction quadrant Patient Satisfaction DHBs are expected to receive enough responses to the patient satisfaction questionnaire to give a 95% confidence level that the questionnaires returned give an accurate picture of all the patients seen by the DHB in that quarter. Wairarapa’s confidence level for this quarter was 85% for inpatients and 93% for outpatients. The overall satisfaction rate for the quarter was 90.41%, a significant worsening to the September quarter’s satisfaction rating (91.33%) but still a high result. The DHB achieved satisfaction ratings above 80% for all individual inpatient questions except for the question “Please rate how much you liked the food we gave you” (72.1%). The responses for the outpatient questionnaires were all above 85% except for the question “Please rate our staff on telling you how long you would wait, when you arrived” (79.4%).

Appendix II Wairarapa DHB
Page 75
Significance/significantly refers to statistical significance—see Appendix II
Complaints Closed within 30 days The number of complaints received (17) this quarter decreased by 27 complaints, but the complaint closure rate worsened by 22.4% from the last quarter to 52.94%. Triage (Masterton Hospital Emergency Department) The total number of patients attending the Masterton Hospital Emergency Department in the December quarter (1818) was similar to the September quarter (1821). The DHB again reported meeting all the benchmarks as it has done for the previous two quarters.
% meeting triage time for the quarter
Triage Code
Benchmark%
December 2004
September 2004
1 100 100.00 100.00 2 80 100.00 100.00 3 75 100.00 100.00
Hospital Acquired Blood Stream Infections Over the last three years the average number of infections for Wairarapa was one. The range in the Hospital Acquired Blood Stream Infections rate for Wairarapa (a secondary DHB) in the last three years (excluding an anomalous result of 1.58% for the September 2003 quarter) was 0-1.06% (compared with the range in the rate of 0.85-1.57% for all secondary DHBs combined).
December 04 September 04 June 04 Mar 04 Wairarapa number rate number rate number rate number rate
Hospital acquired blood infections 0 0.00 0 0.00 0 0.00 1 0.90
Process and Efficiency quadrant Resource Utilisation Wairarapa has had an increase of over 10% in Resource Utilisation rates for the year to date in comparison to the first six months of the 2003/04 financial year, and the overall rate for that year. Performance to Contract The Performance to Contract result for the December quarter was 99.7% but the year to date result is under 98% because of the under-performance in the September quarter. Average Length of Stay The Average Length of Stay rate for the December quarter was 2.94 days. This was lower when compared to both the previous quarter (by 11.6%) and the December 2003 quarter (by 6.3%).

Appendix II Wairarapa DHB
Page 76
Significance/significantly refers to statistical significance—see Appendix II
Daycase Surgery While the Daycase Surgery rate dropped by 2.9% from the previous quarter, 74.34% was the second highest rate recorded by Wairarapa since the December 2003 quarter. Financial quadrant Operating Margin Results for Wairarapa will move around over this financial year as its building project continues (see table below).
Wairarapa Dec 04 Sep 04 Jun 04 Mar 04 Dec 03 Sep 03 Jun 03 Mar 03 Operating Margin/Assets
14.61 8.66 -50.02 3.16 4.28 3.16 3.81 3.24
Operating Margin/Revenue 3.45 3.45 -12.02 1.29 1.78 1.40 1.77 1.03
Asset Utilisation Accounts and capital funding advancement do not always match during a building project leading to distortions in ratios.
Wairarapa Dec 04 Sep 04 Jun 04 Mar 04 Dec 03 Sep 03 Jun 03 Mar 03 Asset utilisation 4.23 2.51 4.16 2.45 2.41 2.25 2.19 3.20
Debt Ratio Increased by 82% on the September quarter, and is now over the 65% maximum recommended. Result The hospital achieved a small surplus of $0.3M for the current financial year to date.

Appendix II Nelson Marlborough DHB
Page 77
Significance/significantly refers to statistical significance—see Appendix II
NELSON MARLBOROUGH DHB HOSPITALS (Nelson Hospital, Wairau Hospital, Golden Bay Hospital, Motueka Community
Hospital, Alexandra Hospital, Arthur McCaa Hospital, Murchison, Churchill Trust – Private)
Organisational Health quadrant Voluntary Staff Turnover There was little change in Voluntary Staff Turnover this quarter. Staff Stability Staff Stability rate this quarter was 38.24, which was 18.3% higher than the previous quarter. Staff Sick Leave Staff Sick Leave increased slightly from the previous quarter and at 4.02 was up by 27.2% from the December 2003 quarter. Staff Work-related Injury or Illness The Staff Work-related Injury or Illness rate of 2.57 was down by 48.8% from the previous quarter (see table below). Nelson Marlborough Dec 04 Sep 04 Jun 04 Mar 04 Number of injuries/illnesses
2 4 Not reported Not reported
Quality and Patient Satisfaction quadrant Patient Satisfaction DHBs are expected to receive enough responses to the patient satisfaction questionnaire to give a 95% confidence level that the questionnaires returned give an accurate picture of all the patients seen by the DHB in that quarter. Nelson Marlborough’s confidence level was 95%. The overall satisfaction rate for the quarter was 92.96%, similar to the September quarter’s satisfaction rating (93.78%). The DHB achieved satisfaction ratings above 84% for all individual inpatient questions except for the questions “Please rate how much you liked the food we gave you” (77.7%) and “Please rate our Emergency Department staff on: keeping you informed about how long you could expect to wait” (83.3%). The responses for the outpatient questionnaires were all above 84% except for the question “Please rate our staff on telling you how long you would wait, when you arrived” (73.6%). Complaints Closed within 30 days The number of complaints received (21) this quarter decreased by one and the complaint closure rate improved by 25.7% from the last quarter to 57.14%.

Appendix II Nelson Marlborough DHB
Page 78
Significance/significantly refers to statistical significance—see Appendix II
Triage (Nelson and Wairau Hospitals’ Emergency Departments) The total number of patients attending the Nelson and Wairau Hospitals’ Emergency Departments in the December quarter (3099) was similar to the September quarter (3008). The DHB met the benchmarks for triage codes 2 and 3 but not code 1 (the most critically ill patients), although the benchmark for triage code 1 was met for the December 2003, March 2004 and June 2004 quarters.
% meeting triage time for the quarter
Triage Code
Benchmark%
December 2004
September 2004
1 100 71.43 87.50 2 80 81.59 87.62 3 75 77.80 78.07
Hospital Acquired Blood Stream Infections Over the last three years the average number of infections for Nelson Marlborough was three (this allows for the fact that the DHB did not report infections in the September and December 2003 quarters). The range in the Hospital Acquired Blood Stream Infections rate for Nelson Marlborough (a secondary DHB), over the last three years, was 0.48-1.72% (compared with the range of 0.85-1.57% for the same time period for all secondary DHBs combined). The table below gives the actual number of infections and the rates for the last four quarters.
December 04 September 04 June 04 Mar 04 Nelson Marlborough number rate number rate number rate number rate Hospital acquired blood infections 2 0.51 4 1.08 2 1.12 2 0.48
Process and Efficiency quadrant Resource Utilisation Nelson Marlborough did not report this information until this financial year, with the December 2004 quarter figure being down on the September 2004 quarter. Performance to Contract The Performance to Contract for the year to date was under the acceptable range of 98-102% due to under-production in the June and December 2004 quarters. Average Length of Stay The Average Length of Stay rate for the December quarter was 2.77 days. Results this low (favourable) had not been seen since the March 2002 quarter.

Appendix II Nelson Marlborough DHB
Page 79
Significance/significantly refers to statistical significance—see Appendix II
Daycase Surgery The Daycase Surgery rate has followed a downward trend (unfavourable) since the September 2003 quarter and at 73.06, was 4.7% below the December 2003 quarter’s results. Financial quadrant Operating Margin There were small percentage shifts down in both ratios from the September quarter. However, Operating Margin to Assets is up 17% on the December 2003 quarter (see table below).
Nelson Marlborough Dec 04 Sep 04 Jun 04 Mar 04 Dec 03 Sep 03 Jun 03 Mar 03 West Coast Operating Margin/Assets
7.29 7.79 4.21 7.12 6.22 5.74 4.62 6.65
Operating Margin/Revenue 3.45 3.71 2.38 4.02 3.58 3.37 2.86 3.59
Asset Utilisation Little change from the September quarter, but up 22% on the December 2003 quarter.
Nelson Marlborough Dec 04 Sep 04 Jun 04 Mar 04 Dec 03 Sep 03 Jun 03 Mar 03 Asset utilisation 2.11 2.10 1.77 1.77 1.74 1.70 1.61 1.85
Debt Ratio Consistent ratio with last four quarters averaging 54%. Result The hospitals recorded a deficit of $0.6M for the financial year to date.

Appendix II West Coast DHB
Page 80
Significance/significantly refers to statistical significance—see Appendix II
WEST COAST DHB HOSPITALS (Buller Hospital, Kynnersley Rest Home, Ziman House Rest Home, Grey
Base Hospital, Reefton Hospital, Seaview Hospital, Hokitika Health Centre) Organisational Health quadrant Voluntary Staff Turnover Voluntary Staff Turnover for the December quarter was 5.48. This was up by 76.5% from the December 2003 quarter. Staff Stability The Staff Stability rate was 60, which was an increase (unfavourable) of 20% from the previous quarter and of 72.5% from the December 2003 quarter. Staff Sick Leave Sick Leave for the December quarter was 2.98. This was down by 33.1% from the previous quarter but it was up by 19.9% from the December 2003 quarter. Staff Work-related Injury or Illness The Staff Work-related Injury or Illness rate was 13.82 which was up by 42.9% from the previous quarter but down by 18.8% from the December 2003 quarter. The table below shows the actual numbers of injuries or illnesses in the last four quarters. West Coast Dec 04 Sep 04 Jun 04 Mar 04 Number of injuries/illnesses
4 3 1 4
Quality and Patient Satisfaction quadrant Patient Satisfaction DHBs are expected to receive enough responses to the patient satisfaction questionnaire to give a 95% confidence level that the questionnaires returned give an accurate picture of all the patients seen by the DHB in that quarter. West Coast has tried a number of initiatives to improve the response rate to the patient satisfaction questionnaires, but it appears that small population may have been “saturated” over the 11 years of sending out questionnaires. The DHB has had patients complaining that they have already completed several questionnaires over the 11 years. The confidence level for this quarter was 54% for inpatients and 61% for outpatients. The overall satisfaction rate for the quarter was 89.66%, a worsening on the September quarter’s satisfaction rating (91.07%), but still a high result. The DHB achieved satisfaction ratings above 87% for all individual inpatient questions except for the questions “Please rate how much you liked the food we gave you” (83.5%) and “Please rate our Emergency Department staff on: telling you how the Emergency Department would treat your problem” (78.2%)
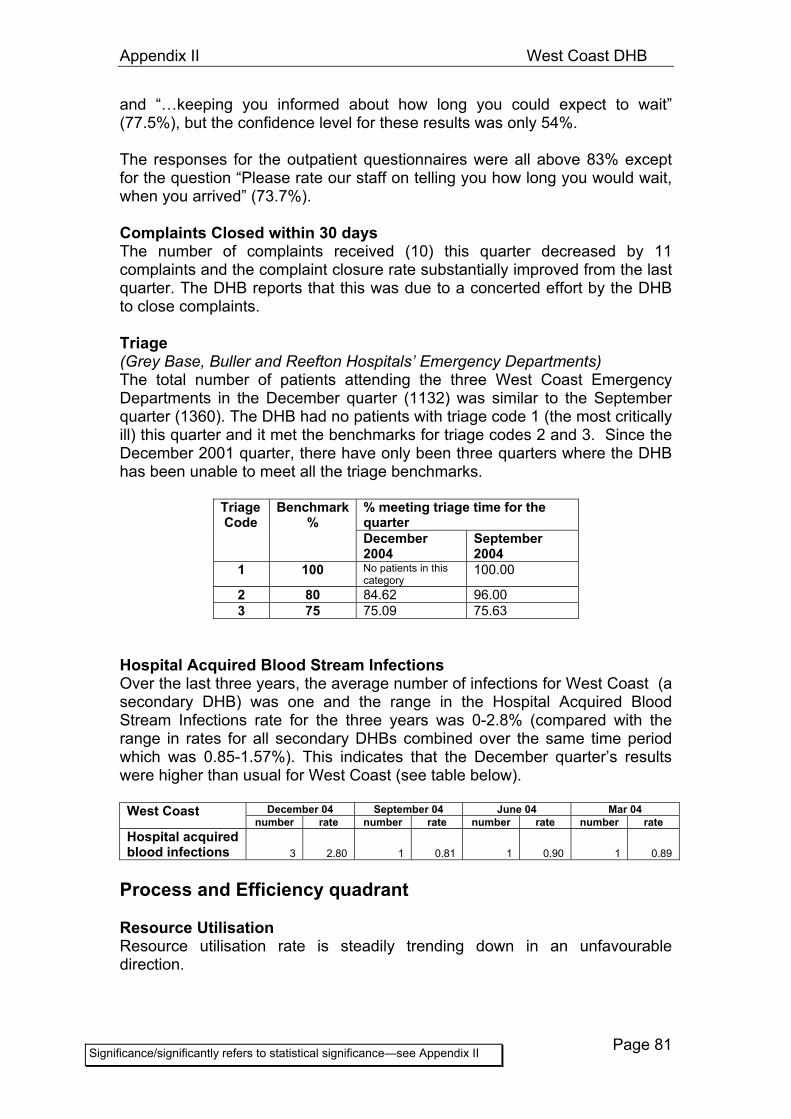
Appendix II West Coast DHB
Page 81
Significance/significantly refers to statistical significance—see Appendix II
and “…keeping you informed about how long you could expect to wait” (77.5%), but the confidence level for these results was only 54%. The responses for the outpatient questionnaires were all above 83% except for the question “Please rate our staff on telling you how long you would wait, when you arrived” (73.7%). Complaints Closed within 30 days The number of complaints received (10) this quarter decreased by 11 complaints and the complaint closure rate substantially improved from the last quarter. The DHB reports that this was due to a concerted effort by the DHB to close complaints. Triage (Grey Base, Buller and Reefton Hospitals’ Emergency Departments) The total number of patients attending the three West Coast Emergency Departments in the December quarter (1132) was similar to the September quarter (1360). The DHB had no patients with triage code 1 (the most critically ill) this quarter and it met the benchmarks for triage codes 2 and 3. Since the December 2001 quarter, there have only been three quarters where the DHB has been unable to meet all the triage benchmarks.
% meeting triage time for the quarter
Triage Code
Benchmark%
December 2004
September 2004
1 100 No patients in this category
100.00
2 80 84.62 96.00 3 75 75.09 75.63
Hospital Acquired Blood Stream Infections Over the last three years, the average number of infections for West Coast (a secondary DHB) was one and the range in the Hospital Acquired Blood Stream Infections rate for the three years was 0-2.8% (compared with the range in rates for all secondary DHBs combined over the same time period which was 0.85-1.57%). This indicates that the December quarter’s results were higher than usual for West Coast (see table below).
December 04 September 04 June 04 Mar 04 West Coast number rate number rate number rate number rate
Hospital acquired blood infections 3 2.80 1 0.81 1 0.90 1 0.89
Process and Efficiency quadrant Resource Utilisation Resource utilisation rate is steadily trending down in an unfavourable direction.

Appendix II West Coast DHB
Page 82
Significance/significantly refers to statistical significance—see Appendix II
Performance to Contract The DHB continues to under-produce and the Performance to Contract rate for the financial year to date was under the acceptable range of 98-102%. Average Length of Stay The Average Length of Stay rate for the December quarter was 3.16 days. This was the lowest result recorded since the December 2001 quarter. Daycase Surgery West Coast recorded its highest, and therefore best, Daycase Surgery rate since the December 2001 quarter. At 63.16%, it was up by 5.5% from the December 2003 quarter. Financial quadrant Operating Margin Both results moved further into the negative (see table below).
West Coast Dec 04 Sep 04 Jun 04 Mar 04 Dec 03 Sep 03 Jun 03 Mar 03 Operating Margin/Assets
-7.97 -4.65 2.59 0.70 0.15 0.22 -6.06 -11.59
Operating Margin/Revenue -3.47 -2.14 1.21 0.33 0.07 0.10 -3.08 -3.74
Asset Utilisation The rate was consistent with the December 2003 quarter (see table below).
West Coast Dec 04 Sep 04 Jun 04 Mar 04 Dec 03 Sep 03 Jun 03 Mar 03 Asset utilisation 2.29 2.17 2.14 2.13 2.22 2.16 1.97 3.10
Debt ratio The ratio of approximately 50% has been consistent for the last seven quarters. Result The hospitals recorded a deficit of $2.0M for the financial year to date up to December 31.

Appendix II Canterbury DHB
Page 83
Significance/significantly refers to statistical significance—see Appendix II
CANTERBURY DHB HOSPITALS (Akaroa Hospital, Ashburton Hospital, Burwood Hospital, Christchurch Hospital, Christchurch Women’s Hospital, Darfield Hospital, Ellesmere
Hospital, Lincoln Maternity Hospital, Lyndhurst Hospital, Tuarangi Home, Waikari Hospital, Rangiora Hospital, Kaikoura Hospital, Princess Margaret,
Oxford Hospital, Hillmorton Hospital) Organisational Health quadrant Voluntary Staff Turnover Voluntary Staff Turnover was 4.29, which was up by 43.4% from the previous quarter, and has now reached its highest point since the December 2001 quarter. Staff Stability Staff Stability was 23.17 representing a decrease (favourable) of 50.8% from the previous quarter, and it has reached its lowest rate since the December 2001 quarter. Staff Sick Leave Following previous years’ trends, Sick Leave was down in the December quarter (3.28) when compared to the previous quarter (3.76). Staff Work-related Injury or Illness The Staff Work-related Injury or Illness rate for the December quarter was 10.64. This was down from both the previous quarter (by 22.8%) and the December 2003 quarter (by 39.9%). The table below shows the actual numbers of injuries or illnesses for the last four quarters. Canterbury Dec 04 Sep 04 Jun 04 Mar 04 Number of injuries/illnesses
26 36 38 52
Quality and Patient Satisfaction quadrant Patient Satisfaction DHBs are expected to receive enough responses to the patient satisfaction questionnaire to give a 95% confidence level that the questionnaires returned give an accurate picture of all the patients seen by the DHB in that quarter. Canterbury’s confidence level for this quarter was 94% for inpatients and 98% for outpatients. The overall satisfaction rate for the quarter was 90.27%, similar to the September quarters’s satisfaction rating (90.23%). The DHB achieved satisfaction ratings above 80% for all individual inpatient questions, except for the question “Please rate how much you liked the food we gave you” (71.6%).

Appendix II Canterbury DHB
Page 84
Significance/significantly refers to statistical significance—see Appendix II
The responses for the outpatient questionnaires were all above 82%, except for the question “Please rate our staff on telling you how long you would wait, when you arrived” (68.5%). Complaints Closed within 30 days The number of complaints received (113) this quarter decreased by 37 complaints, but the complaint closure rate worsened by 8.6% from the last quarter to 54.87%. Triage (Akaroa Hospital, Ashburton Hospital, Christchurch Hospital, Christchurch Women’s Hospital, Kaikoura Hospital Emergency Departments) The total number of patients attending the five Canterbury emergency departments in the December quarter (10,406) was slightly less than the September quarter (10,786). The DHB did not meet the benchmarks for codes 2 and 3 and has been unable to do so since the December 2001 quarter.
% meeting triage time for the quarter
Triage Code
Benchmark%
December 2004
September 2004
1 100 94.67* 90.53 2 80 49.16 51.33 3 75 42.21 41.92
*The DHB is updating this data and the percentage is likely to be improved Hospital Acquired Blood Stream Infections Over the last three years, the average number of infections for Canterbury was 42. The range in the Hospital Acquired Blood Stream Infections rate over the same time period for Canterbury (a tertiary DHB) was 1.75-3.69% (compared with the range of 3.65–5.06% over the last three years for all tertiary DHBs combined). The number of infections in the December quarter was the highest number for three years and the Hospital Acquired Blood Stream Infections rate was the third highest rate for the DHB in the last three years. The table below shows the actual number of infections and the Hospital Acquired Blood Stream Infections rates over the last four quarters.
December 04 September 04 June 04 Mar 04 Canterbury number rate number rate number rate number rate
Hospital acquired blood infections 54 3.44 47 2.80 38 2.39 41 2.89
Process and Efficiency quadrant Resource Utilisation The Resource Utilisation rate remains stable at just under 100%. Performance to Contract The Performance to Contract rate was within the acceptable range of 98-102% for the financial year to date.

Appendix II Canterbury DHB
Page 85
Significance/significantly refers to statistical significance—see Appendix II
Average Length of Stay The Average Length of Stay rate dropped when compared to both the previous quarter (by 4.1%) and the December 2003 quarter (by 3.7%). The December quarter result of 3.31 days was the lowest result that Canterbury has recorded since the December 2001 quarter. Daycase Surgery The Daycase Surgery rate for the December quarter was 58.75%. This was higher (more favourable) than both the previous quarter (by 3.7%) and than the December 2003 quarter (by 6.0%). Financial quadrant Operating Margins Operating Margin to Assets was down by 7.5% on both the September quarter figure and the December 2003 quarter figure. Operating margin to Revenue was down by 10% on both those quarters (see table below).
Canterbury Dec 04 Sep 04 Jun 04 Mar 04 Dec 03 Sep 03 Jun 03 Mar 03 Operating Margin/Assets
8.29 8.96 7.15 8.77 8.96 9.63 2.11 4.00
Operating Margin/Revenue 4.59 5.19 4.14 5.15 5.11 5.53 1.35 1.83
Asset Utilisation Slowly trending up, with a 3% increase on the December 2003 quarter’s rate.
Canterbury Dec 04 Sep 04 Jun 04 Mar 04 Dec 03 Sep 03 Jun 03 Mar 03 Asset utilisation 1.81 1.72 1.73 1.70 1.75 1.74 1.56 2.18
Debt Ratio Ratio was just below 40% for the December quarter, a 20% increase on the result for the same quarter last financial year. Result The hospitals recorded a deficit of $0.4M for the financial year to date until December 31.

Appendix II South Canterbury DHB
Page 86
Significance/significantly refers to statistical significance—see Appendix II
SOUTH CANTERBURY DHB HOSPITALS (Timaru Hospital and Talbot Park Hospital)
Organisational Health quadrant Voluntary Staff Turnover Voluntary Staff Turnover was 2.88 this quarter which was down by 28.1% from the previous quarter, and by 33.7% from the December 2003 quarter. Staff Stability Like previous years the December quarter (27.78) showed improved results from the previous September quarter (36.00). Staff Sick Leave Following previous years’ trends, Sick Leave was down in the December quarter (2.86) when compared to the September quarter (3.58). Staff Work-related Injury or Illness The Staff Work-related Injury or Illness rate of 22.54 was up from the December 2003 quarter (by 151.5%). The total number of injuries or illnesses was five (see table below). South Canterbury Dec 04 Sep 04 Jun 04 Mar 04 Number of injuries/illnesses
5 5 2 4
Quality and Patient Satisfaction quadrant Patient Satisfaction DHBs are expected to receive enough responses to the patient satisfaction questionnaire to give a 95% confidence level that the questionnaires returned give an accurate picture of all the patients seen by the DHB in that quarter. South Canterbury’s confidence level for this quarter was 85% for inpatients and 88% for outpatients. The overall satisfaction rate for the quarter was 90.81%, which was an improvement on the September quarter’s satisfaction rating (89.06%). The DHB achieved satisfaction ratings above 80% for all individual inpatient questions, except for the question “Please rate how much you liked the food we gave you” (75.8%). The responses for the outpatient questionnaires were all above 79%, except for the question “Please rate our staff on telling you how long you would wait, when you arrived” (68.2%). Complaints Closed within 30 days The number of complaints received (24) this quarter increased by five complaints, and the complaint closure rate improved by 41% from the last quarter’s result of 87.5%.

Appendix II South Canterbury DHB
Page 87
Significance/significantly refers to statistical significance—see Appendix II
Triage (Timaru Hospital Emergency Department) The total number of patients attending the Timaru Hospital Emergency Department in the December quarter (1265) was a little lower than the September quarter (1464). The department met the benchmarks for triage codes 1, 2 and 3 this quarter as it has done since the September 2003 quarter, except for the June 2004 quarter when the benchmark for triage code 1 was not met and September 2004 quarter where the benchmarks for codes 1 and 2 were not met.
% meeting triage time for the quarter
Triage Code
Benchmark%
December 2004
September 2004
1 100 100.00 93.33 2 80 80.52 77.01 3 75 79.64 80.24
Hospital Acquired Blood Stream Infections Over the last three years, the average number of infections for South Canterbury (a secondary DHB) was three. The range in the Hospital Acquired Blood Stream Infections rate was 0.5-2.75% over the three years (compared with the range in the rate for all secondary DHBs combined which was 0.85-1.57% for the last three years). The table below give the actual numbers of infections and the rates for the last four quarters.
December 04 September 04 June 04 Mar 04 South Canterbury number rate number rate number rate number rate Hospital acquired blood infections 1 0.50 1 0.48 1 0.98 1 0.50
Process and Efficiency quadrant Resource Utilisation Resource utilisation rate for the first six months of the 2004/05 financial year was up by 12% on the rate for the 2003/04 year. Performance to Contract The DHB Performance to Contract rate was within the acceptable range of 98-102% for the financial year to date. Average Length of Stay The Average Length of Stay rate for the December quarter was 3.20 days. This was lower (more favourable) than both the previous quarters (by 7.8%) and lower than the December 2003 quarter (by 2.6%). Daycase Surgery While the Daycase Surgery rate of 73.36% had dropped slightly from last quarter (by 2.4%), it was up by 14.6% from the December 2003 quarter.
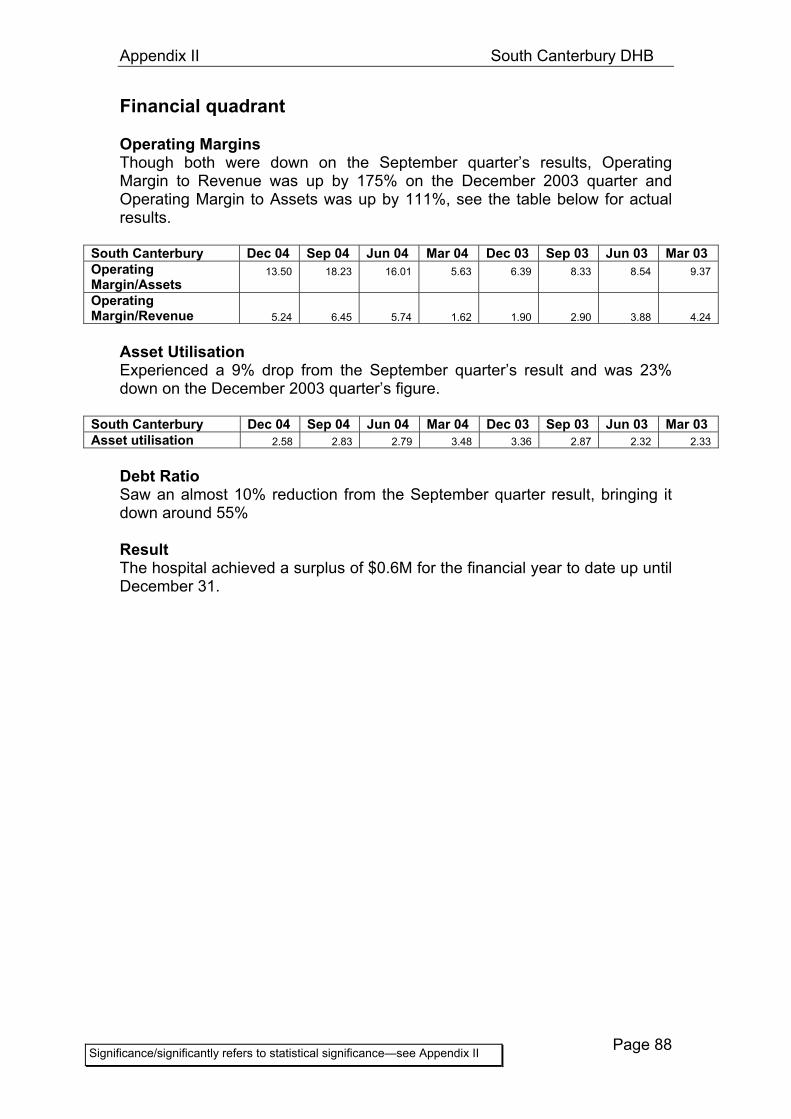
Appendix II South Canterbury DHB
Page 88
Significance/significantly refers to statistical significance—see Appendix II
Financial quadrant Operating Margins Though both were down on the September quarter’s results, Operating Margin to Revenue was up by 175% on the December 2003 quarter and Operating Margin to Assets was up by 111%, see the table below for actual results.
South Canterbury Dec 04 Sep 04 Jun 04 Mar 04 Dec 03 Sep 03 Jun 03 Mar 03 Operating Margin/Assets
13.50 18.23 16.01 5.63 6.39 8.33 8.54 9.37
Operating Margin/Revenue 5.24 6.45 5.74 1.62 1.90 2.90 3.88 4.24
Asset Utilisation Experienced a 9% drop from the September quarter’s result and was 23% down on the December 2003 quarter’s figure.
South Canterbury Dec 04 Sep 04 Jun 04 Mar 04 Dec 03 Sep 03 Jun 03 Mar 03 Asset utilisation 2.58 2.83 2.79 3.48 3.36 2.87 2.32 2.33
Debt Ratio Saw an almost 10% reduction from the September quarter result, bringing it down around 55% Result The hospital achieved a surplus of $0.6M for the financial year to date up until December 31.

Appendix II Otago DHB
Page 89
Significance/significantly refers to statistical significance—see Appendix II
OTAGO DHB HOSPITALS (Dunstan Hospital, Balclutha Hospital, Waitaki Hospital, Dunedin Hospital)
Organisational Health quadrant Voluntary Staff Turnover Voluntary Staff Turnover for the December quarter was 4.51. This was up by 57.4% from the previous quarter. Staff Stability There was little change in the Staff Stability rate this quarter. Staff Sick Leave Following previous years’ trends, sick leave was down in the December quarter (3.43) when compared to the previous quarter (3.98). Staff Work-related Injury or Illness The Staff Work-related Injury or Illness rate was 5.9, which was down from both the previous quarter (by 23.4%) and the December 2003 quarter (by 21.8%). The table below gives the actual number of injuries and illnesses in the last four quarters. Otago Dec 04 Sep 04 Jun 04 Mar 04 Number of injuries/illnesses
7 9 8 9
Quality and Patient Satisfaction quadrant Patient Satisfaction DHBs are expected to receive enough responses to the patient satisfaction questionnaire to give a 95% confidence level that the questionnaires returned give an accurate picture of all the patients seen by the DHB in that quarter. Otago’s confidence level for this quarter was 91% for inpatients and 91% for outpatients. The overall satisfaction rate for the quarter was 89.54%, an improvement on the September quarter’s satisfaction rating (88.53%). The DHB achieved satisfaction ratings above 80% for all individual inpatient questions, except for the questions relating “Please rate how much you liked the food we gave you” (74.1%) and “Please rate our Emergency Department staff on: keeping you informed about how long you could expect to wait” (76.1%). The responses for the outpatient questionnaires were all above 82%, except for the question “Please rate our staff on telling you how long you would wait, when you arrived” (68.4%).

Appendix II Otago DHB
Page 90
Significance/significantly refers to statistical significance—see Appendix II
Complaints Closed within 30 days The number of complaints received (78) this quarter decreased by 23 complaints, but the complaint closure rate worsened by 9.2% from the last quarter to 78.21%. Triage (Dunstan, Waitaki and Dunedin Hospitals’ Emergency Departments) The total number of patients attending the three Otago DHB Emergency Departments in the December quarter (3948) was a lower than the September quarter (4253). However, more patients were seen within the triage times, meaning that the DHB met the benchmarks for triage codes 1 and 2 (the more serious codes) but not for code 3. Since the December 2001 quarter, the DHB has met the benchmark for code 1 every quarter, the benchmark for code 2 every quarter except for the September 2004 quarter, but has never met the benchmark for code 3.
% meeting triage time for the quarter
Triage Code
Benchmark%
December 2004
September 2004
1 100 100.00 100.00 2 80 81.07 79.86 3 75 54.82 47.06
Hospital Acquired Blood Stream Infections Over the last three years, the average number of infections for Otago (a tertiary DHB) was 18. The range in the Hospital Acquired Blood Stream Infections rate over the last three years was 1.5-3.61% (compared with the range in the rate for the last three years of all tertiary DHBs combined 3.65–5.06%). The table below shows the numbers of infections and the rates for the last four quarters.
December 04 September 04 June 04 Mar 04 Otago number rate number rate number rate number rate
Hospital acquired blood infections 17 2.70 13 1.95 17 3.27 22 3.61
Process and Efficiency quadrant Resource Utilisation Stable utilisation rate that varies around 99%. Performance to Contract The DHB has over-produced slightly for the last two quarters but the rate is within the acceptable range of 98-102% for the financial year to date. Average Length of Stay The Average Length of Stay rate was stable on 3.06 days. This result was consistent with previous quarters.

Appendix II Otago DHB
Page 91
Significance/significantly refers to statistical significance—see Appendix II
Daycase Surgery The Daycase Surgery rate for the December quarter was 71.70%. This was up by 3.6% from the December 2003 quarter. Financial quadrant Operating Margin Very low ratios that both experienced 50% drops from the September quarter’s results (see table below), but were very similar to the ratios recorded for the December 2003 quarter.
Otago Dec 04 Sep 04 Jun 04 Mar 04 Dec 03 Sep 03 Jun 03 Mar 03 Operating Margin/Assets
1.56 3.37 1.00 -0.02 1.61 3.99 -3.78 -1.34
Operating Margin/Revenue 0.60 1.34 0.44 -0.01 0.59 1.74 -1.67 -0.55
Asset Utilisation Slightly up on the September quarter (see table below).
Otago Dec 04 Sep 04 Jun 04 Mar 04 Dec 03 Sep 03 Jun 03 Mar 03 Asset utilisation 2.59 2.52 2.27 2.35 2.72 2.29 2.27 2.43
Debt ratio Relatively consistent, and the last four quarters’ average is 54%. Result The hospitals recorded a $2.9M deficit for the financial year to date up until December 31.

Appendix II Otago DHB
Page 92
Significance/significantly refers to statistical significance—see Appendix II
SOUTHLAND DHB HOSPITALS (Southland Hospital and Lakes District Hospital)
Organisational Health quadrant Voluntary Staff Turnover Voluntary Staff Turnover has increased 7.3% in the last quarter from 2.81 to 3.01. Staff Stability While the Staff Stability rate increased when compared to the previous quarter it has decreased by 39.7% from the December 2003 quarter and was 32.14 for the quarter. Staff Sick Leave Sick Leave for the December quarter was 2.87. While this was down 25.8% from the previous quarter it was up 14.4% from the December 2003 quarter. Southland Dec 04 Sep 04 Jun 04 Mar 04 Sick leave 2.87 3.86 3.47 2.49 Staff Work-related Injury or Illness The Staff Work-related Injury or Illness rate was up from both the previous quarter (168.0%) and the December 2003 quarter (165.1%). Note that the actual number of injuries for the quarter was seven. Southland Dec 04 Sep 04 Jun 04 Mar 04 Number of Injuries/illnesses
7 3 6 4
Quality and Patient Satisfaction quadrant Patient Satisfaction DHBs are expected to receive enough responses to the patient satisfaction questionnaire to give a 95% confidence level that the questionnaires returned give an accurate picture of all the patients seen by the DHB in that quarter. Southland’s confidence level for this quarter was 82% for inpatients and 85% for outpatients. The overall satisfaction rate for the quarter was 85.8%, a significant worsening on the September quarter’s satisfaction rating (88.69%). The DHB achieved satisfaction ratings above 84% for all individual inpatient questions except for the questions “Please rate how much you liked the food we gave you” (74.1%), “Please rate our Emergency Department staff on: keeping you informed about how long you could expect to wait” (74.5%) and “Please rate how clean your ward/unit was” (79.7%).

Appendix II Otago DHB
Page 93
Significance/significantly refers to statistical significance—see Appendix II
The responses for the outpatient questionnaires were all above 78% except for the question “Please rate our staff on telling you how long you would wait, when you arrived” (69.4%). Complaints Closed within 30 days The number of complaints received (29) this quarter is the same, but the complaint closure rate improved by 23.5% from the last quarter to 72.41. Triage (Southland and Lakes District Hospitals Emergency Departments) The total number of patients attending the Southland and Lakes District Hospitals Emergency Departments in the December quarter (2097) was a little lower than the September quarter (2281). However, there were lower percentages of patients seen within the triage times and the benchmarks for categories 2 and 3 were again not met. Since the December 2001 quarter, March 2003 was the only quarter that the DHB has been able to meet all triage benchmarks.
% meeting triage time for the quarter
Triage Code
Benchmark%
December 2004
September 2004
1 100 100.00 100.00 2 80 68.12 75.88 3 75 60.20 65.41
Hospital Acquired Blood Stream Infections Over the last three years the average number of infections for Southland was 5 and the range in the Hospital Acquired Blood Stream Infections rate was 0-3.15% (compared with the combined average for secondary DHBs of 0.85-1.57%). The table below shows the rates and actual infection numbers for the last four quarters.
December 04 September 04 June 04 Mar 04 Southland number rate number rate number rate number rate
Hospital acquired blood infections 5 2.07 0 0 5 1.51 5 2.00
Process and Efficiency quadrant Resource Utilisation Utilisation rate for the first six months of this financial year was on par with the rate for the whole 2003/04 year, but slightly down on the year to date. Performance to Contract The Performance to Contract rate changed little from the September quarter and was within the acceptable range of 98-102%. Average Length of Stay The Average Length of Stay rate was trending in a favourable direction on 2.98 days for the quarter.

Appendix II Otago DHB
Page 94
Significance/significantly refers to statistical significance—see Appendix II
Daycase Surgery The Daycase Surgery rate has trended upwards (improving) since the December 2003 quarter and at 78.97 was 18.5% higher than the same time the previous year. Financial quadrant Operating Margins The Operating Margin to Revenue is down on the September 04 quarter, but up by 104% on the December 2003 quarter. Operating Margin to Assets followed the same trends.
Asset Utilisation Trending down, this is possibly explained (and the other ratios with the Net Funds Employed component) by Southland’s sharp decrease which is disproportionate to the average rate for all DHBs as shown in Figure 35.
Southland Dec 04 Sep 04 Jun 04 Mar 04 Dec 03 Sep 03 Jun 03 Mar 03 Asset utilisation 0.87 0.90 0.99 1.23 1.44 1.90 1.85 2.17
Debt Ratio The ratio was over 60% but trending down and was within the 65% limit for the last four quarters Result The hospitals recorded a deficit of $1.8M for the financial year to date to December 31.
-3,000,000
-2,500,000
-2,000,000
-1,500,000
-1,000,000
-500,000
0
Dec-01
Mar-02
Jun-02
Sep-02
Dec-02
Mar-03
Jun-03
Sep-03
Dec-03
Mar-04
Jun-04
Sep-04
Dec-04
$000
-120,000
-100,000
-80,000
-60,000
-40,000
-20,000
0
All DHBs (P Axis)
Southland (S Axis)
Figure 35. Net funds employed—Southland and all DHBs
Southland Dec 04 Sep 04 Jun 04 Mar 04 Dec 03 Sep 03 Jun 03 Mar 03 Operating Margin/Assets
4.05 5.82 4.52 3.77 3.28 2.87 -11.33 -10.56
Operating Margin/Revenue 4.64 6.45 4.58 3.07 2.27 1.51 -6.13 -4.87
Appendix II Indicator notes and glossary
Page 95
APPENDIX II: INDICATOR NOTES AND GLOSSARY Asset utilisation: See Revenue to Assets. Debt: “Debt” means short- and long-term debt, finance leases, and overdrafts. Graphs: In the graphs the “All DHBs” figures are, in every case, actual reported data (unsmoothed). For the data for individuals DHBs four-period moving average figures are used where the number of observations (as with Staff Work-related Injuries or Illnesses and Hospital Acquired Blood Stream Infections, but excluding Triage) is small. In such cases, there are no plots for the first three periods. For all other cases (Indicator descriptions that do not use four-period moving average data), actual data is used, and there are plots in all periods unless DHBs have not provided data for the period. (See also P axis and S axis.) Operating Margin to Assets: “Operating Margins” is Net Result before interest, tax and capital charge. For this indicator, year-to-date figures are annualised. The value of Assets (Net Funds Employed—NFE) is calculated as the sum of Debt (as defined above) plus shareholders’ funds. Operating Margin to Revenue: Operating Margins is not annualised in this indicator, unlike in the Operating Margins to Assets indicator, but is otherwise identical. P axis: Primary Axis—Indicates that the scale for the series is shown on the left y axis. (see also Graphs and S axis.) Revenue to Assets: Revenue is exclusive of interest and dividend income, donations and bequests. This indicator is referred to as ‘asset utilisation’.
®: Symbol that indicates the measure is a standard Hospital Benchmark Information indicator. S axis: Secondary Axis—Indicates that the scale for the series is shown on the right y axis. Used when a graph plots two or more series that have differences in scales. (see also Graphs and P axis.) Sector: In this document, ‘sector’ means DHBs. Significance: The terms “significantly” and “significant” as used throughout this report—including the Figures—refer to statistical significance. With the exceptions noted below, differences between DHBs are considered significant when they are more than one standard deviation more or less than the mean. For trend data, changes between periods are considered significant if the Student's t-Test probability indicates at the 95% level that the populations of results, in the two periods of comparison, are likely to be different. See also # above.

Appendix II Indicator notes and glossary
Page 96
Significance exceptions: In the case of some indicators, with effect from the September 2004 quarter Hospital Benchmark Information Report, significance analysis is not determined by standard deviation analysis alone. For Indicator descriptions set out below, the significance analysis departs from the standard deviation analysis in the following ways: • Patient Satisfaction. An unfavourable “significance” rating occurs if a rate
is less than 80%. • Triage. Favourable “significance” ratings occur at 100% for Triage 1, 80%
for Triage 2, and 75% for Triage 3. • Hospital Acquired Blood Stream Infections. Significance ratings are
calculated only on changes between periods. • Debt. An unfavourable “significance” rating occurs if a ratio is greater than
60%. There are no favourable “significance” ratings for this indicator. Significant changes between periods: Note that, because significance is assessed in relation to the results for all other DHBs, it is possible for a DHB to have a significantly favourable change to occur in an adverse direction eg, if all DHBs record adverse movements for a particular indicator the DHB with the smallest change would possible receive a rating indicating a significantly favourable change (»).

Page 97
DHB staff can find a complete set of definitions for Hospital Benchmark Information reporting and the complete set of patient satisfaction data on the DHB Forum website at: http://www2.moh.govt.nz/QuickPlace/dhbest/Main.nsf (The required username and password are supplied to relevant DHB staff by
staff at the Ministry of Health who are responsible for Hospital Benchmark Information reporting.)