dhanya et al., (2019) carbonation and its effect on
TRANSCRIPT

See discussions, stats, and author profiles for this publication at: https://www.researchgate.net/publication/334959365
Dhanya et al., (2019) Carbonation and its effect on microstructure of concrete
with flyash and ggbfs
Article · April 2019
CITATIONS
0READS
332
5 authors, including:
Some of the authors of this publication are also working on these related projects:
LC3 - Limestone Calcined Clay Cement View project
Marine Concrete Structures View project
B S Dhanya
Rajiv Gandhi Institute of Technology, Kottayam
16 PUBLICATIONS 39 CITATIONS
SEE PROFILE
Sundar Rathinarajan
Indian Institute of Technology Madras
16 PUBLICATIONS 69 CITATIONS
SEE PROFILE
Manu Santhanam
Indian Institute of Technology Madras
221 PUBLICATIONS 3,742 CITATIONS
SEE PROFILE
Radhakrishna Pillai
Indian Institute of Technology Madras
145 PUBLICATIONS 742 CITATIONS
SEE PROFILE
All content following this page was uploaded by Radhakrishna Pillai on 14 April 2020.
The user has requested enhancement of the downloaded file.
1
TECHNICAL PAPER
The IndIan ConCreTe Journal | aprIl 2019
B. S. DHANYA, SuNDAr rATHNArAJAN, MANu SANTHANAM, rADHAkriSHNA G. PiLLAi, AND rAviNDrA GETTu
Carbonation and its effeCt on miCrostruCture of ConCrete with fly ash and ground granulated blast furnaCe slag
Carbonation induced corrosion of the embedded steel reinforcement is a major deterioration mechanism of reinforced concrete structures, mainly in inland / highway environments of tropical countries. Carbonation leads to uniform reduction in the cross sectional area of steel reinforcement. In general, Supplementary Cementitious Materials (SCMs) can increase durability of concrete. The current study evaluates the influence of three SCMs such as Ground Granulated Blast Furnace Slag (Slag), Class F fly ash and Class C fly ash on the carbonation of concrete, assessed by both macroscopic and micro-analytical investigations. The macroscopic behaviour of concrete was assessed using accelerated carbonation and natural carbonation tests. The micro-analytical studies were conducted to understand the alteration in the micro structure of concrete with SCMs under carbonation exposure. These tests include Scanning Electron Microscopy (SEM), X – Ray Diffraction (XRD) and Thermo Gravimetric / Differential Scanning Calorimetry (TG/DSC). The results showed that depth of carbonation is more for concretes with SCMs. However, at lower replacement levels, the difference as compared to OPC is not much significant in the case of Slag and Class C fly ash. A relationship between natural carbonation and accelerated carbonation depth was proposed based on CO2 concentration and climatic influence (tropical regions). The microstructural modifications of the paste matrix due to carbonation are explained in terms of calcite formation, decalcification of CSH and change in porosity level.
Keywords: Concrete, Micro-analytical studies, Natural and accelerated carbonation, Supplementary cementitious materials.
1. INTRODUCTIONCorrosion of embedded steel reinforcement is a principal deterioration mechanism in reinforced concrete structures. This
can impart a huge burden on the economy because most of the world’s infrastructure is made of reinforced concrete. The major causes that lead to corrosion are chloride ingress and carbonation. Carbonation induced corrosion is a major form of deterioration in inland environments, particularly in industrially polluted areas and near to highways that have higher levels of CO2. This can lead to uniform reduction in cross sectional area of steel reinforcement, as opposed to the pitting type of corrosion that occurs with chlorides.
Mechanism of CarbonationThe reactions that occur in the process of carbonation are summarized below[1]. Gaseous CO2 cannot react with cement hydrates. CO2 gas get dissolved in the pore water, causing the formation of bicarbonates. Due to the high pH of pore solution, these bicarbonates get dissociated and form carbonate ions. The carbonate ions react with Ca 2+ ions (from the pore solution and/or from Ca(OH)2 dissolution), forming CaCO3. As the Ca2+ ion concentration in the pore solution decreases, initially the dissolution of Ca(OH)2 occurs. When Ca(OH)2 gets fully consumed and the pH of the pore solution drops, more Ca2+ ions get released from the CSH and from the other Ca bearing phases. The dissolution changes the Ca/Si of the CSH. When the pH is around 10, the CSH gets converted to a silica gel. Due to carbonation, most of the Ca present in the CSH gets converted to CaCO3 and very little remains in the silica gel.
The chemical equations involved in carbonation process are given below, as per [Lagerblad, 2005]
CO2 (g) + H2O → HCO-3 + H + (1)
HCO-3 → CO2-
3 + H + (2)
Ca2++ CO2-3 → CaCO3 (3)

2
TECHNICAL PAPER
The IndIan ConCreTe Journal | aprIl 2019
Generally, three polymorphs of CaCO3 are formed due to carbonation reaction. They are calcite, aragonite and vaterite. Calcium hydroxide gets converted to calcite, and this reaction leads to a volume expansion. The reaction between CSH having low Ca/Si ratio and CO2 results in the formation of vaterite and aragonite[2]. Vaterite and aragonite are the metastable phases which eventually get converted to calcite. This conversion leads to volume reduction. As volume reduction happens, porosity increases, causing more ingress of CO2 and increasing the rate of the carbonation reaction. Further, the densities of CH, calcite, aragonite and vaterite are 2.21, 2.71, 2.93 and 2.54 g/cm3 respectively [3]. Thus, formation of more dense products like aragonite can lead to reduction in the volume occupied, and thus cause an increase in porosity [4].
The diffusivity of CO2 depends on the pore structure of concrete and the atmospheric conditions such as CO2 concentration, relative humidity (RH), temperature etc.[5]. Carbonation reaction is maximum when the RH is between 40 to 80%. This is because at low RH, the diffusion of CO2 into concrete is high but there is not enough moisture for carbonation reaction to occur. When the RH is high, the gaseous diffusion of CO2 becomes difficult, which in effect reduces the carbonation rate [1, 6-7]. Carbonation reaction can lead to some variation in properties of concrete such as decrease in permeability, increase in compressive strength, modification of the pore structure due to decrease in porosity and pore size, increase in pore tortuosity etc. These changes take place due to the deposition of the reaction product (CaCO3) in the pores. Thus, the effect of carbonation is beneficial in the case of plain concrete. On the other hand, carbonation leads to decrease in pH and thus can lead to corrosion of steel in reinforced concrete structures.
Carbonation and Supplementary Cementitious MaterialsSupplementary Cementitious Materials (SCMs) or mineral admixtures are well known for their capability to enhance concrete durability in general [8]. However, controversies exist regarding the effect of SCMs on carbonation [9]. Most of the literature indicates that SCM concretes are subjected to higher carbonation than OPC concrete. Concretes with 70% and 80% ground granulated blast furnace slag (referred hereafter just as ‘slag’) were reported to be carbonated more than OPC concretes whereas the carbonation resistance of 50% slag concretes was similar to OPC concretes [10]. Among the carbonation behaviour of concretes with 50% and 65% slag replacement, CO2 penetration was higher for 65% replacement mixtures [11]. Carbonation of concretes having fly ash up to 30% was marginally higher than OPC, whereas the difference was much higher when the replacement level was 50% [12]. Concretes with higher the replacement of low fineness mineral admixtures, the greater is the carbonation front [9]. When silica fume, a higher fineness mineral admixture was used at 5% and 10%
replacement levels, carbonation rate of that concretes were lower than that of OPC concretes [9]. This paper evaluates the influence of three SCMs such as ground granulated blast furnace slag (slag), Class F fly ash and Class C fly ash on the carbonation of concrete, assessed by both macroscopic and micro-analytical investigations.
2. EXPERIMENTAL PROGRAMThe current experimental program has two parts. In the first part, the macroscopic behaviour of concretes having three different SCMs in carbonation was assessed using accelerated and natural carbonation test. In the second part of the study, micro-analytical studies were conducted to understand the alterations in the structure of concrete with SCMs in accelerated carbonation test. The micro-analytical tests conducted include Scanning Electron Microscopy (SEM), X – Ray Diffraction (XRD) and Thermo Gravimetric/ Differential Scanning Calorimetry (TG/DSC).
For both categories of tests, the SCMs were used as a partial replacement to 53 grade Ordinary Portland Cement. The SCMs studied include ground granulated blast furnace slag (Slag), Class F fly ash and Class C fly ash. The replacement levels for slag and Class F fly ash were 15, 30 and 50%. For Class C fly ash, 15 and 30% replacement levels were adopted. The replacements adopted were done on mass basis. The details of oxide composition of the materials used are provided in Table 1.
Table 1: Oxide composition of the materials usedoxide Composition
opC (%) slag (%)
Class f fly ash
(%)
Class C fly ash
(%)
Al2O3 4.7 21.1 29.9 31.5
CaO 65.1 31.5 1.3 13.8
Fe2O3 3.9 1.9 4.3 6.2
K2O 0.5 0.9 1.4 0.1
MgO 1.2 8.6 0.6 2.3
Na2O 0.5 0.4 0.2 0.6
SiO2 19.4 33.8 59.3 39.9
SO3 Not available
Not available
0.2 3.2
Thus, a total of 9 concretes were studied, which includes a concrete without any SCM. All the concretes had a total binder content of 310 kg/m3 and a water binder ratio of 0.5. The coarse aggregate (20 mm NMSA, crushed granite) to fine aggregate (river sand) ratio adopted in the mix design was 60:40. The concrete mixture proportion details and their compressive strength values at 28 days and 90 days along with standard deviation (SD) are reported in Table 2. It must be noted here that the binder content and w/b chosen for the study are intended to
3
TECHNICAL PAPER
The IndIan ConCreTe Journal | aprIl 2019
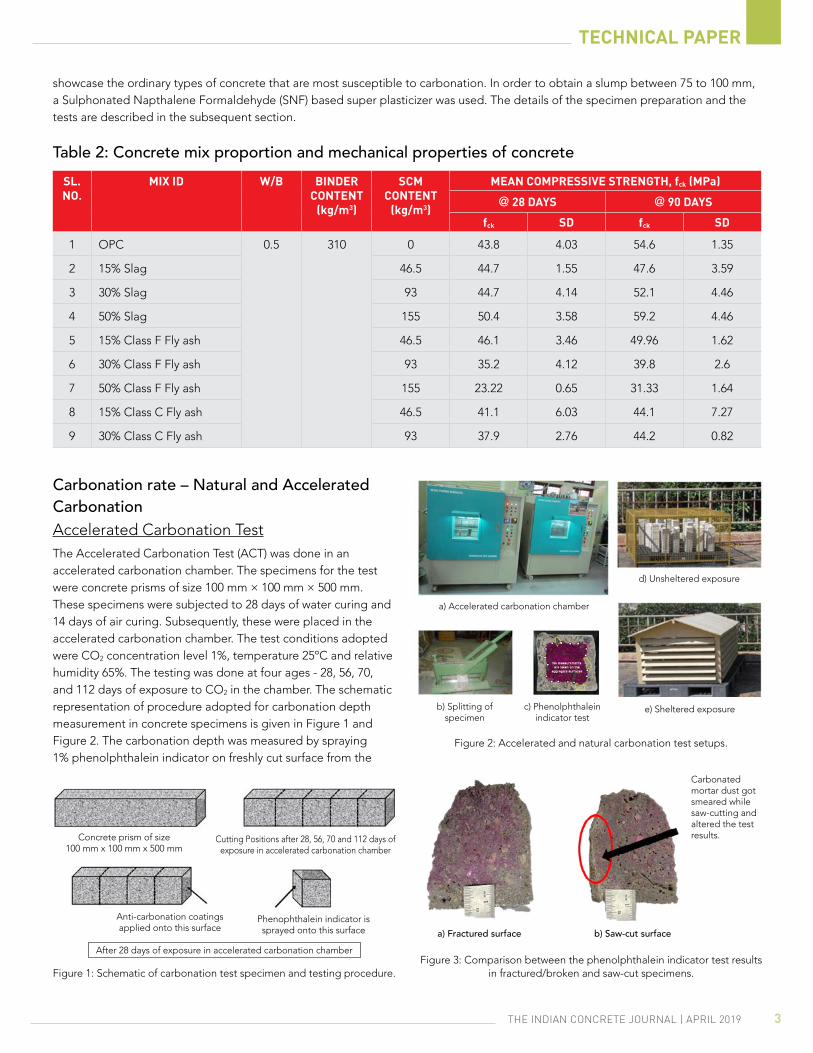
Carbonation rate – Natural and Accelerated CarbonationAccelerated Carbonation TestThe Accelerated Carbonation Test (ACT) was done in an accelerated carbonation chamber. The specimens for the test were concrete prisms of size 100 mm × 100 mm × 500 mm. These specimens were subjected to 28 days of water curing and 14 days of air curing. Subsequently, these were placed in the accelerated carbonation chamber. The test conditions adopted were CO2 concentration level 1%, temperature 25ºC and relative humidity 65%. The testing was done at four ages - 28, 56, 70, and 112 days of exposure to CO2 in the chamber. The schematic representation of procedure adopted for carbonation depth measurement in concrete specimens is given in Figure 1 and Figure 2. The carbonation depth was measured by spraying 1% phenolphthalein indicator on freshly cut surface from the
showcase the ordinary types of concrete that are most susceptible to carbonation. In order to obtain a slump between 75 to 100 mm, a Sulphonated Napthalene Formaldehyde (SNF) based super plasticizer was used. The details of the specimen preparation and the tests are described in the subsequent section.
Table 2: Concrete mix proportion and mechanical properties of concretesl. no.
mix id w/b binder Content
(kg/m3)
sCm Content
(kg/m3)
mean Compressive strength, fck (mpa)
@ 28 days @ 90 days
fck sd fck sd
1 OPC 0.5 310 0 43.8 4.03 54.6 1.35
2 15% Slag 46.5 44.7 1.55 47.6 3.59
3 30% Slag 93 44.7 4.14 52.1 4.46
4 50% Slag 155 50.4 3.58 59.2 4.46
5 15% Class F Fly ash 46.5 46.1 3.46 49.96 1.62
6 30% Class F Fly ash 93 35.2 4.12 39.8 2.6
7 50% Class F Fly ash 155 23.22 0.65 31.33 1.64
8 15% Class C Fly ash 46.5 41.1 6.03 44.1 7.27
9 30% Class C Fly ash 93 37.9 2.76 44.2 0.82
Figure 1: Schematic of carbonation test specimen and testing procedure.
Concrete prism of size 100 mm x 100 mm x 500 mm
Anti-carbonation coatings applied onto this surface
Phenophthalein indicator is sprayed onto this surface
After 28 days of exposure in accelerated carbonation chamber
Cutting Positions after 28, 56, 70 and 112 days of exposure in accelerated carbonation chamber
a) Accelerated carbonation chamber
d) Unsheltered exposure
b) Splitting of specimen
e) Sheltered exposurec) Phenolphthalein indicator test
Figure 2: Accelerated and natural carbonation test setups.
a) Fractured surface b) Saw-cut surface
Carbonated mortar dust got smeared while saw-cutting and altered the test results.
Figure 3: Comparison between the phenolphthalein indicator test results in fractured/broken and saw-cut specimens.
4
TECHNICAL PAPER
The IndIan ConCreTe Journal | aprIl 2019
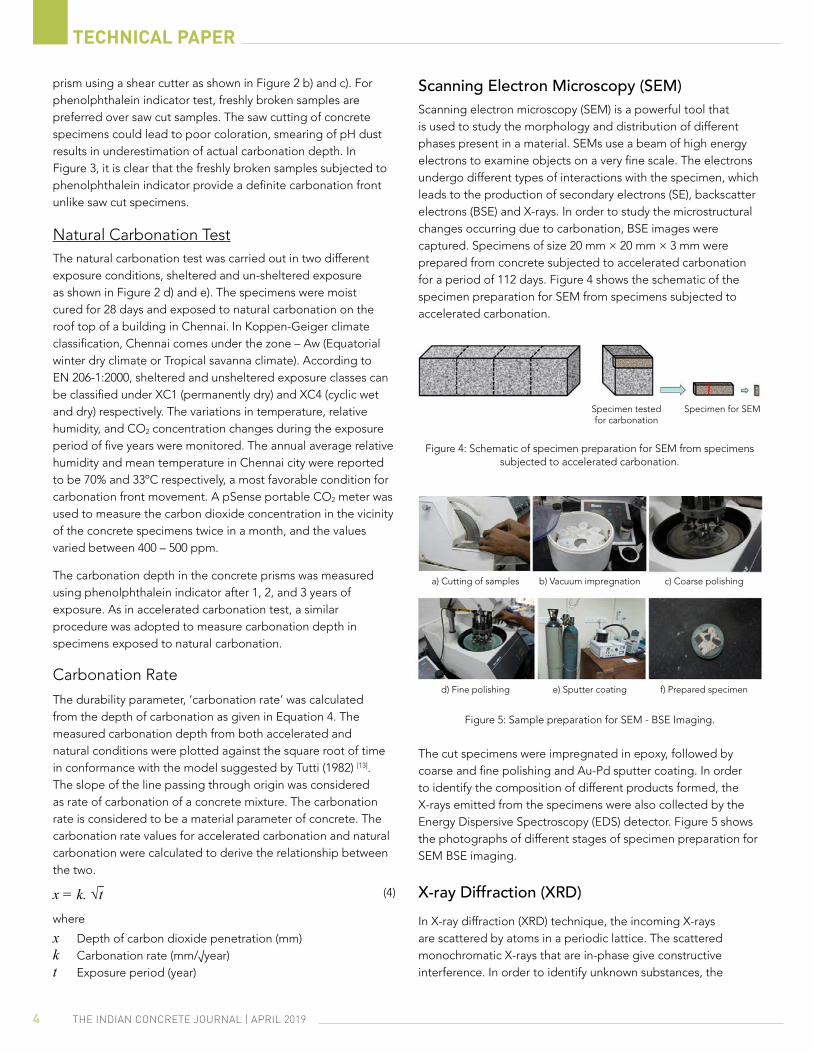
Scanning Electron Microscopy (SEM)Scanning electron microscopy (SEM) is a powerful tool that is used to study the morphology and distribution of different phases present in a material. SEMs use a beam of high energy electrons to examine objects on a very fine scale. The electrons undergo different types of interactions with the specimen, which leads to the production of secondary electrons (SE), backscatter electrons (BSE) and X-rays. In order to study the microstructural changes occurring due to carbonation, BSE images were captured. Specimens of size 20 mm × 20 mm × 3 mm were prepared from concrete subjected to accelerated carbonation for a period of 112 days. Figure 4 shows the schematic of the specimen preparation for SEM from specimens subjected to accelerated carbonation.
Figure 4: Schematic of specimen preparation for SEM from specimens subjected to accelerated carbonation.
Figure 5: Sample preparation for SEM - BSE Imaging.
The cut specimens were impregnated in epoxy, followed by coarse and fine polishing and Au-Pd sputter coating. In order to identify the composition of different products formed, the X-rays emitted from the specimens were also collected by the Energy Dispersive Spectroscopy (EDS) detector. Figure 5 shows the photographs of different stages of specimen preparation for SEM BSE imaging.
X-ray Diffraction (XRD)In X-ray diffraction (XRD) technique, the incoming X-rays are scattered by atoms in a periodic lattice. The scattered monochromatic X-rays that are in-phase give constructive interference. In order to identify unknown substances, the
prism using a shear cutter as shown in Figure 2 b) and c). For phenolphthalein indicator test, freshly broken samples are preferred over saw cut samples. The saw cutting of concrete specimens could lead to poor coloration, smearing of pH dust results in underestimation of actual carbonation depth. In Figure 3, it is clear that the freshly broken samples subjected to phenolphthalein indicator provide a definite carbonation front unlike saw cut specimens.
Natural Carbonation TestThe natural carbonation test was carried out in two different exposure conditions, sheltered and un-sheltered exposure as shown in Figure 2 d) and e). The specimens were moist cured for 28 days and exposed to natural carbonation on the roof top of a building in Chennai. In Koppen-Geiger climate classification, Chennai comes under the zone – Aw (Equatorial winter dry climate or Tropical savanna climate). According to EN 206-1:2000, sheltered and unsheltered exposure classes can be classified under XC1 (permanently dry) and XC4 (cyclic wet and dry) respectively. The variations in temperature, relative humidity, and CO2 concentration changes during the exposure period of five years were monitored. The annual average relative humidity and mean temperature in Chennai city were reported to be 70% and 33ºC respectively, a most favorable condition for carbonation front movement. A pSense portable CO2 meter was used to measure the carbon dioxide concentration in the vicinity of the concrete specimens twice in a month, and the values varied between 400 – 500 ppm.
The carbonation depth in the concrete prisms was measured using phenolphthalein indicator after 1, 2, and 3 years of exposure. As in accelerated carbonation test, a similar procedure was adopted to measure carbonation depth in specimens exposed to natural carbonation.
Carbonation Rate
The durability parameter, ‘carbonation rate’ was calculated from the depth of carbonation as given in Equation 4. The measured carbonation depth from both accelerated and natural conditions were plotted against the square root of time in conformance with the model suggested by Tutti (1982) [13]. The slope of the line passing through origin was considered as rate of carbonation of a concrete mixture. The carbonation rate is considered to be a material parameter of concrete. The carbonation rate values for accelerated carbonation and natural carbonation were calculated to derive the relationship between the two.
x = k. √-t (4)
where
x Depth of carbon dioxide penetration (mm)k Carbonation rate (mm/√year)t Exposure period (year)
Specimen tested for carbonation
Specimen for SEM
a) Cutting of samples b) Vacuum impregnation c) Coarse polishing
d) Fine polishing e) Sputter coating f) Prepared specimen

5
TECHNICAL PAPER
The IndIan ConCreTe Journal | aprIl 2019
powder diffraction pattern is recorded with the help of a diffractometer and is compared with the standard patterns of JCPDS database [14].
In the present program, XRD was conducted in order to study the chemical and phase changes due to carbonation. For this purpose, powder samples which were completely carbonated were prepared from paste specimens of 9 mm diameter and 30 mm height following the procedure described below. After 28 days of curing under saturated Ca(OH)2 solution, the specimens were air dried for 14 days at 25ºC and 65% RH. Then, these were introduced into the carbonation chamber maintained at 3% CO2 concentration, 25ºC and 65% RH. The weights of specimens were monitored regularly. A set of four samples were tested in each category. After reaching constant weights, complete carbonation was ensured by phenolphthalein test on the split surface of one specimen. The three other specimens were stored for a week inside acetone to remove any water and to stop hydration. Subsequently, these were dried, crushed and sieved through 75 µm sieve and were stored in polythene bags inside a desiccator until testing. These powdered samples were subjected to XRD to analyze crystalline phases that are formed due to carbonation. Figure 6 shows the paste specimens of 9 mm diameter and 30 mm height that were used to study the chemical and phase changes due to carbonation.
Figure 6: Paste specimens to study chemical and phase changes due to carbonation.
Thermo-gravimetric AnalysisThe thermal analysis performed in this study using a TG/DSC instrument. In TGA, the amount and rate of change in the mass of a sample is measured as a function of temperature or time in a controlled atmosphere. This technique can be used to study materials that show either mass loss or gain due to decomposition, oxidation/reduction or loss of volatiles such as moisture.
In order to study the degree of carbonation, thermal analysis was conducted from 30ºC to 1000ºC, at a heat rate of 10ºC per minute on the powdered sample, which was prepared following the procedure described in the previous section.
3. RESULTS AND DISCUSSIONCarbonation Depth MeasurementFigure 7 shows the influence of SCMs on depth of carbonation for concretes under various exposure conditions. From Figure 7 a), it can be seen that the depth of carbonation is more for concretes with SCMs compared to that of OPC concretes. Fly ash concretes show greater depth of carbonation, whereas slag concretes show relatively less depth of penetration at lower replacement level. As the replacement level increases, the depth of carbonation increases. At lower replacement levels (15-30%), the difference compared to OPC is not much significant even at 112 days of exposure for slag and Class C fly ash. Similar conclusions on the performance of fly ash concretes at lower replacement level (15%) were reported by Alonso and Bujak (2013), who concluded that if the replacement level is low, the service life in terms of carbonation induced corrosion can be guaranteed with fly ash [15].
Figure 7 b) and c) present the carbonation depth measured after exposing concrete specimens for three years in Chennai outdoor environment (Unsheltered and sheltered exposure). From the results, it is clear that for the concrete mixtures with same binder content and w/b ratio, there is an increase in carbonation depth
a) Accelerated - 1% CO2 b) Natural 0.03% CO2 - Unsheltered c) Natural 0.03% CO2 - Sheltered
Carbonation depth @ 112 days (mm) Carbonation depth @ 3 years (mm)
0 5 10 15 20 0 5 10 15 20 0 5 10 15 20
OPC15% Slag30% Slag50% Slag
15% Class F Fly Ash30% Class F Fly Ash50% Class F Fly Ash15% Class C Fly Ash30% Class C Fly Ash
Figure 7: Influence of partial substitution of SCMs on carbonation depth in natural and accelerated exposure conditions.

6
TECHNICAL PAPER
The IndIan ConCreTe Journal | aprIl 2019
with respect to the level of replacement. Natural carbonation results showed a similar trend of increase in carbonation depth with an increase in SCM replacement level. The reasons for the faster progress of carbonation front in the natural conditions could be attributed to the reduction in CO2 buffer capacity per unit volume of cement paste at higher SCM replacement levels [16]. The carbonation depth values of sheltered exposure were found to be higher than unsheltered. The reduction in the rate of carbonation in unsheltered specimens could be attributed to the alternate wetting and drying of the surface of concrete specimens due to periodic precipitation. Moisture saturation in the pores of the sheltered concrete specimens is highly unlikely, as they were sheltered inside the Stevenson screen chamber. The following passage explores the reasons suggested by various researchers for this behaviour.
Actions of SCMs in concrete during carbonation are of two kinds. First, the carbonation reaction leads to the consumption of Ca(OH)2, which can reduce the pH of concrete, leading to increased rate of carbonation. Second, due to pozzolanic and / or hydraulic reaction, new CSH is formed which reduces capillary porosity and decreases carbonation [9, 17]. The initial reaction between CO2 and Ca(OH)2 lowers the pH of the pore solution [15]. In order to maintain pH, portlandite dissolves first until it is fully consumed. The decalcification of CSH and other Ca bearing phases happens next [18]. The chemical reactions lead to a drop in pH at the steel / concrete interface, resulting in the dissociation of passive layer and initiation of corrosion. In concretes with SCMs, there is a reduction in Ca(OH)2 level occurs due to pozzolanic reaction, which accelerates CSH carbonation [19]. As the addition level of SCMs increases, more CSH with low Ca/Si is formed, which accelerates the carbonation reaction [20]. Further, there is an effect of micro-cracking caused due to the deposition of CaCO3 in the pore system. The micro-cracking might be due to volume expansion or due to thermal stresses developed during the carbonation reaction [5]. Lo and Lee (2002) put forward another argument on the increased carbonation with increased SCM dosage. According to them, as the SCM replacement level increases, there is an increase in the water cement ratio, which can increase the capillary porosity, which in turn increases the carbonation rate [21]. However, this would imply a lack of any contribution from the SCMs.
It is concluded from literature review that the poor performance of concretes with SCM in carbonation may be attributed to consumption of Ca(OH)2 in the pozzolanic reaction, which can lead to decalcification and subsequent carbonation of CSH. Due to the carbonation of CSH, there is an increase in the larger pores along with decrease in smaller pores [22]. This coarsening of pores in concretes with SCMs can accelerate further the progress of the carbonation front. Hence, micro analytical investigations were planned with the objective of understanding the structural alteration of concrete after the accelerated carbonation test.
Relation between Natural and Accelerated CarbonationThe carbonation rate of the specimens were calculated from natural and accelerated carbonation data collected, using Tutti’s square root law function. The relationship between the accelerated carbonation and natural carbonation (sheltered and unsheltered exposure) are presented in Figure 8 a) and b). There were various attempts by different authors to propose a conversion factor to predict the natural carbonation coefficient from accelerated carbonation coefficient [23-25]. The theoretical Kacc/Knat value was proposed by Sisompshon and Franke (2007) based on CO2 concentration as in Equation 5.
Kacc = %CO2,acc= 1.00 = 5.7 5
Knat,temperate %CO2,nat 0.03
Based on the experimental results it is understood that only the CO2 concentration factor may not be sufficient for proposing a relationship between accelerated and natural conditions. The local climatic condition prevailing over the region would also have a major influence on the rate or progress of carbonation. The carbonation depth data collected from buildings in tropical climates are generally higher than that of temperate climates due to higher mean daily temperature and lower precipitation days [26]. Similarly, the accelerated carbonation coefficients calculated using Tutti’s model were reported to be 2 – 2.5 times than that of natural carbonation coefficient in Brazil [27], which has similar climatic condition as in Chennai. So, the relationship based on CO2 concentration must have a climatic factor (Cf ) as in Equation 6 to predict natural carbonation coefficient from accelerated carbonation coefficient with more accuracy. In Figure 8, the conversion factors can be used to obtain natural carbonation coefficient for unsheltered and sheltered exposure from accelerated carbonation coefficient at 1% CO2 concentration are provided. These conversion factors can be valid to obtain natural carbonation coefficients for concretes exposed in Equatorial winter dry conditions from accelerated carbonation coefficient derived from experiments performed with 1% CO2, 25ºC and 65% relative humidity.
Kacc = 5.7 x Cf ≈ 2 6Knat,tropical
These conversion factors will be useful in determining the natural carbonation coefficient based on short-term accelerated carbonation tests. The determination of climatic factor based on long term carbonation depth measurements for different climatic regions based on Koppen-Geiger classification will enable us to develop performance based criteria for carbonation induced corrosion to achieve desired level of service life in structures.

7
TECHNICAL PAPER
The IndIan ConCreTe Journal | aprIl 2019
Scanning Electron MicroscopyMany microstructural changes were observed in the paste matrix due to the carbonation reaction. These changes include formation of calcite, decalcification of CSH and an overall increase in porosity of the system. All the images presented in this section were taken in the Back Scattered Electron mode of the Scanning Electron Microscope on specimens prepared from concretes which were subjected to carbonation for 112 days in the accelerated carbonation chamber at 1% CO2 concentration.
Calcite Formation
Figure 9 depicts the SEM – BSE images of the surface zone of the concrete with different binder combinations such as 100% OPC, 30% slag, 30% Class F fly ash and 30% Class C fly ash respectively.
a) OPC b) OPC + Slag
c) OPC + Class F fly ash d) OPC + Class C fly ash
Figure 9: SEM-BSE images of paste specimens subjected to accelerated carbonation.
Calcite is found to be deposited in the surface regions in all the concretes. The presence of calcite (CaCO3) is confirmed by EDS analysis. Figure 10 shows a typical EDS pattern for a point on the white surface layer which is obtained from concrete having 100% OPC. The EDS analysis confirms that the surface deposit is calcite. A large degree of calcite is formed in the surface regions, almost as a protective layer, as evident from Figure 10. The SEM - BSE images of the surface zone of concrete having 30% and 50% Class F fly ash subjected to carbonation are presented in Figure 11 a) and b) respectively. Figure 11 a) and b) indicate substantial calcite formation in the surface zones. Although the CH content was much lower compared to OPC, the evidence of major calcite deposition points to the possible carbonation of the CSH. The following section explores the EDS analysis of the CSH composition, to assess the extent of decalcification of CSH, which would have led to the formation of the calcite.
Figure 10: SEM - BSE image of concrete with 100% OPC subjected to carbonation.
a) OPC + 30% Class F fly ash b) OPC + 50% Class F fly ash
Figure 11: SEM – BSE images of surface zone of concrete after carbonation a) OPC + 30% Class F fly ash, b) OPC + 50% Class F fly ash.
Figure 8: Relationship between carbonation rates under natural (tropical environment) and accelerated carbonation (1% CO2).

8
TECHNICAL PAPER
The IndIan ConCreTe Journal | aprIl 2019
Decalcification of CSH
Figure 12 presents the SEM – BSE images of the concretes having different binder combinations such as 100% OPC, and OPC + 30% slag subjected to carbonation with the EDS details. The EDS data confirms that decalcification occurred in all the concretes as the atomic percentage of Ca is lower than that of Si. For normal concrete the Ca/Si is expected to be 1.5 to 2.0. It can be seen that the Ca/Si of the CSH in the below two figures are 0.43 and 0.22 respectively. This indicates that decalcification has indeed occurred. The data also indicates that the extent of decalcification is lower for the OPC concrete, possibly because of greater availability of CH.
a) OPC
b) OPC + 30% slag
Figure 12: SEM - BSE images with EDS details – Decalcification of CSH.
Evaluation of Porosity Change
Figure 13 shows the SEM - BSE images of concrete having different binder proportions 100% OPC, 30% slag, 30% Class F fly ash and 30% Class C fly ash respectively subjected to carbonation, at almost the same magnification level (three images at 500x and one image at 600x). Figure 13 e) and f) depict the SEM -BSE images of concrete having 30% and 50% Class F fly ash respectively subjected to carbonation, at a higher magnification level (1200x and 1000x respectively). As evident from Figure 13 a), the overall appearance of the paste matrix indicates that the OPC concrete is having a dense appearance. With regard to Figure 13 b) and c), the slag and Class F fly ash concretes have greater degree of porosity compared to OPC concretes. The CSH has a much darker appearance, which might be due to the greater degree of decalcification occurring in these concretes. Regarding Class C fly ash concrete, the
phase shows lesser porosity than in Class F fly ash. It is clear from Figure 13 c) and d), in comparison with 30% Class F fly ash concrete, the interior porosity of 50% Class F fly ash concrete is significantly higher. The paste has a leached out appearance. This indicates that, as the replacement level with Class F fly ash increases, the porosity increases due to increased decalcification and leaching of paste. The increase in porosity of the systems with supplementary materials may be due to the formation of products that occupy lesser volume than the original phases.
X – Ray Diffraction AnalysisDifferent products formed due to carbonation of pastes having different binder combinations were analyzed using XRD on the powder obtained from fully carbonated paste samples. Figure 14 indicates the XRD pattern of non – carbonated and carbonated paste samples having different binder combinations. Only
a) OPC b) OPC + 30% slag
c) OPC + 30% Class F fly ash d) OPC + 30% Class C fly ash
e) OPC + 30% Class F fly ash f) OPC + 50% Class F fly ash
Figure 13: SEM - BSE Image of concrete after subjected to carbonation – Evaluation of pore structure alteration.

9
TECHNICAL PAPER
The IndIan ConCreTe Journal | aprIl 2019
Thermo Gravimetric AnalysisTG – DSC was conducted on paste samples up to a temperature of 1000°C. A typical output obtained from the experiment (corresponding to OPC as binder) is presented in Figure 15. The decomposition of CaCO3 occurs at a temperature between 530 and 950 °C [29]. The peak temperature, mass change of this reaction for different binders are presented in Table 3. The CaCO3 content is calculated from the mass change as provided in Equation 7.
CaCO3,measured = WLCaCO3 X
mCaCO3 (7)mCO2
Where, CaCO3,measured = CaCO3 content in (%) WLCaCO3 = Weight loss between 530 °C to 900 °C mCaCO3, mCO2 = Molecular masses of CaCO3 and CO2
From Table 3, it can be seen that there is much variation in the decomposition reaction details of different binders. The onset temperature changes with respect to binder type, and the type
concretes with 30% replacement with Slag, Class C fly ash and Class F fly ash were analyzed through XRD. The XRD patterns indicate that all the polymorphs of CaCO3 such as calcite (C), vaterite (V) and aragonite (A) are present as the products of carbonation in the case of paste samples subjected to 100% OPC and having 30% slag as binder. In the case of samples having 30% Class F and Class C fly ash, the polymorphs present are only calcite and vaterite. While calcite appears to be the dominant phase in the OPC pastes, other carbonate phases appear to dominate in the systems having supplementary materials. Further, such formation also supports the theory of carbonation of the CSH phase [28].
a) OPC b) OPC + 30% slag
c) OPC + 30% Class F fly ash d) OPC + 30% Class C fly ash
Figure 14: XRD patterns of carbonated and non-carbonated paste samples.

10
TECHNICAL PAPER
The IndIan ConCreTe Journal | aprIl 2019
of products formed might also be different. For fly ash and slag, CaCO3 may not be formed from Ca(OH)2, but rather due to the carbonation of CSH.
Figure 15: TG-DSC output of fully carbonated cement pastes made with OPC.
Table 3: Details of the decomposition reaction of CaCO3 obtained from pastes having different binder combinations
binder Content peaktemperature
(°C)
peak mass Change
(%)
CaCo3 Content
(%)
OPC 784.5 9.8 22.2
30% Slag 731.1 7.1 16.1
30% Class F fly ash 750.1 7.8 17.7
30% Class C fly ash 763.0 11.0 25.0
CONCLUSIONSIn the present study, the influence of supplementary cementitious materials such as slag, Class F fly ash and Class C fly ash on carbonation resistance of concrete were assessed using accelerated and natural carbonation test. Micro-analytical investigations were carried out using Scanning Electron Microscopy, X – Ray Diffraction and Thermo Gravimetric Analysis to supplement the information obtained in accelerated carbonation test.
The specific conclusions are listed below.
• Resistance against carbonation is less for concretes with SCM, which agrees with most of the available literature. This may be attributed to consumption of Ca(OH)2 in the pozzolanic reaction, which can lead to decalcification and subsequent carbonation of CSH. Due to the carbonation of CSH, dense products are formed, which increase the porosity of the system and accelerate further the progress of the carbonation front.
• Fly ash concretes show greater depth of carbonation, whereas slag concretes show relatively less depth of CO2 penetration. As the replacement level increases, the depth of carbonation increases. At lower replacement levels up to 30%, the difference from OPC is not much significant even at 112 days of exposure for slag and Class C fly ash.
• A relationship was proposed between natural and accelerated carbonation based on CO2 concentration factor and climatic factor. The role of locally prevailing climatic conditions is evident from the results as the factor could vary between different climate zones.
• The modifications of the paste matrix due to carbonation are explained in terms of calcite formation, decalcification of CSH and change in porosity level. The supporting evidences for these were obtained from SEM – BSE images. Results indicate that the porosity is higher for carbonated SCM concretes compared to that of OPC concretes.
• The chemical and phase changes due to carbonation were studied by TGA and XRD. TGA results indicate that there are variations in the carbonate decomposition reaction for different binders. The onset temperature changes with respect to binder type. This suggests that the type of products formed might also be different. For fly ash and slag, CaCO3 may not be formed from Ca(OH)2, but rather due to the carbonation of CSH.
• From the XRD results, it is concluded that in the case of paste samples having 100% OPC and slag, all the three polymorphs of calcium carbonate such as calcite, vaterite and aragonite are formed due to carbonation reaction, and the calcite phase is dominant in the OPC system. However, in the case of paste samples made of Class F and Class C fly ash, only the presence of calcite and vaterite are confirmed by XRD analysis, with vaterite being more dominant.
Even though the effect of SCMs is reported to be detrimental in the case of carbonation, it is important to see its effect on corrosion, both in the initiation and in propagation phases. Even if the time of initiation is reduced, there can be an increase in the duration of the propagation phase. This is because, due to carbonation, the microstructure gets modified owing to the deposition of CaCO3 in the pores, leading to reduced pore diameter, and pore volume, and increased pore tortuosity. These changes can lead to increased resistivity of concrete, which is a major factor determining the propagation of corrosion.
ACKNOWLEDGMENTSThe authors thank the Science and Engineering Research Council (SERC), Department of Science and Technology (DST), Govt. of India for supporting this work (Project No. SR/S3/MERC-0067/2011). Financial support from the Lafarge Research

11
TECHNICAL PAPER
The IndIan ConCreTe Journal | aprIl 2019
Center, France is also appreciated. The authors are grateful to the faculty, technical staff and fellow students in the Building Technology and Construction Management (BTCM) Division, Department of Civil Engineering, IIT Madras, Chennai, India for their assistance in various capacities.
REFERENCES1. Lagerblad, B., Carbon dioxide uptake during concrete life
cycle – State of the art, Swedish Cement and Concrete Research Institute, CBI , Nordic Innovation Centre, Norway, 2005.
2. Black L., Breen C., Yarwood J., Garbev K., Stemmermann P., Gasharova., B., Structural features of C-S-H(I) and its carbonation in air – A Raman spectroscopic study. Part II: Carbonated phases, Journal of American Ceramic Society, 2007, Vol. 90(3), pp.908-917.
3. Filho A.N., Almeida A.C., Riera H. E., Araujo J.L.F., Gouveia V.J.P., Carvalho M. D.C., Cardaso A. V., Polymorphism of CaCO3 and microstructure of the shell of a Brazilian invasive mollusk (Limnoperna Fortune), Materials Research, 2014, Vol.17.(1), pp.15-22.
4. Wowra, O., Effects of carbonation to microstructure and pore solution, Proceedings of the RILEM Workshop on Frost Resistance of Concrete, RILEM Publications, 61–68, 2002, Essen, Germany.
5. Bertos, M.F., Simons, S.J.R., Hills, C.D., and Carey, P.J., A review of accelerated carbonation technology in the treatment of cement-based materials and sequestration of CO2, Journal of hazardous materials, 2004, Vol.112, pp.193 -205.
6. Papadakis V.G., Vayenas, C. G. and Fardis, M. N., Experimental investigation and mathematical modeling of the concrete carbonation problem, Chemical Engineering Science, 1991, Vol.46, pp.1333–1338.
7. Papadakis V.G., Vayenas, C.G. and Fardis, M.N., Hydration and carbonation of pozzolanic cements, ACI Materials Journal, 1992, Vol.89, pp.119–130.
8. Thomas, M. D. A., Hooton, R. D., Scott, A., and Zibara, H., The effect of supplementary cementitious materials on chloride binding in hardened cement paste, Cement and Concrete Research, 2012 Vol.42, pp.1-7.
9. Sulapha, P., Wong, S. F., Wee, T. H and Swaddiwudhipong, S., Carbonation of concrete containing mineral admixtures, Journal of Materials in Civil Engineering ASCE, 2003, Vol.15(2), pp.134-143.
10. Osborne, G. L., Durability of Portland blast-furnace slag cement concrete, Cement and Concrete Composites, 1999, Vol.21, pp.11-21.
11. Bouikni, A., Swamy, R.N. and Bali, A., Durability properties of concrete containing 50% and 65% slag, Construction and Building Materials, 2009, Vol.23, pp.2836-2845.
12. Thomas, M. D. A., Matthews, J. D. and Haynes, C. A., Carbonation of fly ash concrete, In Malhotra V.M., eds. Proceedings of the 5th ACI/CANMET International conference on the durability of concrete, 2000, Barcelona, Spain.
13. Tutti K., Corrosion of Steel in concrete, Report No. 4., Swedish Cement Concrete Research Institute, Stockholm, Sweden, 1982.
14. Jenkins, R., Fawcett, T., Smith, D., Visser, J., Morris, M., and Frevel, L., JCPDS — International Centre for Diffraction Data Sample preparation methods in X-Ray powder diffraction. Powder Diffraction, 1986, Vol.1 (2), pp.51-63.
15. Andrade, C. and Bujak, R., Effects of mineral additions to Portland cement on reinforcement corrosion, Cement and Concrete Research, 2013, Vol.53, pp.59 – 67.
16. Leemann A., Nygaard, Peter., Kaufmann J., Loser R., Relation between carbonation resistance, mix design and exposure of mortar and concrete, Cement and Concrete Composites, 2015, Vol.62, pp.33-43.
17. Torgal, F. P., Miraldo, S., Labrincha, J. A. and Brito, J. D., An overview on concrete carbonation in the context of eco-efficient construction: Evaluation: Use of SCMs and / or RAC, Construction and Building Materials, 2012, Vol.36, pp.141-150.
18. Papadakis V.G., Vayenas C.G., Fardis M.N., Fundamental modelling and experimental investigation of concrete carbonation, ACI Materials Journal 1991, Vol.88, pp.363-373.
19. Jia, Y., Aruhan, B. and Yan, P., Natural and accelerated carbonation of concrete containing fly ash and GGBS after different initial curing period, Magazine of Concrete Research, 2012, Vol.64, pp.143-150.
20. Castellote, M., Fernandez, L., Andrade, C. and Alonso, C., Chemical changes and phase analysis of OPC pastes carbonated at different CO2 concentrations, Materials and Structures, 2009, Vol.42, pp.515-525.
21. Lo, Y., and Lee, H.M., Curing effects on carbonation of concrete using a phenolphthalein indicator and Fourier-transform infrared spectroscopy, Building and Environment, 2002, Vol.37, pp.507-514.
22. Chindaprasirt P., Rukzon S., Pore structure changes of blended cement pastes containing fly ash, rice husk ash and palm oil fuel ash caused by carbonation, Journal of Materials in Civil Engineering, 2009, V.21(N), pp.666-671.
23. Sisomphon K, Franke L, “Carbonation rates of concretes with high volume of puzzolanic materials”, Cement and Concrete Research, 2007, Vol.37, pp.1647-1653
24. Neves R., Branco F., de Brito J., Field assessment of the relationship between natural and accelerated carbonation resistance, Cement and Concrete Composites, 2013, Vol.41, pp.9-15.
12
TECHNICAL PAPER
The IndIan ConCreTe Journal | aprIl 2019
25. Sanjuan M.A., Andrade C., Cheyrezy M., Concrete carbonation tests in natural and accelerated conditions, Advances in Cement Research, 2003, Vol.15(4), pp.171-180.
26. Roy S.K., Beng P.K., Northwood D.O., The carbonation of concrete structure in tropical environment of Singapore and a comparison with published data for temperate climates, 1996, Vol.48, pp.293-300.
27. Duran-Herrera, A., Mendoza-Rangel, J.M., De Los Santos, E.U., Vazquez, F., Valdez, P. and Bentz, D.P., Accelerated and natural carbonation of concretes with internal curing
and shrinkage/viscosity modifiers, Materials and Structures, 2015, Vol. 48(4), pp. 1207-1214
28. Villain G., Thiery M., Platret G., Measurement methods of carbonation profiles in concrete: Thermogravimetry, chemical analysis and gammadensimetry, Cement and Concrete Research, 2007, Vol.37, pp.1182-1192.
29. Borges P., Costa J.O., Milestone N.B.., Lynsdale C. J., Streatfiled. R. E., Carbonation of CH and C-S-H composite cement pastes containing high amounts of BFS, Cement and Concrete Research, 2009, Vol.40, pp.284-292.
b.s. dhanya received her B.Tech and M.Tech degrees in Civil Engineering from the University of Kerala; Ph.D. degree from IIT Madras in concrete technology. She is an Assistant Professor in Civil Engineering at RIT, Government Engineering College, Kottayam, Kerala. She is the recipient of ICI-Ultra Tech award for young concrete engineer – 2018, ICI National award for Best Ph.D. thesis in concrete - 2016 and best paper in poster presentation in ‘CORCON 2016’. Her area of interest include durability of concrete structures, corrosion of rebar in reinforced concrete, and structural design of reinforced concrete structures.
sundar rathnarajan holds a B.E. degree in Civil Engineering and M.E. in Structural Engineering from Thiagarajar College of Engineering, Madurai and is pursuing his Ph.D. degree in Building Technology and Construction Management Division, Indian Institute of Technology (IIT) Madras. His research interests include carbonation in concrete, steel corrosion in concrete, durability and service life estimation of concrete. He is also a Life Member of Indian Concrete Institute (ICI).
manu santhanam holds a Ph.D. degree in Civil Engineering from Purdue University, USA. He has a few years industrial experience in a construction chemicals company. and he is presently a Professor at Indian Institute of Technology (IIT) Madras. His research interests include special concretes, cement chemistry, durability and non-destructive evaluation.
radhakrishna g. pillai holds M.S. and Ph.D. degree in Civil Engineering from Texas A&M University, USA. He is an Associate Professor in the Department of Civil Engineering at the Indian Institute of Technology, Madras. His research interests include corrosion control and testing, grouting practise, and precast concrete construction. He is also a Life member of Indian Concrete Institute and a senior member of Reunion Internationale des Laboratories at Experts des Materiaux, Systems de construction et Ouvrages (RILEM).
ravindra gettu is currently Dean, Industrial Consultancy and Sponsored Research and Prof. V. S. Raju Chair Professor in the Department of Civil Engineering at the Indian Institute of Technology Madras. His current research interests are in fiber reinforced concrete, the effective use of chemical admixtures, self-compacting concrete, sustainability, housing and the mechanical characterization of construction materials. He is currently the President of Reunion Internationale des Laboratories at Experts des Materiaux, Systems de construction et Ouvrages (RILEM), the International Union of Laboratories and experts in construction materials, systems and structures.
View publication statsView publication stats