deviations from covered interest rate parity and the ... · tlements, the school of oriental and...
TRANSCRIPT

Deviations from Covered Interest Rate Parityand the Dollar Funding of Global Banks∗
Tomoyuki Iida, Takeshi Kimura, and Nao SudoBank of Japan
By developing an equilibrium model of the FX swap mar-ket, this paper studies the determinants of deviations fromcovered interest rate parity (CIP) and investigates how changesin the environment surrounding the FX swap market affect theU.S. dollar funding of global banks. We find that the role ofglobal banks’ creditworthiness in determining CIP deviationshas been supplanted by global interest rate differentials, whichreflect monetary policy divergence among advanced economies.Our model and an empirical analysis suggest that the sensi-tivity of CIP deviations to variation in global interest ratedifferentials has risen, as regulatory reforms have increasedthe marginal cost of global banks’ dollar funding. We alsoshow that real money investors have increased their presenceas suppliers of U.S. dollars in the FX swap market and theirinvestment behavior has significantly affected CIP deviationsand hence the dollar funding of global banks.
JEL Codes: F39, G15, G18.
1. Introduction
The role of U.S. dollar (USD) in the global financial system is asimportant as ever, and non-U.S. banks play an essential role in
∗We are grateful for comments from the Editor and two anonymous referees,and helpful discussions with and comments from D. Kyriakopoulou, R. McCauley,P. McGuire, T. Nagano, J. Nakajima, A. Ranaldo, F. Ravazzolo, V. Sushko, andT. Yoshiba, as well as conference participants in the Bank for International Set-tlements, the School of Oriental and African Studies, University of London, andseminar participants at the Bank of Japan. An earlier version from August 2016was titled “Regulatory Reforms and the Dollar Funding of Global Banks: Evi-dence from the Impact of Monetary Policy Divergence.” The views expressedherein are those of the authors alone and do not necessarily reflect those of theBank of Japan. Corresponding author (Sudo): [email protected].
275

276 International Journal of Central Banking September 2018
USD-denominated international financial transactions.1 Looking atthe nationality of banks extending USD-denominated foreign claims,non-U.S. banks overwhelm U.S. banks in terms of market share(figure 1). When non-U.S. banks extend credit in dollars, they haveto fund themselves in dollars, and often their on-balance-sheet creditextensions exceed their funding in dollars. This gap in funding isusually covered by foreign exchange (FX) swaps, since banks aretypically unwilling to bear FX risk. In an FX swap, the parties tothe transaction simultaneously conclude the purchase and sale of twodifferent currencies of equal value on two separate delivery dates inthe opposing direction. For example, a Japanese bank would pur-chase USD against Japanese yen (JPY) in the spot market and JPYagainst the same amount of USD in the forward market, which is ineffect obtaining USD against JPY collateral.
As shown in figure 1, the dependence of non-U.S. banks’ USDfunding on the FX swap market has been on an increasing trend, butwith a sharp decline in times of stress such as the Lehman crisis andthe euro-zone sovereign debt crisis. From the perspective of globalfinancial stability, it is very important to understand how the FXswap market functions, because severe strains in wholesale fundingmarkets such as the FX swap market force non-U.S. financial insti-tutions to cut their dollar lending, which may destabilize the globalfinancial system.
If the FX swap market is frictionless and allows market partici-pants to instantaneously exploit arbitrage trading opportunities, thefollowing condition holds, which is often referred to as the coveredinterest rate parity (CIP):
(1 + r∗) =X1
X0(1 + r), (1)
where r* and r are the interest rates in USD and JPY, respectively.X0 is the FX spot rate between USD and JPY at t = 0, and X1 isthe FX forward rate contracted at t = 0 for exchange at t = 1. In
1See Avdjiev and Takats (2016) for the choice of currency made by non-U.S.banks in their cross-border lending. They show that the bulk of internationalclaims are extended in USD.

Vol. 14 No. 4 Deviations from Covered Interest Rate Parity 277
Figure 1. USD-Denominated Foreign Position of Banks
Source: BIS consolidated banking statistics (immediate borrower basis); BISlocational banking statistics by nationality.Notes: “Foreign claims” and “foreign liabilities” comprise local claims and lia-bilities of the bank’s offices abroad as well as cross-border claims and liabili-ties of the bank’s offices worldwide. “Non-U.S. banks’ USD-denominated foreignclaims” and “Non-U.S. banks’ USD-denominated foreign liabilities” are calcu-lated as USD-denominated foreign claims and liabilities of all countries minusthose of U.S. banks, respectively. “Non-U.S. banks’ cross-currency funding” (i.e.,FX swap) is defined as “Non-U.S. banks’ USD-denominated foreign claims” minus“Non-U.S. banks’ USD-denominated foreign liabilities.” See McGuire and vonPeter (2009) on how to calculate the USD position of banks using BIS interna-tional banking statistics.
practice, however, this condition is often violated, and the equalitybelow holds:
(1 + r∗) + Δ =X1
X0(1 + r), (2)

278 International Journal of Central Banking September 2018
where Δ is what is called a “CIP deviation.” The right-hand sideof equation (2) is often referred to as the “FX swap-implied dollarrate,” while 1 + r∗ is referred to as the “dollar cash rate.” A CIPdeviation is the premium paid to the USD supplier in the FX swapmarket.
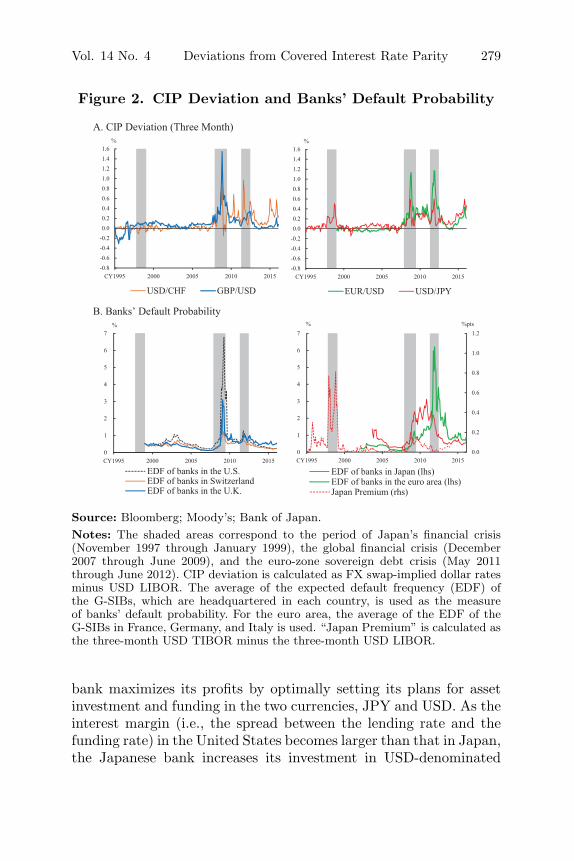
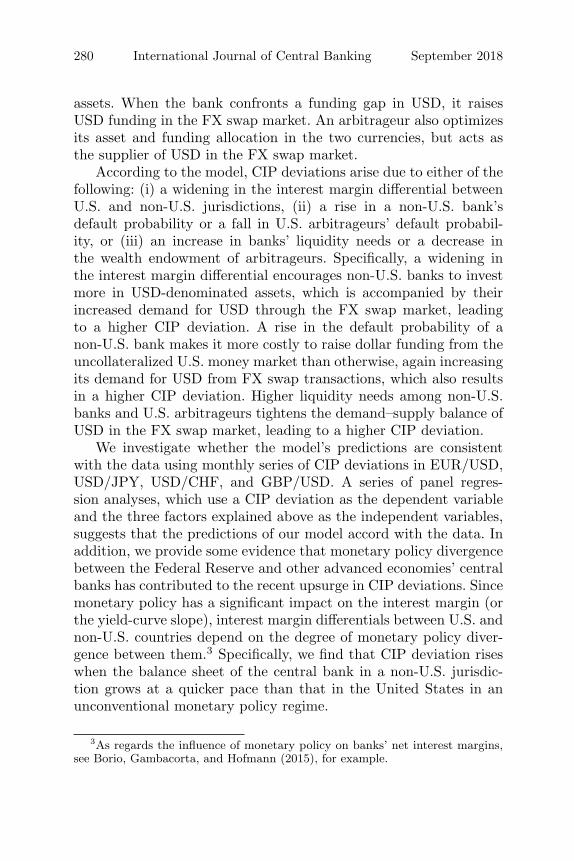
CIP deviations have attracted the attention of policymakers overthe last two decades. This is because CIP conditions have beenseverely violated whenever a banking crisis has occurred. Figure 2displays the time path of CIP deviations against USD in four majorcurrencies, the euro (EUR), JPY, Swiss franc (CHF), and U.K.pound sterling (GBP), as well as that of banks’ default probabil-ities measured by Moody’s expected default frequency (EDF) andthe “Japan premium.”2 Three banking crises are shaded in gray:Japan’s banking crisis, the Lehman crisis, and the euro-zone sov-ereign debt crisis. The figure shows that whenever a bank’s credit-worthiness deteriorated, a CIP deviation that involved the currencyof the jurisdiction soared, suggesting that USD suppliers required alarger premium during these periods. During Japan’s banking crisis,the CIP deviation in the USD/JPY pair increased, while the devia-tion in the other currency pairs was minimal. In contrast, during theLehman crisis and the euro-zone sovereign debt crisis, the increasein the respective CIP deviation of the GBP/USD and EUR/USDpairs was pronounced, compared with the other currency pairs.
This close relationship between CIP deviation and banks’ credit-worthiness seems to have weakened more recently. Around the timeof the Federal Reserve’s tapering announcement in December 2013,the CIP deviation in the four currency pairs started to increase. Forexample, the level of CIP deviation for USD/JPY at the end of 2015was as high as the level recorded in Japan’s banking crisis. However,there has been no clear sign so far of a deterioration in Japanesebanks’ creditworthiness.
This paper explores the determinants of CIP deviation by build-ing an equilibrium model. The model consists of two types of agents:non-U.S. financial institutions (such as Japanese banks) and arbi-trageurs (such as U.S. banks and real money investors). A Japanese
2The EDF measures the probability at period t that a bank will default overa horizon of one year starting from the period t, or alternatively that the marketvalue of the bank’s assets will fall below its liabilities payable over the period.
Vol. 14 No. 4 Deviations from Covered Interest Rate Parity 279
Figure 2. CIP Deviation and Banks’ Default Probability
Source: Bloomberg; Moody’s; Bank of Japan.Notes: The shaded areas correspond to the period of Japan’s financial crisis(November 1997 through January 1999), the global financial crisis (December2007 through June 2009), and the euro-zone sovereign debt crisis (May 2011through June 2012). CIP deviation is calculated as FX swap-implied dollar ratesminus USD LIBOR. The average of the expected default frequency (EDF) ofthe G-SIBs, which are headquartered in each country, is used as the measureof banks’ default probability. For the euro area, the average of the EDF of theG-SIBs in France, Germany, and Italy is used. “Japan Premium” is calculated asthe three-month USD TIBOR minus the three-month USD LIBOR.
bank maximizes its profits by optimally setting its plans for assetinvestment and funding in the two currencies, JPY and USD. As theinterest margin (i.e., the spread between the lending rate and thefunding rate) in the United States becomes larger than that in Japan,the Japanese bank increases its investment in USD-denominated
280 International Journal of Central Banking September 2018
assets. When the bank confronts a funding gap in USD, it raisesUSD funding in the FX swap market. An arbitrageur also optimizesits asset and funding allocation in the two currencies, but acts asthe supplier of USD in the FX swap market.
According to the model, CIP deviations arise due to either of thefollowing: (i) a widening in the interest margin differential betweenU.S. and non-U.S. jurisdictions, (ii) a rise in a non-U.S. bank’sdefault probability or a fall in U.S. arbitrageurs’ default probabil-ity, or (iii) an increase in banks’ liquidity needs or a decrease inthe wealth endowment of arbitrageurs. Specifically, a widening inthe interest margin differential encourages non-U.S. banks to investmore in USD-denominated assets, which is accompanied by theirincreased demand for USD through the FX swap market, leadingto a higher CIP deviation. A rise in the default probability of anon-U.S. bank makes it more costly to raise dollar funding from theuncollateralized U.S. money market than otherwise, again increasingits demand for USD from FX swap transactions, which also resultsin a higher CIP deviation. Higher liquidity needs among non-U.S.banks and U.S. arbitrageurs tightens the demand–supply balance ofUSD in the FX swap market, leading to a higher CIP deviation.
We investigate whether the model’s predictions are consistentwith the data using monthly series of CIP deviations in EUR/USD,USD/JPY, USD/CHF, and GBP/USD. A series of panel regres-sion analyses, which use a CIP deviation as the dependent variableand the three factors explained above as the independent variables,suggests that the predictions of our model accord with the data. Inaddition, we provide some evidence that monetary policy divergencebetween the Federal Reserve and other advanced economies’ centralbanks has contributed to the recent upsurge in CIP deviations. Sincemonetary policy has a significant impact on the interest margin (orthe yield-curve slope), interest margin differentials between U.S. andnon-U.S. countries depend on the degree of monetary policy diver-gence between them.3 Specifically, we find that CIP deviation riseswhen the balance sheet of the central bank in a non-U.S. jurisdic-tion grows at a quicker pace than that in the United States in anunconventional monetary policy regime.
3As regards the influence of monetary policy on banks’ net interest margins,see Borio, Gambacorta, and Hofmann (2015), for example.
Vol. 14 No. 4 Deviations from Covered Interest Rate Parity 281
We next demonstrate that the sensitivity of a CIP deviationto its determinant factors is affected by regulatory reforms whichincrease the marginal cost of global banks’ USD funding. When anarbitrageur (e.g., a U.S. bank) faces a widening interest margin dif-ferential, it seeks to increase its USD-denominated assets. However,as stricter regulations such as the new leverage ratio frameworkare imposed on the financial sector, it is more costly for an arbi-trageur to expand its balance sheet. The arbitrageur therefore shiftsits USD funds away from FX swap transactions toward other dollar-denominated investments, which leads to a decrease in the supplyof USD in the FX swap market. Similarly, a non-U.S. bank facinga widening interest margin differential seeks to increase its USD-denominated investments and raise additional dollars. However, asregulatory reforms increase the marginal cost of raising USD fromthe U.S. money market, a non-U.S. bank shifts its USD fundingsource toward the FX swap market. This leads to an increase in thedemand for USD in the FX swap market. As a result, the widen-ing interest margin differential causes a higher CIP deviation at theequilibrium in the case of stricter financial regulations. To the bestof our knowledge, existing studies have not shed light on how reg-ulatory reforms affect the cost structure of global banks and CIPdeviations in the FX swap market. Our study is therefore the firstto investigate this issue.
Another contribution of this paper is to empirically examine therecent change in market structure of FX swaps. While arbitrage trad-ing activities by banks have declined due to regulatory reforms, realmoney investors—such as asset management companies, sovereignwealth funds (SWFs), and foreign official reserve managers—haveincreased their presence as suppliers of USD in the FX swap mar-ket. Our equilibrium model suggests that a fall in total assets undermanagement (AUM) of real money investors leads to the reductionin their supply of USD in the FX swap market and hence a rise inCIP deviations. Based on the model’s prediction, we offer a novelestimation methodology that serves for identifying the role of realmoney investors. Because the data on FX swap transactions of realmoney investors is not available, we estimate the impact of theirinvestment behavior as a supply shock, i.e., a shock that contempo-raneously affects CIP deviations and FX swap transaction volume inthe opposite direction, by applying a VAR identification scheme withsign restrictions. The estimation result suggests that the identified
282 International Journal of Central Banking September 2018
supply shock contributed to increasing CIP deviation and loweringthe FX swap transaction volume from mid-2014. One of the pos-sible factors behind this result is the sharp decline in oil prices inthe latter half of 2014. In fact, the estimated shock has recentlybecome more correlated with oil prices, which implies that SWFs ofoil-producing countries have reduced the supply of USD in the FXswap market because of the fall in oil prices and hence AUM. Thecombination of our equilibrium model and the VAR identificationwith sign restrictions allows us to pin down the role played by realmoney investors in the FX swap market.
Our study is built upon a small but growing literature on theidentification of the sources of CIP deviation. Baba and Packer(2009b) study the EUR/USD FX swap market from 2007 to 2008,and argue that the difference in perceived counterparty risk betweenEuropean and U.S. financial institutions contributed to a rise in CIPdeviation. Ivashina, Scharfstein, and Stein (2015) argue that thereis a linkage between CIP deviation and the creditworthiness of euro-zone banks, focusing on the period of the euro-zone sovereign debtcrisis in 2011. Terajima, Vikstedt, and Witmer (2010) examine whythe CIP deviation in Canadian dollars/USD was minor during theglobal financial crisis, and argue that economic conditions specificto Canada, such as the presence of a stable U.S. retail deposit basethat provides USD, have the potential to mitigate Canadian banks’reliance on the FX swap market. Pinnington and Shamloo (2016)decompose the CIP deviation for a set of currency pairs that involveCHF into three components: foreign exchange market distortion,interbank market distortion, and transaction costs. They argue thatthe last component was responsible for the CIP deviation of thestudied currency pairs during the first half of 2015 when the SwissNational Bank abandoned its minimum exchange rate policy. Ourpaper is also related to He et al. (2015), which studies the impact ofmonetary policy in advanced economies on USD-denominated loansextended by non-U.S. banks.
In comparison with existing studies, our paper has two novelfeatures.
First, it develops a model where a CIP deviation is determinedas the equilibrium price that clears the FX swap transaction. Themodel of our study is close to that of Ivashina, Scharfstein, andStein (2015) in that both models consist of two types of agents,arbitrageurs and non-U.S. banks. We extend their model so that

Vol. 14 No. 4 Deviations from Covered Interest Rate Parity 283
arbitrageurs optimize their asset portfolio allocation between USD-denominated assets and non-USD denominated assets while takingadvantage of the difference in funding costs across currencies. In ourmodel, the difference in funding costs affects arbitrageurs’ supplyof USD in the FX swap market, while Ivashina, Scharfstein, andStein (2015) do not take into account such an effect. We believethat this point is essential to describe the arbitrageurs’ behavior.The existence of dollar funding premiums in the swap market (i.e.,CIP deviation) has recently signified an opportunity for suppliers ofUSD to obtain yen funding at a very low rate. Arbitrageurs that havedollars to spare can invest in Japanese government securities, evenif the nominal yields on such paper are zero or negative, and secureyields as good as or higher than U.S. government securities with-out taking on foreign exchange risk. Our model can describe suchbehavior of arbitrageurs, which is one of the keys to understandingthe FX swap market.
Second, our paper empirically checks our model’s predictionregarding CIP deviations and shows that the model is consistentwith the data, based on the observation of four currency pairs. Bydoing this, it provides a comprehensive picture of what has drivenCIP deviations from 2007 to 2016. While Pinnington and Sham-loo (2016) also document the decomposition of the CIP deviationinvolving CHF into different driving forces, our paper differs fromtheirs in highlighting global interest rate differentials as importantdrivers of CIP deviation. Our paper also differs from Sushko et al.(2016). They estimate the demand for USD of Japanese financialinstitutions using Bank for International Settlements internationalbanking statistics, and gauge the contribution of their demand andother factors to the CIP deviation for the USD/JPY pair. In con-trast, we focus rather on the underlying shocks, such as interest mar-gin differential across jurisdictions, which drive banks’ demand forUSD. In particular, our study is also unique in using central banks’relative balance sheet growth rates as a proxy for interest margindifferential to show explicitly the growing importance of monetarypolicy divergence in the recent rise in CIP deviation facing majorcurrencies.4
4Sushko et al. (2016) also point out the growing importance of monetary pol-icy divergence behind movements in CIP deviations in recent years. The keydifference between their paper and ours arises from our direct estimation of the
284 International Journal of Central Banking September 2018
The rest of this paper is organized as follows. The next sectionprovides a simple equilibrium model that explains how a CIP devi-ation is determined by the economic environment, including inter-est margin differentials and the creditworthiness of global banks.Section 3 describes our econometric methodologies and the results.Section 4 discusses the impact of regulatory reforms on the FX swapmarket and the increasing presence of real money investors in themarket. Section 5 presents our conclusions.
2. A Theoretical Model of CIP Deviation
The basic setting of our model is borrowed from Ivashina, Scharf-stein, and Stein (2015). Based on an optimization problem, we derivethe behavior of market participants in the FX swap market, and aCIP deviation is determined as the price that clears the demandand supply of USD in the swap market. In our model, the demandand supply of USD is affected by a richer set of variables: globalinterest rate differentials and global banks’ liquidity needs as wellas banks’ creditworthiness and arbitrageurs’ wealth endowment thatare central to the model of Ivashina, Scharfstein, and Stein (2015).In addition, we derive and interpret the comparative statics on thesensitivity of a CIP deviation to its determinant factors, focusing onthe cost parameters of global banks which are found in the model ofIvashina, Scharfstein, and Stein (2015).
The model is static. The economy consists of two countries, theUnited States and a non-U.S. country (e.g., Japan), and two typesof financial intermediaries, which we refer to as an arbitrageur anda non-U.S. financial institution, respectively.5 The former is head-quartered in the United States, and the latter is headquartered in anon-U.S. country.
quantitative relationship between the central bank’s policy instruments and CIPdeviation.
5A non-U.S. financial institution in our paper is broadly defined, as it includesnon-bank financial institutions such as insurance companies that have recentlyplayed an increasingly important role in the market. See, for example, Bank ofJapan (2016).

Vol. 14 No. 4 Deviations from Covered Interest Rate Parity 285
2.1 Demand for USD in the FX Swap Market:The Non-U.S. Bank’s Optimization Problem
A non-U.S. financial institution (e.g., a Japanese bank) invests in twotypes of assets: USD-denominated assets (loans and bonds, etc.) thatare issued by borrowers in the United States, and JPY-denominatedassets that are issued by borrowers in Japan. We denote the twotypes of assets by LUS and LJP. In addition to the two types ofassets, we assume that a non-U.S. bank holds a certain amount ofUSD in cash to prepare for liquidity needs, which is denoted as M .Our preferred interpretation is that liquidity needs capture a liquid-ity demand with several motives: a precautionary hoarding of liquidassets in response to an increase in uncertainty, regulatory require-ments imposed on banks to hold a liquid asset, and liquidity demandarising from banks’ transactions.
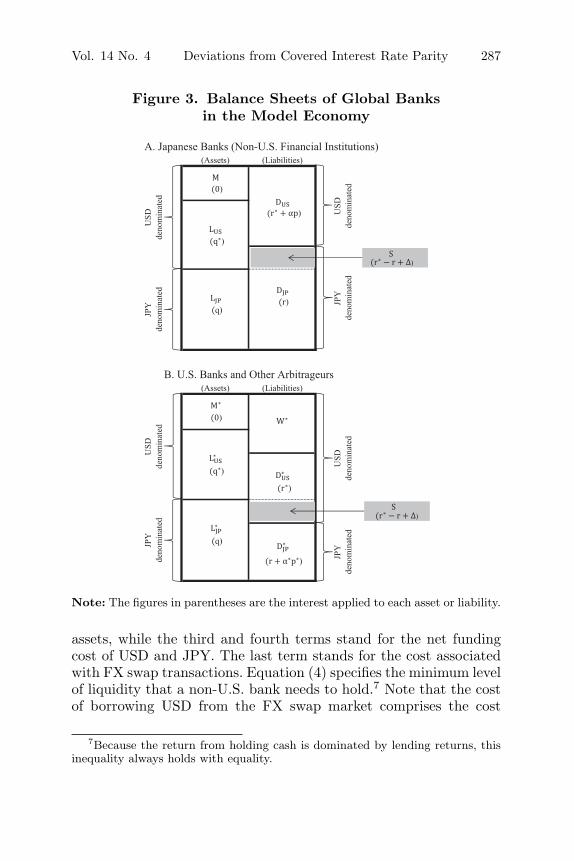
We further assume that the minimum size of liquidity needs isexogenously given and denoted by V , and cash delivers zero return.A non-U.S. bank raises dollar funding from the U.S. money marketby issuing uninsured certificates of deposit (CDs) and commercialpaper (CP), with a funding rate of 1 + r∗ + pα. Here, r* is therisk-free rate in the United States, α is the size of default risk of anon-U.S. bank, and p is a parameter that takes a positive value. Anon-U.S. bank raises funding in JPY from the deposits or the moneymarket in Japan. We assume that the deposits collected in Japanare insured by the government so that the borrowing rate associatedwith JPY funding is equal to the risk-free rate in Japan, which isdenoted as r. We denote the two types of funding by DUS and DJP.Figure 3 shows the balance sheet of a non-U.S. bank.
A non-U.S. bank takes no FX risk. Whenever a non-U.S. bank’sUSD-denominated assets, which is the sum of M and LUS, is largerthan the amount of USD funding DUS, the bank raises USD ofamount S from the FX swap market to fill the gap. The objective ofa non-U.S. bank is to maximize its profits, taking all prices as given,and its optimization problem is given as follows:
maxLUS,LJP,DUS,DJP,M, and S
{gf (LUS) + gh (LJP) − cf (DUS)−ch (DJP) −
(X1×X−1
0 − 1)S
}(3)

286 International Journal of Central Banking September 2018
subject to
M � V
LUS + M = DUS + S
LJP = DJP − S, (4)
where
gf (LUS) = (1 + q∗) LUS − τ∗
2(LUS)2 ,
gh (LJP) = (1 + q) LJP − τ
2(LJP)2 ,
cf (DUS) = (1 + r∗ + pα) DUS +η∗
2(DUS)2 ,
ch (DJP) = (1 + r) DJP +η
2(DJP)2 .
Here, q* and q are the interest rate on USD-denominated assets andon JPY-denominated assets, and X0 and X1 are the exchange ratebetween JPY and USD at spot and forward transactions.6 The bankearns an expected net return of gf (LUS) from USD-denominatedassets and gh(LJP) from JPY-denominated assets, where τ∗ and τare parameters that govern the size of credit costs and administra-tive costs associated with LUS and LJP. cf (DUS) and ch(DJP) arethe cost function of raising funds in USD and JPY, respectively,where η∗ and η are parameters that govern the costs associatedwith changing the size of a bank’s balance sheets. We assume thatthe four parameters (τ∗, τ , η∗, η) always take a positive value, whichmeans that a bank’s profit from assets decreases with scale, and itsfunding cost increases with scale. As discussed later, the impact ofregulatory reforms, such as the new leverage ratio framework andthe U.S. money market fund reform, is reflected in an increase inthe parameters η and η∗.
In equation (3), the first two terms stand for the net earnings of anon-U.S. bank from USD-denominated assets and JPY-denominated
6For simplicity, following He et al. (2015) and Ivashina, Scharfstein, and Stein(2015), we assume that there is no interaction between the FX spot rate X0and USD-denominated lending. By contrast, Shin (2016) discusses the role ofFX rates on USD-denominated lending, and argues that the violation of CIP isa symptom of tighter dollar credit conditions putting a squeeze on accumulateddollar liabilities built up outside the United States during the previous period ofeasy dollar credit.
Vol. 14 No. 4 Deviations from Covered Interest Rate Parity 287
Figure 3. Balance Sheets of Global Banksin the Model Economy
Note: The figures in parentheses are the interest applied to each asset or liability.
assets, while the third and fourth terms stand for the net fundingcost of USD and JPY. The last term stands for the cost associatedwith FX swap transactions. Equation (4) specifies the minimum levelof liquidity that a non-U.S. bank needs to hold.7 Note that the costof borrowing USD from the FX swap market comprises the cost
7Because the return from holding cash is dominated by lending returns, thisinequality always holds with equality.
288 International Journal of Central Banking September 2018
associated with FX swap transactions, X1 × X−10 − 1, and the cost
associated with funding of JPY, which is r. The total cost is thereforecollapsed to the FX swap-implied dollar rate.8
Taking the first-order condition of a non-U.S. bank’s optimiza-tion problem and assuming for simplicity that η = η∗ and τ = τ∗,we can derive a non-U.S. bank’s demand function for USD throughFX swaps.
S =12τ
{[(q∗ − r∗) − (q − r)] − τ + η
ηΔ +
τp
ηα + τV
}(5)
Here, q∗ −r∗ is the interest margin in the United States, and q−r isthat in Japan. An interest margin differential is defined as the spreadbetween them. The first term in the right-hand side of equation (5)states that the demand for USD increases with the interest margindifferential between the two countries.9 Other things being equal, awidening in the interest margin differential makes an investmentin USD-denominated assets more attractive, leading to a higherdemand for USD through the FX swap market. The second termstates that the demand declines with CIP deviation Δ, as it impliesthat FX swap becomes more costly than otherwise. The third termstates that the demand increases as a non-U.S. bank becomes riskier.A non-U.S. bank cannot make a USD-denominated borrowing at therisk-free rate r*, but needs to pay the premium pα to lenders in theU.S. money market. With a higher default probability, the bank’sfunding cost from the U.S. money market rises, which in turn leadsthe bank to shift its funding source from the U.S. money market tothe FX swap market. The interpretation for the last term is straight-forward. When more USD needs to be held in cash, the demand forUSD thorough the FX swap market increases.
Similarly, the amount of USD-denominated assets held by a non-U.S. bank, i.e., their supply of USD in the U.S. loan and bondmarket, is given as follows:
LUS =1
τ + η
{(1 +
η
2τ
)(q∗ − r∗) − η
2τ(q − r) − τ + η
2τΔ − p
2α − η
2V
}.
(6)
8Using the log-approximated version of expression (2), we obtain the followingexpression for a CIP deviation: r∗ + Δ ≈ X1 × X−1
0 − 1 + r.9We assume that the interest margin differential is sufficiently large so that a
non-U.S. bank always raises a positive amount of USD from the FX swap market.
Vol. 14 No. 4 Deviations from Covered Interest Rate Parity 289
The signs of the coefficients on interest margin and CIP devia-tion Δ are the same as those that appear in the demand equa-tion (5). By contrast, a bank’s default probability α affects theamount of USD-denominated assets in the opposite direction, as ahigher funding cost from the U.S. money market increases the totalcost of dollar funding, reducing investment in USD-denominatedassets. Similarly, when a non-U.S. bank faces a liquidity shortage(i.e., higher liquidity needs V ), it cuts back on USD-denominatedassets.
2.2 Supply of USD in the FX Swap Market:The Arbitrageur’s Optimization Problem
We assume that a non-U.S. bank cannot take the supply side in theFX swap market, and that the supplier of USD, which we call thearbitrageur hereafter, maximizes its profit under some constraints.An arbitrageur (e.g., a U.S. bank) raises USD funds with a size D∗
USfrom U.S. markets and JPY funds with a size D∗
JP from the Japanesemoney market. It is assumed that an arbitrageur can collect USDfunds such as insured retail deposits at the risk-free rate r∗ butcannot raise JPY funds at the risk-free rate r. It needs to pay anadditional risk premium p∗α∗ to raise JPY funds. Here, α∗ is the sizeof the default risk of an arbitrageur, and p∗ is a parameter that takesa positive value. An arbitrageur allocates its funds to investment inUSD-denominated assets by the amount of L∗
US, and investment inJPY-denominated asset by the amount of L∗
JP. Whenever L∗JP is
larger than D∗JP, an arbitrageur raises JPY of amount S from the
FX swap market to fill the gap. In addition, just like a non-U.S.bank, an arbitrageur holds a certain amount of USD in cash, whichwe denote by M∗, due to precautionary demand, regulatory require-ments, or both. The minimum size of liquidity needs is exogenouslygiven and denoted as V ∗. Finally, we assume that an arbitrageur isexogenously given capital or wealth of the amount W ∗ in USD. Therationale behind this setting is the presence of real money investors,such as asset management companies and SWFs. They participatein the FX swap market together with U.S. banks as USD suppliers.By incorporating a wealth endowment of W ∗, we intend to capturethe total AUM of these real money investors. Figure 3 shows thebalance sheet of an arbitrageur.

290 International Journal of Central Banking September 2018
The optimization problem of an arbitrageur is then given asfollows:
maxL∗US,L∗
JP,D∗US,D∗
JP,M∗, and S
{hf (L∗
US) + hh (L∗JP) − κf (D∗
US)−κh (D∗
JP) +(X1×X−1
0 − 1)S
}(7)
subject to
M∗ � V ∗
L∗US + M∗ = W ∗ + D∗
US − S
L∗JP = D∗
JP + S, (8)
where
hf (L∗US) = (1 + q∗) L∗
US − γ∗
2(L∗
US)2 ,
hh (L∗JP) = (1 + q) L∗
JP − γ
2(L∗
JP)2 ,
κf (D∗US) = (1 + r∗) D∗
US +θ∗
2(D∗
US)2 ,
κh (D∗JP) =
(1 + r + p∗α∗) D∗
JP +θ
2(D∗
JP)2 .
An arbitrageur earns an expected net return of hf (L∗US) from USD-
denominated assets and hh (L∗JP) from JPY-denominated assets,
where γ∗ and γ are parameters that govern the size of credit costsand administrative costs associated with L∗
US and L∗JP, respectively.
κf (D∗US) and κh(D∗
JP) are the cost function of raising funds in USDand JPY, respectively, where θ∗ and θ are parameters that governthe costs associated with changing the size of an arbitrageur’s bal-ance sheets. We assume that these four parameters (γ∗, γ, θ∗, θ)always take a positive value, which means that an arbitrageur’sprofits from financial assets decrease with scale, and its fundingcost increases with scale. As discussed later, regulatory reforms con-tribute to an increase in the parameters θ∗ and θ. Equation (8)specifies the minimum level of liquidity that an arbitrageur needs tohold.
Taking the first-order condition of an arbitrager’s problem andassuming that γ = γ∗ and θ = θ∗ for simplicity, we can derive anarbitrageur’s supply function of USD through FX swaps.
Vol. 14 No. 4 Deviations from Covered Interest Rate Parity 291
S =12γ
{−
[(q∗ − r∗) − (q − r)] +
(γ + θ)θ
Δ +p∗γ
θα∗ − γ (V ∗ −W ∗)
}
(9)
In contrast to a non-U.S. bank’s decision, the interest margin differ-ential works in the opposite direction in an arbitrageur’s decision.When an interest margin differential (q∗ − r∗) − (q − r) widens, itis more profitable for an arbitrageur to substitute the supply ofUSD away from the FX swap transaction to other USD-denominatedassets. The supply of USD increases with CIP deviation Δ, becauseFX swap transactions become more profitable with a higher CIPdeviation. It is also important to note that the size of liquidity needsand endowment influences the supply of FX swaps. When liquidityneeds V ∗ increase and/or wealth endowment W ∗ decreases, thereare fewer USD funds left for FX swap transactions.
2.3 Equilibrium Condition
The flow of funds of USD and JPY is shown in figure 4. Combiningthe demand and supply functions (5) and (9), a CIP deviation atthe equilibrium is given by the following expression:
Δ =ηθ
(τ + η) γθ + (γ + θ) τη
×{
(τ + γ)[(q∗ − r∗) − (q − r)]
+ τγpη α − τγp∗
θ α∗ + τγ(V + V ∗ − W ∗)
}. (10)
According to this equation, CIP deviation Δ is determined by threefactors: (i) the interest margin differential, (q∗ − r∗) − (q − r), (ii)the default probabilities of a non-U.S. bank and an arbitrageur, αand α∗, and (iii) the liquidity needs of a non-U.S. bank and an arbi-trageur, V and V ∗, and the wealth endowed to an arbitrageur, W ∗.The first factor influences CIP deviation through investment deci-sions made by non-U.S. banks and arbitrageurs. The second factorinfluences CIP deviation through funding decisions made by thesetwo types of agents. For instance, suppose that the default probabil-ity of a non-U.S. bank (α) increases, and lenders in U.S. money mar-kets require a higher premium, which in turn leads the bank to raisemore USD from the FX swap market, increasing the CIP deviation.

292 International Journal of Central Banking September 2018
Figure 4. Flow of Funds in the Model Economy
Note: The figures in parentheses are the interest rates applied to each asset orliability.
The higher default probability of an arbitrageur (α∗) affects CIPdeviation through a similar mechanism, but in the opposite direc-tion. The third factor influences CIP deviation by directly changingthe size of demand and supply for USD that is transacted in the FXswap market.

Vol. 14 No. 4 Deviations from Covered Interest Rate Parity 293
The volume of the FX swap transaction S at the equilibrium isgiven by
S =(τ + γ) Ω−1 − 1
2γ
[(q∗ − r∗) − (q − r)] +
(1 − τΩ−1
)p∗
2θα∗
+τΩ−1p
2ηα +
τΩ−1
2V − 1 − τΩ−1
2(V ∗ − W ∗) , (11)
where
Ω =1
η (γ + θ)[θγ(τ + η) + ητ(γ + θ)] and
(1 − τΩ−1) > 0.
Except for the interest margin differential, the sign of the coefficientsof all other factors is uniquely determined. Whether a widening inter-est margin differential (q∗ − r∗) − (q − r) leads to an increase in thevolume of FX transaction S depends on parameter values, because,as shown in equation (5) and (9), a change in the interest margin dif-ferential makes the demand and supply curves for USD shift in theopposite direction. If inequality θτ < γη holds, the widening differ-ential affects the transaction volume positively. That is, the impactof the rightward shift of the demand curve is larger than that of theleftward shift of the supply curve. This inequality is satisfied when,for example, the marginal cost of USD funding for non-U.S. banks(η) is sufficiently larger than that for U.S. arbitrageurs (θ).10
2.4 The Cost Structure of Global Banks and CIP Deviation
With our theoretical model, we now assess how the cost structure ofglobal banks affects CIP deviation at the equilibrium. For simplifica-tion, we continue to assume that for both arbitrageurs and non-U.S.financial institutions, the values of parameters related to marginalreturn on assets and marginal cost of funding are identical acrosscurrencies (τ = τ∗, η = η∗, θ = θ∗, γ = γ∗).
As equation (10) indicates, provided that participating banksare sufficiently creditworthy, CIP deviation collapses to zero in the
10As shown later in section 4.2, we empirically observe that swap transactionvolume is positively correlated with the interest rate differential (see figure 9,right-side graph of panel B). Therefore, in the following analysis, we assume thatθτ < γη holds.
294 International Journal of Central Banking September 2018
case of θ = 0 or η = 0, which means that an arbitrageur canexpand its balance sheet without any constraints, or a non-U.S.bank can borrow funds very easily from the U.S. money market.11
Indeed, CIP deviations in the 2000s remained almost zero until theglobal financial crisis occurred and financial regulation was tight-ened (figure 2).12 This is probably because unusually easy finan-cial conditions in this period made the value of these parametersnegligible.
Since the global financial crisis, a good number of regulatoryreforms have affected the dollar funding costs of global banks, poten-tially raising the parameters of cost functions. The U.S. money mar-ket fund (MMF) reform is one such example. This reform requiresinstitutional prime MMFs, which principally invest in CDs and CPissued by global banks, to shift from constant net asset value to float-ing/variable net asset value, while institutional government MMFsare exempt from this rule. The MMF reform rules were publishedin July 2014 and came into effect in October 2016. Anticipation ofthe new rules led to a shrinkage of prime funds’ assets since aroundOctober 2015 (figure 5). Institutional investors switched from primeMMFs to government MMFs, and reduced investment by primeMMFs in CDs and CP lowers the availability of banks’ wholesaleUSD funding. This implies that it costs more for global banks toraise USD in the U.S. money market than in the past. They have toinvest in advertising, promotions, and branches, and the more theyincrease their dollar assets, the greater the marginal costs of dollarfunding. In this sense, the U.S. MMF reform increases the parameterη∗ of the cost function cf (DUS) and the parameter θ∗ of the costfunctions κf (D∗
US).The new leverage ratio framework is another example which
affects the cost structure of global banks. Specifically, the Basel IIIleverage ratio framework and the U.S. supplementary leverage ratio(SLR) framework, along with the public disclosure requirementsintroduced in January 2015, have the effect of increasing capital
11According to equation (10), CIP deviation converges to pα as the parameterη approaches zero, while it converges to −p∗α∗ as the parameter θ approacheszero. The values therefore take zero when both α and α∗ are zero.
12See Akram, Rime, and Sarno (2008) for developments in CIP deviationsduring the pre-crisis period.

Vol. 14 No. 4 Deviations from Covered Interest Rate Parity 295
Figure 5. Impact of U.S. MMF Reform
Source: Investment Company Institute; U.S. Securities and ExchangeCommission.Notes: For panel A, government MMFs are defined as MMFs that invest 99.5percent or more of their total assets in cash, government securities, and/or govern-ment repurchase agreements. Prime MMFs are defined as MMFs that primarilyinvest in corporate debt securities. The vertical line in panel A corresponds tothe compliance date for amendments related to MMF reforms released by theU.S. Securities and Exchange Commission (October 2016).
requirements for balance sheet expansion relative to the more tradi-tional risk-based capital ratio, which seems to be dampening banks’arbitrage activities. Market participants also suggest that uncer-tainty remains as to whether short-term USD lending through cross-currency funding markets, with USD funded in the money market,may lead to violation of the Volcker rule, which came into effect inJuly 2015.13 This has probably induced U.S. banks to be cautiousand avoid arbitrage through FX swap transactions. These stricterfinancial regulations increase the marginal cost for arbitrageurs (suchas U.S. banks) of expanding their balance sheets, and raise theparameter θ of the cost function κh (D∗
JP) and the parameter θ∗
of the cost function κf (D∗US).
How does a rise in the parameters θ (=θ∗) and η (=η∗) causedby regulatory reforms affect CIP deviations? CIP deviations take
13See, for example, Arai et al. (2016) and Pozsar (2016).

296 International Journal of Central Banking September 2018
a positive value when the parameters θ and η are greater thanzero. Denoting the coefficient of an interest margin differential(q∗ − r∗) − (q − r) in equation (10) to determine CIP deviation by∂Δ/∂(IMD), we can derive the partial derivative of this coefficientwith respect to θ and η.
∂(
∂Δ∂(IMD)
)
∂θ=
(η2γθ + τγη2
)(τ + γ)
((τ + η) γθ + τ (γ + θ) η)2> 0,
∂(
∂Δ∂(IMD)
)
∂η=
(η2γθ + τγη2
)τγ
((τ + η) γθ + τ (γ + θ) η)2> 0 (12)
In other words, a rise in the parameters θ and η enhances the sen-sitivity of a CIP deviation to an interest margin differential. Whenan arbitrageur (e.g., a U.S. bank) faces a widening interest margindifferential, it seeks to increase its USD-denominated assets. With ahigher value of θ (=θ∗), it is more costly for an arbitrageur to expandits balance sheet. Therefore, an arbitrageur shifts its USD fundsaway from FX swap transactions toward other dollar-denominatedinvestments, which leads to a larger decrease in the supply of USD inthe FX swap market (see figures 3 and 4). Similarly, a non-U.S. bankfacing a widening interest margin differential seeks to increase itsUSD-denominated investments. With a higher value of η (=η∗), themarginal cost of raising USD from the U.S. money market becomeslarger. Therefore, a non-U.S. bank shifts its USD funding sourcetoward the FX swap market, which leads to a larger increase in thedemand for USD in the FX swap market (see figures 3 and 4). Asa result, a widening interest margin differential causes a higher CIPdeviation at the equilibrium as financial regulations become stricter(that is, as the value of parameters θ and η becomes higher).
The relationship regarding how coefficients of liquidity needs(V, V ∗) vary with the two parameters is also derived. Denoting thesecoefficients by ∂Δ
∂V and ∂Δ∂V ∗ , respectively, we obtain the following
comparative statics:
∂(
∂Δ∂V
)
∂θ,
∂(
∂Δ∂V
)
∂η,
∂(
∂Δ∂V ∗
)
∂θ,
∂(
∂Δ∂V ∗
)
∂η> 0. (13)

Vol. 14 No. 4 Deviations from Covered Interest Rate Parity 297
Again, these partial derivatives show that CIP deviations react muchmore to a change in liquidity needs when a tighter regulatory reformis implemented.
Note that the extent to which regulatory reforms influence theeffect of banks’ default probabilities (α, α∗) on CIP deviation differsacross parameters.
∂(
∂Δ∂α
)
∂θ,
∂(
∂Δ∂α∗
)
∂θ> 0, and
∂(
∂Δ∂α
)
∂η,
∂(
∂Δ∂α∗
)
∂η< 0 (14)
For example, when the default probability of a non-U.S. bank (α)increases, lenders in the U.S. money market require a higher pre-mium, which in turn leads the bank to raise more USD from theFX swap market. With a higher value of θ, an arbitrageur requiresa much larger premium to compensate for the higher marginal costof dollar funding, resulting in an even higher CIP deviation. In con-trast, with a higher value of η (=η∗), a non-U.S. bank faces a largermarginal cost in raising USD from the U.S. money market, and itreduces dollar lending given an interest margin differential. There-fore, the demand by a non-U.S. bank for USD in the FX swap marketis suppressed, resulting in a modest rise in CIP deviation.
Finally, it should be also noted that stricter financial regulations(i.e., higher θ and η in our model) increase the sensitivity of CIPdeviations to wealth endowment shocks. The following comparativestatics are obtained from equation (10):
∂(
∂Δ∂W ∗
)
∂θ,
∂(
∂Δ∂W ∗
)
∂η< 0. (15)
When arbitrageurs such as real money investors face a fall in totalAUM (W ∗) and reduce the supply of USD in the FX swap market,the demand–supply balance of USD tightens, leading to an increasein CIP deviation. With a higher value of η, a non-U.S. bank faces ahigher marginal cost for funding USD from the U.S. money marketand becomes less responsive to changes in CIP deviation. That is,the demand curve for USD in the FX swap market becomes steeper,as shown in equation (5). Consequently, the fall in supply of USD ismore easily translated into an even higher CIP deviation. Similarly,with a higher value of θ, a U.S. bank requires a much larger premiumto compensate for the higher funding costs, which implies that the

298 International Journal of Central Banking September 2018
supply curve of USD in the FX swap market becomes steeper, asshown in equation (9). Again, the leftward shift of the steeper sup-ply curve leads to a much higher CIP deviation. In this sense, anadverse shock to arbitrageurs, such as a fall in the AUM of realmoney investors, is amplified by stricter financial regulations.
3. Empirical Analysis: Exploring Determinantsof CIP Deviation
As indicated in equation (10), our model predicts that a CIP devia-tion is determined by three factors: (i) an interest margin differential,(ii) default risk of market participants, and (iii) liquidity needs ofmarket participants and wealth endowment of arbitrageurs. In thissection, we empirically examine if the model’s prediction accordswith the data, by regressing CIP deviations on these factors.
3.1 Data
We study the CIP deviation in four currency pairs—EUR/USD,USD/JPY, GBP/USD, and USD/CHF—for the sample period fromJanuary 2007 to February 2016, unless otherwise noted.
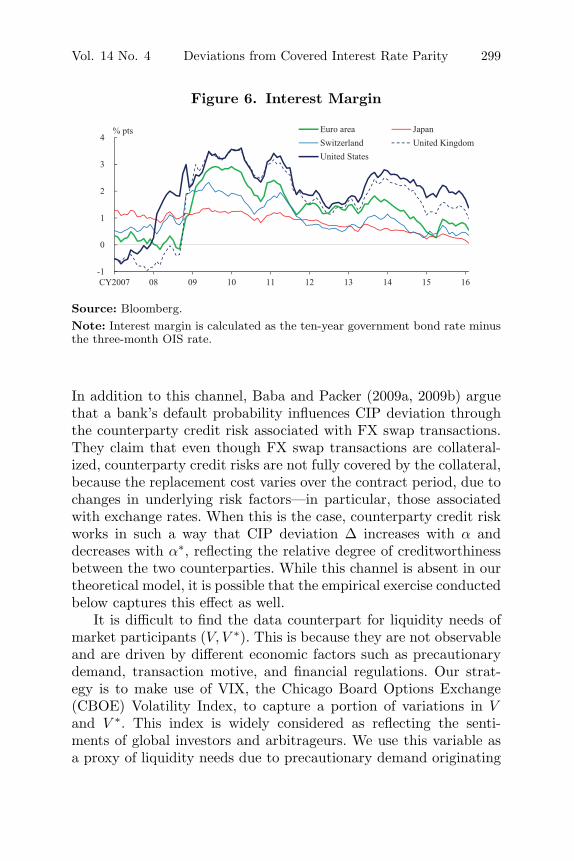
As regards the interest margin (q∗ − r∗, q − r), we use the ten-year government bond yield less three-month overnight index swap(OIS) rate, i.e., the slope of the yield curve, for the United Statesand the four non-U.S. jurisdictions (figure 6). Here, we use the OISrate as a risk-free rate (r, r∗), because no principal is exchanged inOIS contacts and therefore the counterparty risk associated withthem is relatively small.14
As for banks’ default probabilities (α, α∗), we use the expecteddefault frequency (EDF) series of large banks shown in figure 2.15
In our model, a bank’s default probability affects CIP deviation, asit alters the size of demand and supply of USD in the FX swapmarket through a change in funding costs in the money market.
14The OIS is an interest rate swap in which the floating leg is linked to apublicly available index of daily overnight rates.
15Some existing studies, such as Baba and Packer (2009a, 2009b) and He et al.(2015), use credit default swap (CDS) spread as a measure of a bank’s defaultprobability. As a robustness check, we estimate the model using CDS spreadinstead of EDF. We find that the results are indeed little changed.
Vol. 14 No. 4 Deviations from Covered Interest Rate Parity 299
Figure 6. Interest Margin
Source: Bloomberg.Note: Interest margin is calculated as the ten-year government bond rate minusthe three-month OIS rate.
In addition to this channel, Baba and Packer (2009a, 2009b) arguethat a bank’s default probability influences CIP deviation throughthe counterparty credit risk associated with FX swap transactions.They claim that even though FX swap transactions are collateral-ized, counterparty credit risks are not fully covered by the collateral,because the replacement cost varies over the contract period, due tochanges in underlying risk factors—in particular, those associatedwith exchange rates. When this is the case, counterparty credit riskworks in such a way that CIP deviation Δ increases with α anddecreases with α∗, reflecting the relative degree of creditworthinessbetween the two counterparties. While this channel is absent in ourtheoretical model, it is possible that the empirical exercise conductedbelow captures this effect as well.
It is difficult to find the data counterpart for liquidity needs ofmarket participants (V, V ∗). This is because they are not observableand are driven by different economic factors such as precautionarydemand, transaction motive, and financial regulations. Our strat-egy is to make use of VIX, the Chicago Board Options Exchange(CBOE) Volatility Index, to capture a portion of variations in Vand V ∗. This index is widely considered as reflecting the senti-ments of global investors and arbitrageurs. We use this variable asa proxy of liquidity needs due to precautionary demand originating

300 International Journal of Central Banking September 2018
from market uncertainty. Data on the wealth endowment of arbi-trageurs (W ∗) are also not available, and we discuss this issue laterin section 4.
Following the most common treatment in the existing literature,we use the CIP deviation based on LIBOR as a dependent vari-able (Δ).16 Note that the CIP deviation based on LIBOR can bedecomposed into two components: (i) the CIP deviation based onthe OIS rate, and (ii) the difference in LIBOR-OIS spreads betweenthe currency pair. Since we use the OIS rate as a risk-free rate (r, r∗),the CIP deviation based on the OIS rate corresponds to Δ in equa-tions (2) and (10). Therefore, by using the CIP deviation based onLIBOR as a dependent variable in the panel estimation, we implicitlyassume that the contribution of the difference in LIBOR-OIS spreadsis captured by independent variables, in particular, the credit riskof market participants (α, α∗).
3.2 Methodology
Our baseline model is a set of regressions that includes a CIP devi-ation as the dependent variable and its three determinant factors asthe independent variables.
(Model 1)
Δit = δ1 [(q∗t − r∗
t ) − (qit − rit)] + β1αit + β∗1α∗
t
+ λ1VIXt + c1i + ε1it (16)
(Model 2)
Δit = δ∗2 (q∗
t − r∗t ) + δ2 (qit − rit) + β2αit + β∗
2α∗t
+ λ2VIXt + c2i + ε2it (17)
(Model 3)
Δit = δ3i [(q∗t − r∗
t ) − (qit − rit)] + β3iαit + β∗3iα
∗t
+ λ3iVIXt + c3i + ε3it (18)
16See, for example, Baba and Packer (2009a, 2009b), Coffey, Hrung, and Sarkar(2009), and He et al. (2015).
Vol. 14 No. 4 Deviations from Covered Interest Rate Parity 301
Here, the subscript i stands for jurisdiction (i = the euro area,Japan, Switzerland, and the United Kingdom). The parameters c1i,c2i, and c3i represent the jurisdiction-specific fixed effects, and ε1it,ε2it, and ε3it are error terms. The three models are different fromeach other regarding how parameter restrictions on the coefficientsare imposed. Model 1 corresponds to our theoretical model in whichthe following assumptions are imposed on technology parameters.
• For both arbitrageurs and non-U.S. financial institutions,parameters related to the marginal return of financial assetsand the marginal cost of funding are identical across curren-cies (τ = τ∗, η = η∗, θ = θ∗, γ = γ∗).
• For non-U.S. financial institutions, each parameter related tothe marginal return of financial assets (τ, τ∗) and the marginalcost of funding (η, η∗) is identical across jurisdictions.
Model 2 corresponds to the case where the first assumption isdropped, and model 3 corresponds to the case where the secondassumption is dropped, while one other assumption is maintained inboth cases.
As discussed in section 2.4, the sensitivity of a CIP deviationto its determinant factors may be time varying due to regulatoryreforms, but in this section we assume that the coefficients in models1–3 are fixed over the sample period. (In section 4.1, we allow thecoefficients to be time varying.)
3.3 Estimation Results
Table 1 shows the results of the panel regression.17 We compute thestandard deviation of an estimated coefficient using White periodstandard errors and covariance, allowing the residuals in each modelto be serially correlated.18 In all three models, the signs of estimated
17As for GBP/USD in model 3, we exclude the arbitrageur’s default probabilityα∗ from the set of explanatory variables in order to avoid the multicollinearityproblem. As shown in figure 2, the EDF of U.K. banks has recently developed ina similar way to the EDF of U.S. banks.
18The error terms ε1it, ε2it, and ε3it represent banks’ liquidity needs (V, V ∗)unexplained by VIX and the wealth endowment of arbitrageurs (W ∗). Given ourmodel structure, it is reasonable to assume that these error terms are uncorrelated

302 International Journal of Central Banking September 2018
coefficients of explanatory variables are consistent with the predic-tion of our equilibrium model shown in equation (10). A higherinterest margin in the United States (q∗ − r∗), or a lower inter-est margin in non-U.S. jurisdictions (q − r), or both, tightens thedemand–supply balance of USD in the FX swap market, result-ing in a larger positive CIP deviation. The estimated coefficientsof non-U.S. banks’ default risk (α) are positive, and those of U.S.arbitrageurs’ default risk (α∗) are negative and statistically signifi-cant. This observation is consistent with the substitution effect cap-tured in the second and third terms in equation (10) and/or thecredit risk channel emphasized in Baba and Packer (2009a, 2009b).19
The coefficients of VIX are positive and statistically significant, sug-gesting that heightened market uncertainty increases precautionarydemand by both non-U.S. banks and arbitrageurs, pushing up CIPdeviations.
3.4 Sensitivity Analysis: Use of Alternative Variables
3.4.1 CIP Deviation Based on Alternative Terms
In our baseline estimation, we focus on CIP deviations measuredby the three-month FX swap-implied dollar rate. Here, we examinewhether the estimated results are robust to a choice of terms. To dothis, we employ model 1 with the dependent variable replaced byCIP deviations measured by the six-month and one-year FX swap-implied dollar rate, respectively. Table 2 shows the results basedon these alternative estimation settings. Estimation results are littlechanged from those reported in table 1.20
with explanatory variables. As a robustness check, we estimate the three modelsusing the lagged value of the explanatory variables in order to avoid possiblecorrelation between error terms and explanatory variables. The results are littlechanged from those reported in table 1.
19Baba and Packer (2009a) report that during the Lehman crisis even U.S.banks participated in the FX swap market to raise USD. They examine howthe CDS spreads of U.S. financial institutions are correlated with CIP deviation.Similar to our finding, they find that CDS spreads of U.S. financial institutionsare negatively correlated with CIP deviation.
20Although not reported, we conduct the estimation exercise using alternativeterms based on model 2 and model 3 as well. The results are little changed.

Vol. 14 No. 4 Deviations from Covered Interest Rate Parity 303
Tab
le1.
Pan
elR
egre
ssio
ns
ofC
IPD
evia
tion
s(3
M)
Model
3
Model
1M
odel
2EU
R/U
SD
USD
/JP
YU
SD
/CH
FG
BP
/USD
Inte
rest
Mar
ginU
S–
0.04
69∗∗
∗0.
0452
∗∗∗
0.05
78∗∗
∗0.
0567
∗∗∗
0.07
63∗∗
∗
Inte
rest
Mar
ginn
on-U
S(6
.23)
(2.8
6)(5
.72)
(3.3
7)(2
.74)
Inte
rest
Mar
ginU
S0.
436∗
∗∗
(5.8
4)In
tere
stM
argi
nnon
-US
−0.
0595
∗∗∗
(−5.
55)
ED
FU
S−
0.05
58∗∗
∗−
0.05
11∗∗
∗−
0.05
25∗∗
∗−
0.06
89∗∗
∗−
0.13
16∗∗
∗
(−3.
84)
(−3.
39)
(−3.
01)
(−3.
87)
(−5.
02)
ED
Fnon
-US
0.08
65∗∗
∗0.
0908
∗∗∗
0.12
06∗∗
∗0.
0014
0.26
15∗
0.08
54∗∗
(6.7
2)(6
.87)
(8.5
7)(0
.07)
(1.9
0)(1
.99)
VIX
0.01
48∗∗
∗0.
0146
∗∗∗
0.02
07∗∗
∗0.
0096
∗∗∗
0.01
46∗∗
∗0.
0169
∗∗∗
(7.3
3)(7
.19)
(7.7
3)(3
.28)
(5.0
2)(7
.56)
Con
stan
t−
0.16
21∗∗
∗−
0.14
26∗∗
∗−
0.18
27∗∗
∗
(−4.
86)
(−4.
18)
(−8.
09)
Fix
edE
ffect
sY
esY
esY
esR
-squ
ared
0.49
0.49
0.65
RM
SE0.
150.
150.
060.
050.
070.
05N
o.of
Obs
erva
tion
s44
044
044
0
Note
s:Sa
mpl
eper
iod:
2007
:M1–
2016
:M2.
Fig
ures
inpa
rent
hese
sar
et-
stat
isti
cs.
Stan
dard
erro
rsar
eca
lcul
ated
base
don
per
iod
wei
ghts
(PC
SE)
met
hod.
***,
**,an
d*
indi
cate
sign
ifica
nce
atth
e1
per
cent
,5
per
cent
,an
d10
per
cent
leve
l,re
spec
tive
ly.

304 International Journal of Central Banking September 2018
Table 2. Panel Regressions of CIP Deviationsof Different Terms
Dependent Variable
CIP CIP CIPDeviation Deviation Deviation
(3M) (6M) (1Y)
Interest MarginUS – 0.0469∗∗∗ 0.0510∗∗∗ 0.0736∗∗∗
Interest Marginnon-US (6.23) (6.54) (8.42)EDFUS −0.0558∗∗∗ −0.1093∗∗∗ −0.1163∗∗∗
(−3.84) (−7.60) (−8.62)EDFnon-US 0.0865∗∗∗ 0.1353∗∗∗ 0.1386∗∗∗
(6.72) (11.17) (9.78)VIX 0.0148∗∗∗ 0.0147∗∗∗ 0.0158∗∗∗
(7.33) (6.06) (5.56)Constant −0.1621∗∗∗ −0.1976∗∗∗ −0.2389∗∗∗
(−4.86) (−4.93) (−5.07)Fixed Effects Yes Yes YesR-squared 0.49 0.50 0.48RMSE 0.15 0.16 0.18No. of Observations 440 440 440
Notes: Sample period: 2007:M1–2016:M2. Figures in parentheses are t-statistics.Standard errors are calculated based on period weights (PCSE) method. ***, **, and* indicate significance at the 1 percent, 5 percent, and 10 percent level, respectively.
3.4.2 CIP Deviation Based on OIS
Following the most common treatment in the existing literature, weuse the CIP deviation based on LIBOR as the dependent variable(Δ) in the baseline estimation. Theoretically, however, the CIP devi-ation based on the risk-free rate is more compatible with our model,because interest rates r and r∗ are the risk-free rates in the model.We repeat the regression exercises for model 1, with the dependentvariable replaced by the three-month CIP deviation based on theOIS rate. Table 3 shows the estimation result. With the exceptionthat the coefficient of a default probability of non-U.S. banks (α)is statistically insignificant with an opposite sign, all other coeffi-cients are significant with correct signs. When CDS spread is used

Vol. 14 No. 4 Deviations from Covered Interest Rate Parity 305
Table 3. Panel Regressions of CIP Deviations(3M) Based on OIS
α, α∗ : EDF α, α∗ : CDS
Interest MarginUS – 0.0729∗∗∗ 0.0819∗∗∗
Interest Marginnon-US (5.71) (5.33)Default Probability of −0.0897∗∗∗ −0.0009∗∗∗
U.S. Banks (α∗) (−4.65) (−3.62)Default Probability of −0.0156 0.0003∗∗
Non-U.S. Banks (α) (−0.92) (2.17)VIX 0.0292∗∗∗ 0.0277∗∗∗
(7.55) (6.53)Constant −0.2930∗∗∗ −0.2614∗∗∗
(−4.77) (−4.50)Fixed Effects Yes YesR-squared 0.60 0.58RMSE 0.20 0.21No. of Observations 440 440
Notes: Sample period: 2007:M1–2016:M2. Figures in parentheses are t-statistics.Standard errors are calculated based on period weights (PCSE) method. ***, **, and* indicate significance at the 1 percent, 5 percent, and 10 percent level, respectively.The coefficients are estimated based on the estimation model 1, equation (16).
as an alternative measure of default probability, the coefficients onthe default probability of both U.S. arbitrageurs and non-U.S. banksare statistically significant with correct signs.
Summing up the results of tables 1–3, using different measuresof CIP deviations as dependent variables does not change our mainfinding that interest margin differential, banks’ creditworthiness, andtheir liquidity needs are determinant factors of CIP deviations.
3.4.3 Interest Margin Differential and MonetaryPolicy Divergence
In tables 1–3, we use the ten-year government bond yield less three-month OIS rate as the interest margin (q∗ − r∗, q − r). However,in practice, arbitrageurs and non-U.S. financial institutions investin a broader class of assets other than government bonds. Becausemonetary policy affects returns of broad asset classes, a policy vari-able may be a good proxy for the interest margin. Indeed, existing

306 International Journal of Central Banking September 2018
studies agree that monetary policy significantly influences banks’net interest margins, which implies that interest margin differen-tials between U.S. and non-U.S. countries depend on the degree ofmonetary policy divergence between them. There is also consider-able empirical evidence that unconventional monetary policies suchas quantitative easing have the effect of lowering medium- to long-term bond yields and term premiums, which is closely related to theinterest margin in our model.21 In addition, unconventional mone-tary policies affect the return of risky assets as well as safe assets(e.g., government bonds). For example, the Bank of Japan has pur-chased exchange-traded funds (ETFs), Japanese real estate invest-ment trusts (J-REITs), commercial paper, and corporate bonds inorder to lower risk premium of assets prices.
Here, we therefore explicitly include a monetary policy instru-ment itself in our regression models as a proxy of interest margin.In most of the sampled jurisdictions during our sample periods, thepolicy instrument has changed from the short-term interest rate toquantitative measures. Therefore, as regards our model estimation,we move forward the starting period of the sample period from Jan-uary 2007 to December 2008, the month after quantitative easing(QE) was first launched by the Federal Reserve, and use the sizeof the central bank’s balance sheet as the policy instrument. Thisapproach is consistent with existing studies such as Gambacorta,Hofmann, and Peersman (2014) and He et al. (2015). Specifically,we estimate models 1–3 by replacing interest margin with the sizeof the central bank’s balance sheet.
(Model 1)
Δit = δ1 [CB∗t − CBit] + β1αit + β∗
1α∗t + λ1VIXt
+ φ1ξit + c1i + ε1it (19)
(Model 2)
Δit = δ∗2CB∗
t + δ2CBit + β2αit + β∗2α∗
t + λ2VIXt
+ φ2ξit + c2i + ε2it (20)
21See, for instance, Rogers, Scotti, and Wright (2014) and Kimura and Naka-jima (2016).

Vol. 14 No. 4 Deviations from Covered Interest Rate Parity 307
(Model 3)
Δit = δ3i [CB∗t − CBit] + β3αit + β∗
3α∗t + λ3iVIXt
+ φ3ξit + c3i + ε3it (21)
Here, CB∗t and CBit are the monthly growth rate of the seasonally
adjusted size of the balance sheet of the Federal Reserve and thatof the central bank in the non-U.S. jurisdiction i, respectively. Notethat the expected sign for the difference in growth rate of centralbanks’ balance sheets (i.e., CB∗
t −CBit) is negative rather than posi-tive. When the growth rate of the central bank’s balance sheet in thenon-U.S. jurisdiction outpaces that in the United States, the inter-est margin differential is expected to widen, which brings about ahigher CIP deviation. The parameters c1i, c2i, and c3i represent thejurisdiction-specific fixed effects, and ε1it, ε2it, and ε3it are residuals.ξit is the vector of control variables that serves for extracting policyshocks from the change in the growth rates of the central bank’sbalance sheet, which consists of the CPI inflation rate and capacityutilization of the manufacturing sector in jurisdiction i.22
As shown in table 4, the estimation results indicate that theimpact of monetary policy divergence on CIP deviations is statisti-cally significant with the correct sign. That is, CIP deviations risewhen the growth rate of the central bank’s balance sheet in the non-U.S. jurisdiction outpaces that in the United States. This is becausesuch diverging monetary stances encourage non-U.S. financial insti-tutions to “search for yield” on USD-denominated assets and lead toan increase in demand for USD through the FX swap market. Thesigns of the estimated coefficients of banks’ default probabilities andVIX are unaffected by replacing the interest margin with the centralbank’s balance sheet in the regression equation.
3.5 Economic Significance of Explanatory Variables
In tables 1–4, we confirm that each explanatory variable is statis-tically significant. We next empirically examine an economic signif-icance of explanatory variables as the determinant factors of CIP
22As a sensitivity analysis, we estimate the models without the control vari-ables. The results are little changed from those reported in table 4.

308 International Journal of Central Banking September 2018
Tab
le4.
Impac
tof
Mon
etar
yPol
icy
Div
erge
nce
onC
IPD
evia
tion
s:Pan
elA
nal
ysi
s
Model
3
Model
1M
odel
2EU
R/U
SD
USD
/JP
YU
SD
/CH
FG
BP
/USD
BS
(Mon
thly
Gro
wth
−2.
8470
∗∗∗
−2.
8276
∗∗∗
−3.
8069
∗∗∗
−2.
1985
∗∗∗
−1.
6965
∗∗∗
Rat
e)U
S–
BS
(Mon
thly
(−9.
36)
(−6.
15)
(−4.
05)
(−5.
45)
(−3.
03)
Gro
wth
Rat
e)non
-US
BS
(Mon
thly
Gro
wth
−2.
5289
∗∗∗
Rat
e)U
S(−
4.34
)B
S(M
onth
lyG
row
th3.
0476
∗∗∗
Rat
e)non
-US
(8.5
1)E
DF
US
−0.
0334
∗−
0.03
32∗
0.02
98−
0.06
45∗∗
∗−
0.13
69∗∗
∗
(−1.
74)
(−1.
74)
(0.8
7)(−
2.64
)(−
4.14
)E
DF
non
-US
0.07
30∗∗
∗0.
0733
∗∗∗
0.10
10∗∗
∗0.
0224
0.09
330.
0857
∗
(5.6
0)(5
.63)
(6.8
2)(1
.28)
(0.6
4)(1
.68)
VIX
0.01
12∗∗
∗0.
0108
∗∗∗
0.01
26∗∗
∗0.
0141
∗∗∗
0.01
41∗∗
∗0.
0120
∗∗∗
(5.0
5)(5
.51)
(3.1
4)(3
.95)
(3.9
1)(4
.18)
Con
stan
t−
0.04
69−
0.04
60−
0.08
06∗∗
∗
(−1.
54)
(−1.
58)
(−3.
09)
Fix
edE
ffect
sY
esY
esY
esR
-squ
ared
0.56
0.56
0.72
RM
SE0.
120.
120.
050.
040.
060.
04N
o.of
Obs
erva
tion
s34
834
834
8
Note
s:Sa
mpl
eper
iod:
2008
:M12
–201
6:M
2.Fig
ures
inpa
rent
hese
sar
et-
stat
isti
cs.
Stan
dard
erro
rsar
eca
lcul
ated
base
don
per
iod
wei
ghts
(PC
SE)
met
hod.
***,
**,an
d*
indi
cate
sign
ifica
nce
atth
e1
per
cent
,5
per
cent
,an
d10
per
cent
leve
l,re
spec
tive
ly.

Vol. 14 No. 4 Deviations from Covered Interest Rate Parity 309
deviations. Specifically, based on the estimation result of equation(21) as an example, we compute the contribution of the explanatoryvariables to CIP deviations and see how the relative significanceof each variable to movements in CIP deviation has changed overtime.23
Figure 7 shows the result. Several observations are particularlynoteworthy. First and most importantly, the differential in growthrates of the central bank’s balance sheet has contributed to a risein CIP deviation, in particular since 2014. Its positive contributionis pronounced in two currency pairs, EUR/USD and USD/JPY.Second, banks’ liquidity needs proxied by VIX have not recentlyaffected CIP deviations, while they contributed to increasing CIPdeviations in the Lehman crisis. Third, banks’ default probabili-ties played the key role in increasing CIP deviations for the cur-rency pair EUR/USD during the euro-zone sovereign debt crisis,possibly through the substitution of funding source that is high-lighted in Ivashina, Scharfstein, and Stein (2015). It is also notablethat, for pairs USD/JPY and USD/CHF, banks’ default probabili-ties resulted in a net lowering of CIP deviation during the Lehmancrisis. This reflects the fact that the decline in banks’ creditworthi-ness at that time was disproportionately larger in the United Statesthan in Japan and Switzerland, leading to a smaller premium forUSD supply. A similar finding is also reported in Baba and Packer(2009a). In recent years, however, the contribution of banks’ defaultprobabilities has been very minor.
4. Discussion
In this section, we extend the analysis of the CIP deviation by turn-ing our attention to the impact of regulatory reforms (section 4.1)and the increasing presence of alternative arbitrageurs (section 4.2).
4.1 The Impact of Regulatory Reforms
As explained in section 2.4, the sensitivity of a CIP deviation to itsdeterminant factors is affected by regulatory reforms which change
23Using the estimation results based on other equations does not affect themain implications suggested by figure 7.

310 International Journal of Central Banking September 2018
Figure 7. Decomposition of CIP Deviation
Notes: Each panel shows the quarterly average of the decomposition of CIPdeviation based on the regression results of model 3 shown in table 4. Contribu-tions of constant terms are not depicted. “Central banks’ balance sheet” in eachpanel is the contribution of the difference in growth rates of the central banks’balance sheets. “EDF” in each panel is the sum of the contribution of EDF inthe non-U.S. jurisdiction and EDF in the United States, indicating the net effectof banks’ default probabilities. Residuals in each panel include the contributionof control variables.
the cost structure of global banks. We empirically examine whetherthe effect of regulatory reforms is reflected in the change in coeffi-cients of the model. To this end, we estimate model 1 in equation(16), using the same monthly series but with different sample periodsfor the four currency pairs, and see how the estimated coefficients
Vol. 14 No. 4 Deviations from Covered Interest Rate Parity 311
vary depending on the sample period. We set the starting period ofthe sample period to January 2007 and allow the ending point todiffer across examples. Note that the effect of new regulatory reformsis expected to appear in the later stages of the sample period. Specif-ically, against the backdrop of the U.S. MMF reform, institutionalinvestors have been switching from prime MMFs to governmentMMFs since fall 2015 (figure 5). The Volcker rule took effect in July2015. As for the Basel III leverage ratio framework, public disclosureof the leverage ratio started effective January 2015 based on the stan-dards published in January 2014. As for the U.S. SLR framework,U.S. banking agencies finalized the enhanced SLR standards in April2014, and advanced approaches firms (including the eight U.S. globalsystemically important banks, or G-SIBs) began making detailedpillar 3 public disclosure regarding the SLR in January 2015.24
The upper four graphs in figure 8 show the result. The x-axisrepresents the end of the sample period. The y-axis represents theestimated coefficient of each explanatory variable. The coefficientof the interest margin differential increases gradually as the endingpoint of the sample period is extended forward. This observation isconsistent with the model’s prediction in equation (12). That is, thesensitivity of CIP deviations to interest margin differentials increaseswith stricter financial regulation (i.e., higher θ and η). In contrast,the estimated coefficients of banks’ default probabilities (α, α∗) arestable across the sample periods. This is probably because a risein the value of parameters θ and η has the opposite effect on thesensitivity of a CIP deviation to banks’ default probabilities, asshown in equation (14).25
24The effects of the new leverage ratio framework are typically observed in thequarter-end spikes of USD funding costs, as follows: (i) Since around 2014, U.S.banks have deleveraged due partly to the U.S. SLR (in which a higher ratio thaninternational rules is required, and is calculated on the basis of daily averagedassets); (ii) non-U.S. banks, European banks in particular, which previously hadincreased positions in the U.S. money market, have started to shrink their bal-ance sheets at quarter-ends since the middle of 2014, partly to hold down theleverage ratio at quarter-ends (in many countries, although not in the UnitedStates, banks report only the leverage ratio at quarter-ends); (iii) at quarter-ends, U.S. banks increase market-making and arbitrage-trading activities in themoney market at higher rates, inclusive of higher costs posed by regulation.
25The estimated coefficient of VIX is also stable, although equation (13) sug-gests that the sensitivity of a CIP deviation to liquidity needs (V, V ∗) rises with
312 International Journal of Central Banking September 2018
In order to examine whether the change in the coefficient of theinterest margin differential is statistically significant, we estimatemodel 1 with a dummy variable (DUMT
t ), which takes zero fromJanuary 2007 to a point before the period T and takes unity fromperiod T to February 2016. Using this variable, we estimate the fol-lowing panel equation for i = the euro area, Japan, Switzerland, andthe United Kingdom.
Δit = (δT + δDT × DUMT
t )[(q∗t − r∗
t ) − (qit − rit)]
+ βT αit + β∗T α∗
t + λT VIXt + cTi + εTit, (22)
where DUMTt =
{0, t < T
1, T � t
The lower two graphs in figure 8 show the estimation result. They-axis stands for estimated coefficients δT and δD
T , and the x-axisstands for the period T . Both of the parameters are positive andstatistically significant. While the estimated coefficient δT is stable,δDT rises as the period T is extended forward. Specifically, the estima-
tion result suggests that the sensitivity of CIP deviations to interestmargin differentials becomes higher from around 2014, which cor-responds to the period when the effect of new regulatory reformsrelated to the parameters θ and η is expected to appear. The sen-sitivity of CIP deviations in 2015 is about two times higher thanbefore.
4.2 Real Money Investors as Alternative Arbitrageurs
While arbitrage trading activities by banks have declined due toregulatory reforms, real money investors, such as asset manage-ment companies, SWFs, and foreign official reserve managers, haveincreased their presence as suppliers of USD in the FX swap mar-ket.26 The existence of dollar funding premiums in the swap marketsignifies an opportunity for suppliers of USD to obtain yen funding
higher θ and η. This may be related to the fact that VIX is an imperfect measureof liquidity needs, as we have discussed.
26See Arai et al. (2016) and Nakaso (2017) for details.

Vol. 14 No. 4 Deviations from Covered Interest Rate Parity 313
Figure 8. Impact of Regulatory Reformson CIP Deviations
Notes: For panel A, the x-axis denotes the end of the sample period used toestimate the coefficient of the variable which is depicted in the y-axis. Dottedlines indicate 95 percent confidence intervals. For panel B, the x-axis denotes thestarting period from which the dummy variable takes unity. Dotted lines indicate95 percent confidence intervals.
314 International Journal of Central Banking September 2018
at a very low rate. As a result, real money investors that have dol-lars to spare can invest in Japanese government securities, even ifthe nominal yields on such paper are zero or negative, and secureyields as good as or higher than U.S. government securities withouttaking on foreign exchange risk.27 Indeed, the proportion of foreignholders of Japanese T-bills has increased from about 30 percent in2014 to 50 percent in 2016. In the following, we empirically assessthe role of real money investors in the FX swap market, by assum-ing that their total AUM is captured by the wealth endowment ofarbitrageurs (W ∗) in our model.
4.2.1 Methodology
Based on equations (10) and (11), we first estimate the followingequations for USD/JPY:28
Δt = δ∗1 (q∗
t − r∗t ) + δ1 (qt − rt) + β1αt + β∗
1α∗t
+ λ1VIXt + c1 + v1t (23)
St = δ∗2 (q∗
t − r∗t ) + δ2 (qt − rt) + β2αt + β∗
2α∗t
+ λ2VIXt + c2 + v2t. (24)
Here, v1t and v2t are error terms, which represent banks’ liquidityneeds (V, V ∗) unexplained by VIX and the wealth endowment ofarbitrageurs (W ∗). We next decompose these error terms (v1t, v2t)
27For example, the Reserve Bank of Australia puts more than half of its for-eign reserves into yen and then swaps most of them back into Australian dollarsand American dollars. Reserve Bank of Australia (2016) explains as follows: “Ashas been the case for some years, when the costs of hedging currency risk aretaken into account, yields on short-dated Japanese investments have generallyexceeded those available in the other currencies in the Reserve Bank’s portfolio.Reflecting this, the bulk of the foreign currency the Bank obtains from swapsagainst Australian dollars is Japanese yen. For the same reason, the Bank alsoswaps other currencies in its reserves portfolio against the yen to enhance returns.As a consequence, while the Bank’s exposure to changes in the value of the yenremains small (consistent with the yen’s 5 per cent allocation in the Bank’s bench-mark), around 58 per cent of the Bank’s foreign exchange reserves were investedin yen-denominated assets at the end of June 2016.”
28The monthly volume of FX swap transaction (S) is available only forUSD/JPY. We use the daily average turnover of FX swaps traded by foreignexchange brokers in Tokyo in each month.
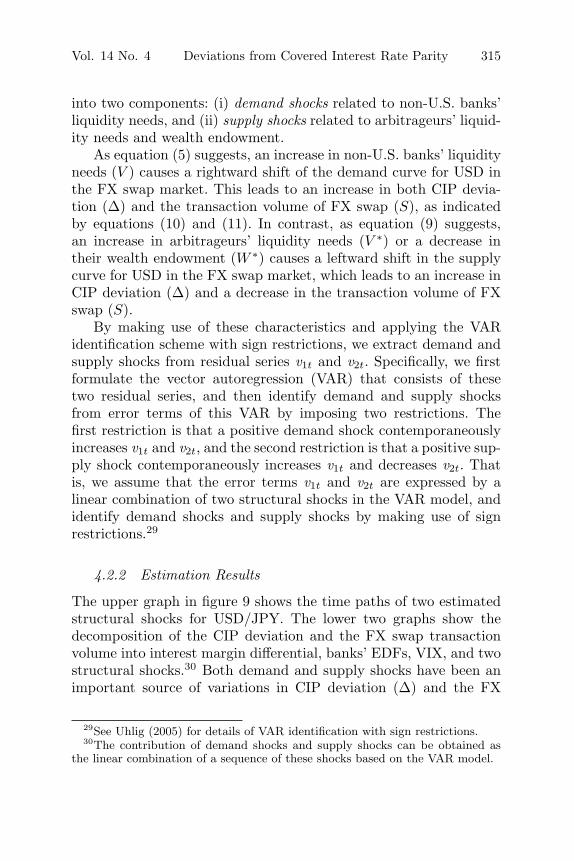
Vol. 14 No. 4 Deviations from Covered Interest Rate Parity 315
into two components: (i) demand shocks related to non-U.S. banks’liquidity needs, and (ii) supply shocks related to arbitrageurs’ liquid-ity needs and wealth endowment.
As equation (5) suggests, an increase in non-U.S. banks’ liquidityneeds (V ) causes a rightward shift of the demand curve for USD inthe FX swap market. This leads to an increase in both CIP devia-tion (Δ) and the transaction volume of FX swap (S), as indicatedby equations (10) and (11). In contrast, as equation (9) suggests,an increase in arbitrageurs’ liquidity needs (V ∗) or a decrease intheir wealth endowment (W ∗) causes a leftward shift in the supplycurve for USD in the FX swap market, which leads to an increase inCIP deviation (Δ) and a decrease in the transaction volume of FXswap (S).
By making use of these characteristics and applying the VARidentification scheme with sign restrictions, we extract demand andsupply shocks from residual series v1t and v2t. Specifically, we firstformulate the vector autoregression (VAR) that consists of thesetwo residual series, and then identify demand and supply shocksfrom error terms of this VAR by imposing two restrictions. Thefirst restriction is that a positive demand shock contemporaneouslyincreases v1t and v2t, and the second restriction is that a positive sup-ply shock contemporaneously increases v1t and decreases v2t. Thatis, we assume that the error terms v1t and v2t are expressed by alinear combination of two structural shocks in the VAR model, andidentify demand shocks and supply shocks by making use of signrestrictions.29
4.2.2 Estimation Results
The upper graph in figure 9 shows the time paths of two estimatedstructural shocks for USD/JPY. The lower two graphs show thedecomposition of the CIP deviation and the FX swap transactionvolume into interest margin differential, banks’ EDFs, VIX, and twostructural shocks.30 Both demand and supply shocks have been animportant source of variations in CIP deviation (Δ) and the FX
29See Uhlig (2005) for details of VAR identification with sign restrictions.30The contribution of demand shocks and supply shocks can be obtained as
the linear combination of a sequence of these shocks based on the VAR model.
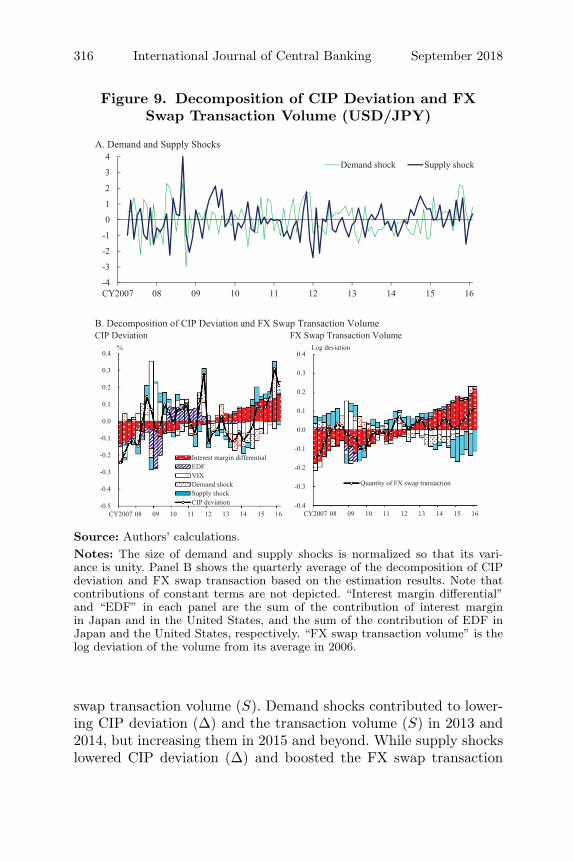
316 International Journal of Central Banking September 2018
Figure 9. Decomposition of CIP Deviation and FXSwap Transaction Volume (USD/JPY)
Source: Authors’ calculations.Notes: The size of demand and supply shocks is normalized so that its vari-ance is unity. Panel B shows the quarterly average of the decomposition of CIPdeviation and FX swap transaction based on the estimation results. Note thatcontributions of constant terms are not depicted. “Interest margin differential”and “EDF” in each panel are the sum of the contribution of interest marginin Japan and in the United States, and the sum of the contribution of EDF inJapan and the United States, respectively. “FX swap transaction volume” is thelog deviation of the volume from its average in 2006.
swap transaction volume (S). Demand shocks contributed to lower-ing CIP deviation (Δ) and the transaction volume (S) in 2013 and2014, but increasing them in 2015 and beyond. While supply shockslowered CIP deviation (Δ) and boosted the FX swap transaction

Vol. 14 No. 4 Deviations from Covered Interest Rate Parity 317
volume (S) in 2012 and 2013, the sign of the shocks’ impacts wasflipped in the middle of 2014, increasing CIP deviation (Δ) andlowering the transaction volume (S).
As regards supply shocks, we are unable to disentangle the con-tributions of V ∗ and W ∗, and are only able to evaluate the com-bined role played by liquidity needs of arbitrageurs and their wealthendowment. However, what we observe from the upper two graphsin figure 10 is a growing presence of SWFs of oil-producing countriesin the FX swap market. These graphs show that the correlation withoil price is negative for the impact of supply shocks on CIP deviationand positive for that on the FX swap transaction volume. In addi-tion, for both CIP deviation and the FX swap transaction volume,the absolute values of the correlation coefficients become recentlylarger than before, indicating that the relationship between supplyshocks and oil price has become tighter.
Market contacts indicate that SWFs in oil-producing countrieshave supplied USD in the FX swap market.31 This seems to holdtrue especially in the period from 2011 to the middle of 2014 whenoil prices were fairly high, which implies an increase in the wealthendowment (W ∗) of SWFs and hence the rightward shift of the sup-ply curve of USD in the FX swap market. Indeed, in this period,supply shocks tend to be negative (figure 9A), and they contributeto a decline in CIP deviation and an increase in the FX swap trans-action volume (figure 9B). Market contacts also say that since oilprices plummeted in the second half of 2014, the SWFs that had for-merly allocated their oil money in USD to the FX swap market havestarted to withdraw from the market. Such a development shouldappear as a negative shock in W ∗, which would cause a leftwardshift in the supply curve of USD in the FX swap market. Indeed,from mid-2014, supply shocks tend to be positive (figure 9A), andthey contribute to an increase in CIP deviation and a decline in theFX swap transaction volume (figure 9B).
Because statistics are not available on the portfolio of real moneyinvestors, such as SWFs and foreign official reserves, we cannot showdirect evidence of their impact on the FX swap market. However,other market contacts indicate that during the period of emerging
31See, for example, Arai et al. (2016).
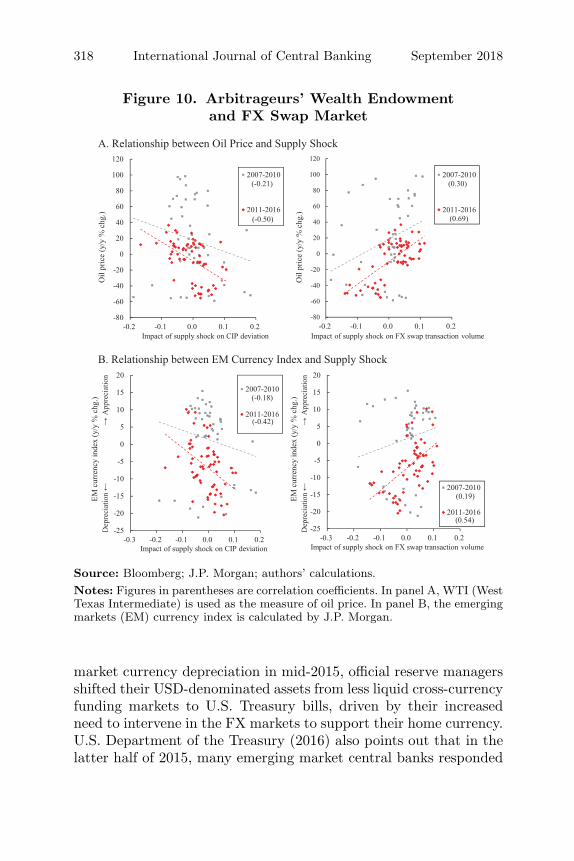
318 International Journal of Central Banking September 2018
Figure 10. Arbitrageurs’ Wealth Endowmentand FX Swap Market
Source: Bloomberg; J.P. Morgan; authors’ calculations.Notes: Figures in parentheses are correlation coefficients. In panel A, WTI (WestTexas Intermediate) is used as the measure of oil price. In panel B, the emergingmarkets (EM) currency index is calculated by J.P. Morgan.
market currency depreciation in mid-2015, official reserve managersshifted their USD-denominated assets from less liquid cross-currencyfunding markets to U.S. Treasury bills, driven by their increasedneed to intervene in the FX markets to support their home currency.U.S. Department of the Treasury (2016) also points out that in thelatter half of 2015, many emerging market central banks responded

Vol. 14 No. 4 Deviations from Covered Interest Rate Parity 319
to capital outflows by intervening in FX markets to defend their cur-rencies, and the intervention caused central banks to dip into theirstocks of foreign exchange reserves. Such a behavior of emerging mar-ket central banks (reserve managers) is reflected in the supply shockin our model, i.e., a decline in arbitrageurs’ wealth endowment (W ∗).
The lower two graphs in figure 10 imply a growing presence ofemerging market FX reserves as a USD supplier in the FX swapmarket. These graphs show that the correlation with the emergingmarkets currency index is negative for the impact of supply shocks onCIP deviation and positive for that on FX swap transaction volume.In addition, for both CIP deviation and the FX swap transactionvolume, the absolute values of the correlation coefficients becomerecently larger than before, indicating that the relationship betweensupply shock and emerging market currencies has become tighterthrough the reserve managers’ behavior.
5. Conclusion
This paper theoretically and empirically shows that CIP deviationis driven by several factors: global interest rate differentials, banks’default probabilities, banks’ liquidity needs, and the wealth endow-ment of arbitrageurs. We find that in recent years the key driverof CIP deviation has changed from banks’ default probabilities toglobal interest rate differentials. The sensitivity of CIP deviations tovariation in global interest rate differentials has risen due to regula-tory reforms which increase the marginal cost of global banks’ dollarfunding.
To conclude, we would like to note the implications of our modelfor financial stability. While arbitrage trading by banks has declineddue to regulatory reforms, real money investors have come to playa greater role in the supply of USD in the FX swap market. How-ever, as in 2015 when emerging market currencies depreciated andoil prices declined, real money investors such as foreign officialreserve managers and SWFs are not stable or reliable USD liquidityproviders. When a severely adverse shock occurs in the global finan-cial system, real money investors may sell off their USD-denominatedassets and reduce the supply of USD to non-U.S. financial institu-tions in the FX swap market. This then induces non-U.S. finan-cial institutions to cut their USD-denominated assets, which may

320 International Journal of Central Banking September 2018
amplify the sale of financial assets by real money investors. In addi-tion, such an adverse shock to real money investors is amplifiedby stricter financial regulations, which increase the marginal costof banks’ dollar funding. Since they make the demand and supplycurves of USD in the FX swap market steeper, the leftward shift ofthe supply curve due to a fall in the AUM of real money investorsis more easily translated into an even higher CIP deviation, whichresults in a larger cut in non-U.S. banks’ USD-denominated assets.Although an economic significance of such amplification mechanismneeds to be empirically examined, our theoretical model suggeststhat the potential vulnerabilities related to the financial regulationsare hidden in the FX swap market.32
Appendix. FX Swap Market andGlobal Financial Stability
Differentiating equations (6) and (10) with respect to non-U.S.banks’ default probability (α) yields the following comparativestatics:
∂Δ∂α
> 0,∂LUS
∂α< 0. (25)
Indeed, historically, non-U.S. bank’s creditworthiness significantlyaffected their overseas dollar lending through variations in CIP devi-ation. During both Japan’s banking crisis in the late 1990s and theeuro-zone sovereign debt crisis in 2011, an increase in CIP deviationbrought about by a worsening of non-U.S. banks’ creditworthinesswas followed by a cut in their dollar lending. In the former crisis, asPeek and Rosengren (2001, 2002) document, because of the deterio-ration in Japanese banks’ balance sheets and an increase in the dollarfunding premium (the so-called Japan premium), they cut lending—in particular, wholesale lending to the United States. As for the lattercrisis, Ivashina, Scharfstein, and Stein (2015) document that euro-zone banks cut their dollar lending more than their euro lending.
Our empirical analysis suggests, however, that the linkagebetween banks’ creditworthiness and CIP deviation has been weak-ened in recent years. As explained in section 3.5, the role of banks’
32See the appendix for details.

Vol. 14 No. 4 Deviations from Covered Interest Rate Parity 321
creditworthiness in determining CIP deviations has been supplantedby global interest rate differentials, which reflect monetary policydivergence among advanced economies. This then begs the ques-tion, how does monetary policy divergence, especially resultingfrom changes in the Federal Reserve’s policy stance, affect non-U.S.banks’ dollar lending? Although a rise in the U.S. interest margin(q∗ − r∗) encourages non-U.S. banks to “search for yield” on USD-denominated assets (i.e., ∂LUS
∂(q∗−r∗) > 0), regulatory reforms limit theimpact of U.S. monetary policy on their activities, as the followingcomparative statics show:33
∂(
∂LUS∂(q∗−r∗)
)
∂θ,
∂(
∂LUS∂(q∗−r∗)
)
∂η< 0. (26)
Because regulatory reforms (i.e., higher θ and η in our model) raisethe marginal costs of USD funding and increase the sensitivity ofCIP deviations to interest margin differentials (see equation (12)),such reforms dampen the impact of a rise in the U.S. interest mar-gin (q∗ − r∗) on non-U.S. banks’ lending and investments (LUS) andprevent them from engaging in excessive “search for yield” activities.
It should be noted, however, that the regulatory reforms bringabout dual impacts on the global financial system. Although stricterregulations (i.e., higher θ and η in our model) limit the impactof monetary policy divergence on non-U.S. financial institutions’“search for yield” activities, they amplify the impact of liquidityshortage of banks and an adverse wealth shock to arbitrageurs.Specifically, the following comparative statics are obtained fromequations (6) and (10):
∂(
∂LUS∂V
)
∂θ,
∂(
∂LUS∂V
)
∂η,
∂(
∂LUS∂V ∗
)
∂θ,
∂(
∂LUS∂V ∗
)
∂η< 0, and
∂(
∂LUS∂W ∗
)
∂θ,
∂(
∂LUS∂W ∗
)
∂η> 0. (27)
33Unlike CIP deviation Δ in equation (10), USD-denominated loan LUS inequation (6) cannot be expressed as a function of an interest margin differential.We therefore derive a change in USD-denominated loans LUS only with respectto a change in interest margin in USD. It should also be noted that similar tothe discussion in section 2, we maintain the assumption that γη > θτ here.

322 International Journal of Central Banking September 2018
An increase in banks’ liquidity needs and a decline in the totalAUM of arbitrageurs lead to a tightening of demand–supply bal-ance of USD in the FX swap market and a higher CIP deviation,which then induces non-U.S. banks to cut their USD-denominatedassets. This effect is amplified by stricter regulations which increasethe marginal costs of banks’ USD funding, because they make thedemand and supply curves of USD in the FX swap market steeper.The leftward shift of the steeper supply curve and the rightward shiftof the steeper demand curve lead to a much higher CIP deviationand hence a further decrease in non-U.S. banks’ USD-denominatedassets. If their lending and investments are cut rapidly and on alarge scale, this may destabilize the global financial system.
Data Appendix
CIP Deviation (Figure 2, Tables 1–4)
CIP deviation (Δ) is calculated from equation (2). For the forwarddiscount rate (X1/X0) of each currency pair (EUR/USD, USD/JPY,USD/CHF, and GBP/USD), we use FX spot (middle rates) and for-ward rates (middle rates). For interest rates (r∗, r), LIBOR (offeredrates) is used in figure 2 and tables 1, 2, and 4, while OIS (middlerates) is used in table 3. All the data are taken from Bloomberg.We take the monthly average from the daily closing price data toconstruct the monthly series.
Interest Margin (Figure 6 and Tables 1–3)
Interest margin is calculated as the ten-year government bond yieldless the three-month OIS rate. For the government bond yield in theeuro area, we use the German bond yield so as to avoid the possibil-ity that country-specific sovereign risks are reflected in the yield. Weuse bid rates for the government bond yield of Japan and Switzer-land, and middle rates for others. We take the monthly average ofthe daily closing price data to construct the monthly series. All thedata are taken from Bloomberg.
EDF (Figure 2 and Tables 1–4)
As for the default risk (αi) of banks that are headquartered in juris-diction i, we use the average of the EDF of all G-SIBs in jurisdiction

Vol. 14 No. 4 Deviations from Covered Interest Rate Parity 323
i. For the euro area, the average of the EDF of all G-SIBs in France,Germany, and Italy is used. As for the default risk of an arbitrageur(α∗), we use the average of the EDF of all G-SIBs in the UnitedStates. We use the one-year EDF of each bank, which is calculated byMoody’s. We take the monthly average of the daily data to constructthe monthly series.
CDS (Table 3)
Similar to the treatment of the EDF series, we use the average of theCDS of G-SIBs in each jurisdiction. For the euro area, we use thedata for France, Germany, and Italy. We use the five-year fair-valueCDS of each bank, which is calculated by Moody’s. We take themonthly average of the daily data to construct the monthly series.
VIX (Tables 1–4)
We use the CBOE Volatility Index as VIX. The data are takenfrom Bloomberg. We take the monthly average of the daily data toconstruct the monthly series.
Monthly Growth Rate of the Central Bank’sBalance Sheet Size (Table 4)
The data of the balance sheet of the Bank of England and theSwiss National Bank are taken from the websites of these banks,and those of the other central banks are taken from the FederalReserve Economic Data (FRED) database. The figures are as of theend of each month. We apply seasonal adjustments to these seriesby the X12-ARIMA.
References
Akram, Q. F., D. Rime, and L. Sarno. 2008. “Arbitrage in the For-eign Exchange Market: Turning on the Microscope.” Journal ofInternational Economics 76 (2): 237–53.
Arai, T., Y. Makabe, Y. Ookawara, and T. Nagano. 2016. “RecentTrends in Cross-Currency Basis.” Bank of Japan Review No.2016-E-7.

324 International Journal of Central Banking September 2018
Avdjiev, S., and E. Takats. 2016. “Monetary Policy Spillovers andCurrency Networks in Cross-Border Bank Lending.” BIS Work-ing Paper No. 549.
Baba, N., and F. Packer. 2009a. “From Turmoil to Crisis: Disloca-tions in the FX Swap Market Before and After the Failure ofLehman Brothers.” BIS Working Paper No. 285.
———. 2009b. “Interpreting Deviations from Covered Interest Par-ity during the Financial Market Turmoil of 2007–08.” Journal ofBanking and Finance 33 (11): 1953–62.
Bank of Japan. 2016. “Financial System Report.” April.Borio, C., L. Gambacorta, and B. Hofmann. 2015. “The Influence
of Monetary Policy on Bank Profitability.” BIS Working PaperNo. 514.
Coffey, N., W. B. Hrung, and A. Sarkar. 2009. “Capital Constraints,Counterparty Risk, and Deviations from Covered Interest RateParity.” Staff Report No. 393, Federal Reserve Bank of New York.
Gambacorta, L., B. Hofmann, and G. Peersman. 2014. “The Effec-tiveness of Unconventional Monetary Policy at the Zero LowerBound: A Cross-Country Analysis.” Journal of Money, Creditand Banking 46 (4): 615–42.
He, D., E. Wong, A. Tsang, and K. Ho. 2015. “Asynchronous Mone-tary Policies and International Dollar Credit.” HKIMA WorkingPaper No. 19/2015.
Ivashina, V., D. S. Scharfstein, and J. C. Stein. 2015. “Dollar Fund-ing and the Lending Behavior of Global Banks.” Quarterly Jour-nal of Economics 130 (3): 1241–81.
Kimura, T., and J. Nakajima. 2016. “Identifying Conventional andUnconventional Monetary Policy Shocks: A Latent ThresholdApproach.” B.E. Journal of Macroeconomics 16 (1): 277–300.
McGuire, P., and G. von Peter. 2009. “The US Dollar Shortage inGlobal Banking.” BIS Quarterly Review (March): 47–63.
Nakaso, H. 2017. “Monetary Policy Divergence and Global FinancialStability.” Speech by the Deputy Governor of the Bank of Japanat a meeting hosted by the International Bankers Association ofJapan, Tokyo, January 20.
Peek, J., and E. S. Rosengren. 2001. “Determinants of the JapanPremium: Actions Speak Louder than Words.” Journal of Inter-national Economics 53 (2): 283–305.

Vol. 14 No. 4 Deviations from Covered Interest Rate Parity 325
———. 2002. “Japanese Banking Problems: Implications for South-east Asia.” In Banking, Financial Integration, and InternationalCrises, Vol. 3, ed. L. Hernandez and K. Schmidt-Hebbel, 303–32(chapter 10). Central Bank of Chile.
Pinnington, J., and M. Shamloo. 2016. “Limits to Arbitrage andDeviations from Covered Interest Rate Parity.” Staff DiscussionPaper No. 2016-4, Bank of Canada.
Pozsar, Z. 2016. “Global Money Notes #8: From Exorbitant Privi-lege to Existential Trilemma.” Credit Suisse.
Reserve Bank of Australia. 2016. “Operations in Financial Markets.”Annual Report.
Rogers, J. H., C. Scotti, and J. Wright. 2014. “Evaluating Asset-Market Effects of Unconventional Monetary Policy: A Cross-Country Comparison.” International Finance Discussion PaperNo. 1101, Board of Governors of the Federal Reserve System.
Shin, H. S. 2016. “Global Liquidity and Procyclicality.” Speech atWorld Bank Conference “The State of Economics, The State ofthe World,” Washington, DC, June 8.
Sushko, V., C. Borio, R. McCauley, and P. McGuire. 2016. “The Fail-ure of Covered Interest Parity: FX Hedging Demand and CostlyBalance Sheets.” BIS Working Paper No. 590.
Terajima, Y., H. Vikstedt, and J. Witmer. 2010. “The Impact ofthe Financial Crisis on Cross-Border Funding.” Financial SystemReview (Bank of Canada) (June): 33–40.
Uhlig, H. 2005. “What Are the Effects of Monetary Policy on Out-put? Results from an Agnostic Identification Procedure.” Journalof Monetary Economics 52 (2): 381–419.
U.S. Department of the Treasury. 2016. “Foreign Exchange Policiesof Major Trading Partners of the United States.” Report.