development, validation and resolving … bulk drug and in pharmaceutical dosage forms by resolving...
TRANSCRIPT
Research Article
DEVELOPMENT, VALIDATION AND RESOLVING MASS BALANCE ISSUE BY USING ALTERNATIVE OXIDIZING REAGENTS FOR THE DETERMINATION OF METFORMIN
HYDROCHLORIDE IMPURITIES IN API AND PHARMACEUTICAL DOSAGE FORMS
T. V. RAGHAVA RAJU 1, 2*, T.S.S. JAGAN MOHAN 1, S.V.S.G. BHAVANI PRASAD 1, P. SURESH KUMAR 1, N. SOMESWARA RAO 2 AND I. MRUTYUNJAYA RAO 2
1 Analytical Research and Development, Integrated Product Development, Dr. Reddy’s Laboratories Ltd., Bachupally, Hyderabad- India. 2School of Chemistry, Andhra University, Visakhapatnam- India. Email: [email protected]
Received: 16 June 2013, Revised and Accepted: 10 July 2013
ABSTRACT
A novel, sensitive, stability indicating RP-HPLC method has been developed for the quantitative estimation of Metformin Hydrochloride impurities in both bulk drugs and pharmaceutical dosage forms. Effective chromatographic separation was achieved on a C8 stationary phase with simple mobile phase combination delivered in a isocratic mode and quantitation was by ultraviolet detection at 218 nm. The mobile phase consists mixture of buffer and methanol delivered at a flow rate of 1.0 ml/min. Regression analysis showed an r value (correlation coefficient) grater than 0.999 for Metformin Hydrochloride and its impurities. Mass balance issue was observed in peroxide stress and resolved by using alternative oxidizing reagents. The developed method was validated as per ICH guidelines and found to be linear, accurate, precise, specific, robust and rugged.
Keywords: Metformin Hydrochloride, Impurities, Validation, RP-HPLC, ICH guidelines
INTRODUCTION
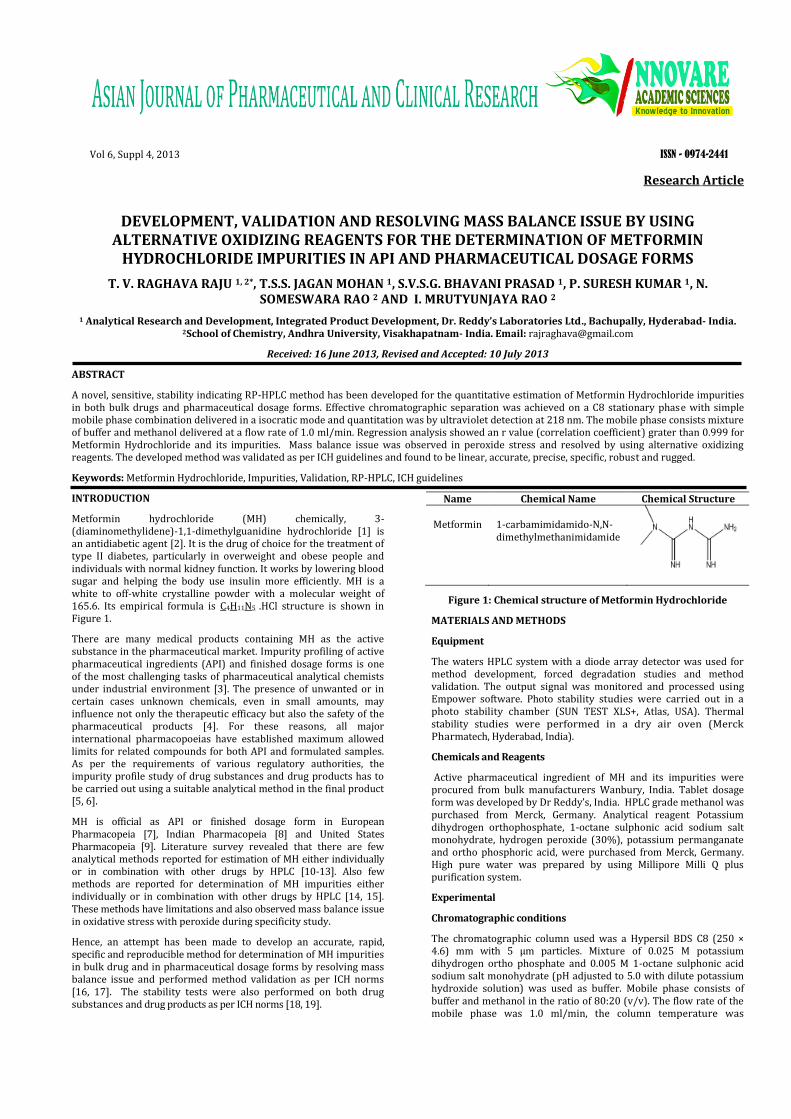
Metformin hydrochloride (MH) chemically, 3-(diaminomethylidene)-1,1-dimethylguanidine hydrochloride [1] is an antidiabetic agent [2]. It is the drug of choice for the treatment of type II diabetes, particularly in overweight and obese people and individuals with normal kidney function. It works by lowering blood sugar and helping the body use insulin more efficiently. MH is a white to off-white crystalline powder with a molecular weight of 165.6. Its empirical formula is C4H11N5 .HCl structure is shown in Figure 1.
There are many medical products containing MH as the active substance in the pharmaceutical market. Impurity profiling of active pharmaceutical ingredients (API) and finished dosage forms is one of the most challenging tasks of pharmaceutical analytical chemists under industrial environment [3]. The presence of unwanted or in certain cases unknown chemicals, even in small amounts, may influence not only the therapeutic efficacy but also the safety of the pharmaceutical products [4]. For these reasons, all major international pharmacopoeias have established maximum allowed limits for related compounds for both API and formulated samples. As per the requirements of various regulatory authorities, the impurity profile study of drug substances and drug products has to be carried out using a suitable analytical method in the final product [5, 6].
MH is official as API or finished dosage form in European Pharmacopeia [7], Indian Pharmacopeia [8] and United States Pharmacopeia [9]. Literature survey revealed that there are few analytical methods reported for estimation of MH either individually or in combination with other drugs by HPLC [10-13]. Also few methods are reported for determination of MH impurities either individually or in combination with other drugs by HPLC [14, 15]. These methods have limitations and also observed mass balance issue in oxidative stress with peroxide during specificity study.
Hence, an attempt has been made to develop an accurate, rapid, specific and reproducible method for determination of MH impurities in bulk drug and in pharmaceutical dosage forms by resolving mass balance issue and performed method validation as per ICH norms [16, 17]. The stability tests were also performed on both drug substances and drug products as per ICH norms [18, 19].
Name Chemical Name Chemical Structure
Metformin 1-carbamimidamido-N,N-dimethylmethanimidamide
Figure 1: Chemical structure of Metformin Hydrochloride
MATERIALS AND METHODS
Equipment
The waters HPLC system with a diode array detector was used for method development, forced degradation studies and method validation. The output signal was monitored and processed using Empower software. Photo stability studies were carried out in a photo stability chamber (SUN TEST XLS+, Atlas, USA). Thermal stability studies were performed in a dry air oven (Merck Pharmatech, Hyderabad, India).
Chemicals and Reagents
Active pharmaceutical ingredient of MH and its impurities were procured from bulk manufacturers Wanbury, India. Tablet dosage form was developed by Dr Reddy’s, India. HPLC grade methanol was purchased from Merck, Germany. Analytical reagent Potassium dihydrogen orthophosphate, 1-octane sulphonic acid sodium salt monohydrate, hydrogen peroxide (30%), potassium permanganate and ortho phosphoric acid, were purchased from Merck, Germany. High pure water was prepared by using Millipore Milli Q plus purification system.
Experimental
Chromatographic conditions
The chromatographic column used was a Hypersil BDS C8 (250 × 4.6) mm with 5 µm particles. Mixture of 0.025 M potassium dihydrogen ortho phosphate and 0.005 M 1-octane sulphonic acid sodium salt monohydrate (pH adjusted to 5.0 with dilute potassium hydroxide solution) was used as buffer. Mobile phase consists of buffer and methanol in the ratio of 80:20 (v/v). The flow rate of the mobile phase was 1.0 ml/min, the column temperature was
Vol 6, Suppl 4, 2013 ISSN - 0974-2441

T V Raghava Raju et al. Asian J Pharm Clin Res, Vol 6, Suppl 4, 2013, 107-115
108
maintained at 25˚C and the detection was monitored at a wave length of 218 nm. The injection volume was 10 µl and mobile phase was used as a diluent.
Preparation of Standard and System Suitability Solution
Prepared individual stock solutions for MH, impurity B, C, D, E (Each 500 µg/mL) and impurity A (100 µg/mL) by dissolving an appropriate amount in diluent. Working solution was prepared from above stock solutions for related substances determination (1.25 µg/mL of MH & impurity D, 0.25 µg/mL of impurity A). A mixture of all impurities (0.25 µg/mL of impurity A and 1.25 µg/mL of remaining impurities) along with MH (1250 µg/mL of MH) was also prepared in diluent. Stock solutions were used for method development and method validation.
Preparation of Sample Solution
Twenty MH tablets (1000 mg) were weighed and the average weight was calculated. The tablets were crushed in to fine powder and powder equivalent to 250 mg of MH was transferred in to a 200 ml volumetric flask. Approximately 130 ml of diluent was added, shaked to disperse the material and sonicated for 30 minutes with intermediate shaking. The solution was then diluted to 200 ml and centrifuged at 3000 rpm for 10 min. The supernatant (1250 µg/mL of MH) was collected and filtered through a 0.45 µm pore size nylon 66-membrane filter. The filtrate was used as sample solution.
Method Validation
The method was validated for specificity, linearity, precision, accuracy, robustness and ruggedness, according to ICH guidelines [17].
System suitability
Having optimized the efficiency of a chromatographic separation the quality of the chromatography was monitored by applying the following system suitability tests: resolution, asymmetric factor and theoretical plates. The system suitability method acceptance criteria set in each chromatogram of standard and System Suitability Solution was: resolution between any of the components > 2.0, tailing factor ≤2.0 and theoretical plates >2500.
Precision
The precision of the related substance method was checked by injecting six individual preparations of MH (1250 µg/mL) spiked with 0.02% for impurity A and 0.1% for remaining impurities. % RSD of % individual impurity from six preparations was calculated.
The intermediate precision (ruggedness) of the method was also evaluated by a different analyst, different column and different instrument on different day.
Limit of detection (LOD) and limit of quantification (LOQ)
The detection limit of an individual analytical procedure is the lowest amount of analyte in a sample which can be detected but not necessarily quantitated as an exact value. The signal-to-noise ratio was determined by comparing the peak heights of the known concentrations of each impurity with that of the baseline noise obtained from the blank samples. A signal to noise ratio between 2.0 to 3.4 is generally considered acceptable for estimating the detection limit. The detection limits if individual compounds were different, due to their peak shapes, retention time and extinction coefficient. Limit of quantification is the minimum concentration at which the analyte can be reliably quantified with acceptable accuracy and precision, where the determination of signal to noise ratio is performed by comparing measured signals from samples with known low concentrations of analyte with those of blank samples. A typical signal to noise ratio is 9.0 to 11.4 is generally considered acceptable for estimating the quantification limit. The LOD and LOQ for MH and its impurities were estimated, the precision was also determined at the LOQ level, and the % RSD was calculated for the peak area of MH and its impurities.
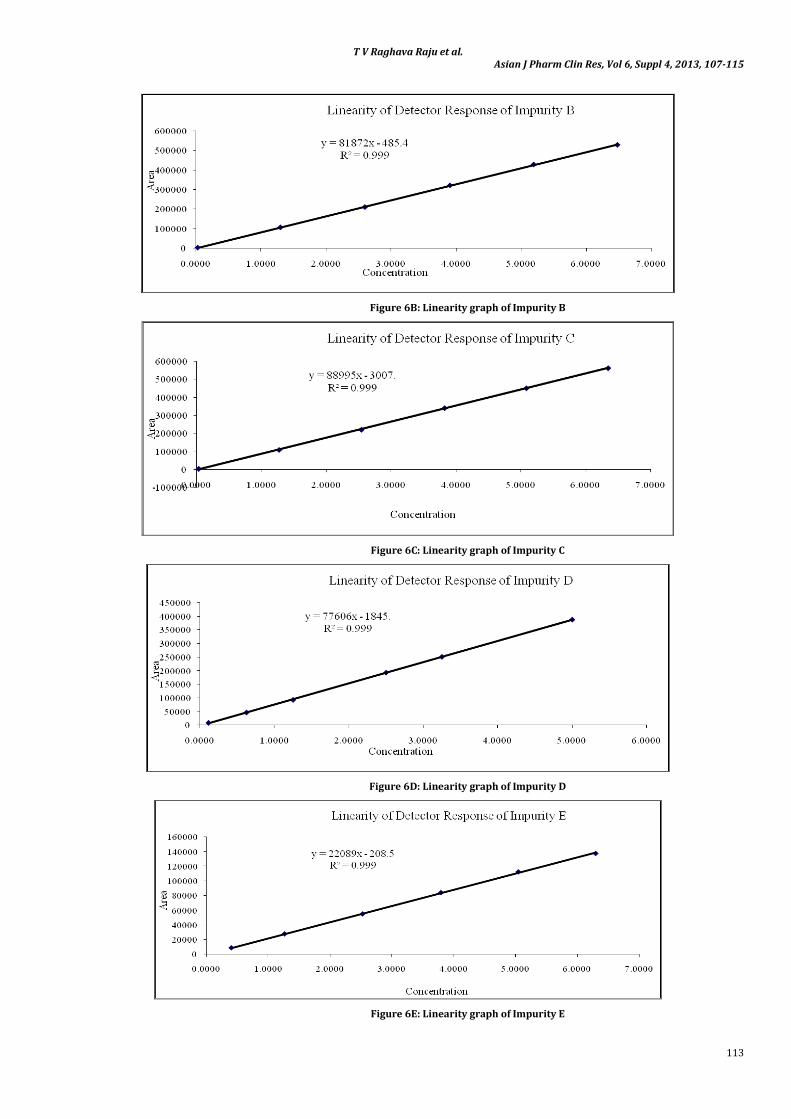
Linearity
The detector response for all five impurities and MH was assessed by injecting six separately prepared solutions covering the range of LOQ to 200 % of the normal limit concentration i.e., 0.02% for impurity A and 0.1% for remaining impurities. The correlation coefficients, slopes and Y-intercepts of the calibration curve were studied.
Accuracy
The accuracy of an analytical procedure expresses the closeness of agreement between the true value and the observed value. The study was carried out in triplicate by spiking impurities on test preparation (1250 µg/mL of MH) from LOQ to 200% (LOQ, 25%, 50%, 100%, 150% and 200%) of the normal limit concentration i.e., 0.02% for impurity A and 0.1% for remaining impurities. The percentage of recoveries for impurity A, impurity B, impurity C, impurity D and impurity E were calculated.
Robustness
To determine the robustness of the developed method, experimental conditions were deliberately changed and the resolution between closely eluting peaks were evaluated. The flow rate of the mobile phase was 1.0 ml/min. To study the effect of the flow rate on the developed method, 0.2 units of flow were changed (i.e. 0.8 and 1.2 ml/min). The effect of column temperature on the developed method was studied at 20 and 30˚C (Instead of 25°C). The effect of pH on resolution of impurities was studied by varying ± 0.2 pH units (i.e. 4.8 and 5.2) and the mobile phase composition was changed ±10% from the initial composition. In all the above varied conditions, the component of the mobile phase was held constant.
Stability in solution and in the mobile phase
MH spiked test solution was prepared in the diluent by leaving the test solutions at room temperature. The spiked solution was injected at 0, 24, 48 hrs time intervals. The impurity content was calculated, and the consistency in the % of each impurity at each interval was checked. The prepared mobile phase was kept constant during the study period. The mobile phase study was demonstrated by injecting the freshly prepared sample solution at different time intervals (0-2 days).
RESULTS AND DISCUSSION
Optimization of chromatographic conditions
Pharmacopeia methods and available literature methods were verified for the determination of MH impurities (Figure 2) in both API and pharmaceutical dosage forms. The observations along with method details were mentioned in the Table 1. Due to limitations in the existing methods, method development was initiated to overcome blank interference at impurity A peak and reproducible separation between other impurities.
S.No Name Structure IUPAC name 1 Impurity
A
Cyanoguanidine
2 Impurity B
4,6-Diamino-1,3,5-triazin-2yl)guanidine Nitrate
3 Impurity C
N,N-dimethyl-1,3,5-triazine-2,4,6-triamine

T V Raghava Raju et al. Asian J Pharm Clin Res, Vol 6, Suppl 4, 2013, 107-115
109
4 Impurity D
1,3,5-triazine-2,4,6-triamine
5 Impurity E
1-methylbiguanide
Figure 2: Chemical structures of Metformin impurities
Based on the observations from the existing methods selected mid polar column (Hypersil BDS C8, 250 x 4.6, 5 micron) for separation between un retained blank peak and impurity A peak. Mixture of 0.025 M monobasic potassium phosphate buffer and 0.005 M 1-
octane sulphonic acid sodium salt monohydrate, pH adjusted to 5.0 with dilute potassium hydroxide solution was used as buffer. Tried different organic modifiers like acetonitrile and methanol in the mobile phase. Better separation was observed when methanol was used as organic modifier compared to acetonitrile. The chromatographic separation was finalized by isocratic program with the mobile phase containing buffer and methanol in the ratio of 80:20 (v/v). The flow rate of the mobile phase was 1.0 ml/min, the column temperature was maintained at 25˚C and the detection was monitored at a wave length of 218 nm. The injection volume 10 µl. All the impurities were well separated with a resolution greater than 2, typical retention times of MH, impurity A, impurity B, impurity C, impurity D and impurity E are 11.259 min, 3.145 min, 20.652 min, 25.402 min,5.690 min and 9.139 min respectively. The typical overlay chromatogram of blank and system suitability solution, placebo and spiked sample were shown in Figure 3 & Figure 4.
Table: 1: Observations from existing literature methods
Method Chromatographic conditions Impurities and Limits
Observations
Indian Pharmacopeia (API and tablets)
Inertsil ODS 3V 250 x 4.6mm,5u column Buffer : 1 g each of sodium heptane sulphonate and sodium chloride to 1800 ml water adjust pH to 3.85 with phosphoric acid and dilute to 2000 ml with water Mobile Phase : Buffer : Acetonitrile (90:10) V/V
Impurity A-0.02% Highest Unknown-0.1%
1) Impurity A peak is eluting between two blank peaks with less resolution. Remaining impurities were not monitored. 2 Tried separation for remaining impurities but impurity E was merging with Metformin.
USP (API and Immediate release tablets)
Partsil 10 SCX 250 x 4.6mm,10u column Mobile Phase : Dissolve 17 g of Ammonium dihydrogen phosphate in 1000 water , pH adjusted to 3.0 with dilute OPA
Impurity A-0.02% Highest Unknown-0.1%
1) Column lot to lot, huge variation in the retention times of all the components was observed. 2) Impurity quantities may not be available every time for identification.
EP API Zorbax 10 SCX 250 x 4.6mm,10u column Mobile Phase : 17 g/L solution of ammonium dihydrogen phosphate R adjusted to pH 3.0 with phosphoric acid R.
Impurity A-0.02% Highest Unknown-0.1%
Literature Method 1
Partsil 10 SCX 250 x 4.6mm,10u column Mobile Phase : 1.7% (w/v) ammonium dihydrogen phosphate water solution, with pH adjusted to 3.1 using 85% orthophosphoric acid
Impurity A -0.02% Impurity B,C,D - 0.1%
USP (SR tablets) MicroBondapak C18 3.9 x 30cm,10u column Buffer : Dissolve 1 g each of sodium heptane sulphonate and sodium chloride to 1800 ml water adjust pH to 3.85 with 0.06m OPA and dilute to 2000 ml with water Mobile Phase : Buffer : Acetonitrile (90:10) V/V
Impurity B-0.1% Impurity C-0.1% Total Imp-0.6%
1) Only two impurities were monitored. When tried for other impurities, impurity A was merging with blank peak.
Literature Method 2
Inertsil ODS 2V 250 x 4.6mm,5u column Buffer : Dissolve 2.34 g of sodium octane sulphonate in 1000 ml water adjust pH to 3.0 with OPA Mobile Phase : Buffer :Acetonitrile (80:20) V/V
Impurity A-0.02% Impurity B, C, D, E- 0.1%
1) Negative peak was observed at the retention time of impurity A. 2) pH sensitive (RT pattern was changing with slight change in the pH of the mobile phase buffer)
Specificity
Specificity is the ability of the method to measure the analyte response in the presence of its potential impurities. Stress studies were performed at an initial concentration of 1250 µg/mL of MH in active pharmaceutical ingredients (API) and formulated sample to provide the stability-indicating property and specificity of the method. Intentional degradation was attempted by the stress conditions of photolytic (Exposed to UV light 200 watt hour followed by visible light 1.2 million lux), heat (Exposed at 105°C for 15 hrs), acid (0.1N HCl refluxed for 30 min at 60°C), base (0.1N NaOH refluxed for 30 min at 60°C), oxidation (3% H2O2 refluxed for 30 min at 60°C), water (Refluxed for 60 min at 60°C) and humidity (Exposed to sat. KNO3 for 7 days).
All degradation samples were analyzed with the aforementioned HPLC conditions using a PDA detector to monitor the homogeneity and purity of the MH peak and its related impurities. Individual impurities, placebo and MH were verified and proved to be non-interfering with each other thus proving the specificity of the method. No degradation observed in any of the degradation condition. Forced degradation samples were analyzed for assay and the mass balance was found more than 98% (Table 2) except peroxide (Oxidation) stress sample. To confirm the mass balance issue in peroxide, stress studies were performed with 5% H2O2 and 10% H2O2. Mass balance was observed below 96%.
As part of investigation, injected peroxide stress sample in ELSD to know any non chromopheric impurities which were formed during

T V Raghava Raju et al. Asian J Pharm Clin Res, Vol 6, Suppl 4, 2013, 107-115
110
peroxide stress. But not a single impurity was detected other than regular UV sensitive impurities. Later it was observed that peroxide blank peak was exactly eluting at the RT’s of impurity A and other unknown peaks. Overlay chromatogram of peroxide blank and stressed sample was shown in the Figure 5A. Hence it was decided to use alternative oxidizing reagent instead of hydrogen peroxide. Performed stress studies by using 0.1M potassium permanganate as oxidizing reagent and the mass balance was found more than 98%. Overlay chromatogram of permanganate blank and stressed sample was shown in the Figure 5B. In permanganate stress no blank peak was observed at the RT of impurity A peak and also few unknown peaks were detected which were not detected in peroxide stress
sample. This was due to merging of all the unknown peaks and impurity A peak with peroxide blank peak. For further confirmation, performed stress studies with 0.2M, 0.5M potassium permanganate and the mass balance was observed more than 98%.
The chromatograms of the stressed samples were evaluated for peak purity of MH and its impurities using Waters Empower Networking
Software. For all forced degradation samples, the purity angle found to
be less than threshold angle and there was no purity flag for the MH and its impurities. It is interesting to note that all the peaks due to
degradation were well resolved. This confirms the stability indicating
power of the method.
Figure 3: HPLC Overlay chromatogram of blank and system suitability solution
Figure 4: HPLC Overlay chromatogram of placebo and spiked sample
Table: 2: Forced degradation data for Metformin HCl
Degradation conditions
Metformin HCl %
Degraded Purity angle
Purity Threshold
% Assay
Mass balance (%)
Photo Stress (1.2 Million lux hours followed by 200 Watt hours)
0.06 0.715 1.471 99.0 99.1
Exposed to humidity at 25 °C, 90% RH for 0.07 0.751 1.416 99.2 99.3

T V Raghava Raju et al. Asian J Pharm Clin Res, Vol 6, Suppl 4, 2013, 107-115
111
about 7 days Refluxed with purified water for about 1 hour at 60 °C
0.02 0.718 1.547 99.3 99.3
Refluxed with 0.1 N HCI solution for about 30 min at 60 °C
0.46 0.512 1.311 99.0 99.5
Refluxed with 0.1 N NaOH solution for about 30 min at 60 °C
0.94 0.286 0.718 99.0 100.0
Refluxed with 3% H2O2 solution for about 30 min at 60 °C
0.33 0.618 1.404 96.2 96.5
Refluxed with 0.1M KMNO4 solution for about 30 min at 60 °C
1.97 0.402 1.369 96.4 98.5
Exposed to heat for about 15 hours at 105 °C 0.01 0.712 1.421 99.2 99.2
Figure 5A: Typical overlay chromatogram of peroxide blank and stressed sample
Figure 5B: Typical chromatogram of permanganate blank and stressed sample
Method Validation
Linearity, precision, accuracy, robustness and ruggedness done as part of method validation.
System suitability
Results from system suitability study were given in Table 3. All the suitability results are with the limits.
Table: 3. System suitability results
Parameter % RSD* of standard
Theoretical plates*
Tailing Factor*
Resolution 1
Resolution 2
As such method 0.7 7286 1.4 4.1 13.4 At 0.8 ml/min flow rate 1.2 7605 1.4 6.0 17.2 At 1.2 ml/min flow rate 1.0 9046 1.4 2.6 2.4 At 30°C column temperature
0.4 9282 1.3 4.1 13.3

T V Raghava Raju et al. Asian J Pharm Clin Res, Vol 6, Suppl 4, 2013, 107-115
112
At 20°C column temperature
0.7 8505 1.2 4.2 12.5
At pH 5.0 (Buffer pH) 1.0 8609 1.3 4.3 12.4 At pH 5.5 (Buffer pH) 1.2 7605 1.4 3.7 7.5
* Determined on six values Resolution 1 : Resolution between Impurity E and Metformin
Resolution 2 : Resolution between Impurity A and Impurity D
Precision
The % RSD for the individual % of impurity A, impurity B, impurity C, impurity D, and impurity E in related substances method precision study was within 4.7%. The results obtained in the intermediated precision study for the % RSD of the individual % of impurity A, impurity B, impurity C, impurity D and impurity E was well within
3.4%, conforming high precision of the method. The results were shown in Table 4A & 4B.
Limit of detection and quantification
The limit of detection and limit of quantification of all impurities of MH namely impurity A, impurity B, impurity C, impurity D, impurity E and MH was mentioned Table 5. The % RSD of precision at LOQ concentration for impurity A, impurity B, impurity C, impurity D and impurity E was below 3.9%.
Table: 4A: Results of method precision
Preparation Impurity A Impurity B Impurity C Impurity D Impurity E
Prep-1 0.021 0.110 0.103 0.112 0.105 Prep-2 0.020 0.108 0.105 0.113 0.103
Prep-3 0.021 002
0.107 0.108 0.108 0.105
Prep-4 0.021 0.108 0.107 0.105 0.100 Prep-5 0.019 0.107 0.106 0.102 0.101 Prep-6 0.020 0.106 0.108 0.101 0.102
%RSD 4.0 1.3 1.8 4.7 2.0
Table: 4B: Results of intermediate method precision
Preparation Impurity A Impurity B Impurity C Impurity D Impurity E
Prep-1 0.020 0.107 0.101 0.105 0.102
Prep-2 0.020 0.100 0.104 0.108 0.107
Prep-3 0.021 002
0.105 0.100 0.110 0.109
Prep-4 0.020 0.102 0.102 0.103 0.102
Prep-5 0.019 0.105 0.103 0.100 0.100
Prep-6 0.020 0.105 0.110 0.105 0.103
%RSD 3.1 2.4 3.4 3.4 3.3
Table: 5: LOD, LOQ and Precision at LOQ
Parameter Impurity A Impurity B
Impurity C
Impurity D
Impurity E
Metformin
LOQ (%) 0.004 0.021 0.026 0.009 0.032 0.040
LOD (%) 0.001 0.007 0.009 0.003 0.011 0.013 % RSD at LOQLevel Precision
4.5 3.2 1.8 3.1 3.7 2.8 Linearity
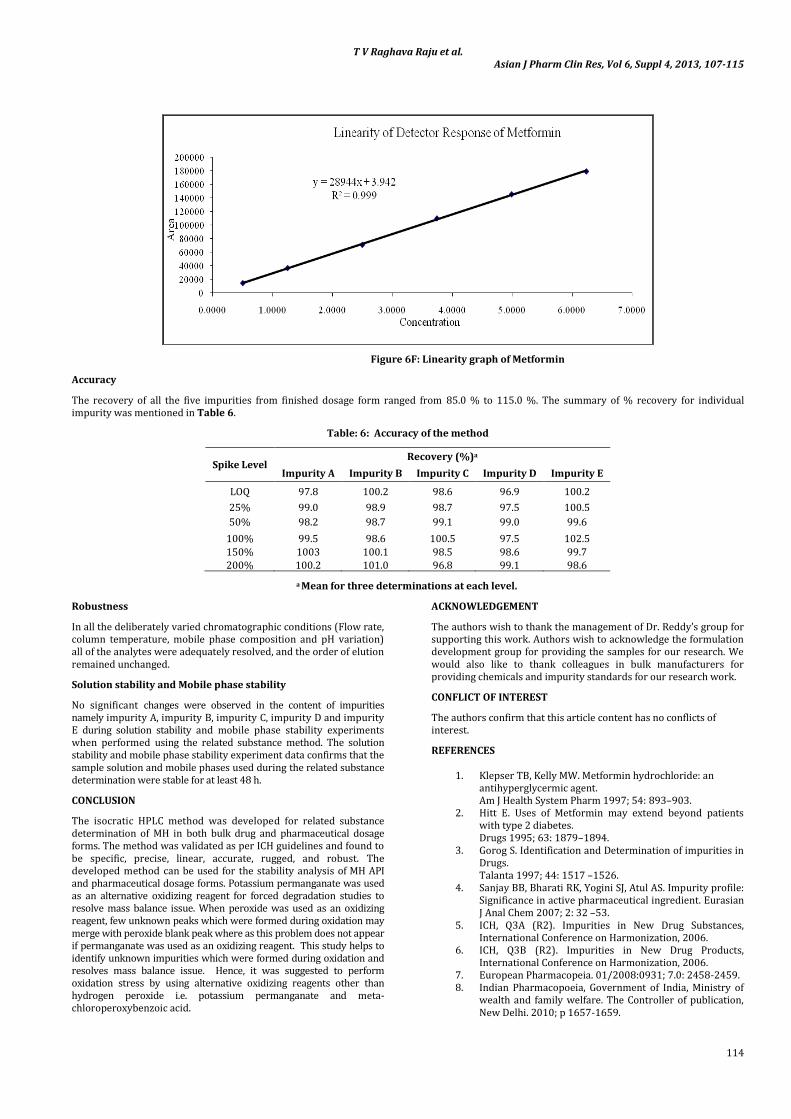
The correlation coefficient obtained was greater than 0.999 for all the impurities and for MH. This shows that an excellent correlation
existed between the peak area and the concentration of impurity A, impurity B, impurity C, impurity D, impurity E and MH. The linearity graphs for impurity A, impurity B, impurity C, impurity D, impurity E and MH were shown in Figures 6A, 6B, 6C, 6D, 6E and 6F respectively.
Figure 6A: Linearity graph of Impurity A
T V Raghava Raju et al. Asian J Pharm Clin Res, Vol 6, Suppl 4, 2013, 107-115
113
Figure 6B: Linearity graph of Impurity B
Figure 6C: Linearity graph of Impurity C
Figure 6D: Linearity graph of Impurity D
Figure 6E: Linearity graph of Impurity E
T V Raghava Raju et al. Asian J Pharm Clin Res, Vol 6, Suppl 4, 2013, 107-115
114
Figure 6F: Linearity graph of Metformin
Accuracy
The recovery of all the five impurities from finished dosage form ranged from 85.0 % to 115.0 %. The summary of % recovery for individual impurity was mentioned in Table 6.
Table: 6: Accuracy of the method
Spike Level Recovery (%)a
Impurity A Impurity B Impurity C Impurity D Impurity E
LOQ 97.8 100.2 98.6 96.9 100.2
25% 99.0 98.9 98.7 97.5 100.5
50% 98.2 98.7 99.1 99.0 99.6
100% 99.5 98.6 100.5 97.5 102.5
150% 1003 100.1 98.5 98.6 99.7 200% 100.2 101.0 96.8 99.1 98.6
a Mean for three determinations at each level.
Robustness
In all the deliberately varied chromatographic conditions (Flow rate, column temperature, mobile phase composition and pH variation) all of the analytes were adequately resolved, and the order of elution remained unchanged.
Solution stability and Mobile phase stability
No significant changes were observed in the content of impurities namely impurity A, impurity B, impurity C, impurity D and impurity E during solution stability and mobile phase stability experiments when performed using the related substance method. The solution stability and mobile phase stability experiment data confirms that the sample solution and mobile phases used during the related substance determination were stable for at least 48 h.
CONCLUSION
The isocratic HPLC method was developed for related substance determination of MH in both bulk drug and pharmaceutical dosage forms. The method was validated as per ICH guidelines and found to be specific, precise, linear, accurate, rugged, and robust. The developed method can be used for the stability analysis of MH API and pharmaceutical dosage forms. Potassium permanganate was used as an alternative oxidizing reagent for forced degradation studies to resolve mass balance issue. When peroxide was used as an oxidizing reagent, few unknown peaks which were formed during oxidation may merge with peroxide blank peak where as this problem does not appear if permanganate was used as an oxidizing reagent. This study helps to identify unknown impurities which were formed during oxidation and resolves mass balance issue. Hence, it was suggested to perform oxidation stress by using alternative oxidizing reagents other than hydrogen peroxide i.e. potassium permanganate and meta-chloroperoxybenzoic acid.
ACKNOWLEDGEMENT
The authors wish to thank the management of Dr. Reddy’s group for supporting this work. Authors wish to acknowledge the formulation development group for providing the samples for our research. We would also like to thank colleagues in bulk manufacturers for providing chemicals and impurity standards for our research work.
CONFLICT OF INTEREST
The authors confirm that this article content has no conflicts of interest.
REFERENCES
1. Klepser TB, Kelly MW. Metformin hydrochloride: an antihyperglycermic agent. Am J Health System Pharm 1997; 54: 893–903.
2. Hitt E. Uses of Metformin may extend beyond patients with type 2 diabetes. Drugs 1995; 63: 1879–1894.
3. Gorog S. Identification and Determination of impurities in Drugs. Talanta 1997; 44: 1517 –1526.
4. Sanjay BB, Bharati RK, Yogini SJ, Atul AS. Impurity profile: Significance in active pharmaceutical ingredient. Eurasian J Anal Chem 2007; 2: 32 –53.
5. ICH, Q3A (R2). Impurities in New Drug Substances, International Conference on Harmonization, 2006.
6. ICH, Q3B (R2). Impurities in New Drug Products, International Conference on Harmonization, 2006.
7. European Pharmacopeia. 01/2008:0931; 7.0: 2458-2459. 8. Indian Pharmacopoeia, Government of India, Ministry of
wealth and family welfare. The Controller of publication, New Delhi. 2010; p 1657-1659.
T V Raghava Raju et al. Asian J Pharm Clin Res, Vol 6, Suppl 4, 2013, 107-115
115
9. The United States Pharmacopeia. USP35-NF30: 3829-3837.
10. Narendra kumar T, Chandra Mohan Rao K, Sreenivasulu R, Raju NSV, Viswanath Reddy P. Novel RP-HPLC method for the estimation of Metformin Hydrochloride in pharmaceutical dosage forms. IJSID 2001; 1: 395-421.
11. Malleswararao CHSN, Suryanarayana MV, Mukkanti K. Simultaneous Determination of Sitagliptin Phosphate Monohydrate and Metformin Hydrochloride in Tablets by a Validated UPLC Method. Sci Pharm 2012; 80: 139–152.
12. Rani Sirisha G, Vasanth PM, Ramesh T, Ramesh M. RP-HPLC method development and validation for simultaneous estimation of Metformin and Sitagliptin in tablet dosage forms. IJPRA 2013; 3: 8-12.
13. Govindasamy Jeyabalan, Narendra Nyola. Simultaneous estimation of Sitagliptin phosphate monohydrate and metformin hydrochloride in bulk and pharmaceutical formulation by RP-HPLC. J Pharm Educ Res 2012; 3: 24-28.
14. Gabriela K, Elzbieta LA. Determination of impurities in medical products containing Metformin Hydrochloride. Acta Pol Pharm 2010; 67: 593-598.
15. Victor David, Andrei Medvedovici, Florin Albu. Retention Behavior of Metformin and Related Impurities in Ion‐Pairing Liquid Chromatography. J Liq Chromatogr R T 2005; 28: 81-95.
16. Rajagopalan R. Review of Regulatory Guidance on Impurities. Sep Sci Technol 2004; 5: 27-37.
17. ICH, Q2 (R1). Validation of Analytical Procedures: Text and Methodology, International Conference on Harmonization, 2005.
18. ICH, Q1A (R2). Stability Testing of New Drug Substances and Products, International Conference on Harmonization, 2003.
19. ICH, Q1B. Photo Stability Testing of New Drug Substances and Products, International Conference on Harmonization, 1996.