development, technical and clinical validation of a...
TRANSCRIPT

Clinical and Vaccine Immunology
23 March 2009 1
Development, technical and clinical validation of a quantitative 1
ELISA for the detection of human antibodies to Hepatitis B surface 2
antigen (HBsAg) in recipients of recombinant HBV vaccine 3
4
Running Title: Quantitative ELISA for detection of anti-HBsAg 5
6
Authors: Pierre Cambron*, Jeanne-Marie Jacquet, Bernard Hoet, Marc Lievens 7
GlaxoSmithKline Biologicals, Rue de l’institut 89, Rixensart, Belgium. 8
9
*Corresponding author 10
Pierre Cambron 11
GlaxoSmithKline Biologicals, 12
Rue de l’institut 89, Rixensart, 13
Belgium. 14
E-mail: [email protected] 15
Phone: +32-2-656-61-86 16
Fax: +32-2-656-91-44 17
18
Key words: hepatitis B, HBsAg, ELISA, validation study 19
Copyright © 2009, American Society for Microbiology and/or the Listed Authors/Institutions. All Rights Reserved.Clin. Vaccine Immunol. doi:10.1128/CVI.00431-08 CVI Accepts, published online ahead of print on 24 June 2009
on July 9, 2018 by guesthttp://cvi.asm
.org/D
ownloaded from

Clinical and Vaccine Immunology
23 March 2009 2
ABSTRACT (244 words, max allowed 250): 20
Pending removal from the market of a commercial assay (AUSAB™EIA) for the 21
determination of antibodies to Hepatitis B Surface Antigen (HBsAg), a new in-house 22
quantitative ELISA to measure antibodies against HBsAg (anti-HBs) was developed 23
(anti-HBs in-house). Specific anti-HBs were sandwiched between pre-coated HBsAg 24
ad and ay subtypes purified from plasma from HBV human carriers and recombinant 25
HBsAg adw2 subtype tagged with horseradish peroxidase. The assay was calibrated 26
against the 1st-IRP for anti-hepatitis B Immunoglobulin (1977-W1042). Analytical 27
sensitivity and the Limit of Quantitation were estimated at 0.43mIU/ml and 28
2.0mIU/ml respectively. Overall reproducibility was 11.86% and accuracy was 29
estimated at 94.89%. More than 4000 samples from 7 clinical trials were tested with 30
the anti-HBs in-house and compared to results generated with AUSAB™EIA and 31
AUSAB™RIA. During the technical validation, anti-HBs in-house was compared to 32
AUSAB™RIA as reference (n=919). Overall assessment of concordance and 33
Deming’s regression analysis were performed. The coefficient of correlation between 34
AUSAB™RIA and anti-HBs in-house was 0.9815 with slope 0.9187. The overall 35
agreement between anti-HBs in-house and AUSAB™RIA was 97.61% considering the 36
clinical cutoff at 3.3mIU/ml and 1.0mIU/ml for the respective assays. On a clinical 37
perspective, seroprotection rates and anti-HBs geometric mean antibody 38
concentrations for individual studies calculated with either the in-house assay or the 39
references assays were similar. Conclusions of individual studies were confirmed. The 40
performance characteristics of the in-house assay are acceptable. There is no evidence 41
that use of the new assay would lead to different clinical conclusions compared to the 42
reference method. 43
on July 9, 2018 by guesthttp://cvi.asm
.org/D
ownloaded from

Clinical and Vaccine Immunology
23 March 2009 3
INTRODUCTION 44
Hepatitis B infection is a global health problem but most acutely affects developing 45
countries (16). Currently there is no effective therapy against hepatitis B, whose 46
disease spectrum ranges from asymptomatic disease to chronic liver diseases 47
including cirrhosis and hepatocellular carcinoma. Prevention of the illness through 48
vaccination remains the method of choice for its control and eradication. Active 49
immunization against hepatitis B infection can be achieved using vaccines containing 50
either inactivated Hepatitis B Virus (HBV) surface protein (HBsAg) physico-51
chemically purified from plasma from HBV human carriers, or, recombinant surface 52
antigen produced by transfer of the S gene of HBV coding for HBsAg to an 53
appropriate plasmid that is then inserted into the desired expression vector. The 54
recombinant vaccine manufactured by GlaxoSmithKline Biologicals (GSK) is 55
produced in yeast and is antigenically similar to plasma derived HBsAg (3). Clinical 56
studies of this recombinant vaccine either formulated as single component 57
(Engerix™-B), or formulated in combination with other antigens such as hepatitis A 58
vaccine (Twinrix™) or pediatric diphtheria-tetanus-pertussis-based vaccines (such as 59
Infanrix hexa™ and Tritanrix™ HepB) have proven its efficacy and immunogenicity 60
(4). 61
To date, commercial assays from Abbott laboratories were used at GSK to quantify 62
the immune response to HBV vaccines in terms of antibodies against HBsAg (anti-63
HBs). However, since these assays are no longer commercially available in Europe, 64
GSK has developed an in-house assay with adequate technical and clinical 65
performance to ensure long-term supply of an assay with consistent quality. This 66
paper describes the development, the technical validation and the clinical assessment 67
of the new anti-HBs in-house assay. 68
on July 9, 2018 by guesthttp://cvi.asm
.org/D
ownloaded from

Clinical and Vaccine Immunology
23 March 2009 4
MATERIAL AND METHODS 69
Abbreviations 70
4PL: 4 Parameters Logistic, BSA: bovine serum albumin, CV: coefficient of variance, 71
FBS: fetal bovine serum, GMC: geometric mean concentration, HRP: horseradish 72
peroxidase, IRP: International Reference Preparation, OD: optical density, PBS: 73
phosphate buffered saline, SD: standard deviation, SSD: standard and sample diluent 74
Selection of the immunological ELISA format 75
A sandwich format was selected whereby specific anti-HBs were sandwiched between 76
pre-coated HBsAg passively adsorbed onto the microplate and HBsAg tagged with 77
HRP. Because the purpose of HBV vaccination is to protect against possible future 78
contact with the wild type virus, native HBsAg ad and ay subtypes (10), purified from 79
plasma from HBV human carriers were used as the solid phase. Quantification of 80
antibodies raised by vaccination used HRP conjugate prepared from recombinant 81
adw2 HBsAg subtype, similar to that contained in the GSK vaccine (7), tagged with 82
HRP. 83
Preparation of the HBsAg pre-coated plates 84
Microplates were passively coated with 100µl of a mix (w/w) of native human 85
HBsAg ad and ay subtypes (14) (The Binding Site) at 1µg/ml (w/v) in carbonate 86
buffer pH 9.5 for 24 hours at room temperature. The plates were then washed four 87
times with distilled water supplemented with NaCl (9g/liter) and Tween-20 (Merck) 88
and blocked with 200µl of PBS (0.0095M pH 7.4 (Cambrex) supplemented with 89
enzymatically hydrolyzed casein 0.1% (Sigma) and proclin-300 0.5ml/litre (Supelco) 90
as preservative for 24 hours at room temperature. Plates were washed 4 times with 91
distilled water with Tween-20 (0.05%) and saccharose 10g/l (Sigma) then dried 92
on July 9, 2018 by guesthttp://cvi.asm
.org/D
ownloaded from

Clinical and Vaccine Immunology
23 March 2009 5
overnight in a laminar flux. Each microplate was individually packed in a sealed 93
aluminum bag that included desiccant. 94
Preparation of HBsAg-HRP conjugate 95
The recombinant HBsAg adw2 subtype was conjugated to sodium-periodate-oxidized 96
HRP (type VI RZ 3.0, Sigma) by a modification of the original method of Nakane et 97
al (6). Half a milliliter of a freshly prepared aqueous solution of 0.14 M sodium 98
periodate solution (Aldrich) was added to 1 ml of 50 mg/ml HRP solution in distilled 99
water and gently stirred for 30 minutes in the dark in order to generate active aldehyde 100
functions on the hydroxyl groups of the several carbohydrate moities. Then the HRP-101
aldehyde solution was chromatographically separated from periodate by gel filtration 102
(Sephadex G-25) and quantified by absorbance at 403nm (1mg/ml of Oxidized HRP 103
displays an OD of 1.6 at 403nm). The molar ratio between oxidized HRP after 104
separation and the HBsAg to be coupled was 2.0. 105
The HBsAg solution previously dialyzed overnight at 4-8°C against sodium carbonate 106
buffer 0.1mol/l pH 9.5 was mixed with the HRP-aldehyde solution for 2 hours at 107
room temperature in the dark in order to generate Schiff’s bases between the primary 108
amine groups on HBsAg and the aldehyde groups present on the oxidized HRP. 109
Remaining reactive aldehyde groups were blocked by adding 2M Tris solution at a 110
rate of 22µl per mg of HRP-aldehyde and incubated for 30 minutes at room 111
temperature. Subsequently the Schiff bases were reduced for 30 minutes at 4°C by the 112
addition of 0.21M sodium borohydrure (Aldrich) at a rate of 10µl/mg of HRP-113
aldehyde engaged in the conjugation process. The HBsAg-HRP was 114
chromatographically separated by gel filtration on ACA-34 (Amersham 115
Biosciences) equilibrated with Tris buffer 0.05M pH 7.5 containing Tween-20 116
0.5ml/L. Finally, the fractions containing the HBsAg-HRP conjugate were pooled, 117
on July 9, 2018 by guesthttp://cvi.asm
.org/D
ownloaded from
Clinical and Vaccine Immunology
23 March 2009 6
supplemented with BSA (Cohn fraction V, Serologicals) 10g/l and proclin-300 2ml/l 118
and stored at 4-8°C after filtration on a 0.2 micron filtering device. 119
Preparation and calibration of anti-HBs Abs standard 120
A pool of sera from HBV vaccine recipients with high levels of anti-HBs was diluted 121
in FBS (Hyclone) containing thymol 0.2g/liter (Sigma) and gentamicin-sulphate 122
100µg/ml (Sigma) as preservatives. After adjustment to around 190 mIU/ml, referring 123
to the 1st IRP (International Reference Preparation) for anti-hepatitis B 124
immunoglobulin (15), the standard preparation was dispensed in 1 ml aliquots and 125
freeze-dried. To conduct an assay, one freeze-dried vial was reconstituted with 1 ml of 126
distilled water and then serially diluted (6 times) with SSD (FBS containing proclin-127
300 2ml/l as preservative). SSD was used as zero standard. FBS was used instead of 128
recalcified human plasma free of anti-HBs (human plasma) in order to prevent future 129
availability issues. The standard was calibrated against the anti-HBV Immunoglobulin 130
reference preparation 1st IRP, 1977-W1042. For calibration purposes, 4 in-house anti-131
HBs standard vials were reconstituted with 1 ml of distilled water then serially diluted 132
(neat plus 6 steps) with FBS and incubated on 4 different lots of pre-coated plates. At 133
the same time, serial dilutions in human re-calcified plasma free of anti-HBs antibody 134
ranging between 1.58 mIU/ml and 200.00 mIU/ml of one reference ampoule (1st IRP, 135
1977-W1042) freshly reconstituted according to instructions were incubated. 136
Consequently, 96 measures based on serial dilutions were obtained. After correction 137
for their respective dilution factor, the average concentration of the 96 individual 138
values was determined. The values obtained before correction for dilution were 139
extrapolated from the standard curve generated by the WHO preparation using a 4PL 140
fitting algorithm. 141
on July 9, 2018 by guesthttp://cvi.asm
.org/D
ownloaded from
Clinical and Vaccine Immunology
23 March 2009 7
Preparation of assay controls 142
Four anti-HBs controls were prepared from separated pools of recalcified human 143
plasma. The negative control (CN-1) was non-reactive for anti-HBs antibody. CB1-1 144
was spiked with serum obtained from a recipient of HBV vaccine and had an antibody 145
level of 6.7 mIU/ml. CM-1 had a level of 18.1 mIU/ml and was spiked with serum of 146
hospital origin. CM1-100 was unspiked and had a level of 6436 mIU/ml. CN1-1, 147
CB1-1 and CM1-1 were freeze-dried and stored at 4-8°C whereas CH-100 was liquid 148
and stored at –20°C. At the time of use CN1-1, CB1-1 and CM1-1 were reconstituted 149
with 0.5 ml of distilled water. Control CH1-100 was thawed and prediluted 1 to 100 150
with SSD before use. 151
Collection, preparation and storage of test samples 152
Whole blood from healthy recipients of HBV vaccine was collected after informed 153
consent was obtained. Blood collection was approved by relevant ethics committees. 154
Sera were stored at –20°C until testing. Undiluted samples with responses that were 155
higher than the highest anti-HBs Abs standard were diluted by successive factors of 156
10 until the response was quantifiable. 157
ELISA procedure 158
50µl each of standards, controls and specimen were added in duplicate to the pre-159
coated microplate. The plate was covered and incubated overnight at room 160
temperature, then washed four times with 350µl of distilled water containing Tween-161
20 (0.05%) and NaCl (0.154M). 100µl of HBsAg-HRP conjugate at a working 162
dilution of 1: 1000 in the HRP diluent (PBS 0.0095M pH 7.4 supplemented with BSA 163
10% and proclin-300 1ml/liter as preservative) was added across the entire plate. 164
Plates were covered and gently shaken for 2 hours at room temperature. Unbound 165
on July 9, 2018 by guesthttp://cvi.asm
.org/D
ownloaded from

Clinical and Vaccine Immunology
23 March 2009 8
conjugate was removed by washing as previously described. 100µl of the single 166
component TMB- peroxidase substrate (Biorad) was added to all wells. After 30 167
minutes incubation in the dark, the color reaction was stopped by the addition of 168
100µl of diluted sulphuric acid 0.36N in distilled water. Plates were read in an ELISA 169
reader at 450nm against a reference filter at 630nm within 30 min after stopping. 170
The calibration curve and its fitting algorithm 171
The dose response curve expressed in terms of the response y (OD's on a linear scale) 172
versus the dose x (mIU/ml on a logarithmic scale) commonly display a pronounced 173
sigmoidal shape. The 4PL function fits these data with a high degree of accuracy (2, 174
8, 9). An unweighted 4PL function was used to fit the standard curve for anti-HBs in-175
house. In order to estimate the accuracy of the standard curves, r2 and the percentage 176
of the relative error or the relative bias: % R.E. (also called percentage of backfit dose 177
error) was determined for each standard point. 178
The backfit dose is the recalculated concentration of each standard obtained by 179
extrapolating its response (OD’s) through the fitted curve. The % R.E of each 180
standard point (zero standard is excluded from the analysis) is as follows: 181
% R.E. = (recalculated value – assigned value)/assigned value x 100%. To evaluate 182
the overall quality of the fitting of the standard curve, 167 standard curves collected 183
during the development phase of the assay were assessed for r2 and % R.E. 184
The literature and current guidelines recommend an absolute value of R.E. ≤ 20% and 185
r2 >0.99 (1,12). 186
Analytical sensitivity 187
Sixty four replicates of the SSD were incubated on one plate along with one set of 188
anti-HBs standards. The average response and its SD were calculated in terms of ODs. 189
on July 9, 2018 by guesthttp://cvi.asm
.org/D
ownloaded from

Clinical and Vaccine Immunology
23 March 2009 9
Then the upper limit of the 1-sided 95% CI was determined, injected into the standard 190
curve and interpolated in terms of mIU/ml from the fitted standard curve. 191
Limit of Detection (LOD) 192
One hundred and forty serum samples collected from healthy adults and shown to be 193
negative in AUSAB™ RIA were tested in the assay. Average and standard deviation 194
were calculated after logarithmic transformation of the OD responses. Then the upper 195
limit of the 1-sided 95% CI was determined, injected into the standard curve and 196
interpolated in terms of mIU/ml from the fitted standard curve. 197
Limit of Quantitation (LOQ) 198
Serial 2-fold dilutions (6 consecutive ones) were made for 56 samples (post-vaccinees 199
and hospital subjects). If required, samples were pre-diluted with SSD to around 10 200
mIU/ml in order to limit the number of dilutions per samples. For each sample, the 201
lowest calculated concentration that did not differ no more than 2-fold from the 202
expected concentration (the concentration obtained at the first dilution was considered 203
as the most accurate) was considered as still reliable. Data were logarithmically 204
transformed before statistical analysis. The average lowest reliable concentration was 205
calculated with its SD. LOQ was set at the upper limit of the 1-sided 95% CI. 206
Comparison of FBS and human-plasma as standard and sample diluent 207
Ninety eight samples covering a large range of anti-HBs concentrations were assayed 208
either with FBS or with human plasma as SSD and the results compared by linear 209
regression analysis after logarithmic transformation of the data. In addition a paired-t 210
test was performed on the geometric mean concentrations obtained with each diluent. 211
on July 9, 2018 by guesthttp://cvi.asm
.org/D
ownloaded from

Clinical and Vaccine Immunology
23 March 2009 10
Accuracy-recovery 212
In order to assess accuracy, one ampoule of the 1st IRP for anti-HBs immunoglobulin 213
(1977-W1042) was reconstituted according to instructions and diluted to 10,000 214
mIU/ml in human plasma. Further, a 25µl aliquot was added to different volumes of 215
human plasma free of anti-HBs antibodies in order to cover a concentration range 216
from 3.3 to 100,000 mIU/ml. Then each sample was measured in the assay. The 217
accuracy was expressed as the geometric mean recovery percentage calculated on the 218
whole set. 219
Assessment of repeatability and reproducibility of anti-HBs in-house in routine 220
conditions 221
Precision was evaluated by a repeatability and reproducibility experiment made on 12 222
sera covering a broad range of anti-HBs concentrations observed in routine 223
conditions. To measure repeatability (precision under minimum variable condition), 224
the same dilution of serum was tested twice by the same certified operator in the same 225
day in the same run on the same plate with the same lot of reagents. To estimate the 226
reproducibility (precision obtaining under maximal variable conditions), all sera were 227
tested twice on the same plate at 4 different days (within a period of 2 weeks) by 2 228
certified operators. A random 3-way ANOVA with day, operator and sample as 229
random factor was carried out (using mixed procedure from statistical SAS® 230
software) on log-10 transformed concentrations. Computations were done on 231
transformed values but CVs expressed from non-transformed concentrations. In 232
conclusion 192 observations were generated (2 operators x 4 days x 2 repeats x 12 233
samples). 234
on July 9, 2018 by guesthttp://cvi.asm
.org/D
ownloaded from

Clinical and Vaccine Immunology
23 March 2009 11
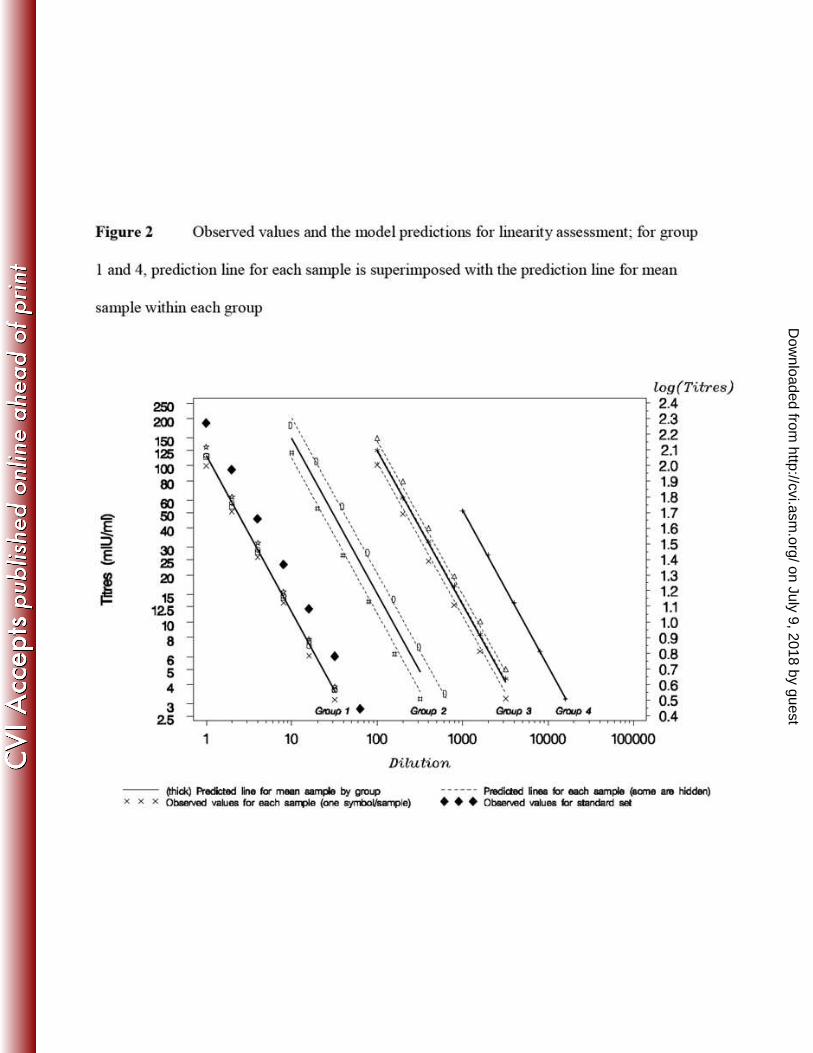
Linearity and parallelism 235
Ten samples displaying concentrations between 100 and 51,895 mIU/ml were pre-236
diluted depending on their initial concentration to reach the upper limit of the 237
analytical range. Then 6 serial 2-fold dilutions were applied to each sample. Each 238
measured concentration was corrected for its dilution. For the analysis, samples were 239
gathered into 4 groups depending on the first pre-dilution applied: neat for group 1, 1 240
to 10 for group 2, 1 to 100 for group 3 and finally 1 to 1000 for group 4. A statistical 241
analysis was performed on the logarithmically transformed data in order to answer the 242
following questions: is the model globally linear, are the slopes equal (parallel lines) 243
from one group to another? Are the slopes equal from one sample to the other within 244
each group? And finally, are the measured concentrations proportional to the applied 245
successive dilutions? 246
Specificity 247
In order to establish specificity of the assay, 3 samples displaying a concentration 248
below the cutoff and 10 samples displaying a very large range of concentrations were 249
pre-incubated (vol/vol) with an excess of either a mix of native ad and ay HBsAg 250
subtypes (the combination used for the solid phase), or adw2 HBsAg subtype (the one 251
used for the preparation of the HRP conjugate) for 2 hours at 37°C. The excess of 252
antigen corresponded to 40 times the concentration of antigen used for the coated 253
plate preparation. The reference condition was similar to the experimental one but 254
with PBS-BSA buffer instead of HBAg moities. Then samples were tested with anti-255
HBs in-house but also with AUSAB™ EIA as specificity control. Specificity was 256
expressed as the difference in concentration observed before and after inhibition 257
expressed as percentage of the corresponding concentration measured without 258
inhibition. 259
on July 9, 2018 by guesthttp://cvi.asm
.org/D
ownloaded from

Clinical and Vaccine Immunology
23 March 2009 12
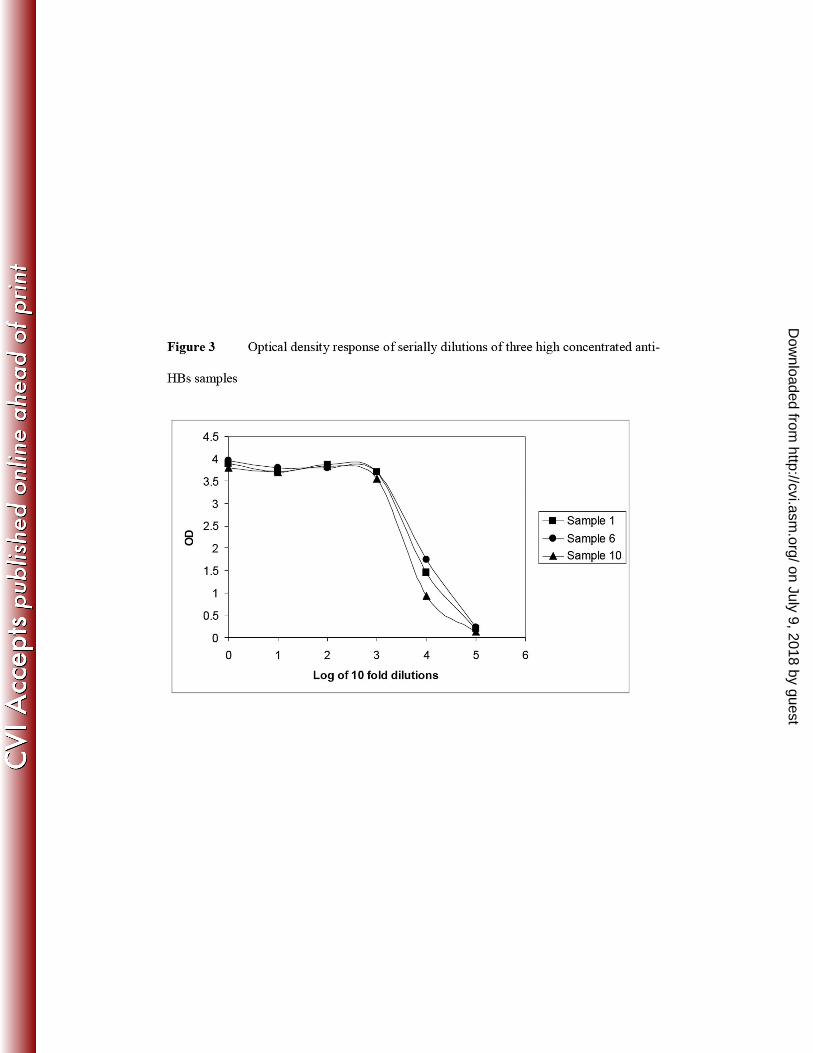
Assessment of high dose hook-effect 260
In order to rule out underestimation of the antibody concentration in samples with 261
high levels of the analyte, three sera highly concentrated for anti-HBs were tested 262
undiluted and at 5 consecutive 10-fold serial dilutions. There is no hook-effect if the 263
neat sample reports a concentration higher than the upper limit of the analytical range. 264
Clinical cutoff and correlation with AUSAB™ RIA 265
The assay cutoff has to be equal or higher than the LOQ. In order to determine the 266
most appropriate cutoff for seropositivity, different cutoffs from 2 to 3.9 mIU/ml were 267
compared during the technical bridge of the new assay compared to AUSAB™ RIA. 268
In this respect the concentrations obtained with the new assay for 919 samples 269
including pre-vaccination (7%) and post-vaccination samples were compared to the 270
historical results observed with the reference method. The cutoff was elected at a level 271
for which the best balance was observed in terms of overall agreement, sensitivity and 272
specificity. In addition Deming’s regression was performed between double positive 273
samples in order to evaluate the correlation between both assays. 274
Clinical validation of the assay 275
The accepted serological correlate of protection of ≥10 mIU/ml against HBV infection 276
was determined from studies that employed the AUSAB™ RIA. Therefore, the clinical 277
validation included several studies having used AUSAB™ RIA. Three additional 278
studies having used AUSAB™ EIA were also considered. In total, 4180 samples from 279
seven clinical studies were re-tested. These studies had been conducted in infants, 280
adolescents, adults and the elderly (>50 years of age). Subjects had received 281
vaccination with various HBV vaccine-containing products including vaccine 282
on July 9, 2018 by guesthttp://cvi.asm
.org/D
ownloaded from
Clinical and Vaccine Immunology
23 March 2009 13
combinations such as combined hepatitis A-HBV vaccine and combined diphtheria-283
tetanus-acellular pertussis-HBV-inactivated poliovirus vaccine (Table 1). 284
on July 9, 2018 by guesthttp://cvi.asm
.org/D
ownloaded from
Clinical and Vaccine Immunology
23 March 2009 14
RESULTS 285
Preparation of the anti-HBs standard and its calibration to anti-HBs IRP lot 286
17.02.1977 287
The distribution of the 96 individual concentrations obtained from the serial dilutions 288
was Gaussian and the coefficient of variation of the recalculated concentrations was 289
4%. The final concentration of the freeze-dried in-house standard was expressed in 290
mIU/ml. The calibration curve of the assay consists of one zero standard and 7 291
positive standards ranging from 2.9 to 187.0 mIU/ml namely 187.0, 93.5, 48.8, 23.4, 292
11.7, 5.8, and 2.9 mIU/ml. The loss of immunoreactivity after freeze-drying was 1.5% 293
on average for two successive anti-HBs standard batches and therefore was 294
considered negligible. 295
The calibration curve and its fitting algorithm 296
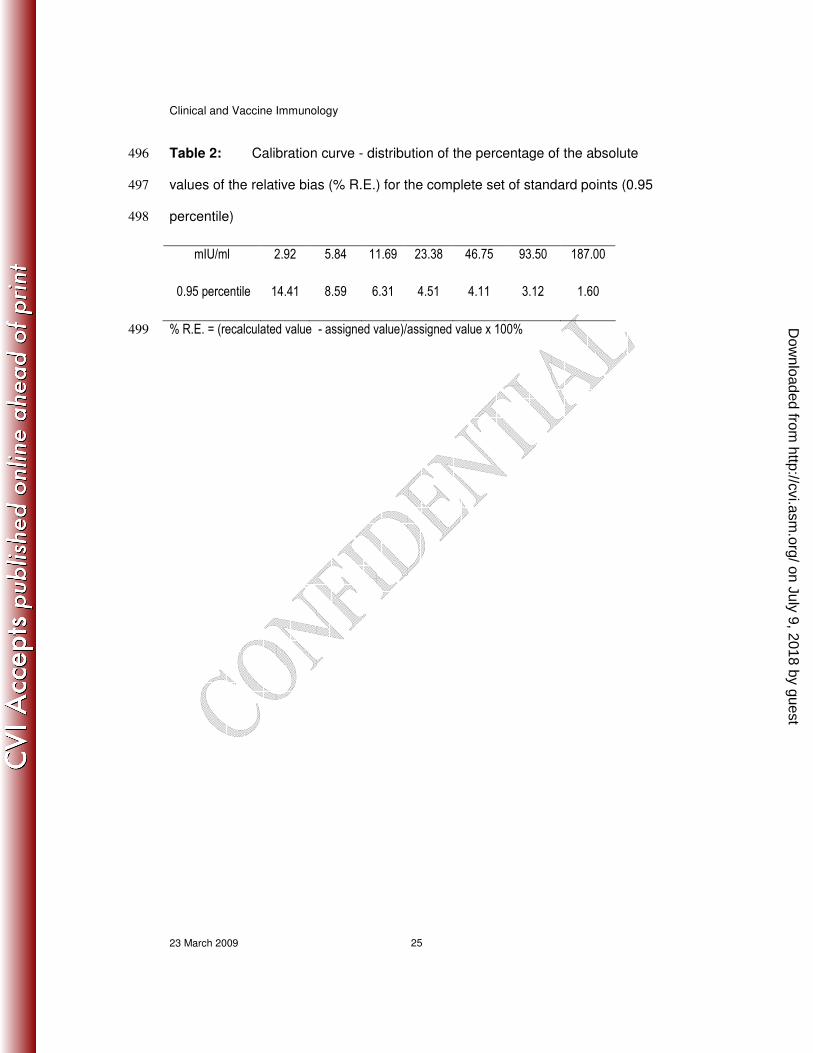
For all the 167 standard curves the r2
was greater than 0.998. The 0.95 percentile of 297
the absolute values of % R.E. were determined (Table 2). Accordingly we conclude 298
that the accuracy of the standard curve within the analytical range set from 3.3 299
mIU/ml to 187 mIU/ml meets current guidelines (1,12). 300
Analytical sensitivity 301
The individual OD of the 64 replicates of the zero standard were normally distributed. 302
The average response and the SD of all replicates were calculated. Then the upper 303
limit of one-sided 95% CI of the mean OD was injected into the standard curve 304
generated at the same time and the corresponding concentration was extrapolated 305
from the curve. Accordingly, the analytical sensitivity was estimated at 0.43 mIU/ml. 306
on July 9, 2018 by guesthttp://cvi.asm
.org/D
ownloaded from

Clinical and Vaccine Immunology
23 March 2009 15
Limit of Detection (LOD) 307
The OD corresponding to the upper limit of the one-sided 95% CI of the average OD 308
response of the 142 negative samples was interpolated from the standard curve 309
allowing the determination of an equivalent concentration expressed in mIU/ml. 310
Accordingly, LOD was set at 1.0 mIU/ml. 311
Limit of Quantification (LOQ) 312
The average lowest measured concentration was 0.68 mIU/ml with a SD of 0.26 The 313
LOQ of the in-house test was set at 2.0 mIU/ml, equivalent to the one-sided upper 314
limit of the 95% CI. 315
Comparison of FBS and human-plasma as standard and sample diluent 316
The standard curves generated with either FBS or human-plasma were 317
superimposable (data not shown). The concentrations of the 98 samples measured 318
with either FBS or human-plasma were statistically compared by linear regression 319
analysis. The interval for the slope was 1.0055 (95% CI: 0.9948; 1.0162) and the 320
intercept -0.0051 (95% CI: -0.0244; 0.0143) comprising 1 and zero, respectively, 321
indicated no significant difference between both diluents (Figure 1). Moreover, a 322
paired t-test showed no significant difference between means (the observed difference 323
in log was 0.0036 for which the 95% CI included zero [-0.0060; 0.0132]). 324
Consequently FBS can be used instead of human-plasma free of anti-HBs as sample 325
and standard diluent without affecting sample concentration determination. 326
Accuracy-Recovery 327
The spiking experiments were performed on two different days. Recovery was 328
calculated by expressing the measured concentrations in % of the theoretical 329
concentration. Recovery ranged from 79.3% to 101.2%. The geometric mean recovery 330
on July 9, 2018 by guesthttp://cvi.asm
.org/D
ownloaded from

Clinical and Vaccine Immunology
23 March 2009 16
was 94.89% (95% CI: 92.24%; 97.62%, Table 3. Accordingly anti-HBs in-house is 331
considered as accurate vis-à-vis the 1st IRP for anti-HBV Immunoglobulin (1977-332
W1042). 333
Precision 334
A random 3-way ANOVA with day, operator and sample as random factor was 335
carried out (using proc mixed of SAS®)
on log10-transformed concentrations. 336
Computations were done on transformed values but CVs were expressed from non-337
transformed concentrations. The CV for repeatability of the assay was 4.72%. The 338
global CV R&R for reproducibility and repeatability in routine conditions was 339
11.86%. Precision is in agreement to what is currently displayed by ELISA (5) 340
Linearity and parallelism 341
A mixed model was used with the factors log dilution (fixed and continuous), group 342
(fixed, 4 groups) and samples (random, nested into the groups, 10 samples). The test 343
for curvature of the log dilution effect was not statistically significant (p-value 344
0.5940). Consequently a linear model was fit on the data (Figure 2). The test of the 345
interaction of the log dilution and the group factors gave a non significant p-value of 346
0.8903 meaning that the log dilution effect (slope) can be considered equal from one 347
group to another. The p-value of the interaction between the log dilution and the 348
sample factors was non significant (0.24526) meaning that the slope of one sample is 349
equal to the slope of another within each group. Finally, the estimated slope with its 350
95% CI was calculated for each group (Table 4). None of the slopes were significantly 351
different from -1, supporting the proportionality between dilutions. Consequently 352
linearity and parallelism is demonstrated over the analytical range. 353
on July 9, 2018 by guesthttp://cvi.asm
.org/D
ownloaded from

Clinical and Vaccine Immunology
23 March 2009 17
Specificity 354
A shown in Table 5, the specificity of anti-HBs in-house is around 100%, similar to 355
specificity displayed by AUSAB™ EIA. 356
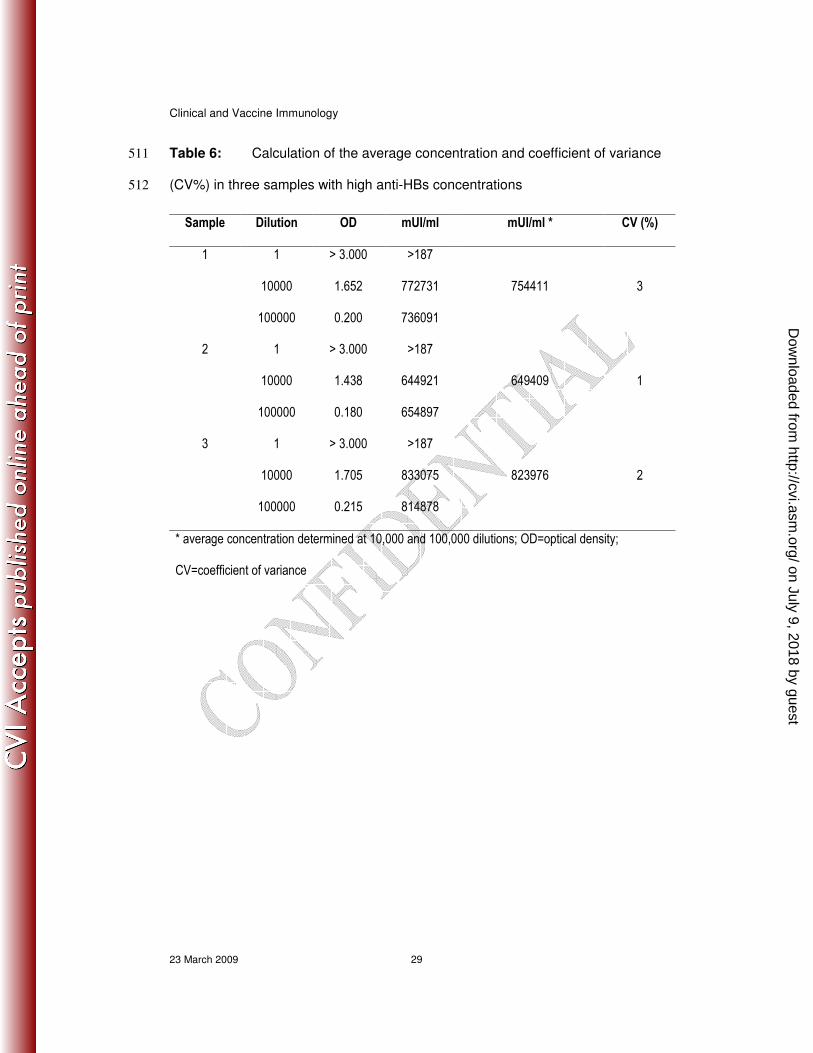
Hook-effect 357
The response of the 3 undiluted samples gave a higher response than that displayed by 358
the upper standard point, for which the response was 3.0 ODs in this experiment 359
(upper standard specifications: 2.5–3.3 ODs) (Figure 3). In addition, CV% calculated 360
on dilution 10,000 and 100,000 was as good as 2% (Table 6). Concentrations as high 361
as 823,976 mIU/ml can be reliably measured with the new assay without displaying 362
any hook-effect. 363
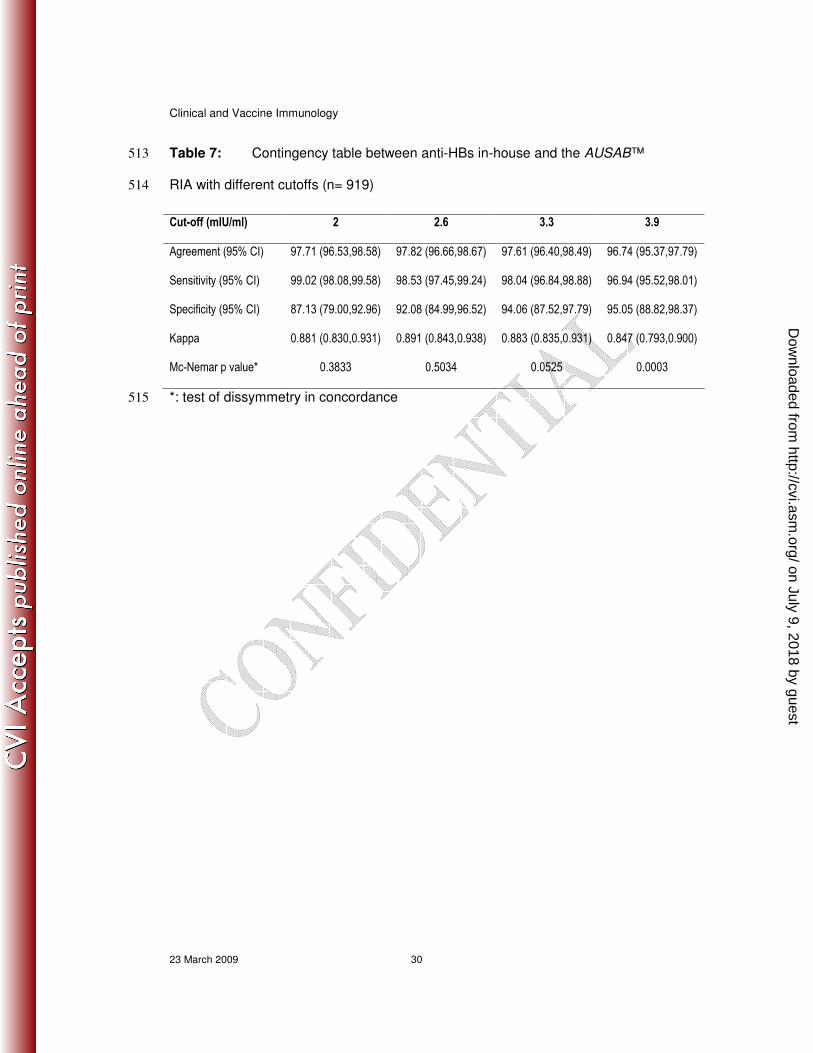
Clinical cutoff and correlation with AUSAB™ RIA 364
Table 7 displays the overall agreement, specificity and sensitivity for the comparison 365
of anti-HBs in-house and AUSAB™ RIA during the technical validation of the assay. 366
The cutoff of anti-HBs in-house was fixed at a value above the LOQ which gave the 367
best balance in respect to overall agreement, sensitivity and specificity vis a vis the 368
reference assay while keeping a non significant p value for the Mc Nemar test of 369
dissymmetry in concordance. Accordingly, the cutoff was fixed at 3.3 mIU/ml. At 370
this level, the overall agreement was 97.61% (CI: 96.40 to 98.49) with a sensitivity 371
and a specificity calculated at 98.04% (CI: 96.84 to 98.88) and 94.06% (CI: 87.52 to 372
97.79) which were considered as good. Deming’s regression was performed on the 373
double positive samples (n = 802) considering a CV% at 11.86% as determined 374
during the repeatability and reproducibility experiment (Figure 4). Finally, regression 375
was considered as good between anti-HBs in-house and AUSAB™ RIA. The Fuller’s 376
coefficient of correlation (simple correction on AUSAB™ RIA) was calculated to be 377
on July 9, 2018 by guesthttp://cvi.asm
.org/D
ownloaded from
Clinical and Vaccine Immunology
23 March 2009 18
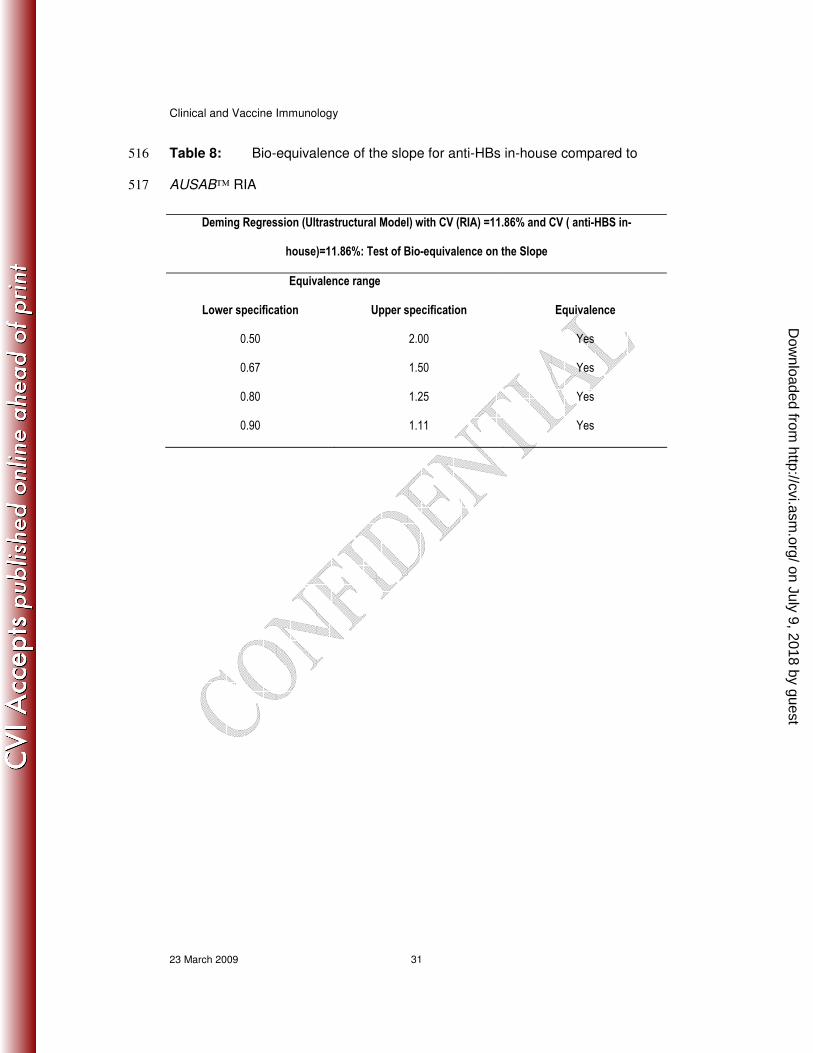
0.9815 which can be considered as high. The estimation of the slope and its 95% CI 378
limit was established at 0.9187 (0.9060; 0.9315). However in Table 8, the test of the 379
bio-equivalence of the slope was demonstrated because the 95% CI was within the 380
0.90-1.11 equivalence range (11,13). 381
Analytical range 382
The lower limit of the analytical range usually corresponds to the LOQ of the assay. 383
However we elected to use the cutoff for positivity in order to increase confidence in 384
the assay. Thus, the lower limit of the analytical range was set at 3.3 mIU/ml. The 385
upper analytical range was fixed at 187.0 mIU/ml, level at which the accuracy is still 386
effective (see section The calibration curve and its fitting algorithm). 387
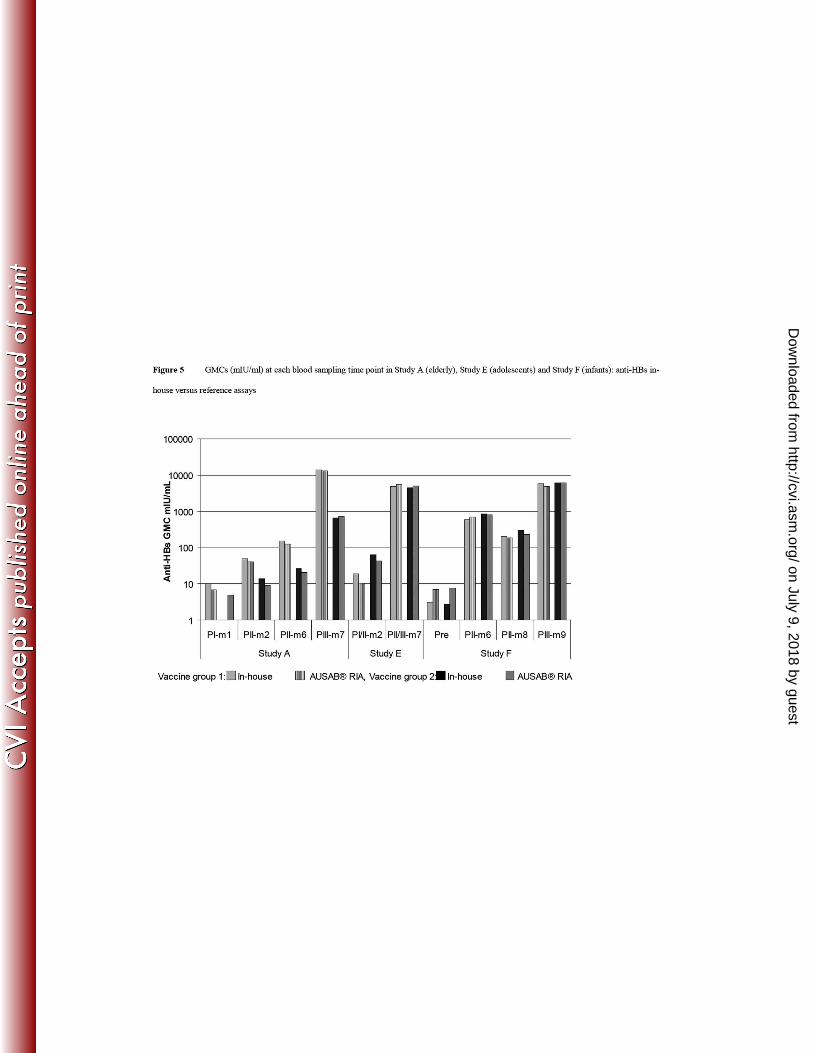
Clinical validation of the assay 388
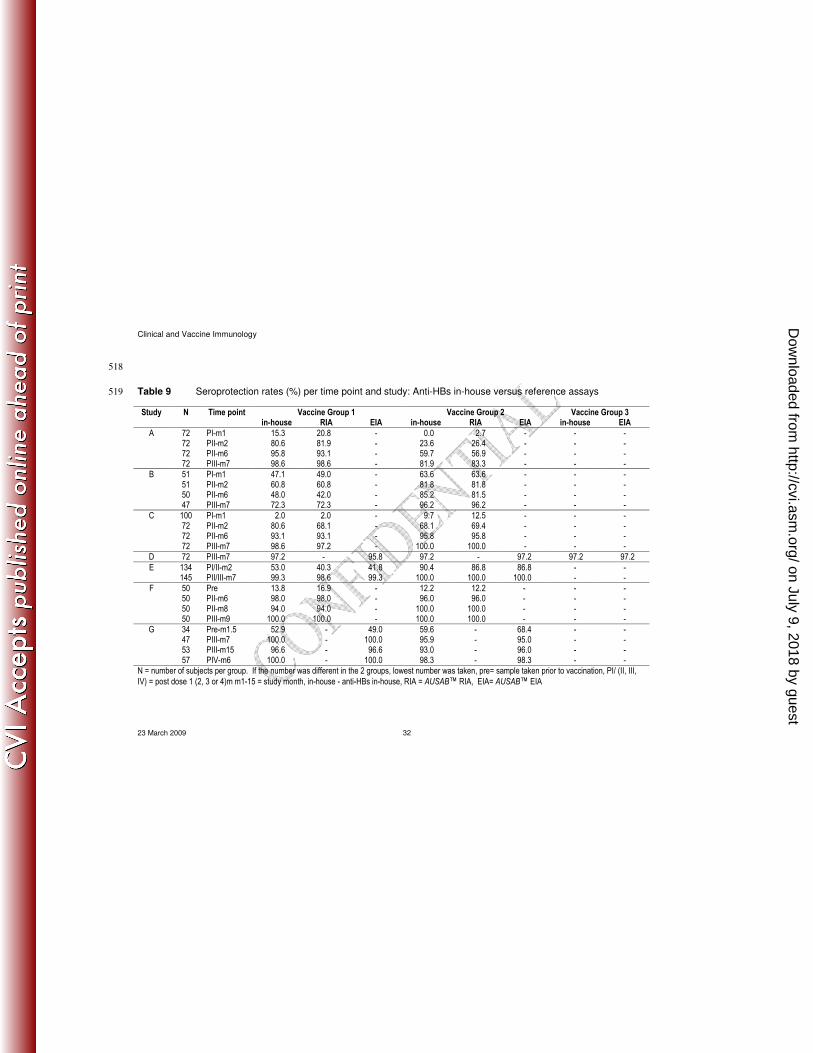
Seroprotection rates observed with the anti-HBs in-house and reference assays in 7 389
clinical trials are summarized in Table 9. Figure 5 shows anti-HBs GMCs using the 390
in-house and reference assays in three studies representative of different age groups. 391
Study B investigated immune responses to HBV vaccination in non-responders 392
subjects having received at least 4 doses of the Engerix™ HBV vaccine and was 393
included in order to verify that those non-responders would not have been considered 394
as protected by the anti-HBs in-house assay, which would be an expression of a lack 395
of specificity of the new assay. Out of 96 subjects assessed as seronegative at study 396
start with AUSAB™ RIA, 9 were assessed as seropositive with anti-HBs in-house 397
assay. Accordingly, the specificity was calculated at 90.6% at study start (data not 398
shown). However, out of these 9 samples, 7 were confirmed as seropositive with 399
AUSAB™ EIA. At this stage, this apparent sub-optimal specificity could be linked to 400
a better sensitivity of anti-HBs in-house and AUSAB™ EIA compared to AUSAB™ 401
on July 9, 2018 by guesthttp://cvi.asm
.org/D
ownloaded from

Clinical and Vaccine Immunology
23 March 2009 19
RIA. These non-responders then participated in a new trial (mentioned as study B in 402
Table 9). The final analysis performed on study B after the complete vaccine course 403
showed similar seroprotection rates and similar GMT determined with either anti-HBs 404
in-house or AUSAB™ RIA. Overall, the specificity of anti-HBs in-house compared to 405
AUSAB™ RIA determined on a normal population was determined at 94.06% (see 406
previous section Clinical cutoff and correlation with AUSAB™ RIA) which was 407
considered as good. 408
In the re-analysis of 7 studies in which different recombinant HBsAg-containing 409
vaccines were used, a very good agreement in terms of seroprotection rate was 410
observed after full schedule and also one month post-vaccination. Antibody GMCs 411
were similar across the in-house and reference assays, with a trend to overestimation 412
using the in-house assay in the lower concentration range. Importantly, there was no 413
evidence that the use of the anti-HBs in-house assay would lead to different clinical 414
conclusions compared to the reference assays. 415 on July 9, 2018 by guesthttp://cvi.asm
.org/D
ownloaded from

Clinical and Vaccine Immunology
23 March 2009 20
DISCUSSION 416
The new anti-HBs in-house assay has been developed to replace use of a commercial 417
assay soon to be removed from the market. The performance characteristics of the 418
new in-house assay have been thoroughly tested and are acceptable. Clinical 419
application of the in-house assay has been documented by re-analysis of 4180 samples 420
from individuals of all ages participating in clinical trials of recombinant HBsAg-421
containing vaccines. In these studies seroprotection rates and anti-HBs GMCs for 422
individual studies were similar using either the in-house assay or the references 423
assays. In all studies the immunogenicity conclusions determined by the reference 424
assay were confirmed using the in-house assay. 425
The specificity of the anti-HBs in-house assay determined in Study B was 90.6% but 426
this figure was calculated at study start and in non-responder subjects having received 427
at least 4 doses of hepatitis B vaccine. After the full schedule, seroprotection rates and 428
GMT were similar for anti-HBs in-house and the reference assay 429
In conclusion, the new in-house anti-HBs antibody assay has been technically and 430
clinically validated and displays adequate performance characteristics. There is no 431
indication that use of the new assay would lead to different clinical conclusions 432
compared to the currently used reference methods. 433
on July 9, 2018 by guesthttp://cvi.asm
.org/D
ownloaded from

Clinical and Vaccine Immunology
23 March 2009 21
TRADEMARKS 434
Engerix™-B, Ambirix™, Twinrix™, Tritanrix™, Infanrix hexa™ and Infanrix™ 435
penta are trademarks of the GlaxoSmithKline group of companies. Recombivax™ is a 436
trademark of Merck & Co. AUSAB™ is a trademark of Abbott Laboratories, North 437
Chicago. 438
ACKNOWLEDGEMENTS 439
The assay was developed and supported by GlaxoSmithKline Biologicals. On behalf 440
of GSK Biologicals, the authors thank Dr. Joanne Wolter, Dr. Veronique Delpire, 441
Vidya Virajith, and Manjula K for assistance with manuscript preparation, as well as 442
ensuring manuscript coordination. 443
CONFLICT OF INTEREST 444
All authors (P. Cambron, J. Jacquet, B. Hoet and M. Lievens) are employed by the 445
commercial entity which has developed the in-house assay. J. Jacquet is also a 446
shareholder of GlaxoSmithKline Biologicals. 447
on July 9, 2018 by guesthttp://cvi.asm
.org/D
ownloaded from

Clinical and Vaccine Immunology
23 March 2009 22
REFERENCES 448
1. Braggio, S., R. J. Barnaby, P. Grossi, and M. Cugola. 1996. A strategy for 449
validation of bioanalytical methods. J. Pharm. Biomed. Anal. 14:375–388. 450
2. Findlay, J.W.A., W.C. Smith, J.W. Lee, G.D. Nordblom, I. Das, B.S. DeSilva, 451
M.N. Khan, and R.R. Bowsher. 2000. Validation of immunoassays for 452
bioanalysis: a pharmaceutical industry perspective. J. Pharm. Biomed. Anal. 453
21:1249–1273. 454
3. Hauser, P., P. Voet, E. Simoen, H. C. Thomas, J. Pêtre, M. De Wilde, and 455
J. Stephenne. 1987. Immunological properties of recombinant HBsAg produced 456
in yeast. Postgrad. Med. J. 63:83–91. 457
4. Keating, G.M., and S. Noble. 2003. Recombinant hepatitis B vaccine 458
(Engerix™-B): a review of its immunogenicity and protective efficacy against 459
hepatitis B. Drugs. 63:1021–1051. 460
5. Miller, K.J., R. R. Bowsher, A. Celniker, J. Gibbons, S. Gupta, J. W. Lee, S. 461
J. Swanson, W. C. Smith, R. S. Weiner. 2001. Workshop on bioanalytical 462
methods validation for macromolecules: summary report. Pharm. Res. 18:1373–463
1383. 464
6. Nakane, P.K., and A. Kawaoi. 1974. Peroxidase-labeled antibody. A new 465
method of conjugation. J. Histochem. Cytochem. 22:1084–1091. 466
7. Pêtre J., Van Wijnendaele F., De Neys B., Conrath K., Van Opstal O., 467
Hauser P., Rutgers T., Cabezon T., Capiau C., Harford N., et al. 1987. 468
Development of a hepatitis B Vaccine from transformed yeast cells. Postgrad. 469
Med. J. 63 Suppl 2:73–81. 470
on July 9, 2018 by guesthttp://cvi.asm
.org/D
ownloaded from
Clinical and Vaccine Immunology
23 March 2009 23
8. Plikaytis, B.D., S. H. Turner, L. L. Gheesling, and G. M. Carlone. 1991. 471
Comparisons of standard curve fitting methods to quantitate Neisseria 472
meningitidis group A polysaccharide antibody level by enzyme-linked-473
imunosorbent assay. J. Clin. Microbiol. 29:1439–1446. 474
9. Rodbard, D., and G. R. Frazier. 1975. Statistical analysis of radioligand assay 475
data. Methods Enzymol. 37:3–22. 476
10. Soulier, J.P., and A. M. Couroucé-Pauty. 1973. New determinants of hepatitis 477
B antigen (Au or HB antigen). Vox Sang. 25:212–234. 478
11. Tan, C. Y., and B. Iglewicz. 1999. Measurement-methods comparisons and 479
linear statistical relationship. Technometrics. 41:192–201. 480
12. U.S. Department of Health and Human Services Food and Drug 481
Administration Center for Drug Evaluation and Research (CDER) Center 482
for Veterinary Medicine (CVM). 2001. Guidance for Industry. Bioanalytical 483
Method Validation. 484
13. U.S. Department of Health and Human Services Food and Drug 485
Administration Center for Drug Evaluation and Research (CDER). 2001. 486
Guidance for Industry. Statistical approaches to establish bioequivalence. 487
14. Vnek, J., and A. M. Prince. 1976. Large-scale purification of hepatitis B surface 488
antigen. J. Clin. Microbiol. 3:626–631. 489
15. World Health Organization (WHO). Expert Committee on Biological 490
Standardization Geneva 6-12th
Dec 1977. Study of a proposed international 491
reference preparation for anti-hepatitis B Immunoglobulin. 492
16. World Health Organization (WHO). 2004. Hepatitis B vaccines WHO position 493
paper. W.E.R. 79:255-263. 494
on July 9, 2018 by guesthttp://cvi.asm
.org/D
ownloaded from

Clinical and Vaccine Immunology
23 March 2009 24
Table 1: Clinical studies retested with the anti-HBs in-house assay 495
Study Population Group (vaccine)
Reference assay
N/group to be tested
TimePoint Rationale
A 50-70 years ● Experimental HepB formulation ● Engerix™-B
RIA 72 (subset)
PI-m1 PII-m2 PII-m6 PIII-m7
Verify concordance with AUSAB™ RIA in an elderly population
which reaches lower seroprotection rate and GMT than adults 18-40 years
B adult non-responders****
● Experimental HepB formulation ● Engerix™-B
RIA 58 (all)
Pre*** PI-m1 PII-m2 PII-m6 PIII-m7
Verify concordance with AUSAB™ RIA in a difficult population,
check specificity of the anti-HBs in-house assay on pre-vaccination samples
C 11-18 years ●Engerix™-B ●Recombivax™
RIA 72 (subset)
PI-m1 PII-m2 PII-m6 PIII-m7
Verify concordance with AUSAB™ RIA after vaccination with a
vaccine from another manufacturer
D 18-40 years ●Engerix™ old 1* ●Engerix™ old 2** ●Engerix™
EIA 72 (subset)
p2m6 p3m7
Verify concordance with AUSAB™ EIA following different
formulations of the same vaccine
E 12-15 years ●Ambirix™ 720/20 ●Twinrix™ 360/10
RIA, EIA 140 (all)
PIII-m7 Verify concordance with AUSAB ™ RIA and AUSAB™ EIA
F Children < 1 year
●Infanrix hexa™ ●Infanrix™ penta + Hiberix™
RIA 50 (subset)
Pre PII-m6 PII-m8 PIII-m9
Verify concordance with AUSAB™ RIA after vaccination with
HBV in combined pediatric vaccines
G children < 1 year
● Infanrix hexa™ ●Infanrix™ penta + Hiberix™
EIA 62 (all)
Pre-m1.5 PIII-m7 PIII-m15 PIV-m6
Verify concordance with AUSAB™ EIA after vaccination with
HBV in combined pediatric vaccines
* Old 1 : previous formulation, containing thiomersal as a preservative, **Old 2 : previous formulation, using thiomersal during the production process, *** pre= sample taken prior to vaccination, PI/ (II, III, IV) = post dose 1 (2, 3 or 4)m m1-15 = study month, **** non-responder = healthy adults with anti-HBs concentration < 10 mIU/ml 2 to 5 months after having received at least 4 doses of HBV
on July 9, 2018 by guesthttp://cvi.asm
.org/D
ownloaded from
Clinical and Vaccine Immunology
23 March 2009 25
Table 2: Calibration curve - distribution of the percentage of the absolute 496
values of the relative bias (% R.E.) for the complete set of standard points (0.95 497
percentile) 498
mIU/ml 2.92 5.84 11.69 23.38 46.75 93.50 187.00
0.95 percentile 14.41 8.59 6.31 4.51 4.11 3.12 1.60
% R.E. = (recalculated value - assigned value)/assigned value x 100% 499
on July 9, 2018 by guesthttp://cvi.asm
.org/D
ownloaded from

Clinical and Vaccine Immunology
23 March 2009 26
Table 3. Accuracy of anti-HBs in-house in terms of human anti-HBV 500
Immunoglobulin 501
Theoretical(mIU/ml) Measured (mIU/ml) Recovery %
3.3 3.4 100.4
6.3 5.6 90.4
6.3 5.8 93.4
10.4 9.8 94.2
10.4 9.4 90.3
20.8 19.9 95.5
20.8 18.9 90.8
41.5 42.0 101.2
41.5 41.7 100.4
82.6 81.1 98.2
82.6 80.1 96.9
163.9 129.9 79.3
163.9 150.0 91.5
476.2 446.0 93.7
909.1 840.6 92.5
2000.0 1967.9 98.4
3333.3 3304.4 99.1
5000.0 5048.4 101.0
10000.0 9885.2 98.9
Geometric mean recovery (%) 94.9
CI 95% lower limit (%) 92.2
CI 95% upper limit (%) 97.6
on July 9, 2018 by guesthttp://cvi.asm
.org/D
ownloaded from

Clinical and Vaccine Immunology
23 March 2009 27
Table 4: Demonstration of assay linearity. Estimated slope for each pre-502
dilution group with its 95% CI using a mixed model with log dilution, group and 503
samples as factors 504
95% confidence interval
Group Slope Lower limit Upper limit
1 -0.9990 -1.0318 -0.9662
2 -0.9910 -1.0348 -0.9472
3 -0.9802 -1.0180 -0.9423
4 -0.9976 -1.0722 -0.9230
10 samples with concentrations between 100 and 51,895 mIU/ml were grouped into 4 groups 505
according to the pre-dilution applied to reach the upper limit of the analytical range 506
on July 9, 2018 by guesthttp://cvi.asm
.org/D
ownloaded from

Clinical and Vaccine Immunology
23 March 2009 28
Table 5: Specificity of anti-HBs in-house compared to AUSAB™ EIA 507
Before preincubation HBsAg preincubation: ad + ay HBsAg preincubation: adw2
AUSLAB®EIA a-HBs in-house AUSLAB ®EIA a-HBs in-house AUSLAB ®EIA HBs in-house
mIU/ml mIU/ml mIU/ml %
specificity
mIU/ml %
specificity
mIU/ml %
specificity
mIU/ml %
specificity
20 15 <3.3 100 <3.3 100 <3.3 100 <3.3 100
94 61 <3.3 100 <3.3 100 <3.3 100 <3.3 100
119 125 <3.3 100 <3.3 100 <3.3 100 <3.3 100
346 352 <3.3 100 <3.3 100 <3.3 100 <3.3 100
382 428 <3.3 100 <3.3 100 <3.3 100 <3.3 100
1556 1111 <3.3 100 <3.3 100 <3.3 100 <3.3 100
1957 2410 <3.3 100 <3.3 100 <3.3 100 <3.3 100
2237 2575 <3.3 100 <3.3 100 <3.3 100 <3.3 100
49680 42660 <3.3 100 <3.3 100 86 99.8 49 99.9
54490 61065 <3.3 100 <3.3 100 651 98.8 103 99.8
<3.3 <3.3 <3.3 NA <3.3 NA <3.3 <3.3
<3.3 <3.3 <3.3 NA <3.3 NA <3.3 <3.3
<3.3 <3.3 <3.3 NA <3.3 NA <3.3 <3.3
Preincubation with either an excess of a mix of native ad and ay HBsAg subtypes or adw2 HBsAg subtype for 508
2 hours at 37°C. Specificity= difference in concentration observed before and after inhibition expressed as 509
percentage of the corresponding concentration measured without inhibition. 510
on July 9, 2018 by guesthttp://cvi.asm
.org/D
ownloaded from
Clinical and Vaccine Immunology
23 March 2009 29
Table 6: Calculation of the average concentration and coefficient of variance 511
(CV%) in three samples with high anti-HBs concentrations 512
Sample Dilution OD mUI/ml mUI/ml * CV (%)
1 1 > 3.000 >187
10000 1.652 772731 754411 3
100000 0.200 736091
2 1 > 3.000 >187
10000 1.438 644921 649409 1
100000 0.180 654897
3 1 > 3.000 >187
10000 1.705 833075 823976 2
100000 0.215 814878
* average concentration determined at 10,000 and 100,000 dilutions; OD=optical density;
CV=coefficient of variance
on July 9, 2018 by guesthttp://cvi.asm
.org/D
ownloaded from
Clinical and Vaccine Immunology
23 March 2009 30
Table 7: Contingency table between anti-HBs in-house and the AUSAB™ 513
RIA with different cutoffs (n= 919) 514
Cut-off (mIU/ml) 2 2.6 3.3 3.9
Agreement (95% CI) 97.71 (96.53,98.58) 97.82 (96.66,98.67) 97.61 (96.40,98.49) 96.74 (95.37,97.79)
Sensitivity (95% CI) 99.02 (98.08,99.58) 98.53 (97.45,99.24) 98.04 (96.84,98.88) 96.94 (95.52,98.01)
Specificity (95% CI) 87.13 (79.00,92.96) 92.08 (84.99,96.52) 94.06 (87.52,97.79) 95.05 (88.82,98.37)
Kappa 0.881 (0.830,0.931) 0.891 (0.843,0.938) 0.883 (0.835,0.931) 0.847 (0.793,0.900)
Mc-Nemar p value* 0.3833 0.5034 0.0525 0.0003
*: test of dissymmetry in concordance 515
on July 9, 2018 by guesthttp://cvi.asm
.org/D
ownloaded from
Clinical and Vaccine Immunology
23 March 2009 31
Table 8: Bio-equivalence of the slope for anti-HBs in-house compared to 516
AUSAB™ RIA 517
Deming Regression (Ultrastructural Model) with CV (RIA) =11.86% and CV ( anti-HBS in-
house)=11.86%: Test of Bio-equivalence on the Slope
Equivalence range
Lower specification Upper specification Equivalence
0.50 2.00 Yes
0.67 1.50 Yes
0.80 1.25 Yes
0.90 1.11 Yes
on July 9, 2018 by guesthttp://cvi.asm
.org/D
ownloaded from
Clinical and Vaccine Immunology
23 March 2009 32
518
Table 9 Seroprotection rates (%) per time point and study: Anti-HBs in-house versus reference assays 519
Vaccine Group 1 Vaccine Group 2 Vaccine Group 3 Study N Time point in-house RIA EIA in-house RIA EIA in-house EIA
72 PI-m1 15.3 20.8 - 0.0 2.7 - - - 72 PII-m2 80.6 81.9 - 23.6 26.4 - - - 72 PII-m6 95.8 93.1 - 59.7 56.9 - - -
A
72 PIII-m7 98.6 98.6 - 81.9 83.3 - - -
51 PI-m1 47.1 49.0 - 63.6 63.6 - - - 51 PII-m2 60.8 60.8 - 81.8 81.8 - - - 50 PII-m6 48.0 42.0 - 85.2 81.5 - - -
B
47 PIII-m7 72.3 72.3 - 96.2 96.2 - - -
100 PI-m1 2.0 2.0 - 9.7 12.5 - - - 72 PII-m2 80.6 68.1 - 68.1 69.4 - - - 72 PII-m6 93.1 93.1 - 95.8 95.8 - - -
C
72 PIII-m7 98.6 97.2 - 100.0 100.0 - - -
D 72 PIII-m7 97.2 - 95.8 97.2 - 97.2 97.2 97.2
134 PI/II-m2 53.0 40.3 41.8 90.4 86.8 86.8 - - E 145 PII/III-m7 99.3 98.6 99.3 100.0 100.0 100.0 - -
50 Pre 13.8 16.9 - 12.2 12.2 - - - 50 PII-m6 98.0 98.0 - 96.0 96.0 - - - 50 PII-m8 94.0 94.0 - 100.0 100.0 - - -
F
50 PIII-m9 100.0 100.0 - 100.0 100.0 - - -
34 Pre-m1.5 52.9 - 49.0 59.6 - 68.4 - - 47 PIII-m7 100.0 - 100.0 95.9 - 95.0 - - 53 PIII-m15 96.6 - 96.6 93.0 - 96.0 - -
G
57 PIV-m6 100.0 - 100.0 98.3 - 98.3 - -
N = number of subjects per group. If the number was different in the 2 groups, lowest number was taken, pre= sample taken prior to vaccination, PI/ (II, III,
IV) = post dose 1 (2, 3 or 4)m m1-15 = study month, in-house - anti-HBs in-house, RIA = AUSAB™ RIA, EIA= AUSAB™ EIA
on July 9, 2018 by guesthttp://cvi.asm
.org/D
ownloaded from

Clinical and Vaccine Immunology
23 March 2009 33
FIGURE LEGENDS 520
Figure 1: Linear regression between FBS and human-plasma anti-HBs free as diluent 521
Figure 2: Observed values and the model predictions for linearity assessment; for group 522
1 and 4, prediction line for each sample is superimposed with the prediction line for mean 523
sample within each group 524
Figure 3: Optical density response of serially dilutions of three high concentrated anti-525
HBs samples 526
Figure 4: Deming’s regression of anti-HBs in-house and AUSAB™ RIA with CV(RIA) = 527
11.86% and CV (anti-HBs in-house) = 11.86% 528
Figure 5: GMCs (mIU/ml) at each blood sampling time point in Study A (elderly), Study 529
E (adolescents) and Study F (infants): anti-HBs in-house versus reference assays 530
531
532
on July 9, 2018 by guesthttp://cvi.asm
.org/D
ownloaded from