development of wastewater collection network asset
TRANSCRIPT

Development of Wastewater Collection
Network Asset Database, Deterioration
Models and Management Framework
by
Rizwan Younis
A thesis
presented to the University of Waterloo
in fulfillment of the
thesis requirement for the degree of
Doctor of Philosophy
in
Civil Engineering
Waterloo, Ontario, Canada, 2010
©Rizwan Younis 2010

ii
AUTHOR'S DECLARATION
I hereby declare that I am the sole author of this thesis. This is a true copy of the thesis, including any
required final revisions, as accepted by my examiners.
I understand that my thesis may be made electronically available to the public.
iii
Abstract
The dynamics around managing urban infrastructure are changing dramatically. Today’s
infrastructure management challenges – in the wake of shrinking coffers and stricter
stakeholders’ requirements – include finding better condition assessment tools and
prediction models, and effective and intelligent use of hard-earn data to ensure the
sustainability of urban infrastructure systems. Wastewater collection networks – an important
and critical component of urban infrastructure – have been neglected, and as a result,
municipalities in North America and other parts of the world have accrued significant
liabilities and infrastructure deficits. To reduce cost of ownership, to cope with heighten
accountability, and to provide reliable and sustainable service, these systems need to be
managed in an effective and intelligent manner.
The overall objective of this research is to present a new strategic management framework
and related tools to support multi-perspective maintenance, rehabilitation and replacement
(M, R&R) planning for wastewater collection networks. The principal objectives of this
research include:
(1) Developing a comprehensive wastewater collection network asset database consisting
of high quality condition assessment data to support the work presented in this thesis, as
well as, the future research in this area.
iv
(2) Proposing a framework and related system to aggregate heterogeneous data from
municipal wastewater collection networks to develop better understanding of their
historical and future performance.
(3) Developing statistical models to understand the deterioration of wastewater pipelines.
(4) To investigate how strategic management principles and theories can be applied to
effectively manage wastewater collection networks, and propose a new management
framework and related system.
(5) Demonstrating the application of strategic management framework and economic
principles along with the proposed deterioration model to develop long-term financial
sustainability plans for wastewater collection networks.
A relational database application, WatBAMS (Waterloo Buried Asset Management System),
consisting of high quality data from the City of Niagara Falls wastewater collection system is
developed. The wastewater pipelines’ inspections were completed using a relatively new
Side Scanner and Evaluation Technology camera that has advantages over the traditional
Closed Circuit Television cameras. Appropriate quality assurance and quality control
procedures were developed and adopted to capture, store and analyze the condition
assessment data. To aggregate heterogeneous data from municipal wastewater collection
systems, a data integration framework based on data warehousing approach is proposed. A
prototype application, BAMS (Buried Asset Management System), based on XML
technologies and specifications shows implementation of the proposed framework. Using

v
wastewater pipelines condition assessment data from the City of Niagara Falls wastewater
collection network, the limitations of ordinary and binary logistic regression methodologies
for deterioration modeling of wastewater pipelines are demonstrated. Two new empirical
models based on ordinal regression modeling technique are proposed. A new multi-
perspective – that is, operational/technical, social/political, regulatory, and finance – strategic
management framework based on modified balanced-scorecard model is developed. The
proposed framework is based on the findings of the first Canadian National Asset
Management workshop held in Hamilton, Ontario in 2007. The application of balanced-
scorecard model along with additional management tools, such as strategy maps, dashboard
reports and business intelligence applications, is presented using data from the City of
Niagara Falls. Using economic principles and example management scenarios, application of
Monte Carlo simulation technique along with the proposed deterioration model is presented
to forecast financial requirements for long-term M, R&R plans for wastewater collection
networks.
A myriad of asset management systems and frameworks were found for transportation
infrastructure. However, to date few efforts have been concentrated on understanding the
performance behaviour of wastewater collection systems, and developing effective and
intelligent M, R&R strategies. Incomplete inventories, and scarcity and poor quality of
existing datasets on wastewater collection systems were found to be critical and limiting
issues in conducting research in this field. It was found that the existing deterioration models
either violated model assumptions or assumptions could not be verified due to limited and
questionable quality data. The degradation of Reinforced Concrete pipes was found to be

vi
affected by age, whereas, for Vitrified Clay pipes, the degradation was not age dependent.
The results of financial simulation model show that the City of Niagara Falls can save
millions of dollars, in the long-term, by following a pro-active M, R&R strategy.
The work presented in this thesis provides an insight into how an effective and intelligent
management system can be developed for wastewater collection networks. The proposed
framework and related system will lead to the sustainability of wastewater collection
networks and assist municipal public works departments to proactively manage their
wastewater collection networks.

vii
Acknowledgements
I would like to express my sincerest gratitude for my supervisor, Dr. Mark Knight, for his
graciousness and patience, as well as, for all the support to allow me to explore various ideas
during my PhD tenure. Dr. Knight provided watchful guidance, extra insight and good advice
whenever required. His ability to build win-win partnerships and invoke critical thinking in
his students is much appreciated.
My sincere thanks to the examination committee members, Dr. Richard Cook, Dr. Carl Haas,
and Dr. Mahesh Pandey, for reviewing this thesis, and for their thought-provoking questions,
comments and advice during my comprehensive examination. I would also like to thank my
external examiner, Dr. Dulcy M. Abraham, from Purdue University, for giving her time to
review my thesis and for providing thoughtful recommendations to improve the manuscript.
I wish to thank Dr. David Mathews, Dr. Paul Marriot and Dr. Richard Cook from the
Statistics and Actuarial Science Department, University of Waterloo, for enhancing my
knowledge of Statistics – the science of sciences. I was both intrigued and fascinated by the
application of Statistics to solve engineering problems. My sincere thanks are due to Dr.
Rehan Sadiq from National Research Council, Canada (now at the University of British
Columbia, Okanagan) for his constant support and valuable suggestions throughout my
studies.
I am tremendously indebted to the Canadian Water Network for providing initial research
funds and ample training opportunities for personal and professional growth. I would like to

viii
thank NSERC, OGSST and the University of Waterloo for providing doctoral and merit
scholarships and bursaries. I would like to extend a special thank you to the Centre for
Advancement of Trenchless Technologies located at the University of Waterloo for
providing technical and professional support.
This research would not have been possible without the assistance of the City of Niagara
Falls Public Works Department (PWD) and Pipeflo Contracting Corporation, Hamilton,
Ontario. I am grateful to Mr. Bob Darrall and his staff members at the City of Niagara Falls
PWD for their assistance; Bob inspired me with his intrinsic knowledge of water and
wastewater infrastructure. I would also like to thank original partners of this project, namely,
Mr. David Watt, former Infrastructure Manager at the City of Niagara Falls PWD, and Mr.
Bruce Nobel, President of Pipeflo Contracting Corporation.
I thank my friends and former colleagues at the University of Waterloo, namely, Dr.
Xianxum (Arnold) Yuan, Dr. Alireza Bayat, Dr. Karl Lawrence, Dr. Zahid Khan, and Mr.
Rashid Rehan. I cherish their friendship and support in making my stay at Waterloo
unforgettable.
Finally, I thank my wife, Asima, for her steadfast support throughout my studies and taking
care of our kids. I would also like to thank my parents and siblings for their continued
support and encouragement. A very special thanks to my mother-in-law, Rashida, who
despite of her serious illness, travelled long distance to help us.
Thank you.
ix
Dedication
To my wife, Asima, and my parents, Azra and Younis, for their love and continued support.
And to my lovely children, Aleena and Rayyan, for bringing so much joy to my life.

x
Table of Contents
AUTHOR'S DECLARATION ................................................................................................. ii
Abstract .................................................................................................................................... iii
Acknowledgements ................................................................................................................. vii
Dedication ................................................................................................................................ ix
Table of Contents ...................................................................................................................... x
List of Figures ....................................................................................................................... xvii
List of Tables ......................................................................................................................... xxi
Chapter 1 Introduction .............................................................................................................. 1
1.1 Background and Motivation ............................................................................................ 1
1.2 Research Objectives and Scope....................................................................................... 4
1.3 Thesis Organization ........................................................................................................ 5
References ............................................................................................................................. 7
Chapter 2 Wastewater Collection Systems and Advances in Pipeline Asset Management
Using Digital Side Scanning Evaluation Technology .............................................................. 9
2.1 Abstract ......................................................................................................................... 10
2.2 Wastewater Infrastructure Systems ............................................................................... 11
2.2.1 Types of Wastewater Pipelines .............................................................................. 12
2.3 Wastewater Pipelines Inspection ................................................................................... 13
2.4 Pipeline Defect Coding ................................................................................................. 18
2.5 Pipeline Condition Rating ............................................................................................. 19
2.6 Wastewater Pipeline Construction and Pipeline Inspection .......................................... 21
2.7 Wastewater Network Deterioration Modeling .............................................................. 23
2.8 Need for A Wastewater Pipeline Inspection Approach ................................................ 24
xi
2.9 Advantages of Moving To the New Scanning Technology for Wastewater Pipelines
Asset Management .............................................................................................................. 28
2.10 Conclusions ................................................................................................................. 29
References ........................................................................................................................... 31
Chapter 3 Development of Wastewater Collection Network Asset Database and Data
Integration Framework ............................................................................................................ 33
3.1 Abstract ......................................................................................................................... 34
3.2 Introduction ................................................................................................................... 36
3.3 Development of Public-Private Partnership and Research Collaboration .................... 39
3.3.1 Background ............................................................................................................. 40
3.3.2 Needs Assessment and Technology Review .......................................................... 41
3.3.3 Technology Selection ............................................................................................. 43
3.3.4 Public-Private Partnership ...................................................................................... 46
3.3.5 Research Added-Value ........................................................................................... 48
3.3.6 Project Challenges, Lessons Learned and Good Practices ..................................... 50
3.4 Development of WatBAMS (Waterloo Buried Asset Management System) ............... 53
3.4.1 Establishment of Data Requirements ..................................................................... 54
3.4.2 Quality Assurance and Quality Control ................................................................. 55
3.4.3 Pipeline Inspections and Defect Coding ................................................................. 56
3.4.4 Database Integrity and Consistency ....................................................................... 58
3.4.5 Database Security ................................................................................................... 59
3.4.6 Data Analysis and Data Processing ........................................................................ 60
3.4.7 Physical Data Storage ............................................................................................. 66
3.5 Data Integration Framework ......................................................................................... 66
3.5.1 An Overview of Database Integration – Techniques, Types, and Issues ............... 67
3.5.2 Data Exchange Technologies – Definitions and Specifications ............................. 70
3.5.3 Data Integration Workflow ..................................................................................... 73
3.5.4 Rationale for the Proposed Data Integration Approach.......................................... 75
3.5.5 Data Integration for Wastewater Infrastructure – Case Study ................................ 76
xii
3.6 Discussion and Conclusions .......................................................................................... 86
References ........................................................................................................................... 89
Chapter 4 Review of State-of-the-Art Statistical Deterioration Models for Wastewater
Pipelines .................................................................................................................................. 95
4.1 Abstract ......................................................................................................................... 96
4.2 Introduction ................................................................................................................... 98
4.3 Wastewater Pipelines Condition Assessment ............................................................... 98
4.3.1 Wastewater Pipelines Inspection Technologies ..................................................... 99
4.3.2 Wastewater Pipelines Defects Identification and Classification .......................... 100
4.3.3 Wastewater Pipelines Condition Grading ............................................................ 101
4.4 Wastewater Pipelines Condition Assessment Data ..................................................... 103
4.5 State-of-the-Art Deterioration Models ........................................................................ 105
4.6 Case Study ................................................................................................................... 108
4.6.1 City of Niagara Falls Wastewater Pipelines Condition Assessment Data ............ 108
4.6.2 Application and Discussion of Existing Models .................................................. 110
4.7 Discussion and Conclusions ........................................................................................ 116
References ......................................................................................................................... 119
Chapter 5 A Probability Model for Investigating the Trend of Structural Deterioration of
Wastewater Pipelines ............................................................................................................ 123
5.1 Abstract ....................................................................................................................... 124
5.2 Introduction ................................................................................................................. 126
5.3 Literature Review ........................................................................................................ 128
5.3.1 Condition Assessment of Wastewater Pipelines .................................................. 128
5.3.2 Ordinal Regression Models .................................................................................. 131
5.4 Problem Statement and Proposed Model Review ....................................................... 132
5.4.1 Problem Description ............................................................................................. 132
5.4.2 Model Description ................................................................................................ 132
5.4.3 Assumptions ......................................................................................................... 134
xiii
5.4.4 Interaction ............................................................................................................. 135
5.4.5 Estimation ............................................................................................................. 135
5.4.6 Model Validation .................................................................................................. 136
5.4.7 Important Considerations Related To Model Estimation and Validation ............ 137
5.5 Case Study ................................................................................................................... 138
5.5.1 City of Niagara Falls Pipeline Condition Assessment Data ................................. 139
5.5.2 Linearity and Ordinality Assumptions Verification ............................................. 144
5.5.3 Parameter Estimates ............................................................................................. 148
5.5.4 Model Validation .................................................................................................. 151
5.5.5 Model Interpretation ............................................................................................. 154
5.6 Conclusions ................................................................................................................. 157
References ......................................................................................................................... 160
Chapter 6 Continuation-ratio Model for the Performance Behavior of Wastewater Collection
Networks ............................................................................................................................... 163
6.1 Abstract ....................................................................................................................... 164
6.2 Introduction ................................................................................................................. 166
6.3 Literature Review ........................................................................................................ 168
6.3.1 Condition Assessment of Wastewater Pipelines .................................................. 168
6.3.2 Wastewater Pipelines Deterioration Models ........................................................ 170
6.3.3 Ordinal Regression Models for Wastewater Pipelines Deterioration ................... 173
6.4 Purpose/Problem Statement ........................................................................................ 174
6.5 Continuation Ratio Model ........................................................................................... 175
6.5.1 Estimation ............................................................................................................. 178
6.5.2 Assumptions ......................................................................................................... 180
6.5.3 Validation ............................................................................................................. 180
6.6 Case Study ................................................................................................................... 182
6.6.1 City of Niagara Falls Pipeline Condition Assessment Data ................................. 182
6.6.2 Verification of Ordinality Assumption ................................................................. 187
6.6.3 Model Parameter Estimates .................................................................................. 188

xiv
6.6.4 Model Validation .................................................................................................. 193
6.6.5 Discussion ............................................................................................................. 195
6.7 Conclusions ................................................................................................................. 198
References ......................................................................................................................... 200
Chapter 7 Strategic Asset Management Framework for Wastewater Collection Systems
Based on Modified Balanced Scorecard Model.................................................................... 205
7.1 Abstract ....................................................................................................................... 206
7.2 Introduction ................................................................................................................. 208
7.3 Literature Overview .................................................................................................... 211
7.4 Infrastructure/Asset Management ............................................................................... 211
7.5 Infrastructure Management Frameworks .................................................................... 214
7.5.1 Sewerage Rehabilitation Manual .......................................................................... 218
7.5.2 Best Management Practices Guides ..................................................................... 218
7.5.3 Benchmarking Initiatives ...................................................................................... 219
7.5.4 CARE-S and CARE-W ........................................................................................ 221
7.5.5 Asset Management Software ................................................................................ 221
7.6 Discussion on Current State of Civil Infrastructure Management Practices ............... 222
7.7 Proposed Asset Management Framework ................................................................... 224
7.7.1 Strategic Management .......................................................................................... 225
7.7.2 The Balanced Scorecard Model ............................................................................ 225
7.8 Strategic Management Framework for Wastewater Collection Networks .................. 227
7.9 Modified Balanced Scorecard – Formulation of Perspectives and Objectives ........... 231
7.10 Framework Implementation, Monitoring, and Reporting ......................................... 234
7.11 Example Framework ................................................................................................. 235
7.11.1 The Situation ...................................................................................................... 236
7.11.2 Mission and Vision ............................................................................................. 236
7.11.3 Strategy ............................................................................................................... 236
7.11.4 The Strategy Map ............................................................................................... 237
7.11.5 Modified Balanced Scorecard ............................................................................ 238
xv
7.11.6 Implementation, Monitoring, and Reporting ...................................................... 246
7.12 Conclusions ............................................................................................................... 251
References ......................................................................................................................... 253
Chapter 8 Strategic Financial Planning for Wastewater Collection Networks Part 1: The
Framework ............................................................................................................................ 257
8.1 Abstract ....................................................................................................................... 258
8.2 Introduction ................................................................................................................. 260
8.3 Overview of Economic Analysis for Wastewater Infrastructure Management .......... 263
8.4 Proposed Strategic Financial Planning Framework .................................................... 264
8.4.1 Strategic Planning ................................................................................................. 265
8.4.2 System Support ..................................................................................................... 271
8.4.3 Economic Analysis ............................................................................................... 277
8.4.4 Decision Support .................................................................................................. 282
8.5 Discussion and Conclusions ........................................................................................ 284
References ......................................................................................................................... 286
Chapter 9 Strategic Financial Planning for Wastewater Collection Networks Part 2:
Application and Results ........................................................................................................ 290
9.1 Abstract ....................................................................................................................... 291
9.2 Introduction ................................................................................................................. 293
9.3 Literature Overview .................................................................................................... 294
9.4 Objective and Problem Description ............................................................................ 296
9.5 City of Niagara Falls Pipeline Condition Assessment Data ........................................ 299
9.6 Deterioration Model .................................................................................................... 300
9.7 Economic Analysis ...................................................................................................... 302
9.7.1 Input Variables ..................................................................................................... 304
9.7.2 Output Variable or Decision Metric ..................................................................... 309
9.8 Results ......................................................................................................................... 309
9.9 Discussion and Conclusions ........................................................................................ 327

xvi
References ......................................................................................................................... 331
Chapter 10 Conclusions, Contributions and Future Recommendations ............................... 335
10.1 General Summary ...................................................................................................... 335
10.2 Conclusions and Contributions ................................................................................. 335
10.2.1 Condition Assessment Database ......................................................................... 335
10.2.2 Data Integration Framework ............................................................................... 336
10.2.3 Deterioration Models .......................................................................................... 336
10.2.4 Framework for Multi-Perspective Management of Wastewater Collection
Networks ........................................................................................................................ 337
10.2.5 Strategic Financial Planning ............................................................................... 338
10.3 Considerations for the Research Implementation ..................................................... 339
10.4 Future Recommendations .......................................................................................... 341

xvii
List of Figures
Figure 2.1: Wastewater Infrastructure System (adapted from Grigg, 2003) .......................... 11
Figure 2.2: Types of Sewers Based on Material ..................................................................... 13
Figure 2.3: Sewer Scanner Evaluation Technology Pipe Scan and Unfolded Pipe Image
(courtesy of Envirosight LLC.) ............................................................................................... 15
Figure 2.4: iPek DigiSewer® Camera System Distributed by Envirosight LLC. .................. 16
Figure 2.5: PANORAMO Camera (at two different positions in a pipe. Pictures are joined
together to form a 360 degree image) ..................................................................................... 17
Figure 2.6: IBAK PANORAMO Camera System Distributed by RapidView LLC. in North
America ................................................................................................................................... 17
Figure 2.7: Conceptual Pipeline Deterioration Plot Using WRc’s ICG Methodology ........... 26
Figure 2.8: Conceptual Pipeline Segment Deterioration Curves – Linear - Linear and Non-
Linear ...................................................................................................................................... 27
Figure 2.9: Pipe Age at ICG 3 ................................................................................................ 28
Figure 3.1: Number of databases published in the Nucleic Acids Research (NAR) Database
Issues (Baker and Cheung, 2007) ........................................................................................... 38
Figure 3.2: Unfolding of SSET Image (Blackhawk-PAS, 2001)............................................ 44
Figure 3.3: PipeFlo Contracting Corp. and the City of Niagara Falls Owned SSET Camera 45
Figure 3.4: SSET Sample Imagery Obtained From the City Of Niagara Falls ....................... 45
Figure 3.5: Minimum Data Requirements .............................................................................. 57
Figure 3.6: Pipe Attributes ...................................................................................................... 57
Figure 3.7: The Two-Database Approach (Microsoft Corporation, 2002) ............................. 60
Figure 3.8: Data Flow Diagram for Data Analysis ................................................................. 62
Figure 3.9: WatBAMS (Waterloo Buried Asset Management System) ................................. 63
Figure 3.10: The Soil Map (developed using geotechnical reports) ....................................... 64
Figure 3.11: Spatial Distribution of Pipelines Structural Internal Condition Grades ............. 65
Figure 3.12: Data Transformation Process (adapted from Brundage et al., 2000) ................. 73
Figure 3.13: Database Integration Process .............................................................................. 74
Figure 3.14: Buried Asset Management System Entity-Relation Diagram ............................ 77
xviii
Figure 3.15: Buried Asset Management System Schema Definitions .................................... 78
Figure 3.16: A Snippet of the City of Winnipeg Sewer Management System ....................... 81
Figure 3.17: Part of the City of Niagara Falls MIDS and WatBAMS Databases ................... 82
Figure 3.18: A Snippet of XSLT Stylesheet Tree for SMS Database Transformation ........... 85
Figure 4.1: Hypothetical Deterioration Phenomenon using WRc's ICG .............................. 104
Figure 4.2: Simplified Deterioration Curve (Stevenson and Macey, 2005) ......................... 107
Figure 4.3: Data Collection and Deterioration Modeling Framework .................................. 110
Figure 4.4: Scatter Plot of ICG and Age and a Quadratic Regression Line .......................... 113
Figure 4.5: Normal Probability Plot of Residuals (from the model shown in Figure 4.4) ... 113
Figure 5.1: Data Collection and Analysis Framework.......................................................... 140
Figure 5.2: Distribution of Various Pipe Materials - City of Niagara Falls Sewer System .. 141
Figure 5.3: Modeling Flow Chart ......................................................................................... 144
Figure 5.4: Linearity of Response with age (Younis and Knight, 2008) .............................. 145
Figure 5.5: Ordinality of Response with age ........................................................................ 147
Figure 5.6: Predicted Probabilities for RC Pipes .................................................................. 155
Figure 5.7: Comparison of Predicted Probabilities for RC and VC Pipes ............................ 156
Figure 6.1: Nested Dichotomies ........................................................................................... 179
Figure 6.2: Data Collection and Analysis Framework.......................................................... 184
Figure 6.3: Distribution of Various Pipe Materials - City of Niagara Falls Sewer System .. 185
Figure 6.4(a): Open and Defective Joint – VC Pipe ............................................................. 186
Figure 6.5: Ordinality of Response with age ........................................................................ 187
Figure 6.6: Predicted Conditional Probabilities for RC Pipes .............................................. 191
Figure 6.7: Predicted Conditional Probabilities for VC Pipes .............................................. 192
Figure 6.8: Predicted Probabilities of Being in Different ICG for RC Pipes ....................... 192
Figure 7.1: Technical Elements of Asset Management (adapted from Gohier, 2006) ......... 213
Figure 7.2: Overall Framework for Infrastructure Management (Hudson et al., 1997) ....... 215
Figure 7.3: Basic and Advanced Asset Management Strategies (adapted from NAMS, 2002)
............................................................................................................................................... 216
Figure 7.4: National Asset Management Framework (NAMWG, 2009) ............................. 217
xix
Figure 7.5: Full Investigation Flowchart (WRc, 2001)......................................................... 219
Figure 7.6: Life-Cycle of Asset Management – Temporary Enthusiasms (Woodhouse, 2009)
............................................................................................................................................... 222
Figure 7.7: The Balanced Scorecard (Niven, 2005) ............................................................. 226
Figure 7.8: Proposed Strategic Management Framework ..................................................... 229
Figure 7.9: Modified Balanced Scorecard Model ................................................................. 234
Figure 7.10: Strategy Map for Sustainable Wastewater Infrastructure – an Example .......... 240
Figure 7.11: System Configuration for Strategic Management Framework ......................... 247
Figure 7.12: Part of the Example Dashboard ........................................................................ 250
Figure 8.1: Strategic Financial Planning Framework for Wastewater Collection Networks 266
Figure 8.2: Financial Simulation Steps ................................................................................. 281
Figure 8.3: Economic Feasibility Analysis (adapted from Greenberg, 2003) ...................... 283
Figure 9.1: Flowchart Illustrating the Methodology for Economic Analysis ....................... 298
Figure 9.2: Predicted Probabilities for RC Pipes .................................................................. 302
Figure 9.3: Renovation/Replacement Cost Distributions in Internal Condition Grades (ICG)
3, 4 and 5 ............................................................................................................................... 306
Figure 9.4: Discount Rate, ~ (6%,.025)i N ......................................................................... 307
Figure 9.5: Scenario S1 – Do Nothing (No Rehabilitation/Replacement Work Performed) RC
Pipelines’ Predicted Lengths ................................................................................................. 312
Figure 9.6: Scenario S2 – Predicted, Rehabilitated and Replaced RC Pipes’ Length to Sustain
Current Network Condition .................................................................................................. 312
Figure 9.7: Scenario S3 – Predicted ICG 5, RC Pipes’ Length to Be Replaced ................... 313
Figure 9.8: Scenario S4 – Predicted ICG 4 and 5, RC Pipes Length to be Renovated and
Replaced ................................................................................................................................ 313
Figure 9.9: Scenario S5 – Predicted ICG 3, 4 and 5, RC Pipes’ Length to be Renovated and
Replaced ................................................................................................................................ 314
Figure 9.10: Estimated Future Net Cost Cash Flows ............................................................ 315
Figure 9.11: Present Worth of M,R&R Costs Under Five Management scenarios .............. 317
Figure 9.12: Quantile Plots for PW for Five Management Scenarios .................................. 318
xx
Figure 9.13: Lognormal Model Fit for Present Worth of M,R&R Alternatives ................... 319
Figure 9.14: Risk Comparison of Five Management Scenarios ........................................... 324
Figure 9.15: Risk Profile – Present Worth of Future Costs Vs Probability .......................... 324
Figure 9.16: Sensitivity Analysis for Scenario S5 – Change in Present Value of Costs with
Discount Rate ........................................................................................................................ 327

xxi
List of Tables
Table 4.1: Structural Internal Condition Grading (WRc, 2001) ........................................... 102
Table 4.2: Internal Condition Grades (WRc, 2001) .............................................................. 102
Table 4.3: Parameter Estimates for Binary Logistic and Ordinal Logit Regression Models 114
Table 5.1: Pipelines Data Classified by Material, Age, and Internal Condition Grade ....... 143
Table 5.2: Quartiles Analyses for Checking Linearity Assumption ..................................... 145
Table 5.3: Fractional Polynomial Analysis ........................................................................... 146
Table 5.4: Estimated Coefficients; the Likelihood Ratio (LR) Test Statistics, G2; and p-value
for the Change for Models .................................................................................................... 150
Table 5.5: Goodness-of-fit Statistics ..................................................................................... 151
Table 5.6: Model Performance – Observed and Predicted Counts ....................................... 153
Table 6.1: Category Comparison for CR Model for Five Grades......................................... 179
Table 6.2: Continuation Ratio Model (logit link) - Parameter Estimates ............................. 190
Table 6.3: Observed Frequency, Conditional Probabilities, and Estimated Conditional
Probabilities for RC Pipes ..................................................................................................... 194
Table 7.1: Components of Strategic Management Framework (Glossary) .......................... 230
Table 7.2: Modified Balanced Scorecard for Wastewater Collection Systems – An Example
............................................................................................................................................... 241
Table 7.3: Data Definition Table .......................................................................................... 243
Table 7.4: Operational/Technical Sustainability Metrics ..................................................... 248
Table 7.5: Operational/Technical Sustainability Score ........................................................ 249
Table 8.1: Strategic Financial Planning Framework for Wastewater Collection Networks . 267
Table 8.2: Internal Condition Grades (WRc, 2001) .............................................................. 273
Table 8.3: Factors for Rate-of-Return Formulas – Discrete Cash Flows and Discrete
Compounding (adapted from Lang and Merino (1993)) ...................................................... 279
Table 9.1: Deterioration Model Parameter Estimates ........................................................... 301
Table 9.2: Management Scenarios ........................................................................................ 303
Table 9.3: Rehabilitation Costs (adapted from Bainbridge and Macey, 2005; Leung et al.
2007) ..................................................................................................................................... 306

xxii
Table 9.4: Management Scenarios and Assumed Pipe Lengths for Renovation and
Replacement .......................................................................................................................... 308
Table 9.5: Lognormal Model Estimated Parameters for the Five Scenarios ........................ 322
Table 9.6: Two Sample Wilcoxon Rank-Sum (Mann-Whitney) Test Classified by Variable
Scenario................................................................................................................................. 326
Table 9.7: Median Test ......................................................................................................... 326

1
Chapter 1
Introduction
1.1 Background and Motivation
Wastewater collection system, an important and critical component of urban infrastructure, is
responsible for safe and secure disposal of water from domestic, industrial, commercial, and
public usage (Grigg, 2003). It is a common knowledge that most of wastewater collection
infrastructure in many cities has either reached or near the end of its expected service life
(Dalziel and Macey, 2004; Grigg, 2003). The concern about structural and operational
performance of these systems is growing with increasing cases of pipelines collapses,
flooding of streets and properties and groundwater contamination. Wirahadikusumah et al.
(1998) wrote,
“Defective sewer systems are ‘time bombs’, threatening to
contaminate the groundwater and soil, in addition to causing
traffic disruptions, loss of property, and in some cases, even
loss of life.”
According to Wirahadikusumah et al. (1999), thousands of kilometers of wastewater
pipelines which were laid in different times over the history – some dating back to more than
hundred years – remained virtually forgotten and untouched until a failure occurred. Iseley
(2003) attributed this neglect to ‘out of sight, out of mind’ nature of these assets. Historically,
there has been little to no investment to investigate their condition or to find the need for
rehabilitation, and thus prolonging their lives. Now, there is a consensus amongst various
agencies that billions of dollars of expenditures will be needed for the replacement of
2
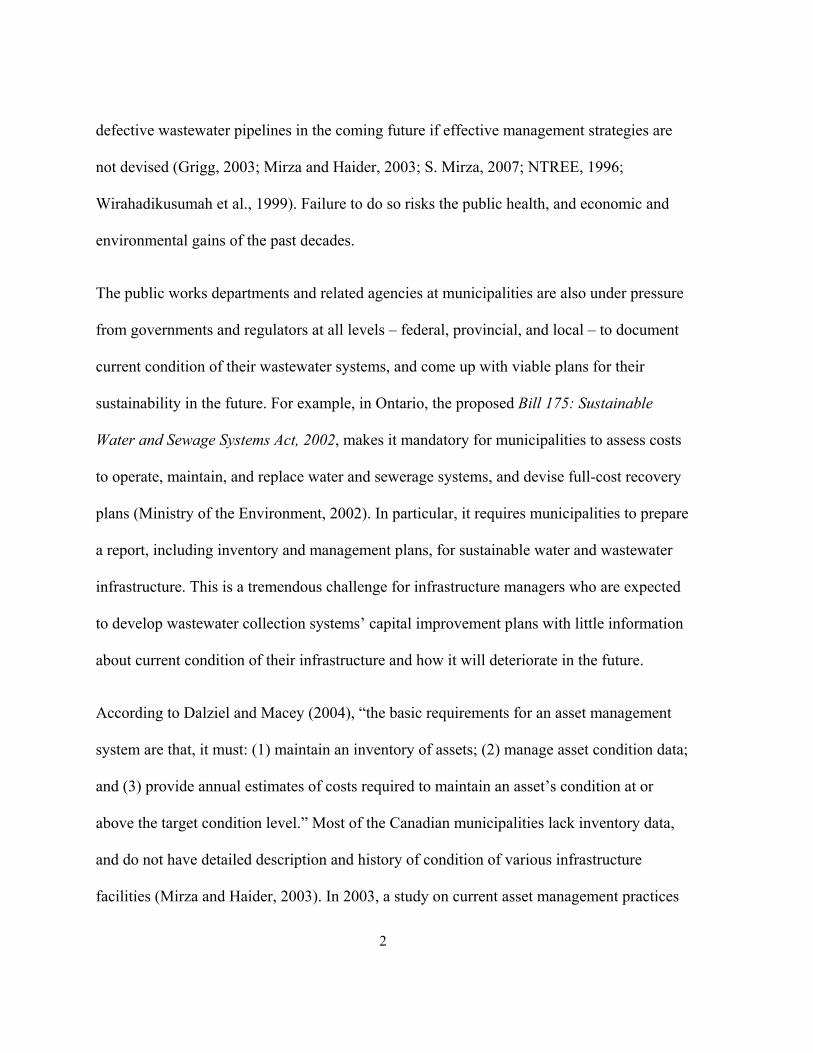
defective wastewater pipelines in the coming future if effective management strategies are
not devised (Grigg, 2003; Mirza and Haider, 2003; S. Mirza, 2007; NTREE, 1996;
Wirahadikusumah et al., 1999). Failure to do so risks the public health, and economic and
environmental gains of the past decades.
The public works departments and related agencies at municipalities are also under pressure
from governments and regulators at all levels – federal, provincial, and local – to document
current condition of their wastewater systems, and come up with viable plans for their
sustainability in the future. For example, in Ontario, the proposed Bill 175: Sustainable
Water and Sewage Systems Act, 2002, makes it mandatory for municipalities to assess costs
to operate, maintain, and replace water and sewerage systems, and devise full-cost recovery
plans (Ministry of the Environment, 2002). In particular, it requires municipalities to prepare
a report, including inventory and management plans, for sustainable water and wastewater
infrastructure. This is a tremendous challenge for infrastructure managers who are expected
to develop wastewater collection systems’ capital improvement plans with little information
about current condition of their infrastructure and how it will deteriorate in the future.
According to Dalziel and Macey (2004), “the basic requirements for an asset management
system are that, it must: (1) maintain an inventory of assets; (2) manage asset condition data;
and (3) provide annual estimates of costs required to maintain an asset’s condition at or
above the target condition level.” Most of the Canadian municipalities lack inventory data,
and do not have detailed description and history of condition of various infrastructure
facilities (Mirza and Haider, 2003). In 2003, a study on current asset management practices
3
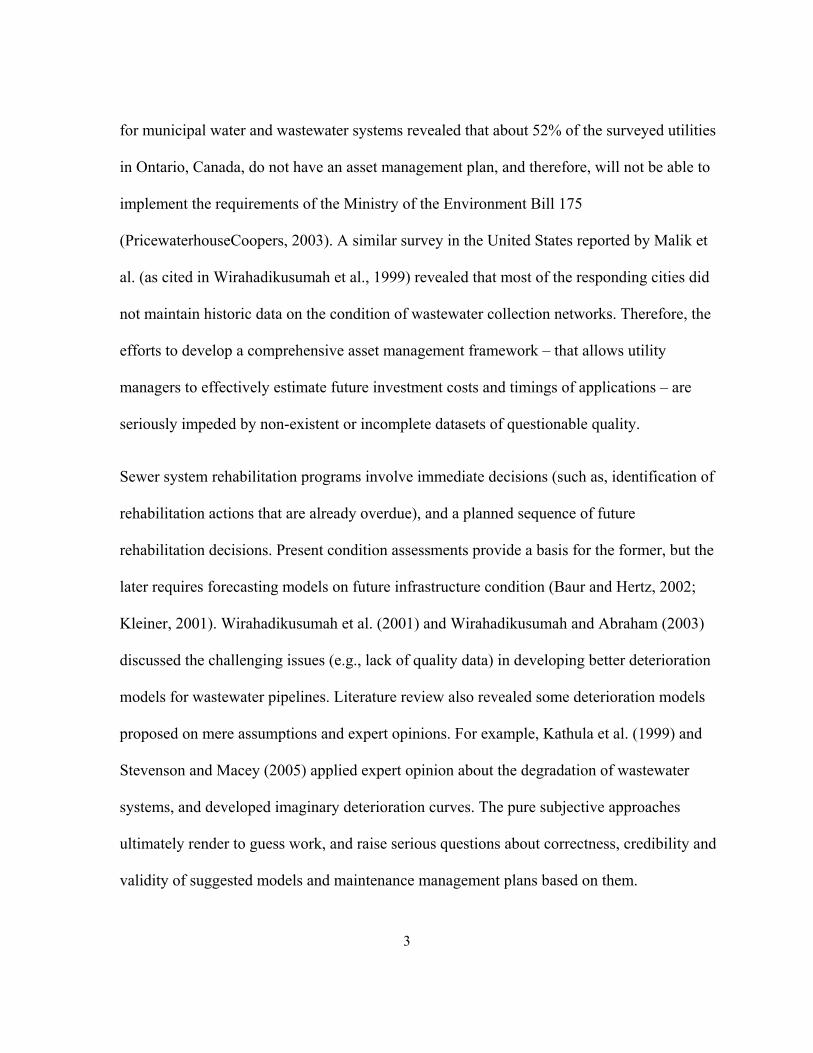
for municipal water and wastewater systems revealed that about 52% of the surveyed utilities
in Ontario, Canada, do not have an asset management plan, and therefore, will not be able to
implement the requirements of the Ministry of the Environment Bill 175
(PricewaterhouseCoopers, 2003). A similar survey in the United States reported by Malik et
al. (as cited in Wirahadikusumah et al., 1999) revealed that most of the responding cities did
not maintain historic data on the condition of wastewater collection networks. Therefore, the
efforts to develop a comprehensive asset management framework – that allows utility
managers to effectively estimate future investment costs and timings of applications – are
seriously impeded by non-existent or incomplete datasets of questionable quality.
Sewer system rehabilitation programs involve immediate decisions (such as, identification of
rehabilitation actions that are already overdue), and a planned sequence of future
rehabilitation decisions. Present condition assessments provide a basis for the former, but the
later requires forecasting models on future infrastructure condition (Baur and Hertz, 2002;
Kleiner, 2001). Wirahadikusumah et al. (2001) and Wirahadikusumah and Abraham (2003)
discussed the challenging issues (e.g., lack of quality data) in developing better deterioration
models for wastewater pipelines. Literature review also revealed some deterioration models
proposed on mere assumptions and expert opinions. For example, Kathula et al. (1999) and
Stevenson and Macey (2005) applied expert opinion about the degradation of wastewater
systems, and developed imaginary deterioration curves. The pure subjective approaches
ultimately render to guess work, and raise serious questions about correctness, credibility and
validity of suggested models and maintenance management plans based on them.

4
1.2 Research Objectives and Scope
The overall objective of this research is to provide a framework for intelligent and cost-
effective maintenance, rehabilitation and reconstruction (M,R&R) of wastewater collection
systems. To achieve this goal, specific objectives include the following:
1. Investigate historic perspective and review state-of-the-art with regards to condition
assessment and rehabilitation planning of wastewater collection systems;
2. Develop a high quality wastewater collection network asset database, and devise a
framework and related prototype system to combine wastewater infrastructure data from
heterogeneous organizations;
3. Investigate state-of-the-art deterioration models for wastewater collection pipelines and
develop new model(s).
4. Explore strategic planning theories and management principles to develop a multi-
perspective (e.g., financial, operational/technical, regulatory, socio/political) management
framework applicable to wastewater collection systems, and demonstrate applicability of
the proposed management framework using a case study.
5. Demonstrate application of the proposed framework and deterioration model(s) for
strategic financial planning of wastewater collection networks.

5
1.3 Thesis Organization
The thesis sequentially addresses the research objectives in an integrated-article format – that
is, each chapter is in the form of a paper already submitted (or to be submitted) to a technical
journal or refereed conference.
Chapter 2 provides a historic perspective with respect to wastewater collection systems and
reviews state-of-the-art in wastewater pipelines condition assessment and rehabilitation
planning. It also highlights the need for better condition assessment technologies and
improved understanding of deterioration of wastewater pipelines.
Chapter 3 discusses the development of a public-private partnership and research
collaboration to achieve the objectives outlined in Section 1.2. It also presents the
development of a wastewater collection network asset database, and provides a framework
and support system to integrate heterogeneous data from multiple wastewater collection
systems.
Chapters 4, 5 and 6 are related to the deterioration modeling of wastewater pipelines. In
Chapter 4, ordinary and binary logistic regression techniques are applied to wastewater
pipelines condition assessment data collected by the author from the City of Niagara Falls,
and some of their limitations are discussed. Chapter 5 presents an ordinal regression model
based on cumulative logits, and Chapter 6 discusses the continuation-ratio model to model
the degradation behaviour of wastewater pipelines.
6
Chapter 7 reviews the existing civil infrastructure management frameworks/systems, and
proposes a new multi-perspective management framework. A case study is also presented to
demonstrate the implementation of the proposed framework.
Chapter 8 and 9 present the integration of management framework, economic principles and
deterioration modeling for strategic financial planning of wastewater collection systems.
Conclusions and recommendations for future work are discussed in Chapter 10.
The work presented in this thesis will: (1) help municipal public works departments (PWD)
to develop integrated management strategies for intelligent and cost-effective maintenance,
rehabilitation and replacement (M,R&R) of wastewater pipelines; (2) persuade decision-
makers to provide financial support for wastewater collection systems’ M,R&R programs;
(3) help PWD in developing short-term operational and long-term capital improvement
plans; (4) protect public health and environment; and (5) increase stakeholders’ confidence.
7
References
Baur, R., & Hertz, R. (2002). Selective inspection planning with ageing forecast for sewer
types. Water Science & Technology, 46(6-7), 389-396.
Dalziel, A., & Macey, C. (2004, February). The benefits of using quality sewer condition
data in the asset management process. Trenchless Technology, 36-39.
Grigg, N. S. (2003). Water, wastewater, and stormwater infrastructure management. Florida:
Lewis Publishers.
Iseley, T. (2003). State of the pipeline industry. ASCE Conf. Proc. Pipelines 2003,
130(40690) 1.
Kathula, V. S., Jr., N. D. P., Roberts, F. L., & Nassar, R. (1999). Integrating sewer condition
with sewer management. No Dig 1999 Conference, Orlando, Florida.
Kleiner, Y. (2001). Scheduling inspection and renewal of large infrastructure assets. Journal
of Infrastructure Systems, 7(4), 136-143.
Sustainable Water and Sewage Systems Act, 2002, Bill 175, (2002).
Mirza, M. S., & Haider, M. (2003). The state of infrastructure in Canada: Implications for
infrastructure planning and policy. Ottawa, Ontario: Infrastructure Canada. Retrieved
from http://www.infrastructure.gc.ca/research-recherche/rresul/rs/documents/rs02_e.pdf
Mirza, S. (2007). Danger ahead: The coming collapse of Canada's municipal infrastructure
Report No. FCM 1060E. Ottawa, ON, Canada: Federation of Canadian Municipalities.
NTREE. (1996). State of the debate on the environment and the economy: Water and
wastewater services in Canada. Report No. ISBN 1-895643-46-5. Ottawa, Ontario:
National Round Table on the Environment and the Economy. Retrieved from
http://www.nrtee-trnee.ca/Publications/PDF/SOD_Water_E.pdf
8
PricewaterhouseCoopers. (2003). Analysis of asset management, accounting, finance and
pricing practices for municipal water and wastewater systems in Ontario. Ontario:
Ministry of Finance.
Stevenson, G., & Macey, C. C. (2005). Life-cycle state of the infrastructure report on public
works assets. Technical Report No. D312 008 00. Mississauga, Ontario: UMA
Engineering Ltd.
Wirahadikusumah, R., Abraham, D., & Iseley, T. (2001). Challenging issues in modeling
deterioration of combined sewers. Journal of Infrastructure Systems, 7(2), 77-84.
Wirahadikusumah, R., Abraham, D. M., & Castello, J. (1999). Markov decision process for
sewer management. Engineering, Construction and Architectural Management, 6(4),
358-370.
Wirahadikusumah, R., Abraham, D. M., Iseley, T., & Prasanth, R. K. (1998). Assessment
technologies for sewer system rehabilitation. Automation in Construction, 7(4), 259-
270.

9
Chapter 2
Wastewater Collection Systems and Advances in Pipeline Asset
Management Using Digital Side Scanning Evaluation Technology

10
2.1 Abstract
This paper provides an overview of wastewater collection systems and describes the history
of pipelines inspection technology used for condition assessment of wastewater and storm
water networks. It then describes recent advances in digital side scanning evaluation camera
technology and its advantages for network asset management. Challenges facing municipal
network managers and operators are also discussed. It is argued that pipe scanning
technology: (1) can reduce network inspection and renovations costs; (2) can be used to
determine pipeline deterioration rates; and (3) is preferred for the development of sustainable
network asset management plans.

11
2.2 Wastewater Infrastructure Systems
Wastewater or sewage is the water disposed of after usage. Wastewater collection system
also known as sewerage system consists of pipes that come together at manholes. It collects,
transmits, and disposes of sewage from domestic, industrial, commercial, and public users.
According to Grigg (2003), most of the wastewater or sanitary sewage is of municipal origin,
and mainly consists of domestic and commercial wastewater.
The major components of a sewerage system include collection system consisting of
pipelines, manholes, lift stations, interceptor sewers, wastewater treatment plants, and outfall
sewers as shown in Figure 2.1.
Figure 2.1: Wastewater Infrastructure System (adapted from Grigg, 2003)

12
2.2.1 Types of Wastewater Pipelines
Wastewater pipelines may be classified according to flow types (e.g., gravity or forced
mains), nature of flow, and material and geometry. Common classification of gravity sewers
is discussed below.
1. Nature of Flow
There are usually two types of wastewater systems in any typical municipality:
a. Separate Systems: Separate pipelines for storm water and sanitary wastewater.
Sanitary Sewers: Sewers that transport sanitary or industrial sewage only.
Storm Water Sewers: Sewers that dispose of storm water.
b. Combined Systems: Sewers that transport wastewater from sanitary and storm drainage
mixed together. Most of the early systems are combined systems as ‘dilution was the
solution’, instead of treating wastewater.
2. Material and Geometry
Wastewater pipelines are broadly classified as rigid or flexible. Rigid sewers, such as
concrete and vitrified clay pipes, are designed to withstand vertical loads on their own, and
usually do not need surrounding soil support. Flexible pipes, such as Polyvinyl Chloride
(PVC) or Polyethylene (PE), need side support to sustain loadings or else they will buckle
and/or deform under load. Brick, vitrified clay and concrete rigid pipes sewers are rigid, but
behave like flexible when they lose mortar and side support.
13
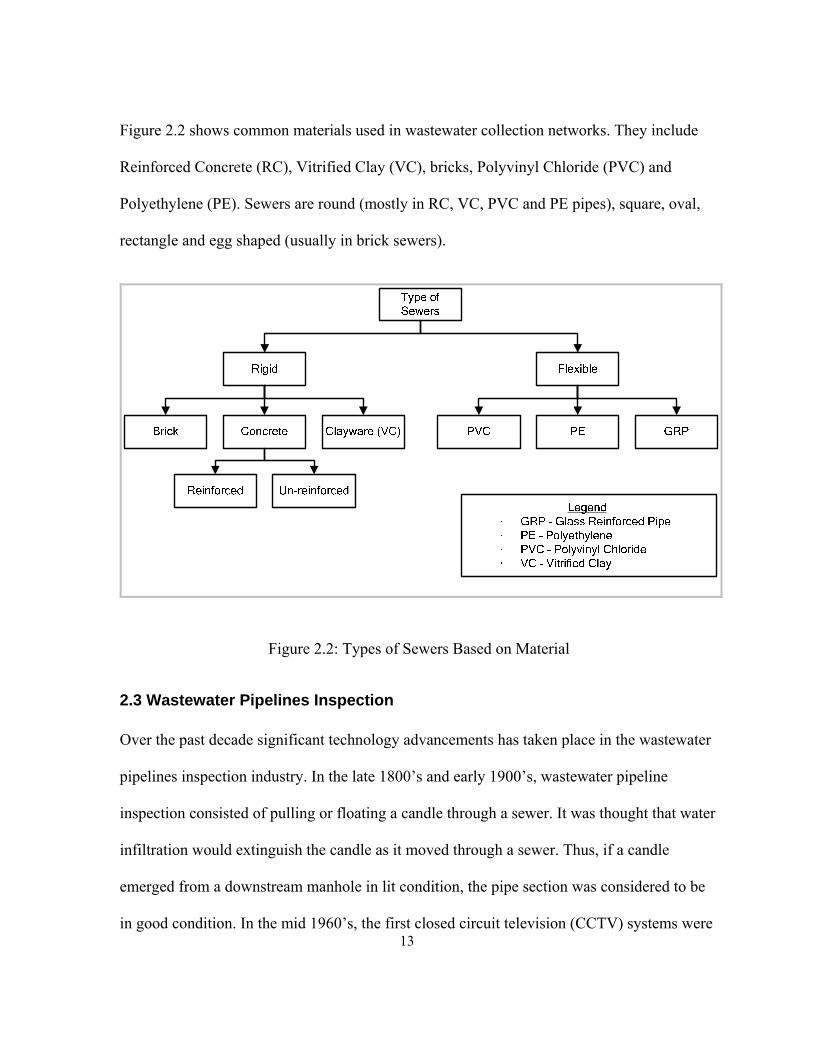
Figure 2.2 shows common materials used in wastewater collection networks. They include
Reinforced Concrete (RC), Vitrified Clay (VC), bricks, Polyvinyl Chloride (PVC) and
Polyethylene (PE). Sewers are round (mostly in RC, VC, PVC and PE pipes), square, oval,
rectangle and egg shaped (usually in brick sewers).
Figure 2.2: Types of Sewers Based on Material
2.3 Wastewater Pipelines Inspection
Over the past decade significant technology advancements has taken place in the wastewater
pipelines inspection industry. In the late 1800’s and early 1900’s, wastewater pipeline
inspection consisted of pulling or floating a candle through a sewer. It was thought that water
infiltration would extinguish the candle as it moved through a sewer. Thus, if a candle
emerged from a downstream manhole in lit condition, the pipe section was considered to be
in good condition. In the mid 1960’s, the first closed circuit television (CCTV) systems were

14
developed by a contractor, and sold commercially for the inspection of buried pipelines.
These early systems used the RCA Vidicon and Newvidcon image tube that was
commercially produced in the early 1950’s. The Vidicon image tube was a major technology
breakthrough as it allowed for the development of a 125mm (5 inch) camera that could be
pulled through a 200mm (8 inch) or larger pipeline (Bennett and Corkhill, 2006). In 1964, the
contractor started a separate CCTV equipment business. These early camera systems
produced black and white images with 325 lines of resolution and required 10 lux or more of
light to produce a picture. A lux is equivalent to one candle directed one meter towards the
pick-up device. Since the development of the first CCTV camera systems, many
technological advancements were implemented – such as, tractor and cable management
systems, lighting, lines of resolution, color video, pan and tilt capabilities, computerized
video imaging, and the development of imaging processing and inspection software – to
improve equipment operation efficiency and image quality.
In 1994, the TOA Grout and CORE Corporation, and the Tokyo Metropolitan Government’s
Sewer Service (TGS) Company developed Sewer Scanner Evaluation Technology (SSET)
camera in Japan (Abraham and Chae, 2002). SSET technology consists of a 360 degree
fisheye digital scanner with mechanical inclinometer and gyroscope. The technology differs
from CCTV in that it produces a digital side scan of pipe wall along with the traditional
CCTV forward looking video. The digital scanner scans the pipe wall millimeter after
millimeter to produce a continuous, open unfolded side scans of pipe (Iseley, 2002). The
image is a composite of a series of images which are joined via a software interface (see
Figure 2.3).
15
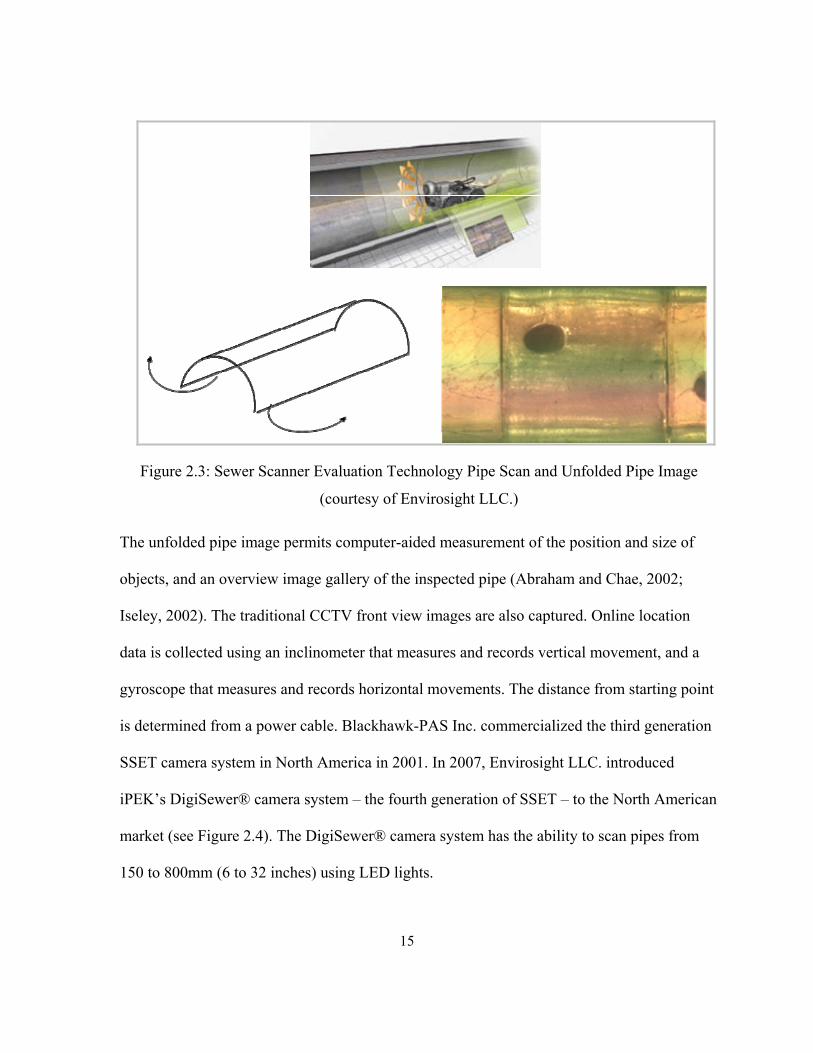
Figure 2.3: Sewer Scanner Evaluation Technology Pipe Scan and Unfolded Pipe Image
(courtesy of Envirosight LLC.)
The unfolded pipe image permits computer-aided measurement of the position and size of
objects, and an overview image gallery of the inspected pipe (Abraham and Chae, 2002;
Iseley, 2002). The traditional CCTV front view images are also captured. Online location
data is collected using an inclinometer that measures and records vertical movement, and a
gyroscope that measures and records horizontal movements. The distance from starting point
is determined from a power cable. Blackhawk-PAS Inc. commercialized the third generation
SSET camera system in North America in 2001. In 2007, Envirosight LLC. introduced
iPEK’s DigiSewer® camera system – the fourth generation of SSET – to the North American
market (see Figure 2.4). The DigiSewer® camera system has the ability to scan pipes from
150 to 800mm (6 to 32 inches) using LED lights.

16
Figure 2.4: iPek DigiSewer® Camera System Distributed by Envirosight LLC.
In 1999, IBAK in Germany started the development of a new kind of optical sewer
inspection technology called PANORAMO 3D Optical Scanner. IBAK’s main objective was
to develop a new camera system that overcomes the functional limitations inherent in
existing CCTV systems (Werner, 2002). In 2002, IBAK introduced the PANORAMO
camera system at the No-Dig Show in Copenhagen. This camera system uses two high
resolution digital photo cameras with 185° wide-angle lenses, integrated into the front and
rear section of the housing (Werner, 2002). During pipe inspections, parallel-mounted xenon
flashlights are triggered at the same position in the pipe. Hemispherical pictures are put
together to form 360° spherical images using proprietary software (see Figure 2.5).
17
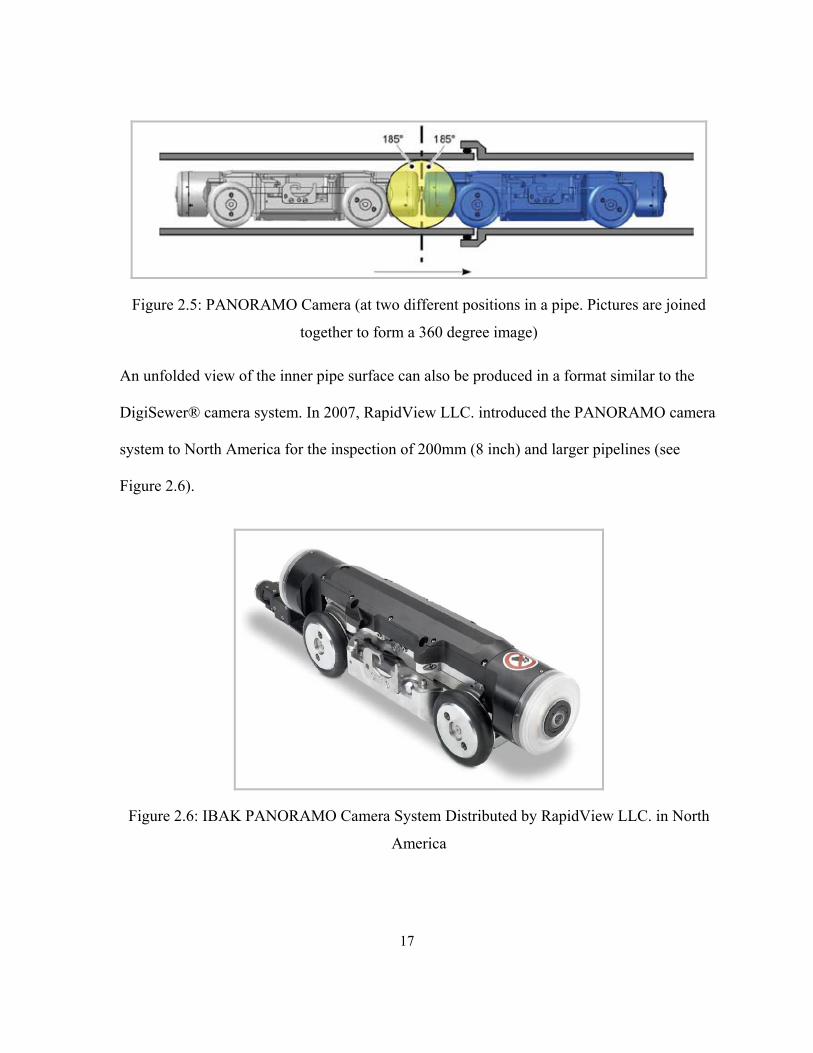
Figure 2.5: PANORAMO Camera (at two different positions in a pipe. Pictures are joined
together to form a 360 degree image)
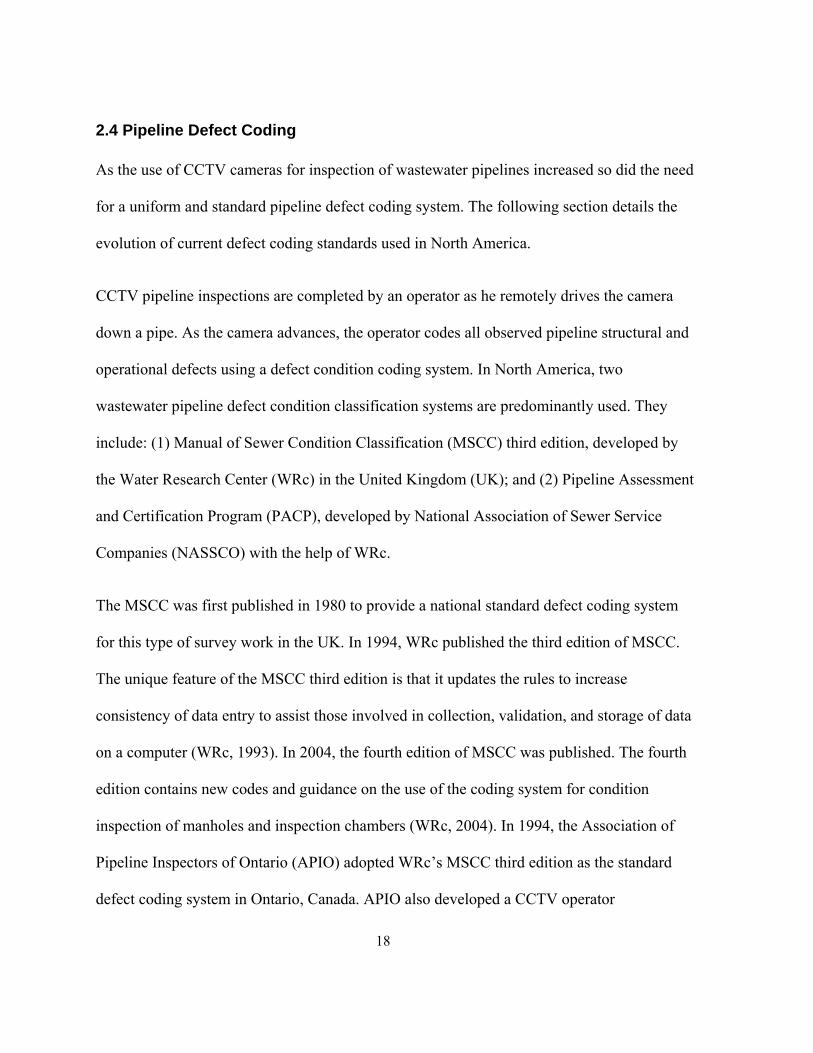
An unfolded view of the inner pipe surface can also be produced in a format similar to the
DigiSewer® camera system. In 2007, RapidView LLC. introduced the PANORAMO camera
system to North America for the inspection of 200mm (8 inch) and larger pipelines (see
Figure 2.6).
Figure 2.6: IBAK PANORAMO Camera System Distributed by RapidView LLC. in North
America
18
2.4 Pipeline Defect Coding
As the use of CCTV cameras for inspection of wastewater pipelines increased so did the need
for a uniform and standard pipeline defect coding system. The following section details the
evolution of current defect coding standards used in North America.
CCTV pipeline inspections are completed by an operator as he remotely drives the camera
down a pipe. As the camera advances, the operator codes all observed pipeline structural and
operational defects using a defect condition coding system. In North America, two
wastewater pipeline defect condition classification systems are predominantly used. They
include: (1) Manual of Sewer Condition Classification (MSCC) third edition, developed by
the Water Research Center (WRc) in the United Kingdom (UK); and (2) Pipeline Assessment
and Certification Program (PACP), developed by National Association of Sewer Service
Companies (NASSCO) with the help of WRc.
The MSCC was first published in 1980 to provide a national standard defect coding system
for this type of survey work in the UK. In 1994, WRc published the third edition of MSCC.
The unique feature of the MSCC third edition is that it updates the rules to increase
consistency of data entry to assist those involved in collection, validation, and storage of data
on a computer (WRc, 1993). In 2004, the fourth edition of MSCC was published. The fourth
edition contains new codes and guidance on the use of the coding system for condition
inspection of manholes and inspection chambers (WRc, 2004). In 1994, the Association of
Pipeline Inspectors of Ontario (APIO) adopted WRc’s MSCC third edition as the standard
defect coding system in Ontario, Canada. APIO also developed a CCTV operator
19
certification program. In 1998, APIO changed its name to the North American Association of
Pipeline Inspectors (NAAPI) as municipal pipeline inspection contracts in Canada began to
specify certified APIO CCTV operators. To ensure that CCTV operators maintained a high
level of coding accuracy and proficiency, NAAPI implemented a Reviewer’s course for
engineers and technicians who review and use CCTV inspection data, and a one day CCTV
operators’ re-certification course. The operators’ one day refresher course is designed to
ensure that NAAPI certified operators maintain a high level of consistent defect coding. For
an operator to be NAAPI certified, passing grades of 80 and 85 percent are required on the
certification test and re-certification examination, respectively.
In 2002, NASSCO published PACP, to meet the wastewater pipeline inspection needs for the
United States (NASSCO, 2006). The WRc was retained by NASSCO to develop PACP. In
2004, WRc appointed NASSCO, USA, as its exclusive licensee in North America to market,
distribute, and sell WRc’s manuals of Sewer Condition Classification, and to provide training
in its use and application.
2.5 Pipeline Condition Rating
The Sewerage Rehabilitation Manual (SRM), also published by WRc (WRc, 2001; WRc,
2004), describes a wastewater pipelines renovation decision making process that has been
adopted in the United Kingdom and Canada. The first edition of the SRM was published in
1986, and the current fourth edition was published in 2001. The SRM determines the
structural and operational performance of wastewater pipelines by assigning scores to MSCC
third edition defects based on their type and severity. These scores are transformed to

20
structural and operational Internal Condition Grades (ICG) of 1 to 5, with 1 being the best or
acceptable condition and 5 being the worst or collapsed state (WRc, 2001). Based on
supplementary information, such as soil type and surcharging frequency, the structural ICG
are modified to Structural Performance Grades (SPG). It should be noted that the SRM fourth
edition was developed for use with MSCC third edition codes. Currently, no SRM condition
grading methodology exists for the MSCC fourth edition codes, or NASSCO’s PACP codes.
The general principles of the SRM also formed the basis for the European Standard EN752-
5: Drain and Sewer Systems Outside Buildings: Part 5 Rehabilitation. Since the United
Kingdom and Canada have had outstanding success with the implementation of the SRM
ICG methodology, the SRM process can be considered to be an acceptable and good
approach for determining pipeline current condition states.
NASSCO’s PACP manual contains a pipeline condition rating scheme that varies from 1 to
5. The PACP condition rating depends on average score (total defects score for a manhole to
manhole pipe segment divided by the number of defects) rather than peak score as used by
the WRc. Unlike WRc’s SRM, the PACP manual has no detailed decision making process.
Presently, limited published data exists to validate the PACP defect scores rating system in
North America. According to Stantec (2009), usage of average scores instead of peak scores
for condition rating is a limitation of PACP methodology. PACP protocol, therefore, may not
be able to accurately prioritize rehabilitation needs of wastewater collection systems (Stantec,
2009).
21
2.6 Wastewater Pipeline Construction and Pipeline Inspection
In North America, wastewater distribution network construction commenced in urban centers
in the late 1880’s to reduce the risk of health related diseases transmitted through human
wastes. Thus, wastewater networks were constructed to reduce health related issues. As the
population of urban core expanded during the 1900’s to the 1950, the construction of
wastewater networks also expanded. Prior to the development of CCTV cameras, pipeline
condition assessments were typically performed to determine locations of significant
infiltration and to investigate problematic areas.
In the 1960’s, urban development moved from urban core to the development of suburbs.
This was also a period of high urban population growth and wastewater network construction
as people moved from city centers to suburbs. During this time period, the need to protect
environment also became a significant political and social issue. Therefore, wastewater
networks were required to protect environment and public health. In the 1980’s,
municipalities started to deal with fiscal responsibility issues created by an increased need to
network renovation due to pipe segments reaching their design life of 50 to 75 years, and
network operators’ limited and scarce financial resources. In the late 1990’s and early
2000’s, government fiscal downloading, and new legislative and regulatory requirements
(e.g., the Governmental Accounting Standards Board (GASB) Statement 34 in the United
States, and the Canadian Institute of Chartered Accountants’ Public Sector Accounting Board
(PSAB) statement PS3150 in Canada) began to force all wastewater networks operators to
show that they are fiscally accountable.

22
With the development of CCTV cameras in the 1960’s, initial pipeline inspections surveys
were expensive. Thus, initial pipeline surveys were typically only performed on projects
where the consequences for pipeline failures were high, such as the inspection of power
plants water intake and discharge lines, or to investigate municipalities’ wastewater
collection pipelines problems. In the 1970’s, the demand to complete CCTV surveys
increased, and the cost to carry out those surveys decreased. By the late 1980’s and early
1990’s, many municipalities began to embark on CCTV condition assessment programs to
determine pipeline segments’ current condition states so that they could move from a reactive
asset management strategy – fix it when it breaks – to a more proactive asset management
approach – that is, use limited financial resources on the right asset at the right time. To
become proactive, utility owners/managers needed to know the present condition state for
critical pipeline segments. The mandate for utilities’ fiscal responsibility and accountability
also increased the need for high quality pipeline inspection surveys. To demonstrate fiscal
accountability, network revenue must meet or exceed present and future predicted operation,
maintenance, construction, renovation, and renewal expenses. To determine network asset
valuation along with present and future revenue needs, the utility owners are now required to
know pipelines’ current and expected future (e.g., 5, 10, 15, and 50 years) condition states.
Current guidelines, with limited or no asset deterioration knowledge, suggest that the useful
life for wastewater pipelines range from 40 to 75 years (see for e.g., Ministry of the
Environment, 2007; NAMS, 2002). The absence of asset deterioration knowledge
necessitates the Canadian municipalities to make many unsubstantiated assumptions about
the timing and volume of capital expenditures so that they can comply with PSAB and other

23
government and regulatory requirements. These unsubstantiated assumptions will most likely
result in an under or over-estimation of assets future operational and capital needs. To
determine realistic life-cycle asset operation and maintenance costs, it is imperative that
assets’ deterioration behavior is well understood.
2.7 Wastewater Network Deterioration Modeling
Commonly used regression based statistical techniques for modeling the deterioration of
wastewater pipelines include: expected value methodology (ordinary linear or non-linear
regression), binary/dichotomous logistic regression, and ordered probit regression based on
latent variable formulation. Other statistical techniques, such as Markov chains, and Bayesian
and reliability based methodologies have also been applied to CCTV inspection datasets. The
majority of the existing inspection datasets were developed by uncertified CCTV operators
with little to no data quality control and quality assurance protocols. Using the City of
Niagara Falls SSET inspection survey database, developed at the University of Waterloo
using quality assurance and quality control protocols, it has been found that ordinary
regression based deterioration models for wastewater networks violated model assumptions
(Younis and Knight, 2008). The deterioration models based on ordered probit regression
were found to be overly complex in terms of the number of parameters to be estimated, and
therefore, made the interpretation of results quite challenging. The deterioration models,
developed using binary logistic regression, divided the data into pass or fail categories while
ignoring the rank order information in the data. Further research is required with respect to
age and material interaction, and other factors that influence the degradation behavior of

24
wastewater pipelines, e.g., environment, soil and groundwater chemistry, physical and
chemical characteristics of wastewater, and static and dynamic loading. To develop realistic
waster pipeline deterioration models, it is imperative that quality (not quantity) pipeline
inspection datasets are developed.
2.8 Need for A Wastewater Pipeline Inspection Approach
The use of CCTV inspection surveys defect coding and WRc’s pipeline Internal Condition
Grades (ICG) is an excellent methodology for determining the current condition of a pipeline
and developing network renovation work programs. However, the use of CCTV inspection
surveys and ICG for the determination and measurement of network deterioration rate has
had limited success for the following reasons.
Firstly, the authors are aware of a UK pipeline segment, inspected by WRc, improved in
condition (ICG 3 to ICG 2) after 15 years of service with no renovation or renewal. An
explanation provided for how this physically impossible improvement can take place is that
the initial CCTV operator coded the pipeline with defects that were assigned higher defect
scores due to the initial poor quality camera image. This example highlights the subjective
nature of using pipeline defect coding to determine a pipeline’s ICG, even when a well-
trained and a certified camera operator is used. It also highlights the challenge of using ICG
for pipeline deterioration modeling.
Secondly, many municipalities in North America have limited high quality CCTV inspection
data that can be used to determine network deterioration rates. The Ministry of Finance in
Ontario, Canada, completed a survey (PricewaterhouseCoopers, 2003) to investigate

25
municipal water and wastewater systems asset management practices. This survey found that
among the responding Ontario municipalities, 17% do not perform inspections for condition
assessment, and of those who do perform inspections, 33% do not record the results of the
inspections. The good news is that since the mid 1990’s most Canadian municipal CCTV
inspection contracts state that all CCTV surveys are to be completed and coded by a NAAPI
certified CCTV operators. Since APIO/NAAPI inception, CCTV operators’ course
instructors were carefully selected and trained to ensure that all course offerings are provided
using experienced CCTV operators with no conflict of interest and a high level of consistent
instructions. This training model, along with CCTV operators’ re-certification every three
years, ensures that high quality CCTV inspection surveys and defect coding are completed in
Canada. Due to the lack of operator certification in the USA prior to NASSCO’s PACP in
2001, pipeline inspection surveys in the USA are often of questionable quality, and lack
defect coding consistency. NASSCO’s launch of PACP certification in the USA has made a
significant improvement in operators’ defect coding consistency. However, NASSCO’s
PACP presently suffers with the following issues: (1) NASSCO’s PACP training is not
provided to the same standard as NAAPI’s training i.e., no conflict of interest policy, no
requirement for course instructors to meet field experience criteria prior to becoming an
instructor, lack of consistent instructor training, and no operator re-certification requirement;
and (2) no standardized methodology exists for the determination of pipelines’ internal
condition grades using PACP defect codes. This is a critical issue for pipelines deterioration
modeling and networks’ asset management.

26
WRc’s Internal Condition Grades (ICG) were developed as distinct/discrete condition grades
as shown in Figure 2.7. Thus, a pipeline remains in a condition grade until a point in time
when it meets the requirement to move into the next condition grade. For example, the
pipeline in Figure 2.7 remains in ICG 1 from installation to 21 years, and at age 21.1 years it
jumps immediately into ICG 2.
Pipe Age Post Installation (Years)
0 10 20 30 40 50 60 70 80
1
2
3
4
5
WRcInternal Condition Grade (ICG)
ICG‐1
ICG‐2
ICG‐3
ICG‐4
ICG‐5
Figure 2.7: Conceptual Pipeline Deterioration Plot Using WRc’s ICG Methodology
In the field, pipeline deterioration function may take a linear or non-linear form similar to
that shown hypothetically in Figure 2.8. The shape of deterioration curve (i.e., linear or non-
liner) will be controlled by pipelines’ deterioration process that occurs in a pipe segment. For
example, if it is determined that deterioration is due to corrosion that occurs at a constant
annual rate (such as H2S attack), the deterioration curve will be linear. If the pipeline

27
deterioration process is due to groundwater fluctuations and soil infiltration, the deterioration
curve may take a non-linear form.
Figure 2.8: Conceptual Pipeline Segment Deterioration Curves – Linear - Linear and Non-
Linear
Pipeline asset management can be described as fixing the right assets at the right time. For
this purpose network operators must know where they are on the deterioration curve. If the
costs to renovate a pipeline in ICG 5, 4, 3, and 2 are $1000, $750, $500, and $250 per meter,
respectively, it is imperative to be able to predict when a pipeline segment will enter into a
particular ICG. For example, Figure 2.9 shows that a pipeline segment will enter ICG 3 in
approximately 40 years if the deterioration function is linear and in 67 years if the
deterioration function is non-linear.

28
Pipe Age Post Installation (Years)
0 10 20 30 40 50 60 70 80
1
2
3
4
5WRcInternal Condition Grade (ICG)
Linear deterioration function
Non‐linear deterioration function
Figure 2.9: Pipe Age at ICG 3
2.9 Advantages of Moving To the New Scanning Technology for Wastewater
Pipelines Asset Management
DigiSewer® and PANORAMO wastewater pipelines inspection systems offer many
advantages over traditional CCTV camera systems. The main advantage of these new
systems – in terms of wastewater network asset management – is the ability to accurately
measure pipelines’ defects changes between successive inspections. This unique feature
allows utility owners, for the first time, to accurately measure changes in defects over time
when an initial survey is used as a baseline reference survey. These new camera systems also
eliminate the need for operators to pan and tilt, and for defect coding to be completed by the
operator during pipe scanning. These advantages allow for the implementation of defect
coding quality control and quality assurance programs that will allow for the development of
29
high quality databases to be used for network deterioration modeling. To develop high
quality defect and pipe condition rating databases, it is imperative that all inspection camera
operators and defect coders are highly trained and certified by an independent third party
organization. This organization must use experienced trainers and have protocols in place to
ensure certified individuals meet or exceed stringent knowledge requirements. Failure to
maintain this standard will compromise the quality of inspection data, and its use and value
in the development of effective asset management practices. Utility owners must also
implement quality assurance and quality control programs to check that all defect coding is
of high quality prior to uploading it into an asset management database program.
2.10 Conclusions
Wastewater utility operators’ mandate has evolved over the past few decades to include
public health, protection of the environment, fiscal responsibility, and financial
accountability. These changes along with the development of wastewater inspection
technologies have increased the need for utility owners to complete inspection surveys.
Aging wastewater networks and new government mandated planning and fiscal reporting
requirements have changed utility owners information needs from understanding networks’
present condition state to prediction of networks’ condition state into the future (e.g., 5,10,
25, 50, 75 and 100 years). To complete the later task, utility operators and/or network asset
management groups need realistic wastewater deterioration models. A review of the literature
and analysis of current methods to determine wastewater deterioration rates has found that
these models are of limited use as they were developed using CCTV defect and pipe rating
30
datasets of questionable quality. If realistic deterioration models are to be developed, utility
owners must commence with the development of new high quality inspection databases, and
ought to share data beyond organizational confines. The new side scanning camera
equipment (DigiSewer® and PANORAMO) may be the inspection technology of choice as it
has many significant advantages over traditional CCTV camera equipment for the
development and validation of pipeline deterioration models.
Acknowledgements
The authors would like to acknowledge research funding provided by the Natural Sciences
and Engineering Research Council of Canada (NSERC), the Canadian Water Network
(CWN), the Centre for Advancement of Trenchless Technologies (CATT), and the City of
Niagara Falls.

31
References
Abraham, D. M., & Chae, M. J. (2002). Automated interpretation and assessment of
multisensory underground infrastructure data. 20th International no-Dig International
and Exhibition, Copenhagen, Denmark
Bennett, D., & Corkhill, L. (2006). CCTV in the united states. Paper presented at the North
American Society of Trenchless Technologies no-Dig 2006, Nashville, TN, USA.
Grigg, N. S. (2003). Water, wastewater, and stormwater infrastructure management. Florida:
Lewis Publishers.
Iseley, T. (2002). Advanced digital subsurface for characterizing pipeline defects. 20th
International no-Dig International and Exhibition, Copenhagen, Denmark.
Ministry of the Environment. (2007). Toward financially sustainable drinking water and
wastewater systems (Financial Plans Guideline No. EBR Registry Number: 010-0490).
Ontario, Canada: Ministry of Environment, Ontario. Retrieved from
http://www.ebr.gov.on.ca/ERS-WEB-
External/displaynoticecontent.do?noticeId=MTAwNDkx&statusId=MTUxNDM3&lang
uage=en
NAMS. (2002). International infrastructure management manual (2nd ed.). Australia:
Institute of Public Works Engineering.
NASSCO. (2006). NASSCO's pipeline assessment and certification program (PACP).
Retrieved July 13, 2006, from http://www.nassco.org/pdf/editorial.pdf
PricewaterhouseCoopers. (2003). Analysis of asset management, accounting, finance and
pricing practices for municipal water and wastewater systems in Ontario. Ontario:
Ministry of Finance.
32
Stantec. (2009). Review of sewer defect condition classification methodologies No. Roster
Category 26: Subsurface Infrastructure Assessment and Trenchless Technologies). City
of Hamilton, Canada: Retrieved from
http://www.spima.ca/documents/rpt_hamcctvcomp_20090206_ad.pdf
Werner, H. (2002). PANORAMO - A new step forward in optical sewer inspection. 20th
International no-Dig International and Exhibition, Copenhagen, Denmark.
WRc. (1993). Manual of sewer condition classification (Third ed.). UK: Water Research
Centre.
WRc. (2001). Sewerage rehabilitation manual (Fourth ed.). Swindon, UK: Water Research
Centre.
WRc. (2004). Manual of sewer condition classification (Fourth ed.). Swindon, UK: Water
Research Centre.
Younis, R., & Knight, M. A. (2008). An empirical model for the prediction of structural
behaviour of wastewater collection systems. ASCE International Pipelines Conference
2008, Atlanta, GA.

33
Chapter 3
Development of Wastewater Collection Network Asset Database
and Data Integration Framework

34
3.1 Abstract
Two major issues related to understanding the performance and effective management of
wastewater collection systems include: (1) lack of good quality inventory and condition
assessment data; and (2) lack of conception to extract useful information from imminent
proliferation of heterogeneous data from multiple sources and formats at various
municipalities. To obtain high quality condition assessment data (and to develop a database
application) on wastewater collection systems, a collaborative research initiative was
undertaken in 2005 with the Public Works Department at the City of Niagara Falls, PipeFlo
Contracting Corp., and the Centre for Advancement of Trenchless Technologies (CATT)
located at the University of Waterloo. Additionally, a framework and related system to
integrate heterogeneous data from various municipalities is proposed.
This paper presents: (1) a case study that discusses why and how the City of Niagara Falls
entered into a public-private partnership, with the help of CATT, to bring state-of-the-art
Sewer Scanning and Evaluation Technology (SSET) to the City (and Canada); (2) the
development of WatBAMS (Waterloo Buried Asset Management System) – a high quality
wastewater pipelines condition assessment database; and (3) the development of a framework
and related system, BAMS ( Buried Asset Management System), to integrate heterogeneous
data using XML (eXtensible Markup Language) specifications and technologies. Project
challenges and useful lessons learned from building such a collaborative research partnership
are also discussed.

35
This undertaking will advance the buried asset management science by providing: (1) high
quality condition assessment data on wastewater pipelines for current and future research;
and (2) a conceptual framework and prototype to facilitate the integration of data from a
spectrum of sources (organizations and systems) to create new knowledge and test the
existing one.

36
3.2 Introduction
Buried infrastructure – that includes wastewater pipelines in addition to water and other
utility lines – are the most important and critical yet the most ignored amongst the entire civil
infrastructure systems. In case of pavements and bridges, significant research work has been
carried out under various initiatives. For example, in 1987, US Department of Transportation
undertook Long-Term Pavement Performance (LTPP) program – a comprehensive 20-year
research initiative worth US $50 million to monitor and study in-service pavements (U.S.
Department of Transportation, 2009b). US National Bridge Inspection Program (U.S.
Department of Transportation, 2009a), commenced in 1968, maintains inventory and
condition assessment data in a National Bridge Inventory System. Contrarily, scarcity and
poor quality of the existing data on wastewater pipelines are well-known issues (see for e.g.,
Baik et al., 2006; Davies et al., 2001; Mirza, 2007; PricewaterhouseCoopers, 2003; Watt et
al., 2006; Wirahadikusumah et al., 2001; Wirahadikusumah and Abraham, 2003), and
therefore, limited research related to in-service performance of wastewater collection systems
has been carried out. The majority of the existing wastewater collection pipelines’ condition
assessment data collected using the traditional Closed Circuit Television (CCTV) cameras
are (Iseley, 1999; Wirahadikusumah et al., 1998): (1) very subjective – that is, data depend
upon the judgment of operators responsible for inspecting and recording defects in the field;
and (2) time consuming and cumbersome to review. Furthermore, the CCTV inspections are
non-reproducible – therefore, unsuitable to estimate deterioration rates – and the process is
inefficient as the operator has to stop and record defects at each defect location during
inspection process (Chae et al., 2003; Iseley, 1999; Wirahadikusumah et al., 1998).

37
Compared to other data-intensive disciplines, such as bioinformatics, and life, medical and
social sciences – where technical advancements in data collection, storage, transfer, and
analysis have revolutionized the way data is utilized – data management and utilization in
buried infrastructure management is still in its infancy. Figure 3.1 shows the number of
published and web-accessible molecular biology databases available to researchers and
decision-makers. Baker and Cheung (2007) pointed out that the numbers presented in Figure
3.1 represent only a fraction of biological databases that actually exist. Due to the lack of
adequate data on wastewater collection systems, municipalities and researchers often resort
to make unsubstantiated assumptions regarding life-cycle performance of these systems. For
example, regardless of pipe material, many existing guidelines and best management
practices advocate using a service life varying from 40 to over 70 years for wastewater
pipelines (see for e.g., Hudson et al., 1997; NAMS, 2002; and OMBI, 2007). Contrarily, the
research shows that the degradation trends differ depending upon the pipe material (Baik et
al., 2006; Micevski et al., 2002; and Younis and Knight, 2010). Another example is the
Markov chains based deterioration models for wastewater pipelines (see for e.g., Baik et al.,
2006; Micevski et al., 2002; Wirahadikusumah et al., 2001; and Wirahadikusumah and
Abraham, 2003) where it is not possible to verify the assumptions of stationarity and
homogeneity of Markov chains due to limited data (Wirahadikusumah et al., 2001).
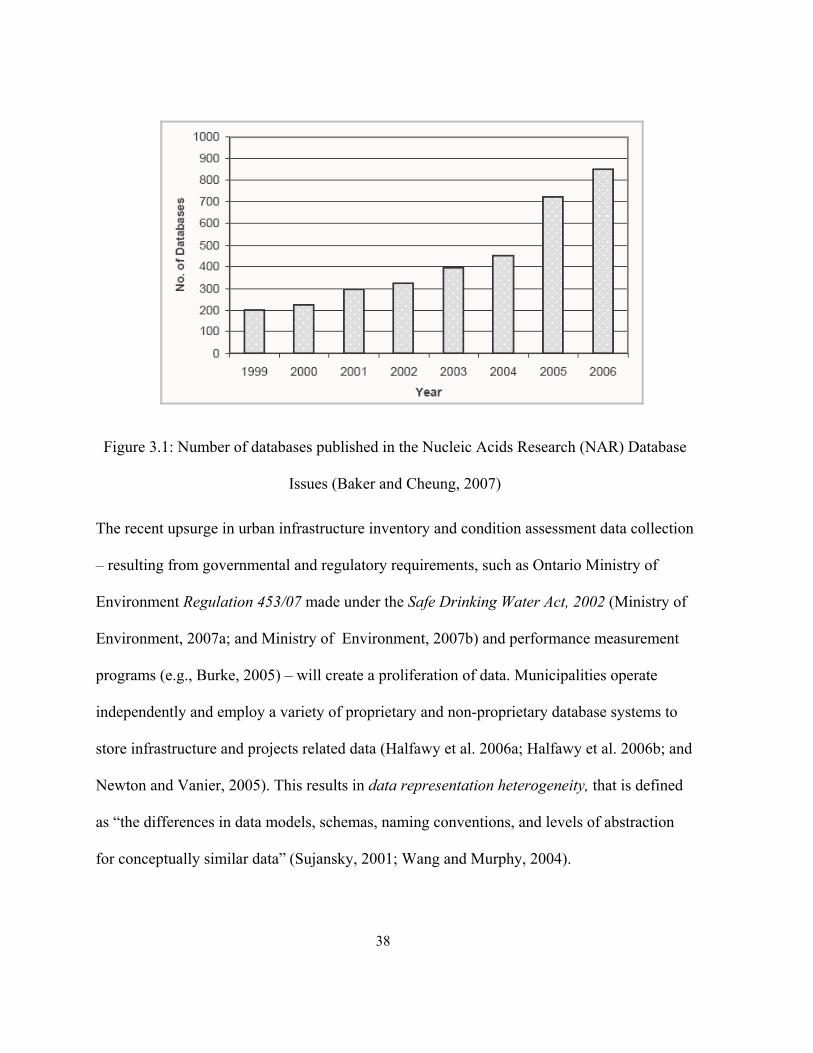
38
Figure 3.1: Number of databases published in the Nucleic Acids Research (NAR) Database
Issues (Baker and Cheung, 2007)
The recent upsurge in urban infrastructure inventory and condition assessment data collection
– resulting from governmental and regulatory requirements, such as Ontario Ministry of
Environment Regulation 453/07 made under the Safe Drinking Water Act, 2002 (Ministry of
Environment, 2007a; and Ministry of Environment, 2007b) and performance measurement
programs (e.g., Burke, 2005) – will create a proliferation of data. Municipalities operate
independently and employ a variety of proprietary and non-proprietary database systems to
store infrastructure and projects related data (Halfawy et al. 2006a; Halfawy et al. 2006b; and
Newton and Vanier, 2005). This results in data representation heterogeneity, that is defined
as “the differences in data models, schemas, naming conventions, and levels of abstraction
for conceptually similar data” (Sujansky, 2001; Wang and Murphy, 2004).
39
Wastewater pipelines’ rehabilitation and replacement decisions based on subjective CCTV
inspections and inadequate data can have major socio-political, legal, technical, and financial
implications. Chae et al. (2003) emphasized that without reliable condition assessment data,
millions of dollars of investments in wastewater infrastructure management systems would
be ‘useless’. To improve existing knowledge and decision making with regards to wastewater
infrastructure management, there is a dire need of high quality data on wastewater collection
systems operating under a variety of environments.
This paper presents a case study regarding the formation of a collaborative research initiative
to collect high quality condition assessment data on wastewater pipelines and elaborates the
development of a wastewater collection network condition assessment database.
Furthermore, it provides a conceptual framework and prototype to address the issue of
aggregating data from disparate sources (e.g., organizations, systems and formats). This is
required to understand the performance of wastewater pipelines under a variety of operating
environments and to develop generalized wastewater infrastructure management solutions.
3.3 Development of Public-Private Partnership and Research Collaboration
In 2005, the City of Niagara Falls entered into a public-private partnership with PipeFlo
Contracting Corp. to bring the first commercial Side Scanning and Evaluation Technology
(SSET) camera to Canada. The City also collaborated with the Centre for Advancement of
Trenchless Technologies (CATT), located at the University of Waterloo, to develop an asset
management framework that would help the City to make cost-effective long-term network
rehabilitation and replacement decisions. The SSET is being used to complete the first
40
interior inspection of the City of Niagara Falls 412 km of wastewater collection network –
the entire pipe network.
3.3.1 Background
The City of Niagara Falls wastewater network is approximately 412 km or 250 miles in
length with a total replacement value of approximately $250 million (2004-05 dollars). The
average age of manhole to manhole pipe section in the system is 43 years with the oldest
pipes built in the mid to late 1800s.
From the late 1990s, the City of Niagara Falls focused considerable resources in the areas of
sewer, water and road asset inspection and management programs. The proposed changes to
Ontario Provincial Legislation, specifically Bill 175, The Sustainable Water and Sewage
Systems Act, 2002 (Ministry of Environment, 2002) forced the City staff to investigate
methods for assessing the structural integrity of their sewer and water systems in terms of
their long-term ability to maintain service levels. An analysis – performed by the City staff
based on simple linear deterioration model and present (year 2004-05) capital spending levels
– established that every City owned sewer line section should last in excess of 175 years.
Dwindling sewer Closed Circuit Television (CCTV) inspection budgets from the mid 1980’s
to mid 1990’s made the task of network repair and replacement prioritization next to
impossible. Increased competition and consequently lower than market unit prices in the
sewer CCTV inspection industry also led to less than desirable results in terms of inspection
and report quality. The bulk of the inspection data collected during the 10 year period was of
41
little use for comparative analysis due to the fact that less than 6% of the system was being
inspected per year with widely varying reporting and inspection qualities.
Attempts at standardization of operator certification and defect coding in accordance with
WRc (Water Research centre, UK) 3rd edition of the Manual of Sewer Condition
Classification (MSCC) did marginally improve the results. However, the CCTV output was
still highly dependent upon camera operators and their interpretation of the contract language
and coding requirements. The issue of defect change over time was also of prime importance
because the review of duplicate CCTV inspections – performed approximately 10 years apart
– provided little information about defects’ progression.
In 2002, the Niagara Falls City Council, faced with the impending sustainability legislation,
authorized substantial increases to the Municipal Utility Budget to allow for the inspection of
a larger portion of the system. Councilors were presented with the reality that the City-owned
wastewater assets would have to be inspected and monitored on a more frequent basis and a
suitable rehabilitation plan needed to be formalized, given the capital budget restrictions, to
ensure the viability of the system over an extended service life.
3.3.2 Needs Assessment and Technology Review
In May of 2005, the City Staff began to research the issue of repeatability of both, the raw
inspection product and associated reports, as well as, the issue of the determination of defect
progression or structural deterioration over time. The Centre for Advancement of Trenchless
Technologies (CATT) was enlisted to assist the City in determining the functional needs of

42
the City’s proposed inspection program and the reporting requirements to support a long-
term rehabilitation and sustainability plan for the City’s wastewater network. To determine
the feasibility of any proposed changes to the inspection equipment used or the product
delivered, PipeFlo Contracting Corp., located at Stoney Creek, Ontario, was invited to join
the research group. PipeFlo Contracting Corp. has more than 20 years of experience in
pipelines inspection and repair industry, and it allowed the group to assess any proposed
technology in the field.
For needs assessment, technology selection and research collaboration, a review of past
inspection records and decisions was performed. Based on the analysis, following needs were
identified:
1. The inspection technology must be capable of producing imagery that is spatially
correct in order to support the analysis of defects progression over time – thus,
necessitating a technology to deliver clear, consistent and reproducible product. The
review of previous inspection reports showed that the traditional CCTV records were
inadequate for this particular analysis due to variability in equipment and contractor.
2. The proposed technology should collect data in a uniform, repeatable and defensible
manner on every pipe. Specifically, the wastewater pipelines inspections and reports
must be operator-independent.
3. Data collected must be in a non-proprietary format in order to fit with the City of
Niagara Falls existing asset management system(s).
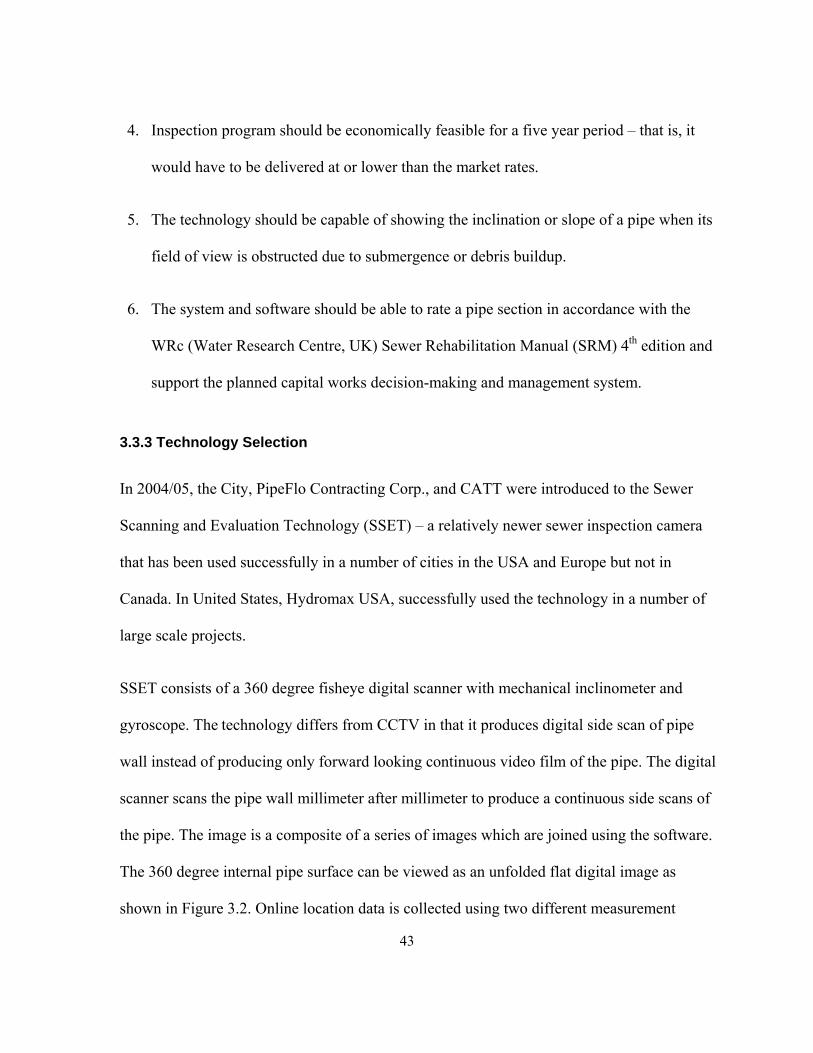
43
4. Inspection program should be economically feasible for a five year period – that is, it
would have to be delivered at or lower than the market rates.
5. The technology should be capable of showing the inclination or slope of a pipe when its
field of view is obstructed due to submergence or debris buildup.
6. The system and software should be able to rate a pipe section in accordance with the
WRc (Water Research Centre, UK) Sewer Rehabilitation Manual (SRM) 4th edition and
support the planned capital works decision-making and management system.
3.3.3 Technology Selection
In 2004/05, the City, PipeFlo Contracting Corp., and CATT were introduced to the Sewer
Scanning and Evaluation Technology (SSET) – a relatively newer sewer inspection camera
that has been used successfully in a number of cities in the USA and Europe but not in
Canada. In United States, Hydromax USA, successfully used the technology in a number of
large scale projects.
SSET consists of a 360 degree fisheye digital scanner with mechanical inclinometer and
gyroscope. The technology differs from CCTV in that it produces digital side scan of pipe
wall instead of producing only forward looking continuous video film of the pipe. The digital
scanner scans the pipe wall millimeter after millimeter to produce a continuous side scans of
the pipe. The image is a composite of a series of images which are joined using the software.
The 360 degree internal pipe surface can be viewed as an unfolded flat digital image as
shown in Figure 3.2. Online location data is collected using two different measurement
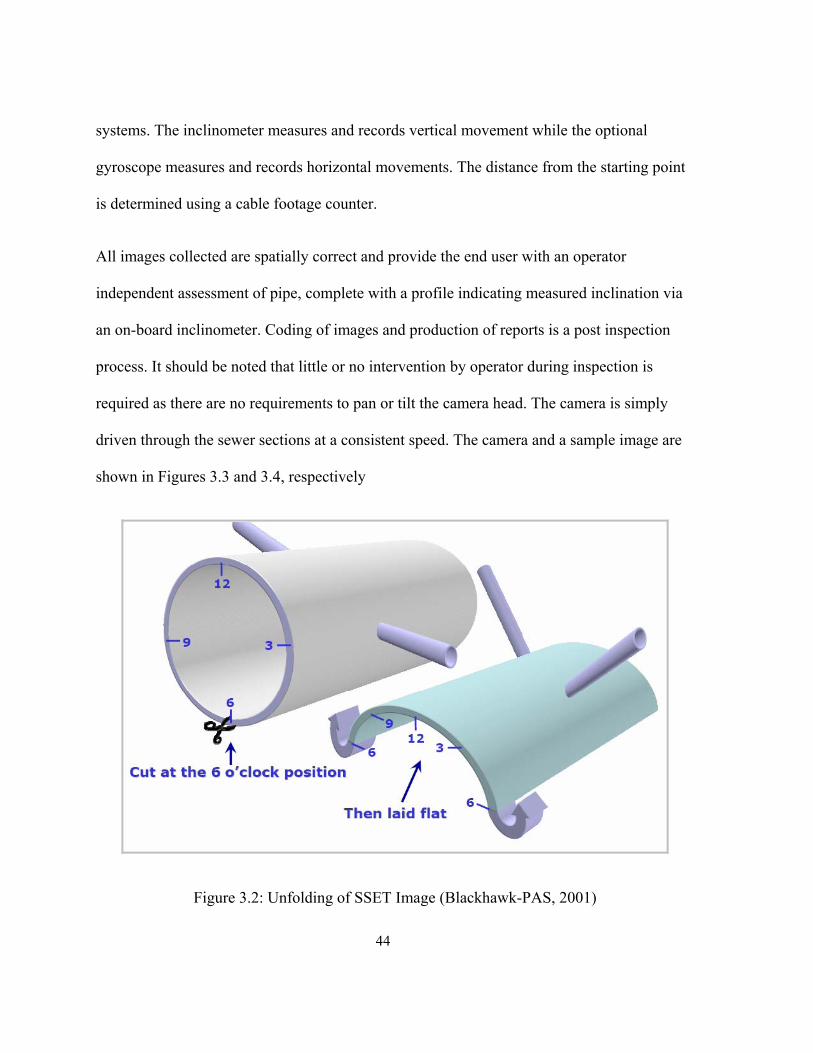
44
systems. The inclinometer measures and records vertical movement while the optional
gyroscope measures and records horizontal movements. The distance from the starting point
is determined using a cable footage counter.
All images collected are spatially correct and provide the end user with an operator
independent assessment of pipe, complete with a profile indicating measured inclination via
an on-board inclinometer. Coding of images and production of reports is a post inspection
process. It should be noted that little or no intervention by operator during inspection is
required as there are no requirements to pan or tilt the camera head. The camera is simply
driven through the sewer sections at a consistent speed. The camera and a sample image are
shown in Figures 3.3 and 3.4, respectively
Figure 3.2: Unfolding of SSET Image (Blackhawk-PAS, 2001)
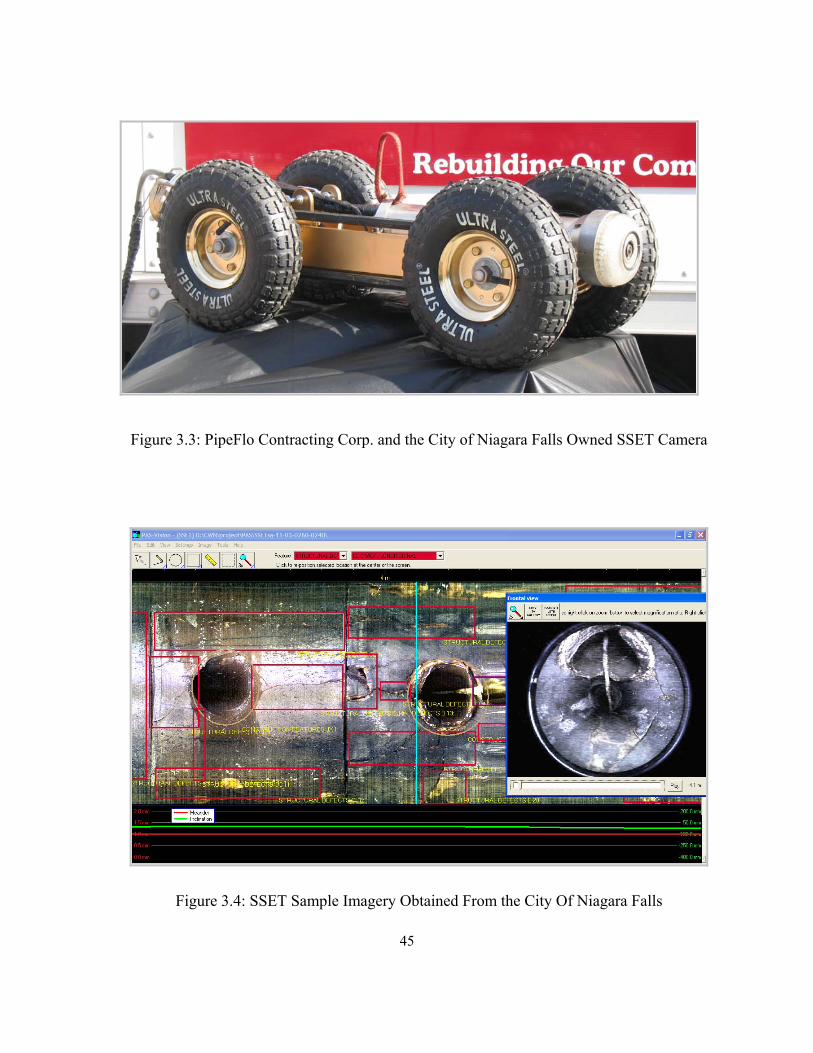
45
Figure 3.3: PipeFlo Contracting Corp. and the City of Niagara Falls Owned SSET Camera
Figure 3.4: SSET Sample Imagery Obtained From the City Of Niagara Falls

46
A market survey revealed that the SSET camera and related software were not available in
Ontario or other parts of Canada. In addition, a supporting software application for pipelines’
condition rating and development of capital works program was required.
3.3.4 Public-Private Partnership
To introduce the SSET technology to the Canadian municipal market and to address software
and technical issues, a partnership between the City of Niagara Falls and PipeFlo Contracting
Corp. was formed. It was determined that the proposed venture would require an investment
from all parties, both financially and in-kind contributions of staff time. Additionally, all
parties were to assume some of the inherent risk related to the project.
PipeFlo Contracting Corp. and the City of Niagara Falls staff sourced a suitable SSET system
in Atlanta, Georgia, and visited the vendor to determine the overall condition of the
equipment. The truck and equipment complement was for sale for approximately $125,000
USD.
It was determined that the purchase cost of the equipment was prohibitively expensive for an
all-out independent purchase by the Contractor – the unit rates for inspection would not
allow for the completion of the inspection program within the prescribed budget amount of
C$1.25 million.
In January 2005, a five year formal partnership agreement was signed between the City of
Niagara Falls and PipeFlo Contracting Corp. with the assistance of a qualified lawyer. The
agreement was structured to allow for the distribution of risk and reward between both

47
parties. Under the agreement, the partners agreed to equally share the capital cost of the
equipment and future revenues generated from sewer inspections in other jurisdictions. The
perceived benefits and terms-of-service outlined in the legal agreement binding on both
parties are described below.
The City of Niagara Falls in return for its contribution to the capital cost of equipment would
recognize the following benefits:
A fixed and lower than market rate for inspections – that is, $2.50 per meter ($0.76 per
foot) – for the full five year length of the contract indexed to the rate of inflation. The rate
includes three passes of high pressure water flushing of the line being inspected.
Priority service with respect to the cleaning and inspection of sewers in the City of
Niagara Falls over the length of the contract.
Recovery of the City’s initial investment – 50% of the capital cost of the equipment –
when the system is used in other locales. In essence, the City of Niagara Falls receives a
percentage in the form of a rebate to a maximum of $125,000 USD when the equipment is
in-service for other municipalities or commercial customers.
PipeFlo Contracting Corp. recognizes the following benefits in return for its monetary and
technical contributions:
Interest free loan of 50% of the capital cost of the equipment for five years.
48
An exclusive contract for five years with the City of Niagara Falls to clean and survey 400
km of sewer for five years. The contract value is approximately C$1.25 million.
Exposure to other municipal markets by virtue of the City of Niagara Falls being a
reference customer for the technology.
Both parties successfully negotiated with the vendor for an exclusive right to operate the
technology in the Southern Ontario marketplace for the length of the contract. It should be
noted that the legal agreement outlining the terms of the contract and financial obligations of
the parties was approximately 160 pages in length and took approximately 30 weeks to draft
and finalize.
3.3.5 Research Added-Value
In November 2004, a research proposal was submitted to the Canadian Water Network
(CWN) entitled: “Development of an Underground Wastewater Collection Network Asset
Database and Management Framework.” The Canadian Water Network received more than
one hundred Expressions of Interest in response to the Strategic Research Call 2004/2005,
out of which 48 were asked to submit full proposals. After peer review and careful
consideration of the projects against the CWN stated goals and criteria, 22 projects were
recommended for funding, and the “Development of an Underground Wastewater Collection
Network Asset Database and Management Framework” was one of the selected projects.
The ultimate project goal was to develop a suite of tools which would provide the most cost-
efficient and effective system of maintenance, repair and rehabilitation of wastewater

49
collection networks, with the aim to guarantee security of sanitary sewage collection to meet
social, health, economic and environmental requirements. It needed to be carried out within
the context of integrated catchment management and the strategic objective of ensuring
security of water resources. The specific goals for the project included:
Development of a comprehensive non-propriety wastewater collection network asset
management database using the relatively new Sewer Scanning Evaluation Technology.
The resulting database should be easily accessible and upgradeable, and would contain
key asset attributes, such as sewers’ length, material, diameter, age, and structural and
operational condition grades.
Complete inventories and detailed condition assessments of water infrastructure facilities
are crucial for estimating costs and for ensuring that rational repair and rehabilitation
strategies are employed. Using the City of Niagara Falls as a beta-site, a non-proprietary
asset database was to be developed, tested and evaluated. This would be the first known
complete non-proprietary wastewater pipelines condition assessment database in North
America.
Development of protocols and algorithms that would ensure that accurate and high quality
structural and operational condition assessment data is loaded in the asset database.
Development of a management framework for wastewater collection networks.
The framework would allow for the development of rational network maintenance,
rehabilitation and replacement policies and priorities. The framework would help in
50
devising least-cost rehabilitation alternatives to meet the desired structural, operational,
hydraulic, and environmental performance requirements.
3.3.6 Project Challenges, Lessons Learned and Good Practices
It is not uncommon to face technical and management challenges in a large-scale project
involving many stakeholders. This project was not an exception, and a number of challenges
and issues were encountered – some of them unforeseeable and beyond control. The
following paragraphs list some of these issues, and briefly discuss the lessons learnt and good
practices for such type of collaborative projects.
1. The supplier firm disbanded immediately after delivering the SSET camera and computer
system. Not only did the equipment turn out to be faulty but the supplier failed to provide
the defects coding software. Despite the legal contract, the City of Niagara Falls and
PipeFlo Contracting Corp. had no resources to chase down the supplier in the USA.
Unfortunately, prior to 2005, there was only one SSET camera supplier in North America
and, therefore, the risk of abandonment was unavoidable. The abrupt dissolution of firms
– thought to be less likely in the past – is a real risk with the present state of economy and
is difficult to predict. A thorough investigation about the supplier, equipment
manufacturer, spare parts supply, and possible hardware and software issues will help to
mitigate the risk of abandonment. Equipment should be checked on-site before delivery,
and some of the supplier personnel should be available for the first few days of the
project. Fortunately, the Centre for Advancement of Trenchless Technology (CATT)

51
helped in finding and establishing the contact between the City of Niagara Falls, and
Hydromax USA and Dataflo Inc. in the USA to secure defects coding software. It took
PipeFlo Contracting Corp. a few months to replace special camera cables and lights to fix
the hardware.
2. The defects coding software needed to be customized according to WRc Manual of
Sewer Condition Classification (3rd edition) and the City requirements. (This was carried
out by the author.)
3. In 2006, the Manager of Infrastructure Management at the City along with two key
members of the project team left their positions to join a consulting firm. The City could
not find proper replacements for one year. This adversely affected the field data
collection as well as the implementation of project quality assurance and quality control
protocols at the City. In fact, the data collection was halted for a number of months.
This reveals management challenges from organizational viewpoint in replacing
experienced staff. It is to be noted that quality assurance plan was kept enforced at the
University of Waterloo, and no data with quality issues were allowed to be imported into
the database. This created a discrepancy between the actual data collected in the field and
the data present in WatBAMS.
4. At the end of 2006, OYO Corporation in Japan – the manufacturer of SSET camera –
sold the technology and discontinued all the technical support and spare parts supply.
PipeFlo Contracting Corp. was able to manufacture and source most parts for the camera

52
except the motherboard. The manufacturing of parts was expensive and resulted in longer
downtimes.
5. It was determined that the City as well as the Contractor did not have proper
arrangements for data storage, and twice lost substantial amount of data due to computer
hardware problems.
A well documented and suitable data management plan should be established before
embarking on data collection. The plan should list the responsibilities and contain
information about data flow, physical storage, and safety and security of hard-earned
data. Two dedicated data servers for this project at the University of Waterloo helped the
City to recover the lost data, and thus saved hundreds of thousands of dollars of public
money.
6. It appeared as if the City and Contractor established some unachievable targets (e.g.,
inspecting at least 1000 meters of pipelines per day) due to poor knowledge about the
wastewater network. The Contractor determined that they were losing money due to low
inspection rates and high expenses.
Unfortunately, this is a typical situation in this industry and shows lack of due diligence
on the part of contractors. When treading an unknown territory – that is, wastewater
pipelines – with little or no knowledge about their condition, it is usually helpful to be
excessively cautious with respect to achievable targets and real costs.
53
7. In many instances, the wastewater pipelines were inaccessible due to excessive debris –
probably never cleaned in their life-time – or needed bypassing arrangements due to high
sewage flows. At some locations, cleaning and bypassing costs made the inspections
three to five times costlier than the quoted rates.
8. An important issue impacting this type of collaborative research initiative stems from
stakeholders’ – sometimes – conflicting preferences and objectives. Due to technical,
logistic, political, and monetary concerns, the City and Contractor tended to follow their
own inspection program. Supplementary information (e.g., soil maps, water table and
sewer surcharge data etc.) was either non-existent or not readily available. This made the
proper study design quite challenging.
3.4 Development of WatBAMS (Waterloo Buried Asset Management System)
Despite their enormous investments in buried infrastructure, municipalities in Canada and
across North America lack standardized and reliable methods for wastewater pipelines’
condition assessment. A standardized and consistent approach to data collection would help
municipalities and other levels of government to evaluate the needs of different
municipalities and to share information on how to manage these valuable assets. Current
standardization efforts are hampered by the lack of an accessible database of consistent
quality. Data collected using the SSET camera provides accurate information about the
location of various defects, as well as, the physical condition of each pipe in the network.
This information is coded into WatBAMS, a relational database, using WRc’s sewer
condition assessment protocols as specified in WRc (1993, 2004). WatBAMS provides tools

54
for data exchange, quality assurance and quality control, data storage, analysis, information
retrieval, and decision-making for wastewater pipelines’ management. The data collected in
this project will help to develop a standardized approach for assessing the performance and
condition of the network, and for studying how the network deteriorates over time.
3.4.1 Establishment of Data Requirements
The minimum data requirements for developing an effective maintenance management
system for wastewater networks are specified in Figure 3.5. The requirements were
established from literature review (e.g., Davies, Clarke, Whiter, and Cunningham, 2001;
Davies, Clarke, Whiter, Cunningham, and Leidi, 2001; WRc, 2001) and in consultations with
industry professionals at various conferences and workshop meetings. The proper soil maps
did not exist for the City, and therefore, the author reviewed more than three dozen
geotechnical reports to collect and incorporate soil and groundwater information into the
database. Clay, silt, and silty sand were found to be the predominant soil types, and water
table was recorded below the sewer pipes in most of the cases.
A variety of wastewater pipelines were included with respect to age, material, size, and
geometry as shown in Figure 3.6. The defined ranges for various pipelines’ parameters cover
majority of the gravity wastewater infrastructure in most of the municipalities.

55
3.4.2 Quality Assurance and Quality Control
According to Mitchell et al. (1985) and Taylor (1985), the quality of data can be judged on
the basis of: (1) accuracy of identification of parameter to be measured; and (2) accuracy of
quantification. An adequate quality data is consistent and exhibits small uncertainty with
respect to requirements. Taylor (1985) defined quality assurance as “the operations and
procedures which are undertaken to provide measurement data of stated quality with a stated
probability of being right.” The quality control pertains to employing proper methodology,
equipment calibration and proper usage (Taylor, 1985).
The Side Scanning and Evaluation Technology (SSET) used in the project provided
consistently high quality imagery suitable for identification and marking of various structural
and operational defects. This observation is in line with an earlier SSET evaluation
conducted by the Civil Engineering Research Foundation (CERF) that concluded, “SSET
images accurately depicted various defects, and the resolution and clarity of images were
sufficient to indicate defects’ type and size correctly” (CERF, 2001). When compared to
CCTV data, the CERF study found that SSET was best suited to identify structural defects,
such as cracks, fractures, open and displaced joints, and operational defects, such as roots,
debris and grease.
All the personnel handling data were trained and certified by NAAPI (North American
Association of Pipelines Inspectors). NAAPI’s training and certification program in
association with CATT was unique in North America – the only organization that provided
this training until 2001 – and stipulated the Ontario Provincial Standards (OPS 409

56
specifications) for quality sewer inspections. The standard requires an accuracy of 95% for
header, 85% for details, and the lowest acceptable tolerance is 75%.
To ensure high quality of collected data, a quality assurance plan was developed and
implemented. Amongst other things, the plan specified requirements with respect to pipelines
cleaning, bypassing, coding, and acceptance of surveys. To ascertain the correctness of
defects coding, a number of pipe samples were coded and classified by the author and
personnel from Dataflo Inc., USA, PipeFlo Contracting Corp., Canada, and the staff at the
City of Niagara Falls. After several meetings and coding exercises, a consensus was achieved
and the rules and procedures were documented to ensure consistent defects coding and to
resolve future quality related issues.
The inspections were checked for accuracy, and the surveys failing the check triggered
additional verifications on inspections performed during that period of time. Further quality
assurance and quality control, and security procedures are implemented during the import of
coded survey data into the database and described in Sections 3.4.2 through 3.4.5.
3.4.3 Pipeline Inspections and Defect Coding
The defects coding of surveyed data is carried out using PAS Vision ™ (Ve1.24.3a) software
developed in conjunction to be compatible with SSET camera files. The defects coding in
PAS Vision ™ can be customized to conform to various condition assessment protocols, for
example, PACP, or WRc etc.
The author customized the PAS Vision ™ software coding system to defect codes as
specified in the 3rd edition of WRc’s Manual of Sewer Condition Classification (WRc, 1993).

57
Figure 3.5: Minimum Data Requirements
Figure 3.6: Pipe Attributes

58
3.4.4 Database Integrity and Consistency
The data redundancies and anomalies were eliminated by following standard database
normalizing procedures called the Normal Forms. In particular, the following steps were
followed to keep the database in consistent form, and to ensure data integrity and security.
1. Unique Primary Key: Primary key formed by concatenating pipelines ID with the date
and time of survey uniquely identifies each entity, and its attributes. This allows multiple
surveys on the same lines at different times to be uploaded into the database.
2. Referential Integrity: Referential integrity prevents inconsistencies in data stored in a
relational database. Referential integrity rules ensure that database remains consistent
during updating and deleting procedures. For example, in WatBAMS, the data import
utility first checks the existence of an entity (pipeline) in the asset inventory, and imports
condition assessment data only if it finds a matching pipeline ID in the inventory. This
ensures that manhole IDs are properly marked in the field and drawings. Similarly if an
entity is deleted from one table, say pipelines’ ‘Header’ table, all the related entries in
condition assessment and other related tables are deleted. This is called cascading delete
operation. Similarly cascading update rule ensures that when a related field is updated in
a table, all the relevant fields in related tables are updated.
59
3. Error Checks and Error Handling: During an import session, WatBAMS checks the PAS
Vision ™ coded file(s) against the standard codes as provided in the 3rd edition of WRc
Manual of Wastewater Condition Classification (WRc, 1993). Import session is
terminated in case of any discrepancies in the coded file(s), and the database is not
updated. Any changes to the database due to erroneous transactions are cancelled. The
database is rolled back to previous consistent state and the application issues appropriate
error messages. The particular data file(s) is checked, and appropriate corrections are
carried out. The application successfully captured data inconsistencies such as defects
coding carried out in different measurement units (i.e., metric Vs Imperial), or operators’
mistakes, such as entering wrong manhole or pipeline IDs.
3.4.5 Database Security
User-level security is implemented to protect the data and application from accidental or
intentional modifications and changes. User-level type of security provides the most
restricted access over the database and its objects. The workgroup information file holding
group and users’ information and passwords is distributed with the WatBAMS installation
package. The information contained in this file determines not only who can open the
database, but also the permissions various users and groups have on the database objects.
To protect the WatBAMS source code and to facilitate later updates of application without
affecting the data model, the database has been split into front-end application, and back-end
database. When an update will be issued, users will be prompted to refresh the links to the
underlying database. Furthermore, independent applications can be developed to work with
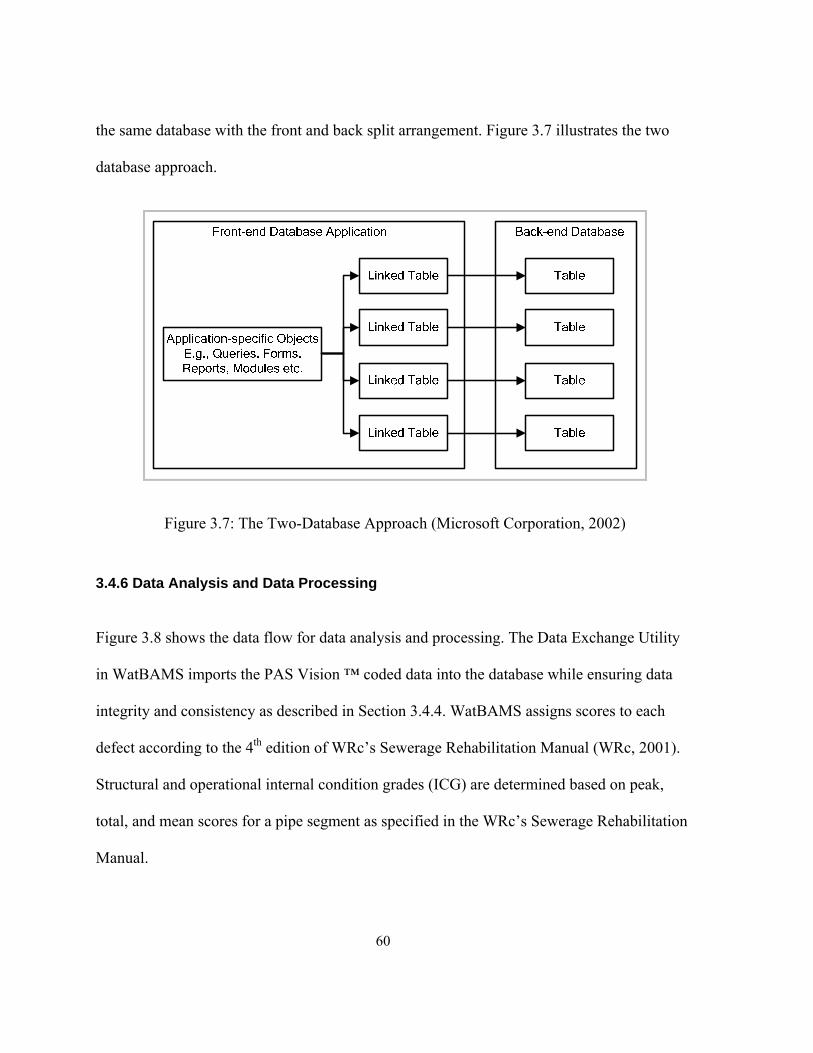
60
the same database with the front and back split arrangement. Figure 3.7 illustrates the two
database approach.
Figure 3.7: The Two-Database Approach (Microsoft Corporation, 2002)
3.4.6 Data Analysis and Data Processing
Figure 3.8 shows the data flow for data analysis and processing. The Data Exchange Utility
in WatBAMS imports the PAS Vision ™ coded data into the database while ensuring data
integrity and consistency as described in Section 3.4.4. WatBAMS assigns scores to each
defect according to the 4th edition of WRc’s Sewerage Rehabilitation Manual (WRc, 2001).
Structural and operational internal condition grades (ICG) are determined based on peak,
total, and mean scores for a pipe segment as specified in the WRc’s Sewerage Rehabilitation
Manual.

61
Data Exchange Utility provides the facility to import and process data in both single and
batch modes. Data is uploaded into relevant relational tables maintaining referential integrity.
A number of reports can be generated very easily, that include, for example:
Current condition states for wastewater pipelines.
Connection/junction report to locate lateral connections and their diameter.
Defects histograms to give an idea of defects distribution along the pipe length.
Identification of certain types of defects along the pipe length.
Search capabilities in terms of database queries and data summaries with respect to
individual pipe age, material, condition, etc.
Figure 3.9 presents a snapshot of WatBAMS showing the data import utility and various
reports in a collage. Furthermore, the database integrates with the Manifold® geographic
information system (GIS) used by the City. Figures 3.10 and 3.11 show an example of GIS
soil map and spatial distribution of surveyed pipelines in various structural internal condition
grades, respectively.

62
Figure 3.8: Data Flow Diagram for Data Analysis
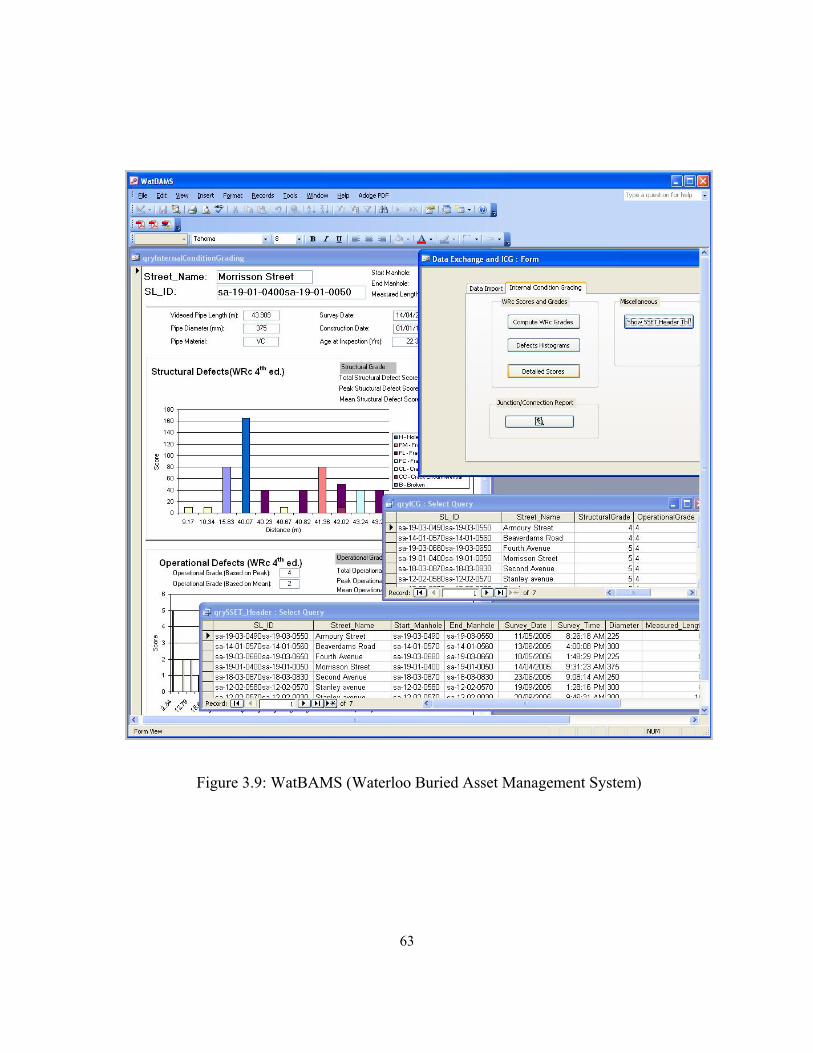
63
Figure 3.9: WatBAMS (Waterloo Buried Asset Management System)
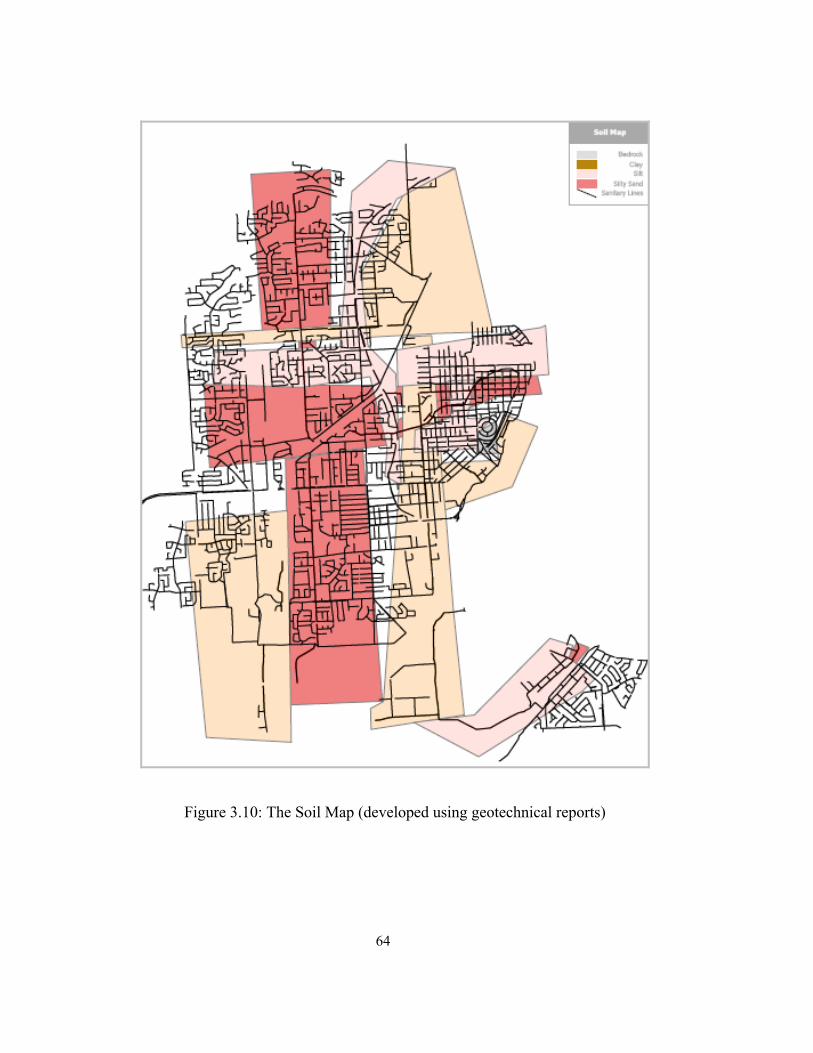
64
Figure 3.10: The Soil Map (developed using geotechnical reports)
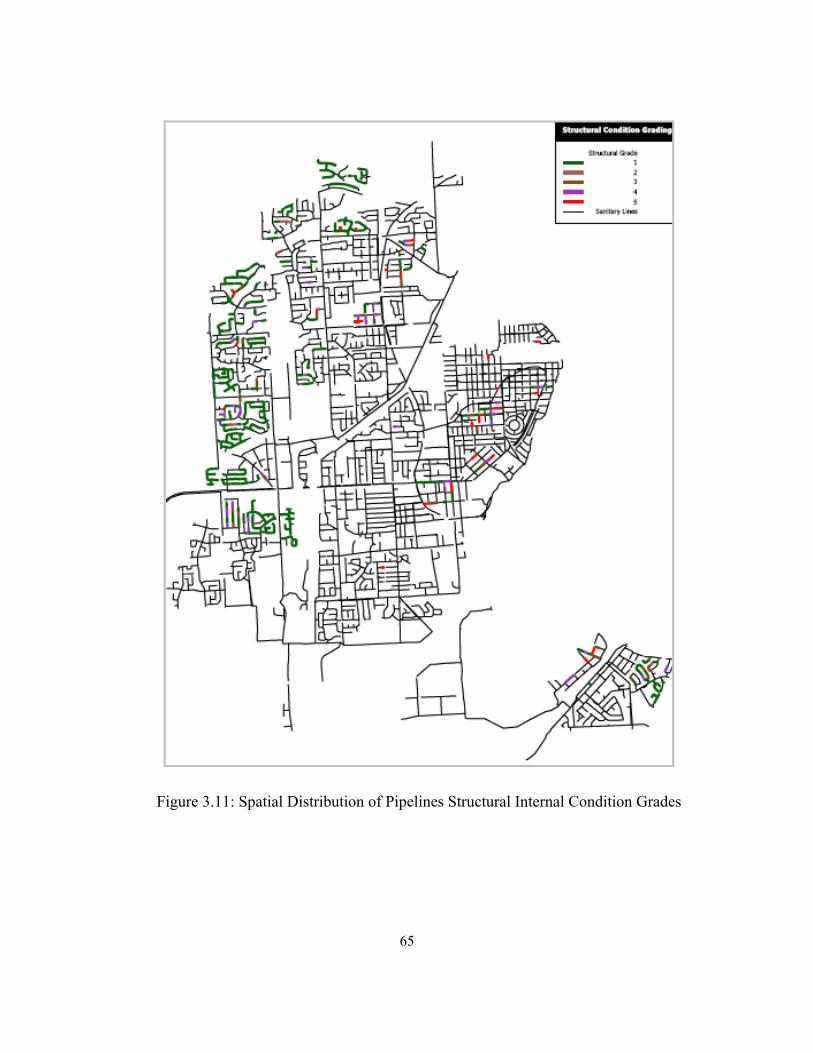
65
Figure 3.11: Spatial Distribution of Pipelines Structural Internal Condition Grades
66
3.4.7 Physical Data Storage
The surveys and condition assessment data are being stored on data servers at the City of
Niagara Falls and the University of Waterloo. At the University, two data servers each
configured under RAID 5 (redundant array of independent disks) back up each other in real
time. Some advantages of this configuration include increased speed, reliability, data
integrity, and fault tolerance.
3.5 Data Integration Framework
In 2003, the Canadian Society for Civil Engineering along with the Canadian Council of
Professional Engineers, the Canadian Public Works Association, and the National Research
Council of Canada proposed Civil Infrastructure Systems Technology Road Map (TRM)
2003-2013 (CSCE, 2003). The first of the 10 major TRM objectives includes the
development of a reliable asset inventory and condition database for Canada’s infrastructure
systems. In 2005, the Office of Wastewater Management of the US Environmental Protection
Agency (USEPA) arranged an Advanced Asset Management Collaborative Working Session
of 140 industry and academic experts from across the world to identify key pressing issues
facing water and wastewater infrastructure management field (Agency, 2007). After two days
of deliberations, the participants developed top 10 action items for advancing asset
management in water and wastewater industry. The development of a central repository of
high quality data was selected to be one of the most important items on the top ten list.
Municipalities and utilities, responsible for operating and managing wastewater
infrastructure, function independently to meet data needs according to their specific business
67
plans at local levels. According to Connery (2008), “. . . planning and organizational
framework for addressing them [infrastructure problems] is fractured among welter of well-
insulated institutions and political jurisdictions with little inclination and few incentives to
collaborate.” It is not uncommon to find different utilities using different tools (e.g., software
systems, condition assessment technologies and protocols, organizational structures etc.) to
manage their systems. This results in disparate data formats and data models, and creates data
representation heterogeneity.
The development of a central repository of high quality data – by integrating multiple
heterogeneous databases – is very important and critical to advance asset management
sciences. For example, it will: (1) provide required data to improve information and
knowledge related to performance behaviour of wastewater collection systems in different
operating environments; (2) provide much needed data for basic research in the wastewater
infrastructure management field; and (3) result in the development of better, efficient and
effective management strategies. The following sections provide a brief overview of database
integration types and methodologies, and present a framework and example implementation
to integrate infrastructure management data from wastewater collection systems at various
municipalities.
3.5.1 An Overview of Database Integration – Techniques, Types, and Issues
The problem of data integration from heterogeneous and independently maintained database
systems has been studied in Computer Science, Bioinformatics, Biomedicine, and Health
Informatics literature (see for e.g., Bright et al., 1994; Castano and De Antonellis, 1999; Dey,

68
2008; Marenco et al., 2004; Ouksel and Ahmed, 1999; Siepel et al., 2001; and Sujansky,
2001).
The techniques for database integration include the traditional Data Warehouse and
Federated Database approaches, and a relatively new Semantic Web approach (Baker and
Cheung, 2007). In case of data warehouse approach, data from various sources is translated
into a local data warehouse – thus, also known as data translation strategy. Wang and
Murphy (2004) referred to this methodology as Global-Schema or Schema Integration
approach where schemas from autonomously managed local databases are combined after
resolving semantic and syntactic differences. It involves manual or automatic data translation
and transformation from various native data formats to a common format. The federated
database approach involves query translation through a mediator on source databases, and is
known as query translation strategy (Baker and Cheung, 2007; Sujansky, 2001). The
semantic web approach goes beyond data model and uses standard ontologies to integrate
various databases (Baker and Cheung, 2007).
According to Sujansky (2001), heterogeneous database integration may include: (1) vertical
integration; (2) horizontal integration; and (3) integration for application portability. Vertical
integration involves combining of semantically similar data from heterogeneous sources,
whereas horizontal integration consists of aggregating complementary data from
heterogeneous sources. For example, aggregating pipelines attributes (e.g., material, diameter
etc.) from wastewater collection systems from different municipalities entails vertical
integration, and compiling data from different information systems (e.g., financial,
69
accounting, human resources, assets inventory, and GIS) at the same organization calls for
horizontal integration. Integration for application portability involves standardized access to
semantically similar information across organization.
According to Ouksel and Ahmed (1999), all of data integration approaches have their
advantages and disadvantages and, despite extensive efforts, seamless data and knowledge
integration is a baffling task. Sujansky (2001) emphasized that database heterogeneity will
never be eliminated, and therefore, a single standard data model will never emerge for a
specific field. Some of the grand challenge problems in database integration include
(Sujansky, 2001): (1) resolving data representation heterogeneity; (2) database performance
optimization; and (3) efficient maintenance of mappings among databases that are
independently managed and changed frequently.
In the Civil infrastructure management field, majority of the efforts have been concentrated
on: (1) developing standard data models for civil infrastructure management systems; (2)
horizontal data integration within an organization – that is, data sharing amongst various
departments; and (3) interoperability of software tools. Halfawy et al. (2007) provided an
overview of several published data modeling and exchange standards for municipal
infrastructure systems. Halfawy (2008) proposed a data integration and software
interoperability solution for coordinating infrastructure management processes within an
organization. Osman and El-Diraby (2006) presented an ontological model to support design
coordination of utilities within urban transportation corridors.

70
The public works departments and agencies responsible for managing wastewater
infrastructure at the municipalities operate independent from each other. This is also true in
the United States (Wirahadikusumah et al.,1999) and many other parts of the world. To
manage wastewater collection systems, each organization defines its own data needs
according to specific policies and business plans at local levels. Therefore, standardization of
data models for wastewater infrastructure management is unlikely. Even if there is a
consensus on minimum data requirements, and a standard data model for wastewater
infrastructure systems emerges in the future, representational heterogeneities with regards to
data naming conventions and abstraction levels will stay. Therefore, data integration must
match the industry’s current business practices and future trends – that is, it is perceived that
organizations will continue to employ independently developed and maintained
infrastructure management information systems and may collaborate beyond their
institutional and geopolitical jurisdictions in the future. Data exchange technologies, and
proposed framework and prototype system, discussed in the following sections, can help in
achieving this objective.
3.5.2 Data Exchange Technologies – Definitions and Specifications
XML (eXtensible Markup Language) is a technical specification officially specified by the
World Wide Web Consortium (W3C) for data exchange and representation (W3C, 2009).
XML technology is an open standard designed to be platform and application independent –
that is, XML does not depend on the type of software and hardware platforms. XML has
gained widespread popularity as data storage, transport, exchange, and presentation medium.

71
Some technical definitions and additional XML specifications are provided in the following
paragraphs.
XML Schema Definitions (XSD)
XSD is a type of XML grammar used to describe structure of XML documents according to
the specifications produced by World Wide Web Consortium (W3C). The basic XSD
structures are <element> and <attribute> tags. XSD provides rules for developing valid XML
documents, such as what elements may be allowed in XML documents, elements’ attributes,
types, and usage. XSD was developed to overcome some of the shortcomings of XML 1.0
Document Type Definitions (DTDs), that include (Cerami, 2005): (1) DTDs treat elements
and attributes as strings whereas XML schema has built-in data types e.g., integers, floats and
dates; (2) XML Schemas use XML syntax, however, DTDs have their own particular syntax;
and (3) XML Schemas support more object-oriented practices, and provide additional
validation rules and full support for XML Namespaces.
XML Parser (XML Processor)
An XML parser is a software engine such as a dynamic link library (DLL) used to read,
update, create, and manipulate an XML document. A parser retrieves XML documents from
a local system, determines the validity of XML documents with the given XML Schema, and
delivers the document via a standard application programming interface. Hundreds of
commercial, free and open source XML parsers exist (e.g., Microsoft Internet Explorer’s
built-in MSXML parser, Apache Software Foundation’s Xerces XML parser etc.).
72
XSLT (eXtensible Stylesheet Language Transformations)
XSLT is a high-level declarative programming language specified by World Wide Web
Consortium (W3C) for defining XML transformations. According to Brundage et al. (2000),
XSLT – originally a part of XSL (eXtensible Stylesheet Language) – is very useful to
interchange data between different computer systems. The development of an XML
document involves: (1) transformation/conversion of one XML document into another; and
(2) presenting that information. XSLT was developed to deal with the transformation and
conversion tasks of preparing XML documents.
Figure 3.12 illustrate the data transformation process. An XML parser reads a document into
a source tree. An XSLT processor performs data translations/transformations according to
rules expressed in XSLT stylesheet tree, and gives out result tree. A Serializer then turns the
result tree into final document.
XML Parser, XSLT Processor and Serializer tools are often bundled into a single product
(Brundage et al., 2000). A number of readily available XSLT processors exist, such as
MSXSL – Microsoft’s XSLT processor based on MSXML 4.0, Xalan – Apache’s open
source XSLT transformation tool, and Instant Saxon – Michael Kay’s Windows-executable
XSLT processor.
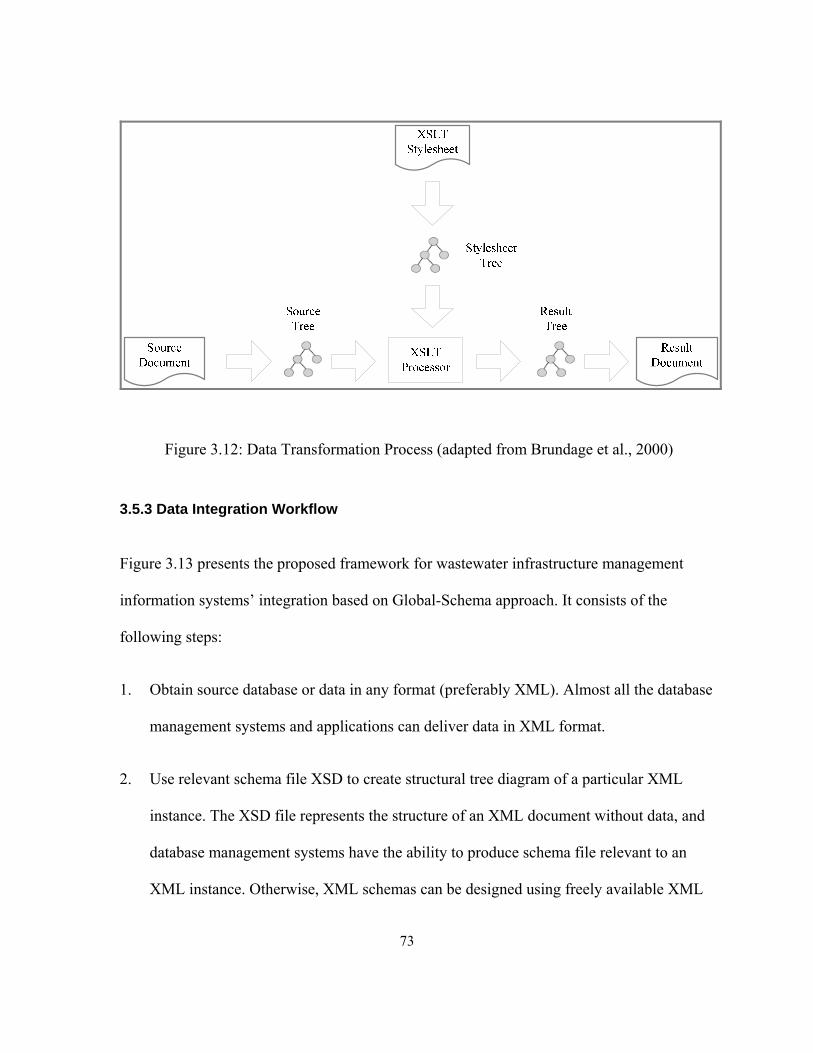
73
Figure 3.12: Data Transformation Process (adapted from Brundage et al., 2000)
3.5.3 Data Integration Workflow
Figure 3.13 presents the proposed framework for wastewater infrastructure management
information systems’ integration based on Global-Schema approach. It consists of the
following steps:
1. Obtain source database or data in any format (preferably XML). Almost all the database
management systems and applications can deliver data in XML format.
2. Use relevant schema file XSD to create structural tree diagram of a particular XML
instance. The XSD file represents the structure of an XML document without data, and
database management systems have the ability to produce schema file relevant to an
XML instance. Otherwise, XML schemas can be designed using freely available XML
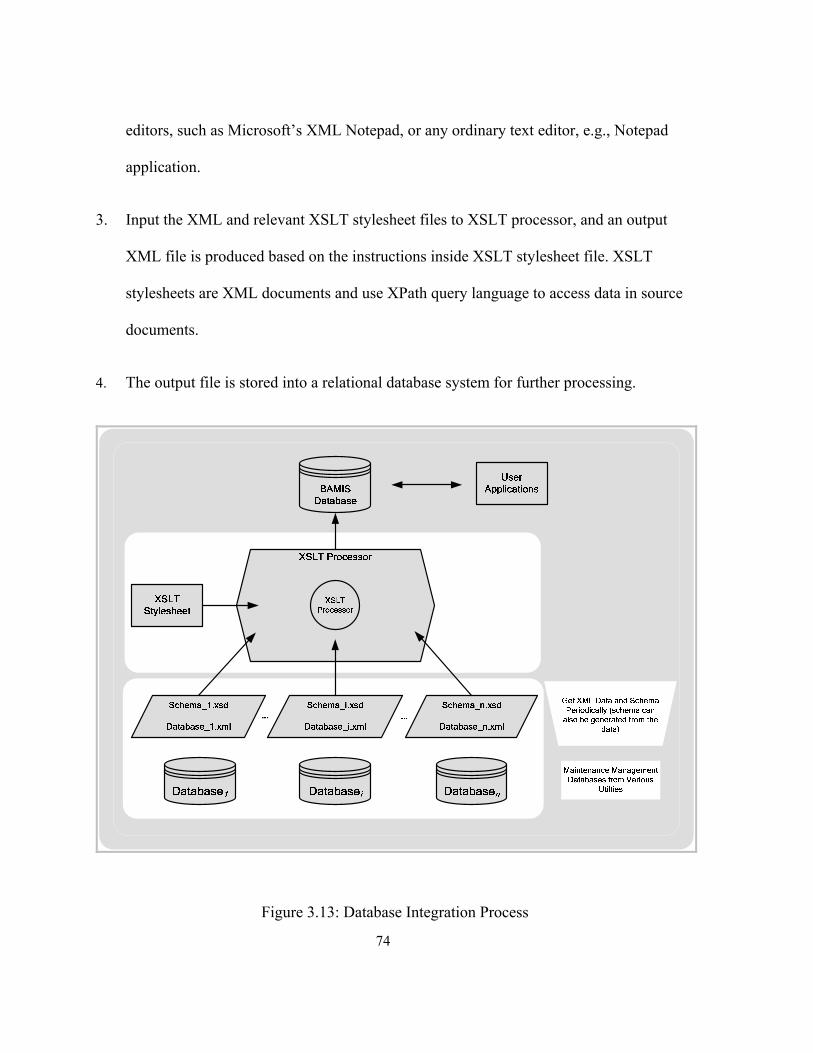
74
editors, such as Microsoft’s XML Notepad, or any ordinary text editor, e.g., Notepad
application.
3. Input the XML and relevant XSLT stylesheet files to XSLT processor, and an output
XML file is produced based on the instructions inside XSLT stylesheet file. XSLT
stylesheets are XML documents and use XPath query language to access data in source
documents.
4. The output file is stored into a relational database system for further processing.
Figure 3.13: Database Integration Process
75
3.5.4 Rationale for the Proposed Data Integration Approach
The hybrid architecture – relational database along with XML technologies – and global-
schema (i.e., schema integration approach) for wastewater infrastructure data integration is
preferred for the following reasons:
1. Data source access is one of the most critical issues and the first step in data integration.
As discussed earlier, utilities in Canada (and elsewhere) are reluctant to share data
beyond their organizational and geographical confines. They are hesitant to provide
access to their infrastructure management systems due to security risks as well as
software and hardware restrictions. Therefore, mediator systems based on query
translation on source databases are not feasible. Programmable ad-hoc query interfaces
provide another data access alternative to get data in XML format over the internet. This
approach will require additional resources on part of utilities, and without any incentives
(e.g., additional resources) they are reluctant to take part in such initiatives. Under these
circumstances the only viable remaining options to data access are based on: (1)
downloadable files; or (2) manual data transport on portable hard drives.
2. Majority of the urban infrastructure data is stored in relational databases, and XML is an
international standard for data representation and exchange that is independent of
software and hardware platforms. Infrastructure asset management data, such as asset
inventory and condition surveys, are not as complicated as the data encountered in other
disciplines (e.g., life sciences or bioinformatics). By nature, the data structure is neither
complex nor subject to frequent changes.
76
3. Automated data translation techniques often depend on the availability of metadata or
entities relations. This information may not be available in many cases, and therefore,
manual intervention is required to define relations or to create mappings between data.
The latest data integration approaches involving semantic web and ontologies also
require ontology mapping to deal with semantic heterogeneity.
4. The global schema better handles semantic conflicts by developing a global
knowledgebase and provides an integrated summary of information from all the local
schemas (Wang and Murphy, 2004).
Based on the above mentioned points, schema integration (or data translation) approach is
deemed useful for integrating data from heterogeneous wastewater collection systems.
3.5.5 Data Integration for Wastewater Infrastructure – Case Study
The proposed framework for data integration is used to develop BAMS (Buried Asset
Management System) – a relatively simple and small-scale prototype wastewater collection
systems data warehouse. To demonstrate the integration of data from heterogeneous systems,
wastewater collection databases from the Cities of Niagara Falls and Winnipeg are used.
BAMS (Target Database) Architecture
BAMS is a relational database – relational models represent data in tables and columns – that
implements XML (eXtensible Markup Language) technologies for accessing and sharing
data. Figures 3.14 and 3.15 present entity-relationship diagram and visual representation of
basic schema (i.e., design pattern) used in the BAMS prototype. For illustration, only four
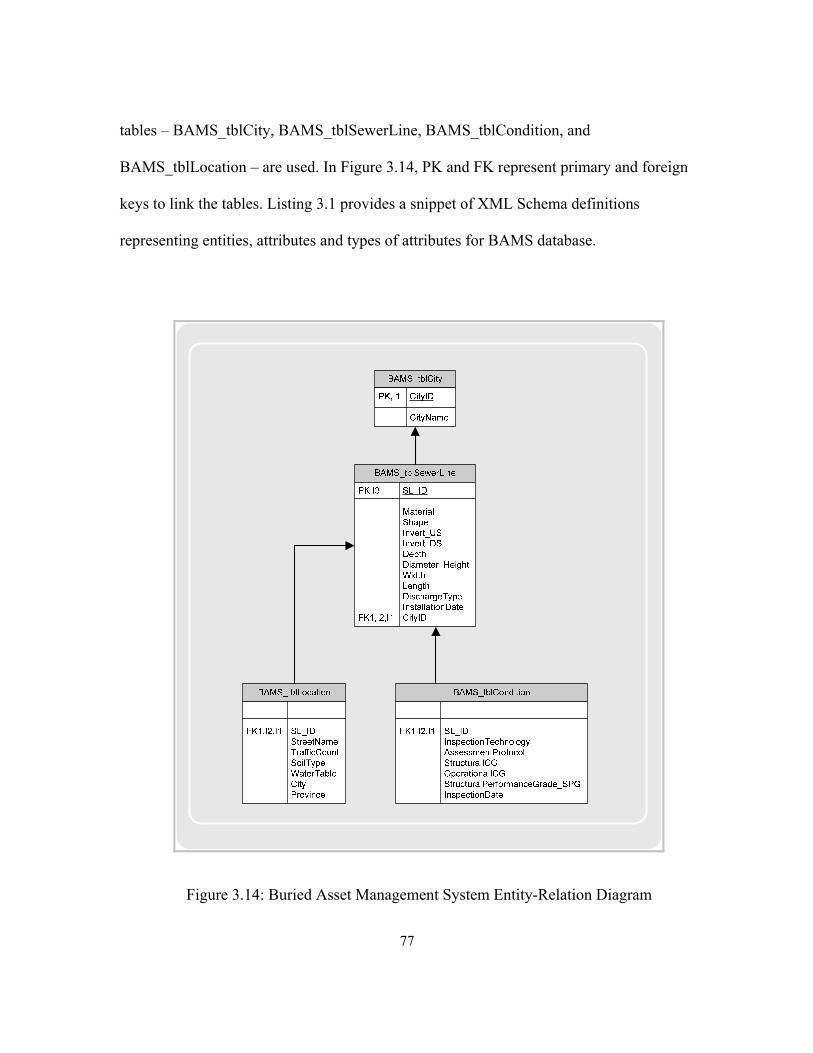
77
tables – BAMS_tblCity, BAMS_tblSewerLine, BAMS_tblCondition, and
BAMS_tblLocation – are used. In Figure 3.14, PK and FK represent primary and foreign
keys to link the tables. Listing 3.1 provides a snippet of XML Schema definitions
representing entities, attributes and types of attributes for BAMS database.
Figure 3.14: Buried Asset Management System Entity-Relation Diagram

78
Figure 3.15: Buried Asset Management System Schema Definitions
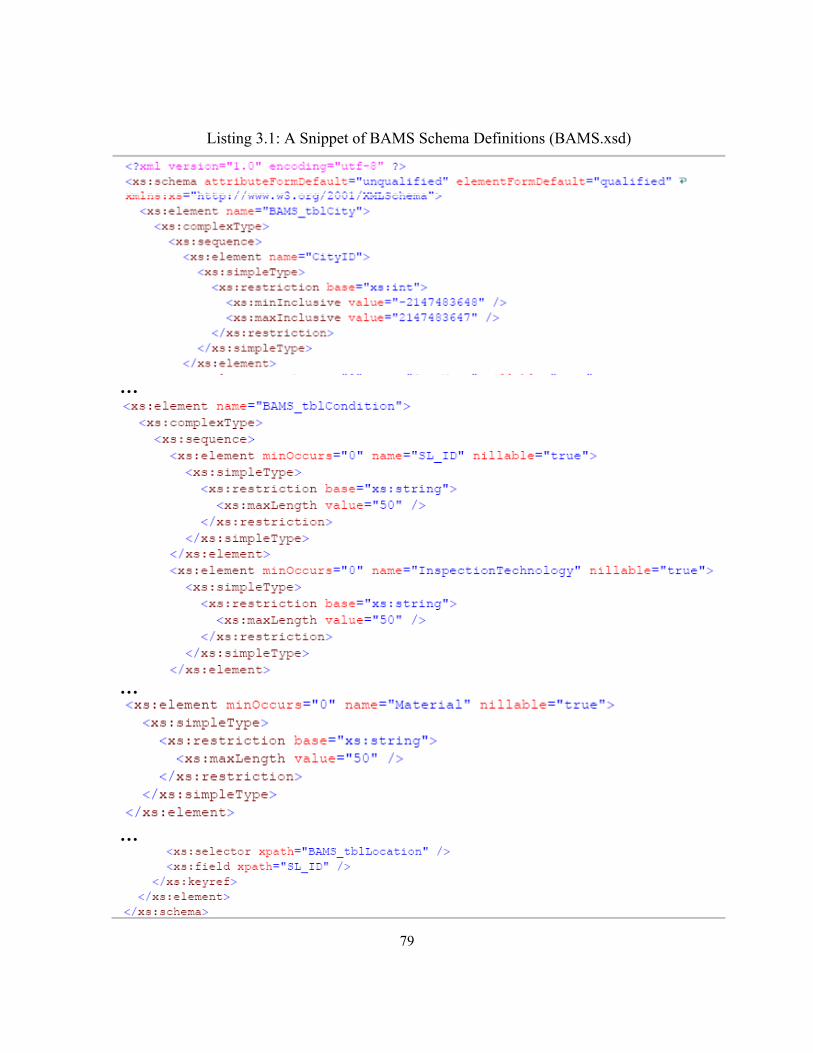
79
Listing 3.1: A Snippet of BAMS Schema Definitions (BAMS.xsd)
…
…
…

80
Source Databases
The City of Niagara Falls employs Municipal Infrastructure Data Standards (MIDS) (for
details, see MIDS Tri-Committee, 2009) to manage physical infrastructure inventory.
WatBAMS – the condition assessment database application developed by the author and
described earlier – is integrated with MIDS to produce MIDS-WatBAMS source database for
the City of Niagara Falls. The City of Winnipeg developed an in-house database application
entitled Sewer Management System (SMS). Figures 3.16 and 3.17 show parts of E-R
diagrams for SMS and MIDS-WatBAMS databases, respectively. It may be noted that the
relations between different tables (entities) are defined in case of SMS whereas they are not
specified – intentionally removed to increase complexity – in case of MIDS-WatBAMS
database.
Data Integration
To transform data from SMS and MIDS-WatBAMS relational databases into BAMS
database, the procedure specified in Section 3.5.3 and illustrated in Figure 3.13 is used. The
schemas and XML documents from source databases and relevant XSLT files are turned into
tree representation using an XML parser. Listing 3.2 and Figure 3.18 show a snippet of
XSLT stylesheet and corresponding tree representation for SMS database transformation. For
example, to resolve representational heterogeneity in material attribute between source and
target databases, the grey highlighted instructions in Listing 3.2 search for material codes
(e.g., AC, BR, VC, and CO) in the source document and translate/map them to the names
used in the target document (i.e., Asbestos Cement, Brick, Vitrified Clay, and Concrete). The
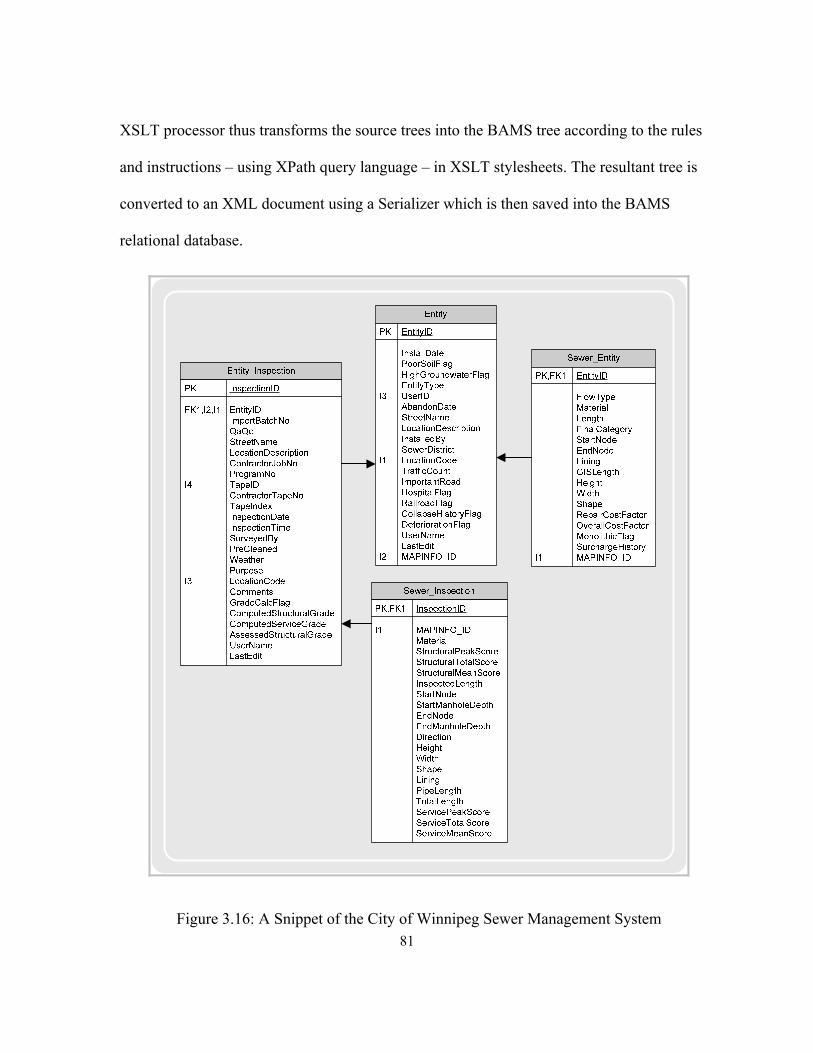
81
XSLT processor thus transforms the source trees into the BAMS tree according to the rules
and instructions – using XPath query language – in XSLT stylesheets. The resultant tree is
converted to an XML document using a Serializer which is then saved into the BAMS
relational database.
Figure 3.16: A Snippet of the City of Winnipeg Sewer Management System

82
SEWLINE1
I1 ENTITY_IDI5 SL_ID
SL_STRUC_TYPEI2 SL_CAT_CODEI3 SL_CL_CODEI4 SL_FLOW_CODE
SHAPEHEIGHTMMWIDTHMMLENGTHMSLOPEAVG_DEPMATERIALBEDDINGENCAS_MATDESLEVLSL_DROPDESFLOWSL_ROUGH_COSOIL_TYPEDROP_INVERTSL_MAX_DEPSL_PMATCSL_SLOPE_SMSL_SURF_TYPESL_INVRT_DNSL_INVRT_UPTIMESTAMP
I6 STREET_ID
Condition1
I5 SL_IDI4 Entity_ID
Survey_DateSurvey_TimeDistanceEnd XStart_ClockEnd_ClockImage_Name
I1 CodeI2 Code_Desc
DescriptionCommentstempCommentsStructuralDefectScores1StructuralDefectScores2StructuralDefectScoreOperationalDefectScore
I3,I6 comp_keyDefect_LengthDiaOperationalDefectScores1
LOCATION1
I4 ENTITY_IDI3 LOC_ID
DRAIN_AREALOC_DESC
I5 RD_SECT_IDSIDE
I6 STREET_IDBLOCK_NOINCREMNTFROM_XFROM_YFROM_ZTO_XTO_YTO_Z
I1 CROSS_STREET_IDI2 CROSS_STREET_TO_ID
CLEAN_AREALOC_AREATIMESTAMPAPT_NOSTREET_NO
TEMPORAL1
I1 ENTITY_IDABAND_DATECONST_DATEPROP_DATEREMOV_DATEASSM_DATETIMESTAMP
PIPE_MATERIALS1
MATERIALMATERIAL_DESC
Sewline_Soil_WT1
ENTITY_IDSL_IDSTREET_IDSoil_TypeWater_Table_Depth
ENTITY1
I2 ENTITY_IDENT_TYPE
I1 ENT_CODENET_TYPEENT_STATUS
I3 VENDOR_IDSSET_SURVEY
Figure 3.17: Part of the City of Niagara Falls MIDS and WatBAMS Databases
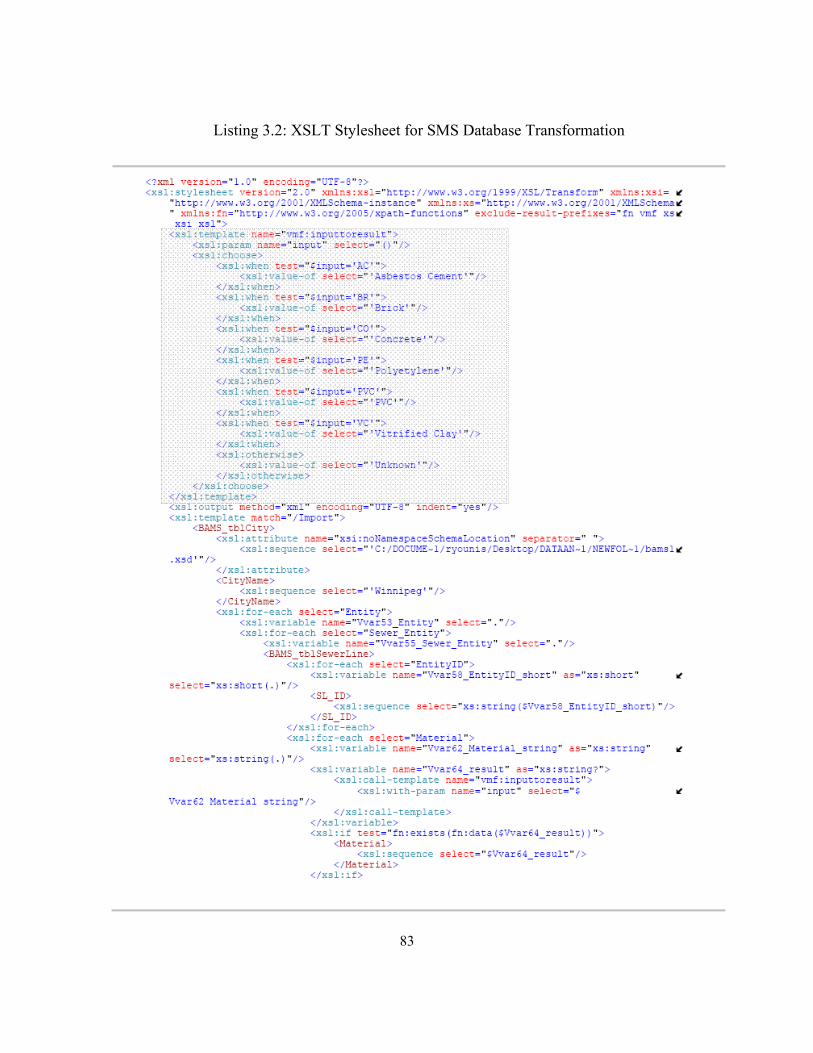
83
Listing 3.2: XSLT Stylesheet for SMS Database Transformation

84
Listing 2.2 Continued

85
…
…
… Figure 3.18: A Snippet of XSLT Stylesheet Tree for SMS Database Transformation

86
3.6 Discussion and Conclusions
Historically, independent and non-standardized visual inspection approaches have been
employed to inspect wastewater pipelines and assess their condition. Traditionally,
municipalities employ a number of contractors – utilizing a wide variety of Closed Circuit
Television (CCTV) cameras and condition assessment protocols – to investigate parts of their
wastewater collection network. In the absence of proper standard requirements, the historic
CCTV inspections – being highly subjective – resulted into inconsistent and poor quality data
on video tapes. These tapes – some of them now digitized at additional costs – are very
difficult and cumbersome to review. Majority of the infrastructure managers at the
municipalities as well as researchers are frustrated with the poor quality of existing data and
lack of real information on wastewater pipelines.
This paper presented a case study about the development of a collaborative research initiative
to resolve the issue of scarcity of good quality condition assessment data on wastewater
collection networks. A quality assurance and quality control (QA/QC) procedure was
developed and built into the project plan to collect quality data on wastewater pipelines.
Utmost care was taken to implement QA/QC procedure in the field and office. Using NAAPI
(North American Association of Pipelines Inspectors) certified and trained personnel, state-
of-the-art Side Scanning and Evaluation Technology, and wastewater collection network at
the City of Niagara Falls, a high quality condition assessment database – WatBAMS
(Waterloo Buried Asset Management System) – was developed. WatBAMS allows for the
automatic generation of WRc pipe structural and operational performance grades and defects
profiles directly from the native data files generated from the SSET camera system.

87
Additionally, procedures for quality assurance were implemented during in the data import
utility, and data mining tools were developed in close co-operation with City of Niagara Falls
and PipeFlo Contracting Corp. To integrate data from heterogeneous wastewater collection
systems, a framework and prototype, BAMS (Buried Asset Management System), based on
XML technologies was proposed.
WatBAMS provided useful data for the research presented in this thesis and will support
future research in wastewater infrastructure management. The BAMS will provide the
foundation to enhance our understanding about wastewater collection systems performance
under a variety of operating conditions.
Formation of the research collaboration, public-private partnership agreement, and handling
of subsequent technical and managerial issues was a long and complicated task. Issues with
respect to training, data storage, equipment maintenance, staff turnover, and general
familiarization with the inspection process and scheduling resulted in unproductive periods.
The City Staff’s concerns regarding acceptance of the reports were encountered. However,
those were related to the acceptance of new product and cognitive issues with respect to the
interpretation of reports. All the stakeholders agreed that the SSET camera offered far more
detailed and objective view in terms of the inspection than standard CCTV cameras.
The research partnership with the University of Waterloo and the Centre for the
Advancement of Trenchless Technology has been productive in developing a framework and
related tools that helped the City to evaluate and manage their wastewater pipelines and to
make infrastructure renewal decisions. It has also been helpful in the independent third party
88
evaluation of technologies and pipe condition coding. The public-private partnership was a
win for the City to get state-of-the-art wastewater inspections at or below current industry
standard rates. It was also a win for PipeFlo Contracting Corp. as they have a guaranteed five
year contract with the City of Niagara Falls. Without this long-term contract purchase of the
SSET equipment would have been cost prohibitive. The development of high quality
wastewater collection network asset database provides the foundation for present and future
asset management research projects that were not possible due to non-existent or incomplete
datasets.
Unfortunately, wastewater infrastructure management is far from reaping the benefits of
recent technical advancements. Majority of the research work related to wastewater
infrastructure management is carried out on ad-hoc basis with limited governmental funds or
through multi-stakeholders’ research initiatives. These initiatives and projects are not
sustainable in the long-term and die down as they run out of funds within few years time.
Similar to Long-Term Pavement Performance and National Bridge Inventory and Highway
Bridge Programs, a long-term research initiative – with a sustainable funding mechanism – in
buried infrastructure management is required.
Acknowledgment
The research presented in this paper is sponsored by the Canadian Water Network (CWN) and
Natural Sciences and Engineering Research Council of Canada (NSERC). The research partners
included the Centre for Advancement of Trenchless Technologies at the University of Waterloo, the
City of Niagara Falls, and Pipeflo Contracting Corp. Their assistance is gratefully appreciated and
acknowledged.

89
References
Baik, H., Jeong, H. S., & Abraham, D. M. (2006). Estimating transition probabilities in
Markov chain-based deterioration models for management of wastewater systems.
Journal of Water Resources Planning and Management, 132(1), 15-24.
Blackhawk-PAS, I. (2001). Sewer Scanner and Evaluation Technology. USA: Blackhawk-
PAS Inc.
Baker, C. J. O., & Cheung, K. (2007). Semantic web: Revolutionizing knowledge discovery in
life sciences. USA: Springer
Bright, M. W., Hurson, A. R., & Pakzad, S. (1994). Automated resolution of semantic
heterogeneity in multidatabases. ACM Transactions on Database Systems, 19(2), 212-
253.
Brundage, M., Dengler, P., Gabriel, J., Hoskinson, A., Kay, M., Maxwell, T., et al. (2000).
Professional XML databases. Canada: Wrox Press Ltd.
Burke, J. (2005). Ontario's municipal performance measurement program: Fostering
innovation and accountability in local government. Government Finance Review, 21(3),
22-27.
Castano, S., & De Antonellis, V. (1999). A discovery-based approach to database ontology
design. Distributed and Parallel Databases, 7(1), 67-98.
Cerami, E. (2005). XML for Bioinformatics. New York: Springer.
Connery, N. R. (2008). Development of next-generation U.S. infrastructure systems: A
framework for national policy. Public Works Management \& Policy, 12(3), 479-482.
CERF. (2001). Evaluation of SSET: The sewer scanner & evaluation technology, Technical
Evaluation Report No. 40551. USA: American Society of Civil Engineers.
90
Chae, M. J., Iseley, T., & Abraham, D. M. (2003). Computerized sewer pipe condition
assessment. Proceedings of the ASCE International Conference on Pipeline Engineering
and Construction: New Pipeline Technologies, Security and Safety, Jun 13-16 2003,
477-493.
Davies, J. P., Clarke, B. A., Whiter, J. T., Cunningham, J., & Leidi, A. (2001). The structural
condition of rigid sewer pipes: A statistical investigation. Urban Water, 3, 277-286.
Dey, D. (2008). Entity matching in heterogeneous databases: A logistic regression approach.
Decision Support Systems, 44(3), 740-747.
Halfawy, M., Vanier, D. J., & Froese, T. M. (2007). Standard data models for interoperability
of municipal infrastructure asset management system. Canadian Journal of Civil
Engineering, 33(12), 1459-1469.
Halfawy, M. M. R., Newton, L. A., & Vanier, D. J. (2006a). Review of commercial
municipal infrastructure asset management systems. Electronic Journal of Information
Technology in Construction, 11, 211-224.
Halfawy, M. M. R., Newton, L. A., & Vanier, D. J. (2006b). Review of commercial
municipal infrastructure asset management systems. Electronic Journal of Information
Technology in Construction, 11, 211-224.
Halfawy, M. (2008). Integration of municipal infrastructure asset management processes:
Challenges and solutions. Journal of Computing in Civil Engineering, 22(3), 216-229.
Hudson, W. R., Haas, R., & Uddin, W. (1997). Infrastructure management: Integrating
design, construction, maintenance, rehabilitation, and renovation. New York: McGraw-
Hill.
Iseley, T. (1999). Pipeline condition assessment: Achieving uniform defect rating. Infra 99
International Conference, Montreal, Quebec, Canada.

91
Marenco, L., Wang, T., Shepherd, G., Miller, P. L., & Nadkarni, P. (2004). QIS: A
framework for biomedical database federation. Journal of the American Medical
Informatics Association, 11(6), 523-534.
Micevski, T., Kuczera, G., & Coombes, P. (2002). Markov model for storm water pipe
deterioration. Journal of Infrastructure Systems, 8(2), 49-56.
MIDS Tri-Committee. (2009). Municipal infrastructure data standards (MIDS). Retrieved
March 10, 2009, from http://www.tricom.org/mids/index.asp
Microsoft Corporation. (2002). Microsoft office 2000/Visual basic programmer's guide: The
two-database approach. Retrieved September 28, 2006, from
http://msdn.microsoft.com/library/default.asp?url=/library/en-
us/odeopg/html/deovrthetwodatabaseapproach.asp
Ministry of Environment. (2007a). Ontario Regulation 453/07: Financial Plans, Retrieved
from http://www.e-
laws.gov.on.ca/html/source/regs/english/2007/elaws_src_regs_r07453_e.htm
Ministry of the Environment. (2007b). Towards financially sustainable drinking water and
wastewater systems, EBR Registry Number: 010-0490. Ontario, Canada: Ministry of
Environment, Ontario. Retrieved from http://www.ebr.gov.on.ca/ERS-WEB-
External/displaynoticecontent.do?noticeId=MTAwNDkx&statusId=MTUxNDM3&lang
uage=en
Mirza, S. (2007). Danger ahead: The coming collapse of Canada's municipal infrastructure.
Report No. FCM 1060E. Ottawa, ON, Canada: Federation of Canadian Municipalities.
Mitchell, W. J., Rhodes, C., & McElroy, F. F. (1985). Determination of measurement data
quality and establishment of achievable goals for environmental measurements. Quality
Assurance for Environmental Measurements, 41-52.
92
NAMS. (2002). International infrastructure management manual (2nd ed.). Australia:
Institute of Public Works Engineering.
Newton, L. A., & Vanier, D. J. (2005). Geographic information systems (GIS) and
interoperability of software for municipal infrastructure applications No. B-5123.4.
Ottawa, Canada: National Research Council.
OMBI. (2007). Implementation of accounting for tangible capital assets - reference manual.
Ontario, Canada: Sub-Committee of the Treasures Group OMBI. Retrieved from
http://www.ombi.ca/docs/db2file.asp?fileid=187
Osman, H., & El-Diraby, T. (2006). Ontological modeling of infrastructure products and
related concepts. (1984) 159-167.
Ouksel, A. M., & Ahmed, I. (1999). Ontologies are not the panacea in data integration: A
flexible coordinator to mediate context construction. Distributed and Parallel
Databases, 7(1), 7-35.
PricewaterhouseCoopers. (2003). Analysis of asset management, accounting, finance and
pricing practices for municipal water and wastewater systems in Ontario. Ontario:
Ministry of Finance.
Taylor, and Stanley. (1985). Quality assurance for environmental measurements: A
symposium. In Conference on Quality Assurance for Environmental Measurements,
Philadelphia, Pa.: ASTM.
Siepel, A. C., Tolopko, A. N., Farmer, A. D., Steadman, P. A., Schilkey, F. D., Perry, B. D.
(2001). An integration platform for heterogeneous bioinformatics software components.
IBM Systems Journal, 40(2), 570-591.
Sujansky, W. (2001). Heterogeneous database integration in biomedicine. Journal of
Biomedical Informatics, 34(4), 285-298.
93
Taylor, J. K. (1985). What is quality assurance? Quality Assurance for Environmental
Measurements, , 5-11.
U.S. Department of Transportation. (2009a). Bridge programs. Retrieved January 05, 2009,
from http://www.fhwa.dot.gov/bridge/hbrrp.htm
U.S. Department of Transportation. (2009b). LTPP: Long-term pavement performance
program. Retrieved January 05, 2009, from http://www.fhwa.dot.gov/Pavement/ltpp/
Wang, Te-Wei & Murphy, K. E. (2004). Semantic heterogeneity in multidatabase systems: A
review and a proposed meta-data structure. Journal of Database Management, 15(4),
71-87.
W3C. (2009). XML technology. Retrieved December 10, 2009, from
http://www.w3.org/standards/xml/
Watt, D., Knight, M. A., Noble, B., Younis, R., & Hummel, B. (2006). Public private
partnership brings state of the art waste water technology to the City of Niagara Falls.
Nashville, TN.
Wirahadikusumah, R., Abraham, D., & Iseley, T. (2001). Challenging issues in modeling
deterioration of combined sewers. Journal of Infrastructure Systems, 7(2), 77-84.
Wirahadikusumah, R., Abraham, D. M., & Castello, J. (1999). Markov decision process for
sewer management. Engineering, Construction and Architectural Management, 6(4),
358-370.
Wirahadikusumah, R., & Abraham, D. M. (2003). Application of dynamic programming and
simulation for sewer management. Engineering, Construction and Architectural
Management, 10(3), 193-208.
WRc. (1993). Manual of sewer condition classification (Third ed.). UK: Water Research
Centre.
94
WRc. (2001). Sewerage rehabilitation manual (Fourth ed.). Swindon, UK: Water Research
Centre.
Younis, R., & Knight, A. M. (2009). A probability model for investigating the trend of
structural deterioration of wastewater pipelines. Tunneling and Underground Space
Technology (submitted).

95
Chapter 4
Review of State-of-the-Art Statistical Deterioration Models for
Wastewater Pipelines

96
4.1 Abstract
This paper provides a brief review of the most common statistical techniques for
deterioration modeling of wastewater pipelines found in the published literature. An
overview of wastewater pipelines condition assessment process and the characteristics of
wastewater pipelines condition assessment data is also presented. A case study illustrates the
potential pitfalls due to ignoring data type and modeling assumptions.
The wastewater collection network at the City of Niagara Falls is inspected using Side
Scanner and Evaluation Technology (SSET) camera to develop a high quality wastewater
pipelines condition assessment database. The SSET camera has demonstrated advantages
over the traditional Closed Circuit Television (CCTV) cameras and is more accurate in
depicting various defects in wastewater pipelines. To ensure high quality of the collected
data, only certified and trained camera operators and personnel were allowed to collect and
process data. Additional procedures are implemented in the database to import only the
validated data. The common state-of-the art statistical methodologies for deterioration of
wastewater pipelines, such as expected value and binary logistic regression, are applied to
develop deterioration models and check model assumptions and other characteristics.
Additionally, the wastewater pipelines deterioration models based on expert judgment,
ordered probit regression and Markov chains are discussed.
It is found that the existing deterioration models for wastewater pipelines have one or more
of the following limitations: (1) they violate model assumptions or assumptions cannot be
verified due to limited data; (2) they do not take into account the ordinal nature of response
97
data; (3) they are based on data obtained from third party sources with little or no quality
assurance and quality control procedures in place; and (4) they are complex in terms of
number of parameters to be estimated and interpreted.
The violation or failure to check model assumptions, and model complexity and limited
interpretations can lead to poor data analysis and invalid results. The root cause of some of
these limitations is the scarcity of good quality data on wastewater pipelines. A long-term
wastewater pipelines performance research initiative is imperative to develop better
understanding of their degradation behaviour. This will also help in intelligent decision
making with respect to cost-effective maintenance, rehabilitation and replacement of
wastewater collection systems.

98
4.2 Introduction
A critical element of urban infrastructure asset management process includes the
development of reliable and useful deterioration models. The deterioration models are
required to: (1) understand infrastructure degradation behaviour; (2) determine future
infrastructure needs; (3) develop renovation and replacement plans; and (4) estimate assets’
value, renovation and replacement costs, and user rates. The literature review revealed that
the most commonly used techniques for wastewater pipelines deterioration modeling include:
(1) expert judgment; (2) ordinary regression; (3) logistic regression; (4) ordinal probit
regression; and (5) Markov chains. Ordinary regression based methodologies, such as
expected value and non-linear optimization, and ordinal probit regression were employed to
estimate transition probabilities in Markov chains models.
The following sections provide an overview of the traditional wastewater pipelines condition
assessment process and discuss the salient features of wastewater pipelines condition
assessment data. Furthermore, a review of the existing deterioration models for wastewater
pipelines is presented and some of their limitations illustrated using a case study.
4.3 Wastewater Pipelines Condition Assessment
Wastewater pipelines condition assessment process generally involves: (1) visual inspection
of pipes; (2) defects identification and classification; and (3) assigning a structural and
operational condition grade depending upon type and severity of defects. It is noted that a
number of wastewater pipelines’ inspection technologies and condition assessment protocols
have been developed in the last four decades, and are being used in the field.

99
4.3.1 Wastewater Pipelines Inspection Technologies
The inspection technologies are mostly classified as (Wirahadikusumah et al., 1998):
1. Visual Inspection Technologies
i. Zoom Cameras
ii. Closed-Circuit Television (CCTV) – Most commonly used around the globe.
iii. Digital Scanners
i. Side Scanner and Evaluation Technology (SSET)
ii. Flash Cameras
2. Laser Profilers
3. Remote-Sensing Diagnostic Techniques – Include Infrared Thermography System,
Ground Penetration Radar (GPR) System, Sonic Distance Measurement Method.
4. Multi-Sensory Systems – Include KARO and PIRAT.
Wirahadikusumah et al. (1998) discussed advantages and limitations of above mentioned
inspections technologies. Remote-sensing and multi-sensory techniques are still not very
common, and efforts continue to modify, enhance, and improve them for usage in wastewater
collection systems. Remotely controlled Closed Circuit Television (CCTV) and more
recently Side Scanning Evaluation Technology (SSET) cameras also known as Sewer
Scanner and Evaluation Technology are most commonly used for visual inspections of
100
interior of wastewater pipelines. Pipeline inspections are completed by an operator remotely
moving the camera down the pipeline and coding all observed defects using a defect
condition coding system.
The SSET inspection cameras have demonstrated advantages over CCTV cameras. The Civil
Engineering Research Foundation (CERF) carried out field evaluation of SSET and
compared SSET with CCTV. CERF (2001) concluded that: (1) SSET provided “significant
enhancements” as compared to CCTV; and (2) SSET accurately depicted the type and size of
various defects, such as cracks, fractures, breaks, debris, and open and displaced joints. Some
of the SSET limitations included poor performance in dark colored pipes and inability to
provide information about infiltration and inside of laterals (CERF, 2001).
4.3.2 Wastewater Pipelines Defects Identification and Classification
There are hundreds of different defect code sets and condition assessment protocols used by
various utilities, consulting engineers, vendors, and contractors (Rahman et al., 2004;
NASSCO, 2006). However, WRc’s (Water Research centre, UK) condition assessment
protocol as detailed in the Manual of Sewer Condition Classification (WRc, 1993) and
Sewerage Rehabilitation Manual (WRc, 2001) has been adopted worldwide as the industry
standard for assessment and renewal of wastewater infrastructure.
In North America, two predominantly used defects classification systems include: (1) the
WRc’s 3rd edition of the MSCC (Manual of Sewer Condition Classification); and (2) PACP
(Pipeline Assessment and Certification Program) developed by NASSCO (National
Association of Sewer Service Companies) with the help of WRc.
101
The Manual of Sewer Condition Classification, first published in 1980, became the national
standard in UK and many other parts of the world. WRc published the 3rd and 4th edition of
MSCC in 1994 and 2004, respectively. In 1994, the North American Association of Pipeline
Inspectors (NAAPI) adopted WRc’s MSCC 3rd edition and developed a certification program
for CCTV operators and reviewers – the first of this kind in North America until 2002. PACP
was published by NASSCO in 2002 to meet the needs of the wastewater pipelines inspection
industry in the USA.
4.3.3 Wastewater Pipelines Condition Grading
The WRc’s Sewerage Rehabilitation Manual (SRM) describes a wastewater pipelines
condition grading and renovation decision making process which has been adopted in the
United Kingdom and Canada. The first edition of the SRM was published in 1986 and the
current fourth edition was published in 2001. The SRM describes the structural and
operational performance of wastewater pipelines by assigning scores to MSCC defects based
on their type and severity. The structural defect scores are transformed – based on pipeline’s
peak defect score (refer to Table 4.1) – to Structural Internal Condition Grade (ICG) of 1 to
5, with 1 being the best or acceptable and 5 being the worst or near collapsed state.
Table 4.2 shows the structural ICG and their implications suggested by WRc (WRc, 2001).
The continued use of the SRM methodology, in United Kingdom and Canada since 1994,
validates the methodology as an acceptable and good approach for determining pipeline
current condition states. The general principles of the SRM also form the basis for the
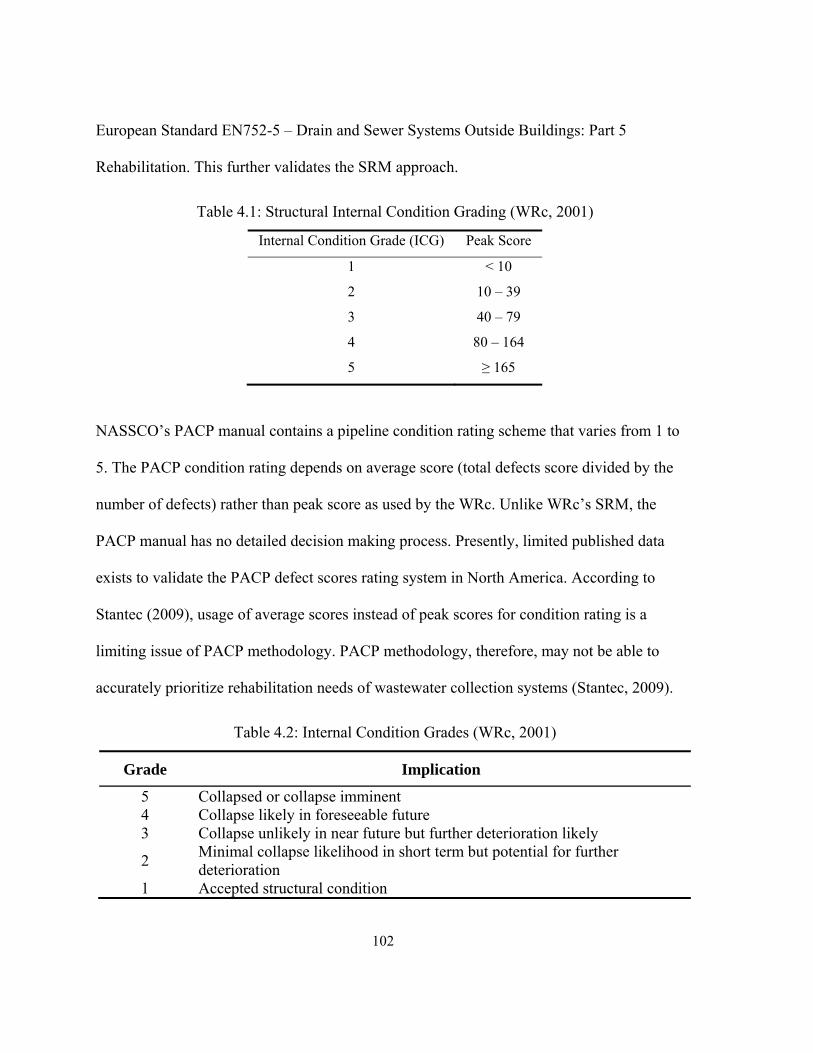
102
European Standard EN752-5 – Drain and Sewer Systems Outside Buildings: Part 5
Rehabilitation. This further validates the SRM approach.
Table 4.1: Structural Internal Condition Grading (WRc, 2001)
Internal Condition Grade (ICG) Peak Score
1 < 10
2 10 – 39
3 40 – 79
4 80 – 164
5 ≥ 165
NASSCO’s PACP manual contains a pipeline condition rating scheme that varies from 1 to
5. The PACP condition rating depends on average score (total defects score divided by the
number of defects) rather than peak score as used by the WRc. Unlike WRc’s SRM, the
PACP manual has no detailed decision making process. Presently, limited published data
exists to validate the PACP defect scores rating system in North America. According to
Stantec (2009), usage of average scores instead of peak scores for condition rating is a
limiting issue of PACP methodology. PACP methodology, therefore, may not be able to
accurately prioritize rehabilitation needs of wastewater collection systems (Stantec, 2009).
Table 4.2: Internal Condition Grades (WRc, 2001)
Grade Implication
5 Collapsed or collapse imminent 4 Collapse likely in foreseeable future 3 Collapse unlikely in near future but further deterioration likely
2 Minimal collapse likelihood in short term but potential for further deterioration
1 Accepted structural condition

103
4.4 Wastewater Pipelines Condition Assessment Data
Majority of the utilities and municipalities do not perform regular inspections and have
incomplete system inventories. In 2004, the Ministry of Finance in Ontario, Canada,
completed a survey (PricewaterhouseCoopers, 2003) to investigate municipal water and
wastewater systems asset management practices in Canada. This survey found that 52% of all
the responding municipalities do not either perform asset inspections or record information
regarding the performance of their systems. Therefore, the lack of good quality data is a
major problem in developing reliable and useful deterioration models for wastewater
pipelines, and has been documented in the published literature (see for example, Baik et al.,
2006; Wirahadikusumah et al., 2001).
Characteristics of Wastewater Pipelines Condition Assessment Data
The deterioration may be intrinsically continuous, however, for wastewater pipelines it is
mostly measured in discrete and ordinal – that is, non-continuous – Structural Internal
Condition Grades (ICG) or Structural Performance Grades (SPG). WRc’s ICG were
developed as distinct condition grades as shown in Figure 4.1 (hypothetical illustration). A
pipeline remains in a condition grade until a point in time when it meets the requirement to
move into the next condition grade. For example, the pipeline in Figure 4.1 remains in ICG 1
from installation to 21 years, and at age 21.1 years it jumps immediately into ICG 2.
Thus, the condition of wastewater pipelines is measured on a categorical scale. The pipelines
internal condition grades, therefore, represent categorical/discrete responses as opposed to
continuous response. The categorical response variables may be of nominal, ordinal, or

104
interval types depending upon how they are measured (Agresti, 2002). The distinction
between nominal, ordinal, and interval data types is given below.
Pipe Age Post Installation (Years)
0 10 20 30 40 50 60 70 80
1
2
3
4
5
WRcInternal Condition Grade (ICG)
ICG‐1
ICG‐2
ICG‐3
ICG‐4
ICG‐5
Figure 4.1: Hypothetical Deterioration Phenomenon using WRc's ICG
Nominal Variables are qualitative variables, and have categories with no natural ordering.
The variable ‘pipe_material’, for example, is a nominal variable that can take values such as
reinforced concrete and vitrified clay.
Ordinal Variables have ordered categories, but the distance between categories is unknown.
They can be qualitative or quantitative. For example, wastewater pipelines internal condition
grade is an ordinal variable (refer to Table 4.2).
Interval Variables have ordered categories and defined numerical distances between the
categories. They are essentially quantitative variables.
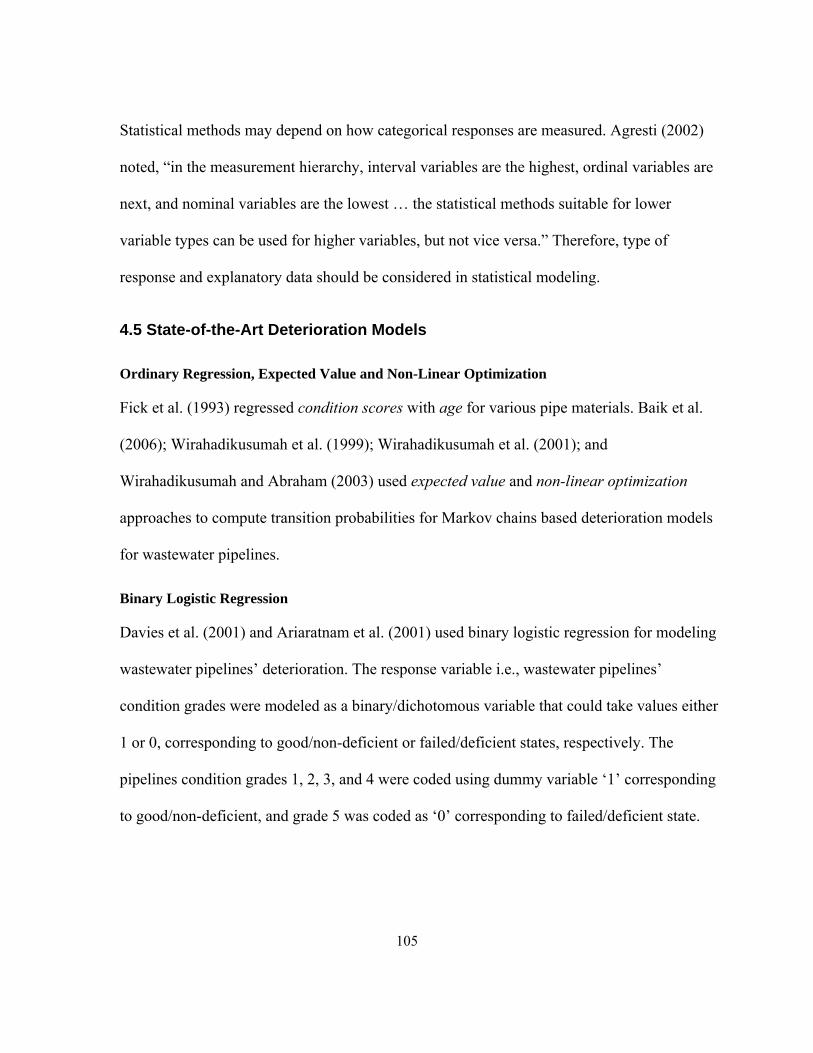
105
Statistical methods may depend on how categorical responses are measured. Agresti (2002)
noted, “in the measurement hierarchy, interval variables are the highest, ordinal variables are
next, and nominal variables are the lowest … the statistical methods suitable for lower
variable types can be used for higher variables, but not vice versa.” Therefore, type of
response and explanatory data should be considered in statistical modeling.
4.5 State-of-the-Art Deterioration Models
Ordinary Regression, Expected Value and Non-Linear Optimization
Fick et al. (1993) regressed condition scores with age for various pipe materials. Baik et al.
(2006); Wirahadikusumah et al. (1999); Wirahadikusumah et al. (2001); and
Wirahadikusumah and Abraham (2003) used expected value and non-linear optimization
approaches to compute transition probabilities for Markov chains based deterioration models
for wastewater pipelines.
Binary Logistic Regression
Davies et al. (2001) and Ariaratnam et al. (2001) used binary logistic regression for modeling
wastewater pipelines’ deterioration. The response variable i.e., wastewater pipelines’
condition grades were modeled as a binary/dichotomous variable that could take values either
1 or 0, corresponding to good/non-deficient or failed/deficient states, respectively. The
pipelines condition grades 1, 2, 3, and 4 were coded using dummy variable ‘1’ corresponding
to good/non-deficient, and grade 5 was coded as ‘0’ corresponding to failed/deficient state.
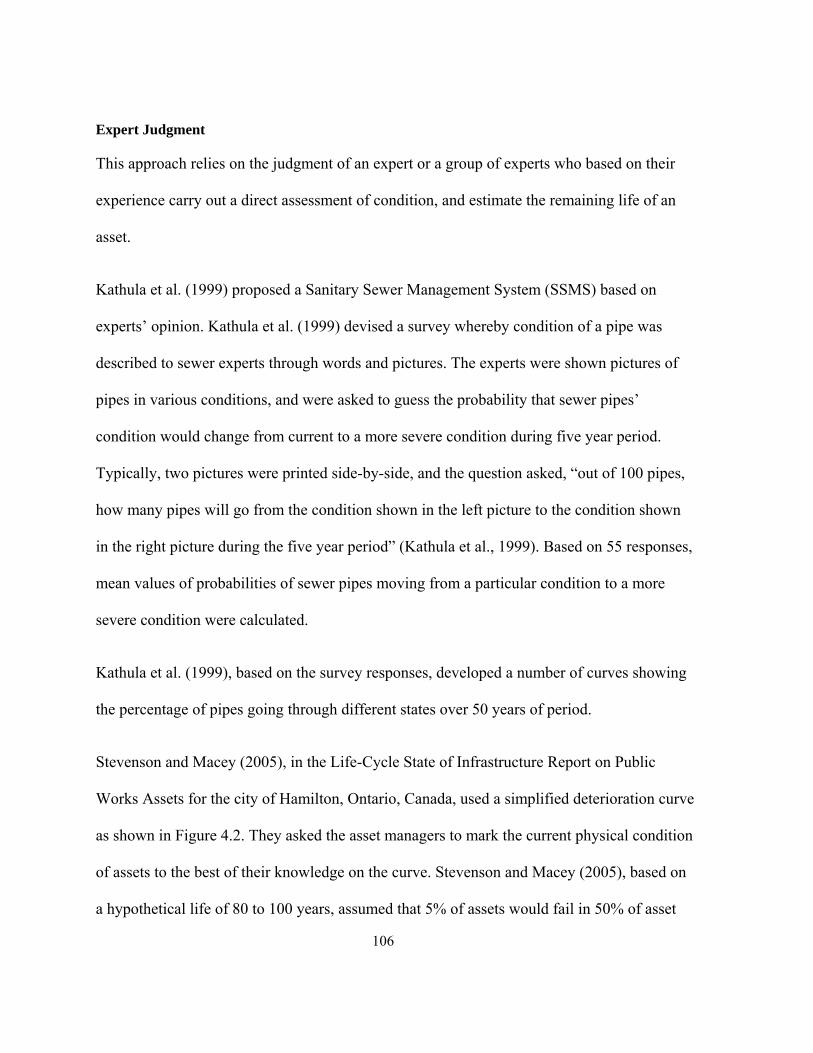
106
Expert Judgment
This approach relies on the judgment of an expert or a group of experts who based on their
experience carry out a direct assessment of condition, and estimate the remaining life of an
asset.
Kathula et al. (1999) proposed a Sanitary Sewer Management System (SSMS) based on
experts’ opinion. Kathula et al. (1999) devised a survey whereby condition of a pipe was
described to sewer experts through words and pictures. The experts were shown pictures of
pipes in various conditions, and were asked to guess the probability that sewer pipes’
condition would change from current to a more severe condition during five year period.
Typically, two pictures were printed side-by-side, and the question asked, “out of 100 pipes,
how many pipes will go from the condition shown in the left picture to the condition shown
in the right picture during the five year period” (Kathula et al., 1999). Based on 55 responses,
mean values of probabilities of sewer pipes moving from a particular condition to a more
severe condition were calculated.
Kathula et al. (1999), based on the survey responses, developed a number of curves showing
the percentage of pipes going through different states over 50 years of period.
Stevenson and Macey (2005), in the Life-Cycle State of Infrastructure Report on Public
Works Assets for the city of Hamilton, Ontario, Canada, used a simplified deterioration curve
as shown in Figure 4.2. They asked the asset managers to mark the current physical condition
of assets to the best of their knowledge on the curve. Stevenson and Macey (2005), based on
a hypothetical life of 80 to 100 years, assumed that 5% of assets would fail in 50% of asset

107
life, 15% would fail in 75% of asset life, 65% would fail in 125% of asset life , while the
remaining would fail at 100% of asset life.
Figure 4.2: Simplified Deterioration Curve (Stevenson and Macey, 2005)
Markov Chains and Ordered Probit Models
In a Markov model the probability of jumping into a state at time 1t depends only on the
state occupied at time t , and is independent of the history of the process up to time t (Hillier
and Lieberman, 1980). Baik (2003); Baik et al. (2006); Burgess (1990); Jeong et al. (2005);
Kathula et al. (1999); Micevski et al. (2002); Wirahadikusumah et al. (1999); and
Wirahadikusumah and Abraham (2003) used Markov chains models for the deterioration of
wastewater pipelines. Expected value (non-linear optimization) and/or ordered probit
regression were used to estimate transition probabilities. Baik (2003); Baik et al. (2006); and
Jeong et al. (2005) used ordered probit regression to estimate probabilities, and employed
these probabilities as the transition probabilities in Markov chains models for sewers
deterioration.
108
4.6 Case Study
This section presents the application of ordinary and binary logistic regression models to the
wastewater pipelines condition assessment data collected from the City of Niagara Falls.
Furthermore, deterioration models based on expert judgment, ordinal probit regression and
Markov chains are discussed.
4.6.1 City of Niagara Falls Wastewater Pipelines Condition Assessment Data
To ensure that a high quality SSET pipeline condition assessment database is developed for
the City of Niagara Falls wastewater network, the data collection and data analysis
procedure, shown in Figure 4.3, was implemented. A contractor supplied North American
Association of Pipelines Inspectors (NAAPI) certified operator completed all the SSET
pipeline surveys, and coded all pipeline defects in accordance with the Manual of Sewer
Condition Classification 3rd edition (WRc, 1993). Using NAAPI certified City of Niagara
Falls personnel, a second Quality Assurance (QA) and Quality Control (QC) check was
performed on all the contractor provided data.
All of the City of Niagara Falls quality pipeline inspection data was transported to the
University of Waterloo to be stored on two geographically distributed data servers that are
backed up using RAID 5 technology to ensure data security, availability, and seamless
recovery. Using a University of Waterloo custom built software application, the City of
Niagara Falls QA/QC data is uploaded into a database management system named
WatBAMS (Waterloo – Buried Asset Management System). The software import utility
contains further QA/QC protocols to ensure that only high quality data is uploaded in the
109
WatBAMS database for each pipe segment survey. Using WatBAMS programmed routines,
each pipeline segment is analyzed in accordance with the Sewerage Rehabilitation Manual
4th edition methodology to determine the corresponding Internal Condition Grade (ICG).
WatBAMS also allows for the upload and integration with the City’s of Niagara Falls GIS
and inventory databases that contain each pipe segment’s attributes - asset ID, location,
construction date, and material type etc.
The City of Niagara Falls wastewater collection network consists of approximately 400 km
of pipelines that has approximately 5,500 pipe segments consisting of a variety of pipe
materials with ages that range from over 100 years to less than 20 years with an average age
of 47 years. It is noted that that 35% of the network consists of Reinforced Concrete (RC),
17% PVC, 10% Vitrified Clay (VC), 10% Asbestos Cement (AC), and 25% of the network
has no assigned pipe material. The average age of the RC and VC pipes are 42 and 65 years,
respectively. Review of the SSET surveys and defect reports found that VC pipes have open
and displaced joints and service connections that were installed by creating a hole in the clay
pipe. Thus, there are holes and cracks where service connections enter into the VC pipes. RC
pipes were found to be generally in good condition except for locations with few displaced
joints and structural defects such as cracks, fractures, and broken segments. None of the
pipes in the sample were rehabilitated or replaced, and therefore, none of the observations
were censored. Approximately 12% (45 km) of the City of Niagara Falls wastewater
collection network data is used in the development of ordinary and binary logistic regression
models.
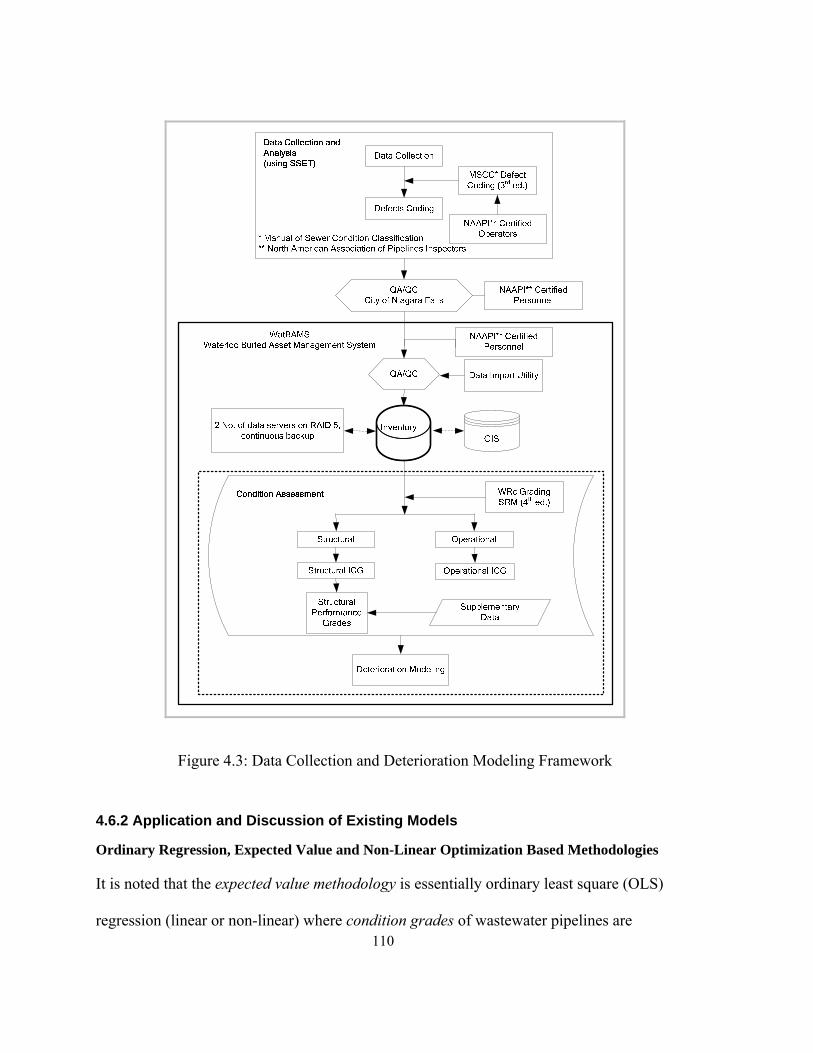
110
Figure 4.3: Data Collection and Deterioration Modeling Framework
4.6.2 Application and Discussion of Existing Models
Ordinary Regression, Expected Value and Non-Linear Optimization Based Methodologies
It is noted that the expected value methodology is essentially ordinary least square (OLS)
regression (linear or non-linear) where condition grades of wastewater pipelines are
111
regressed on age. The distance between expected value of condition rating and the average
condition rating at time t is minimized using non-linear optimization.
Hoffmann (2004) and Pampel (2000) discussed the limitations of ordinary regression to
model binary and ordinal data. Madanat and Wan Ibrahim (1995); Madanat et al. (1995); and
Mishalani and Madanat (2002) criticized the application of expected value and non-linear
optimization techniques in transportation assets (e.g., pavements and bridges) deterioration
modeling. Wirahadikusumah et al. (2001) and Wirahadikusumah and Abraham (2003)
pointed to the limitations of expected value and non-linear optimization methodologies for
wastewater pipelines deterioration modeling and cited the scarcity of data in developing
better models.
The ordinary regression based methodologies are not suitable for modeling the degradation
of wastewater pipelines for the following reasons:
1. Ordinary regression assumes that the distance between adjacent categories (condition
grades) is constant. However, it is important to note that there is no underlying interval
scale between the wastewater Internal Condition Grades (ICG), i.e., ICG 2 - ICG 1
ICG 3 - ICG 2.
2. Figure 4.4 shows the scatter plot of ICG vs. Age for the wastewater pipelines condition
assessment data from the city of Niagara Falls. All the observations are nicely lined up
corresponding to the internal condition grades. The regression curve clearly shows that
the assumption of homoscedasticity – that is, constant variance of error term – is violated.
112
This results in biased standard errors of estimated coefficients which lead to incorrect
significance tests and probably wrong inferences.
3. Ordinary regression assumes normally distributed error term which is an important
assumption for making inferences. However, this assumption is usually violated when
ordinary regression is used to model ordinal response variables. To further clarify this
issue, a quadratic regression model is applied to a sample of condition assessment data of
wastewater pipelines. The results are presented in Figures 4.4 and 4.5. Figure 4.4 shows
heteroscedasticity problem when a quadratic regression line is fitted to the data. Figure 4.5
shows the normal probability plot to verify the assumption of normally distributed error
terms. The snaking pattern of residuals indicates that they are not normally distributed.
4. The predicted values of dependent variable may be higher than the possible values of the
dependent variable in case of an ordinary regression model.

113
12
34
5S
truc
tura
l In
tern
al C
on
ditio
n G
rad
e (I
CG
)
0 20 40 60 80 100Age (Years)
ICG Fitted values
Figure 4.4: Scatter Plot of ICG and Age and a Quadratic Regression Line
0.0
00
.25
0.5
00
.75
1.0
0E
xpec
ted
Cum
ula
tive
Pro
babi
lity
0.00 0.25 0.50 0.75 1.00Observed Cumulative Probability
Figure 4.5: Normal Probability Plot of Residuals (from the model shown in Figure 4.4)

114
Binary Logistic Regression
This methodology is limited in scope and usefulness to model data with more than two
categories. According to Agresti (1996), “it is usually inadvisable [italics added] to collapse
ordinal data to binary.” Collapsing five condition grades into two – that is, into pass and fail
categories – throws away additional information contained in the data. This is illustrated by
applying the binary logistic regression and ordinal logit models to the City of Niagara Falls
wastewater pipelines condition data. To obtain binary logistic model, the condition grades 1
to 4 are collapsed and termed as pass whereas grade 5 is termed as fail grade. The ordinal
logit model extends the binary logit model when the response variable has more than two
ordered categories. The detailed information about ordinal logit model development and
application is provided in Chapter 5. Table 4.3 shows the parameter estimates for binary
logistic and ordinal logit models. The standard deviations (Std. Err.) in case of binary logistic
model are larger as compared to the ordinal logit model. For example, the Std. Err. for
material predictor is 0.9808 in binary logistic model as compared to 0.6330 in ordinal logit
model as shown in Table 4.3. This shows that collapsing condition grades results in loss of
information.
Table 4.3: Parameter Estimates for Binary Logistic and Ordinal Logit Regression Models
Parameter Binary Logistic Regression Ordinal Logit Model
Coefficient Std. Err. Coefficient Std. Err.
Age 0.0076 0.0075 0.0084 0.0069
Material -4.6252 0.9808 -3.4391 0.6330
Age Material 0.0583 0.0155 0.0462 0.0110

115
Expert Judgment
Expert probability estimates, while commonly used in decision analysis when data is not
available or knowledge is vague, can be highly inaccurate. In Civil engineering applications,
field conditions introduce uncertainty in the application of expert knowledge. Meyer and
Booker (1991) referred to some case studies that reported human biases in probability
estimates. It is generally observed that experts are not good estimators of probability values
and predictions. Asking experts to assign probability values to predict the likelihood of
occurrence of some event or to comment on the condition of an asset without inspection is
too much to ask. According to Morgan (1990), “elicited expert subjective judgment is no
substitute [italics added] for proper scientific research,” and “can reduce pressures to obtain
research output, and thus result in diminished investments in needed research.”
Markov Chain and Ordered Probit Regression Based Methodologies
To use Markov chains for deterioration modeling of wastewater pipelines, assumptions about
homogeneity and order were employed but could not be verified. According to Lindsey
(2004), sufficient number of replicate series is required to test homogeneity, and details of
changes for each series for at least three consecutive time periods are required to examine the
order. It is not plausible to assume that the assumptions hold a priori, and is important to test
that the assumptions of Markov chains are “at least approximately” reasonable (Lindsey,
2004). It is noted that in the absence of longitudinal condition assessment data – that is,
repeated observations on same samples – researchers used ordinary or ordered probit
regression to determine transition probabilities for Markov chain models. Lindsey (2004)
noted, “marginal probabilities describe the underlying trend of the process, and do not
116
uniquely define a stochastic process.” It is difficult to authenticate the results of Markov
chain based deterioration models due to data limitations.
The Markov chains model proposed by Micevski et al. (2002) for the deterioration of storm
water pipelines is a multinomial model which does not take into account the ordinal nature of
response variable. The ordered probit model used in the study by Baik et al. (2006) did not fit
the data well. Baik cited the poor quality of data as one of the possible reasons for the lack of
model fit. The ordered probit models found in the literature are complex – that is, they are
fully unconstrained – in terms of number of parameters to be estimated. This makes their
interpretation very difficult. Furthermore, the interactions between important covariates such
as age and material are not taken into account.
4.7 Discussion and Conclusions
This paper provided an overview of wastewater pipelines condition assessment and state-of-
the-art deterioration modeling techniques. Some of the limitations of existing deterioration
models are illustrated by applying these models to the pipelines condition assessment data
collected by the author from the City of Niagara Falls wastewater collection system.
Remote controlled Closed Circuit Television cameras and more recently Side Scanning and
Evaluation Technology cameras are widely used for wastewater pipelines inspection surveys.
Water Research centre (WRc) protocols were found to be widely accepted and used for
defect coding, classification, and condition assessment of wastewater pipelines. The most
commonly used statistical deterioration modeling techniques for wastewater pipelines
117
included: expert judgment, ordinary regression, binary logistic regression, and Markov
chains based models. The transition probabilities in Markov chains were estimated using
ordinary regression based methodologies (e.g., expected value or non-linear optimization) or
ordered probit regression.
Expert judgments suffer from serious limitations and problems, such as, data validity,
scientific justification, and calibration. Follow up research need to be conducted to validate
and justify the initial elicited inferences. Ordinary regression – when applied to the
wastewater pipelines condition data collected by the author – violated normality assumption
as well as suffered from heteroscedasticity problem. These problems result in incorrect
statistical tests for parameters and biased confidence intervals. Using binary logistic
regression by collapsing multi-category ordinal response data into binary response resulted in
loss of information. Suitable data does not exist to verify the assumptions of Markov chain
based deterioration models for wastewater collection systems. Ordered probit regression
models contained too many parameters, and thus made their interpretations extremely
difficult. To summarize, the most common concerns with the existing wastewater
deterioration models include one or more of the following:
(1) they violate the model assumptions or assumptions are not verified;
(2) they do not take into account the ordinal nature of the data;
(3) they are based on data obtained from third party sources with little or no information
about data quality assurance and quality control procedures; and

118
(4) they are complex in terms of number of parameters to be estimated which can lead to
invalid interpretations.
Lack of adequate condition assessment data impedes progress in understanding the
deterioration behaviour of wastewater pipelines. It is high time that utility owners must
commit to the development of new high quality inspection databases. Reliable and useful
deterioration models will help by improving decision-making and developing cost-effective
maintenance, management and renovation/replacement programs for wastewater
infrastructure.

119
References
Agresti, A. (1996). An introduction to categorical data analysis John Wiley & Sons, Inc
Agresti, A. (2002). Categorical data analysis (Second ed.). Canada: Wiley Interscience.
Ariaratnam, S. T., El-Assaly, A., & Yang, Y. (2001). Assessment of infrastructure inspection
needs using logistic models. Journal of Infrastructure Systems, 7(4), 160-165.
Baik, H. (2003). Development of an asset valuation model for wastewater infrastructure
assets. Purdue University.
Baik, H., Jeong, H. S., & Abraham, D. M. (2006). Estimating transition probabilities in
Markov chain-based deterioration models for management of wastewater systems.
Journal of Water Resources Planning and Management, 132(1), 15-24.
CERF. (2001). Evaluation of SSET: The sewer scanner & evaluation technology (Technical
Evaluation Report No. 40551). USA: American Society of Civil Engineers.
Davies, J. P., Clarke, B. A., Whiter, J. T., Cunningham, R. J., & Leidi, A. (2001). The
structural condition of rigid sewer pipes: A statistical investigation. Urban Water, 3,
277-286.
Fick, B., Johnson, M., & Johnson, J. (1993). Predictive model aids in development of system
wide rehabilitation program. Proceedings of the International Conference of Pipeline
Division of the ASCE, San Antonio, Texas. 616-627.
Hillier, F. S., & Lieberman, G. J. (1980). Introduction to operations research (3rd ed.). San
Francisco, USA: Holden-Day, Inc.
Hoffmann, J. P. (2004). Generalized linear models: An applied approach. USA: Pearson
Education, Inc.

120
Jeong, H. S., Baik, H., & Abraham, D. M. (2005). An ordered probit model approach for
developing Markov chain based deterioration model for wastewater infrastructure
systems. ASCE Pipeline Division Specialty Conference - PIPELINES 2005, Aug 21-24
2005, 649-661.
Kathula, V. S., Jr., N. D. P., Roberts, F. L., & Nassar, R. (1999). Integrating sewer condition
with sewer management. No Dig 1999 Conference, Orlando, Florida.
Lindsey, J. K. (2004). Statistical analysis of stochastic processes in time. Cambridge, UK ;
New York: Cambridge, UK ; New York : Cambridge University Press.
Madanat, S., Mishalani, R., & Wan Ibrahim, W. H. (1995). Estimation of infrastructure
transition probabilities from condition rating data. Journal of Infrastructure Systems,
1(2), 120-125.
Madanat, S., & Wan Ibrahim, W. H. (1995). Poisson regression models of infrastructure
transition probabilities. Journal of Transportation Engineering, 121(3), 267-272.
Meyer, M. A., & Booker, J. M. (1991). Eliciting and analyzing expert judgment: A practical
guide (Reprint Edition) Society for Industrial Mathematics.
Micevski, T., Kuczera, G., & Coombes, P. (2002). Markov model for storm water pipe
deterioration. Journal of Infrastructure Systems, 8(2), 49-56.
Mishalani, R. G., & Madanat, S. M. (2002). Infrastructure state transition probability
computation using duration models. Proceedings of the Seventh International
Conference on: Applications of Advanced Technology in Transportation, Aug 5-7 2002,
505-512.
Morgan, M. G. (1990). In Small M. (Ed.), Uncertainty: A guide to dealing with uncertainty
in quantitative risk and policy analysis. New York; Cambridge: Cambridge University
Press.

121
NASSCO. (2006). NASSCO's pipeline assessment and certification program (PACP).
Retrieved July 13, 2006, from http://www.nassco.org/pdf/editorial.pdf
Pampel, F. C. (2000). Logistic regression: A primer. Thousand Oaks, Calif.: Thousand Oaks,
Calif. : Sage Publications.
PricewaterhouseCoopers. (2003). Analysis of asset management, accounting, finance and
pricing practices for municipal water and wastewater systems in Ontario. Ontario:
Ministry of Finance.
Rahman, S., Vanier, D. J., Kleiner, Y., & Taylor, D. A. (2004). MIIP report: An evaluation
of condition assessment protocols for sewer management (Client Report No. B-5123.6).
Ottawa, Canada: National Research Council, Canada. Retrieved from http://irc.nrc-
cnrc.gc.ca/pubs/fulltext/b5123.6/b5123.6.pdf
Stantec. (2009). Review of sewer defect condition classification methodologies. Roster
Category 26: Subsurface Infrastructure Assessment and Trenchless Technologies. City
of Hamilton, Canada.
Stevenson, G., & Macey, C. C. (2005). Life-cycle state of the infrastructure report on public
works assets (Technical Report No. D312 008 00). Mississauga, Ontario: UMA
Engineering Ltd.
Wirahadikusumah, R., Abraham, D., & Iseley, T. (2001). Challenging issues in modeling
deterioration of combined sewers. Journal of Infrastructure Systems, 7(2), 77-84.
Wirahadikusumah, R., Abraham, D. M., & Castello, J. (1999). Markov decision process for
sewer management. Engineering, Construction and Architectural Management, 6(4),
358-370.
Wirahadikusumah, R., & Abraham, D. M. (2003). Application of dynamic programming and
simulation for sewer management. Engineering, Construction and Architectural
122
Management, 10(3), 193-208.
Wirahadikusumah, R., Abraham, D. M., Iseley, T., & Prasanth, R. K. (1998). Assessment
technologies for sewer system rehabilitation. Automation in Construction, 7(4), 259-270.
WRc. (1993). Manual of sewer condition classification (Third ed.). UK: Water Research
Centre.
WRc. (2001). Sewerage rehabilitation manual (Fourth ed.). Swindon, UK: Water Research
Centre.
Younis, R., & Knight, M. A. (2008). An empirical model for the prediction of structural
behaviour of wastewater collection systems. ASCE International Pipelines Conference
2008, Atlanta, GA.
Younis, R., & Knight, A. M. (2009). A probability model for investigating the trend of
structural deterioration of wastewater pipelines. Tunneling and Underground Space
Technology (submitted).

123
Chapter 5
A Probability Model for Investigating the Trend of Structural
Deterioration of Wastewater Pipelines
This paper has been submitted to the Tunneling and Underground Space Technology journal.

124
5.1 Abstract
Canada’s infrastructure is aging and deteriorating. New legislation requires the municipalities
to estimate operating and capital expenditures for running the systems into the future and to
develop financial sustainability plans. Wastewater pipelines deterioration is currently not
well understood and realistic deterioration models need to be developed.
This paper demonstrates how the condition assessment data from trenchless visual
inspections of wastewater pipelines can be used to understand the performance of wastewater
pipelines. A new ordinal regression model for the deterioration of wastewater pipelines based
on cumulative logits is elaborated. The model is presented using the Generalized Linear
model formulation and takes into account the interaction effect between the explanatory
variables. The new model is demonstrated and validated using the City of Niagara Falls high
quality wastewater collection network condition assessment data for Reinforced Concrete
(RC) and Vitrified Clay (VC) pipes.
This new model was found to represent the City of Niagara Falls RC and VC pipes
deterioration behavior for pipes in service for up to 110 years. RC pipes deterioration was
found to be age dependent while VC pipes deterioration was not age dependent. This finding
is contrary to other deterioration model studies that indicate that VC deterioration is age
dependent. The service life for RC pipes was determined to be approximately 75 years while
VC pipes were found to have an indefinite service life if installed without structural damage.

125
The cumulative logit model can be used to determine wastewater pipelines service life,
predict future condition states, and estimate network maintenance and rehabilitation
expenditures. The latter is critical if realistic wastewater networks future maintenance and
operation budgets are to be developed for the life of the asset, and to meet new regulatory
reporting requirements. Further research is required to validate this new methodology for
other networks and the deterioration modeling of pipe materials other than RC and VC.
Keywords: Wastewater pipelines; Deterioration modeling; Statistical modeling; Asset
management; Vitrified clay pipes; Reinforced concrete pipes

126
5.2 Introduction
A large percentage of Canada’s buried municipal water and wastewater piping networks have
exceeded or are approaching its design life of 50 to 75 years. Therefore, this aging and
deteriorating infrastructure needs to be renewed or replaced. Estimates of Canada’s
municipal infrastructure deficit vary from a $44 billion total municipal infrastructure shortfall
(TD Economics, 2002) to over $125 billion (Mirza, 2007). The municipal infrastructure
deficit is an estimate of the total additional investment needed to repair and prevent
deterioration in existing, municipally owned infrastructure assets. Mirza (2007) reports that
the infrastructure funding gap for existing water and wastewater is $31 billion, and to meet
new needs an additional $56.6 billion is required. The size and scope of the infrastructure
problems facing municipalities and local governments is enormous as the decay of Canada’s
infrastructure creates severe domino effects - higher cost of maintenance, operation,
rehabilitation and repair; inefficiency and increased vulnerability; and increased threats to
public safety and the environment. Mirza (2007) states that “without maintenance or with
deferred maintenance, the municipal infrastructure deficit could be close to $2 trillion by
2065 and that with regular maintenance and good scientific management, the escalating
infrastructure deterioration and the resulting infrastructure deficit can be controlled within
manageable levels.”
In 2006, the Canadian Institute of Chartered Accountants Public Sector Accounting Board
(PSAB) issued statement PS3150 which requires all Canadian municipalities and utilities,
starting in January 2009, to report their tangible capital assets along with their depreciation

127
on financial statements (OMBI, 2007). One of PSAB requirements is the estimation of
operating and capital expenditures for running the systems into the future. In the United
States, the Governmental Accounting Standards Board (GASB) Statement 34, and in
Australia, the Australian Accounting Research Foundation Standard 27 (see FHWA, 2000;
Howard, 2001) specify similar accounting practices. To meet these specified accounting
practices, knowledge on how the assets behave and deteriorate over time is imperative.
Current Canadian government guidelines suggest that the useful life for various civil
infrastructure assets and for wastewater pipelines range from 40 to 75 years (Ministry of the
Environment, 2007; NAMS, 2002) with limited or no asset deterioration knowledge. The
absence of asset deterioration knowledge necessitates Canadian municipalities to make
unsubstantiated assumptions about the timing and volume of capital expenditures so that they
can comply with PSAB and other government and regulatory requirements. These
unsubstantiated assumptions will most likely result in an under or over-estimation of assets
future operational and capital needs. To develop realistic future life-cycle asset operation and
maintenance financial needs it is imperative that asset deterioration behavior is understood
and realistic deterioration models are developed and used for future predictions.
This paper provides an overview of trenchless wastewater condition assessment methodology
and protocols. It also discusses ordinal regression models and their applications in civil
engineering. An ordinal regression model, based on cumulative logits, is developed and
described along with its assumptions and the estimation procedure for predicting wastewater
infrastructure deterioration. The new deterioration model is demonstrated using City of
128
Niagara Falls wastewater collection system pipeline condition assessment data, and
procedures for verification of assumptions, determination of parameter estimates, validation,
and model interpretation are presented. The paper concludes with a discussion on the results,
and deterioration model limitations.
5.3 Literature Review
A review of current industry practices with respect to wastewater pipelines condition
assessment and deterioration modeling using ordinal regression models is provided in the
following sections.
5.3.1 Condition Assessment of Wastewater Pipelines
Assessment of current condition of wastewater pipelines is an important component of buried
infrastructure management processes. Trenchless condition assessment technologies such as
remotely controlled Closed Circuit Television (CCTV) and more recently Side Scanning
Evaluation Technology (SSET) cameras also known as Sewer Scanner and Evaluation
Technology are used for visual inspections of interior of wastewater pipelines. Information
provided by these cameras is critical to determine if and what trenchless construction
methods can be used to repair, renovate or replace deteriorated buried pipelines. The
development of realistic pipe deterioration models is also necessary for advanced buried
infrastructure asset management- that is, to fix the right asset at the right time to optimize the
limited resources. Pipeline inspections are completed by an operator remotely moving the
camera down the pipeline and coding all observed defects using a defect condition coding
129
system. In North America, two wastewater pipeline defect condition Classification systems
are predominately used: (1) Manual of Sewer Condition Classification (MSCC) 3rd edition
defect coding system developed by Water Research Center (WRc) in the United Kingdom
(WRc, 1993); and (2) Pipeline Assessment and Certification Program (PACP) developed by
National Association of Sewer Service Companies (NASSCO) and WRc (NASSCO, 2006;
Thornhill, 2005).
The Manual of Sewer Condition Classification, first published in 1980, became the national
standard in UK and many other parts of the world. In 1994 and 2004, the 3rd and 4th editions
of MSCC were published by WRc, respectively. In 1994, the North American Association of
Pipeline Inspectors (NAAPI) adopted WRc’s MSCC 3rd edition and developed a
Certification program for CCTV operators and reviewers. In 2002 NASSCO published PACP
to meet the needs of the United States. The Sewerage Rehabilitation Manual (SRM), also
published by WRc, describes a wastewater pipelines renovation decision making process that
is adopted in the United Kingdom and Canada. The first edition of the SRM was published in
1986 and the fourth edition was published in 2001 (WRc, 2001). The SRM determines the
structural and operational performance of wastewater pipelines by assigning scores to MSCC
defects based on their type and severity. These scores are transformed to Internal Condition
Grade (ICG) of 1 to 5, with 1 being the best or acceptable and 5 being the worst or collapsed
state. The continued use of the SRM methodology, in United Kingdom and Canada since
1994, validates the methodology as an acceptable and good approach for determining
pipeline current condition states. The general principles of the SRM also form the basis for
130
the European Standard EN752-5 – Drain and Sewer Systems Outside Buildings: Part 5
Rehabilitation. This further validates the SRM approach. NASSCO’s PACP manual contains
a pipeline condition rating scheme that varies from 1 to 5. The PACP condition rating
depends on average score (total defects score divided by the number of defects) rather than
peak score as used by the WRc. Unlike WRc’s SRM, the PACP manual has no detailed
decision making process. Presently, limited published data exists to validate the PACP defect
scores rating system in North America. According to Stantec (2009), usage of average scores
instead of peak scores for condition rating is a limiting issue of PACP methodology. PACP
methodology, therefore, may not be able to accurately prioritize rehabilitation needs of
wastewater collection systems (Stantec, 2009).
In 2004, the Ministry of Finance in Ontario, Canada, completed a survey
(PricewaterhouseCoopers, 2003) to investigate municipal water and wastewater systems asset
management practices. This survey found that among the responding Ontario municipalities,
17% do not perform inspections for condition assessment, and of those who do perform
inspections, 33% do not record the results of the inspections. The survey also found that large
municipalities (more than 50,000 populations) typically have better asset management
practices and that asset management approaches range from “don’t fix it if it is not broken”
strategies to the use of computationally intensive and sophisticated software tools. This
survey demonstrates the current state-of-art in asset management by municipalities in Canada
and most likely in North America.

131
5.3.2 Ordinal Regression Models
Ordinal variables are a type of categorical variables that have natural ordering of categories,
however, the distances between the categories is not known (Agresti, 2002). Ordinal
regression models are extensively used in social and life sciences for analyzing data where
response variable is rank-ordered or ordinal. These models are extensions of binary logit and
probit models to polytomous response cases and are generally referred to as econometric
models in civil engineering published literature. The difference between logit and probit
models is in the distribution of error terms. In case of probit models, the errors are normally
distributed, whereas in case of logit models, the errors are logistically distributed. Agresti
(2002) and Nelder and McCullah (1989) provide extensive details of these models. Clogg
and Shihadeh (1994) discusses a variety of ways of forming “response functions” for ordinal
data which result in the development of different ordinal logit models.
To date, the application of ordinal regression models to solve civil engineering problems is
limited although the data encountered is predominantly rank-ordered. For example, FHWA
(1995) specifies ten condition grades from 0 (failed condition) to 9 (excellent condition) for
condition ratings of bridge decks, and super and sub-structures. Similarly, Pavement
Condition Index (a value between 0-100 based on multiple pavement distress indicators) is
often discretized into eight rank-ordered categories from 1 representing failed to 8
representing excellent state (Madanat et al., 1995). Baik (2003) reviewed the application of
ordinal regression models for civil infrastructure deterioration and found that ordered probit
models were used for modeling the deterioration of pavement and bridges. Madanat et al.
132
(1995) and Baik et al. (2006) also used ordered probit models to model the deterioration of
bridges and wastewater pipelines, respectively.
5.4 Problem Statement and Proposed Model Review
5.4.1 Problem Description
The numerical value of Internal Condition Grades (ICG) of wastewater pipelines is arbitrary.
Therefore, instead of predicting an arbitrary value, the problem is restated as predicting the
probability of a wastewater pipeline being into one of the five condition grades as opposed to
the others depending upon covariates such as pipe age and material.
Davies et al. (2001) reported that concrete sewers are more likely to be in a lower ICG (more
structurally sound) than clay sewers. They also suggest that this finding may be the result of
clay pipes being significantly older than concrete pipes in the tested sample. This paper
investigates the hypothesis that vitrified clay pipes are more likely to be in a higher ICG
(poor structural condition) than reinforced concrete pipes.
5.4.2 Model Description
The ordinal regression model with cumulative logits based on Generalized Linear Model
(GLM) formulation is described below.

133
Let the index 1,2,...,j J represents J ordered responses for which a probability model based
on cumulative probabilities can be defined as | x .P Y j A regression model for ordinal
response, Y , based on cumulative probabilities may be specified as (Agresti, 2002):
| x x xj jP Y j F (5.1)
where, .F represents the standard cumulative distribution function (cdf) which is logistic in
this case, and j represent the 1J cutpoints (also known as thresholds) corresponding to
the ordered categories of response variable. This is the Generalized Linear Model (GLM)
formulation, provided F(.) is the inverse link function. The log-odds transformation known as
logit is the inverse function for the standard logistic cdf. Equation 5.1 can be written as:
1 x logit |x xj jF P Y j (5.2)
The ordered logit relation given in Equation 5.2 can be expressed in terms of cumulative
probability as:
x
x|x1
j j
j j
eP Y j
e
(5.3)
Under this parameterization, a positive slope (i.e., 0 ) means that larger values of
predictor ‘x’ are associated with higher levels of Y. That is, the probability of being in a
higher order category increases with large values of ‘x’ when 0 . For J ordinal dependent

134
categories, there will be ( 1)J predictions for each cumulative probability across successive
response categories. The final category will always have a cumulative probability equal to 1
because all the elements will be at or below the final category. The ( 1)J logits will have
different thresholds j for different response categories; however, ’s may or may not be
same across different categories. When ’s are constrained across responses, a Proportional
Odds model is obtained. On the other hand, when ’s are allowed to vary across categories,
an Unconstrained Cumulative Logit model is obtained. A Partial Proportional Odds model
will have some constrained, as well as, unconstrained ’s across response categories for one
or more covariates. The Score or Wald Tests can be employed to verify the proportional odds
assumption (Long, 1997).
5.4.3 Assumptions
There are two fundamental assumptions for ordinal regression analysis:
1. Continuous predictors are linearly related to the logits of response variable. If it is
determined that they are not linear, then correct scale/parametric form of continuous
variables must be determined. Bender and Grouven (1998) pointed out that this is the
most fundamental requirement that should be checked even before starting an ordinal
analysis.
2. The outcome variable must have rank ordering for every predictor (Boorah, 2001;
Harrell, 2001). According to Long (1997), the mere fact that a response variable can be

135
written in an ordered fashion is not enough to apply ordinal techniques because a
variable may be ordered or unordered under a given context.
5.4.4 Interaction
In case of multivariable analysis, the effect of an independent variable on dependent variable
may differ depending on the value of a third variable. This is called interaction. For example,
the effect of age on the probability of a pipeline being in a certain condition grade can vary
with the pipe material type. To check this possibility, the interaction between pipe age and
material type is added in the model by creating a higher order term resulting from the product
of pipe age and pipe material, namely agematerial.
5.4.5 Estimation
Using Equation 5.2, the probability of being in a certain category 1,2,...,j J is given by the
difference between cumulative probabilities, i.e.,:
| x | x 1| xP Y j P Y j P Y j (5.4)
The likelihood function is given as:
1 1
| x ijn J
c
i j
L P Y j
(5.5)
where 1ijc if Y j , and 0 otherwise.

136
Thus, for each ,J Equation 5.5 shows the product of all observations for which .Y j The
log-likelihood equation is then given as:
11 1
log log x xn n
ij j j j ji j
L c F F
(5.6)
Newton-Raphson or Fisher Scoring algorithms are employed to compute maximum
likelihood estimates for model parameters j and j .
5.4.6 Model Validation
Model validation and justification entails the following steps:
(1) Checking fundamental assumptions for ordinal regression analysis i.e., linearity and
ordinality assumptions
Quartiles (or deciles) and Fractional Polynomial analyses can be performed to check
the linearity of continuous predictors with the logit (Royston and Altman, 1994;
Bender 1998; Hosmer 2002). To verify the ordinality of response variable, a simple
graphical technique proposed by Harrell (2001) can be used. It involves the plot of
mean values of a predictor within each response category against the corresponding
category. A monotonic increasing or decreasing trend confirms the ordinality
assumption.
(2) Choosing between competing models
To choose between competing models, the deviance statistic of competing models is
compared. The difference of deviance between two models is the likelihood-ratio
137
statistic, 2 ,G having null chi-squared distribution (Agresti, 2002). This is also known
as Analysis of Deviance (AOD) that generalizes the Analysis of Variance (ANOVA)
used in multivariate normal regression.
(3) Checking proportional odds assumption
To test the proportional odds assumption, a score test or Wald test can be used (Long,
1997; Hosmer, 2002).
(4) Checking the overall fit of the selected model
Test for overall model fit assesses whether the chosen model improves predictions
over the null (intercept only) model. The likelihood ratio chi-square test can be
applied for this purpose (long, 1997).
(5) Checking the model performance
Pearson and deviance goodness-of-fit tests can be used to compare the predicted
frequency counts from the hypothesized model to the observed frequencies (Agresti,
2002).
5.4.7 Important Considerations Related To Model Estimation and Validation
Contingency tables with low and zero cell counts, as well as, with high counts in large
number of cells result in sparse tables (Agresti, 2002) or data thinning (Hosmer, 2002). Data
thinning can also occur when there are large number of variables in the model (Hosmer,
2002). Caution should be exercised in analyzing sparse data as sparseness can have profound
effect on model estimation and goodness-of-fit tests. For example, according to Agresti
(2002), in some cases the iterative estimation algorithm may fail to converge and result in a

138
value of or for a model’s parameters estimates. Agresti (2002) noted that: (1)
sampling zeros are very common in contingency tables; (2) a count of 0 is a permissible
outcome for a multinomial response variable (e.g., Internal Condition Grade in this paper);
(3) low or zero counts does not always harm the analyses; (4) the sampling distributions for
goodness-of-fit statistics such as likelihood ratio chi-square, 2 ,X and likelihood ratio
deviance, 2 ,G can be far from chi-squared approximations in case of sparse tables, and
alternative approximations, such as limiting normal for 2X and normal for 2G are proposed
in statistical literature; and (5) 2X and 2G are valid for comparing nested models that differ
by relatively few terms even if the data is sparse. One of the indicators of sparse data analysis
problems is large estimated standard errors (Hosmer, 2002). Agresti (2002) suggested using
Bayesian and random effects models to handle problematic sparse data.
5.5 Case Study
The proposed model is applied to City of Niagara Falls wastewater pipeline condition
assessment data collected by the authors. The condition surveys were carried out using Side
Scanner and Evaluation Technology (SSET). Demonstrated advantages of SSET over
traditional CCTV pipeline inspection technologies include the ability to: complete defect
rating after the survey is completed; measure pipeline defect changes over time; and more
accurately code pipeline defects. Chae et al. (2003) and Knight et al. (2009) present a good
discussion on the advantages of SSET over traditional CCTV inspection surveys.

139
5.5.1 City of Niagara Falls Pipeline Condition Assessment Data
To ensure that a high quality SSET pipeline condition assessment database is developed for
the City of Niagara Falls wastewater network, the data collection and data analysis
procedure, shown in Figure 5.1, was implemented. A contractor supplied North American
Association of Pipelines Inspectors (NAAPI) certified operator completed all the SSET
pipeline surveys, and coded all pipeline defects in accordance with the Manual of Sewer
Condition Classification 3rd edition (WRc, 1993). Using NAAPI certified City of Niagara
Falls personnel, a second Quality Assurance (QA) and Quality Control (QC) check was
performed on all the contractor provided data.
All of the City of Niagara Falls quality pipeline inspection data was transported to the
University of Waterloo to be stored on two geographically distributed data servers that are
backed up using RAID 5 technology to ensure data security, availability, and seamless
recovery. Using a University of Waterloo custom built software application, the City of
Niagara Falls QA/QC data is uploaded into a database management system named
WatBAMS (Waterloo – Buried Asset Management System). The software import utility
contains further QA/QC protocols to ensure that only high quality data is uploaded in the
WatBAMS database for each pipe segment survey. Using WatBAMS programmed routines,
each pipeline segment is analyzed in accordance with the Sewerage Rehabilitation Manual
4th edition methodology to determine the corresponding Internal Condition Grade (ICG).
WatBAMS also allows for the upload and integration with the City’s of Niagara Falls GIS
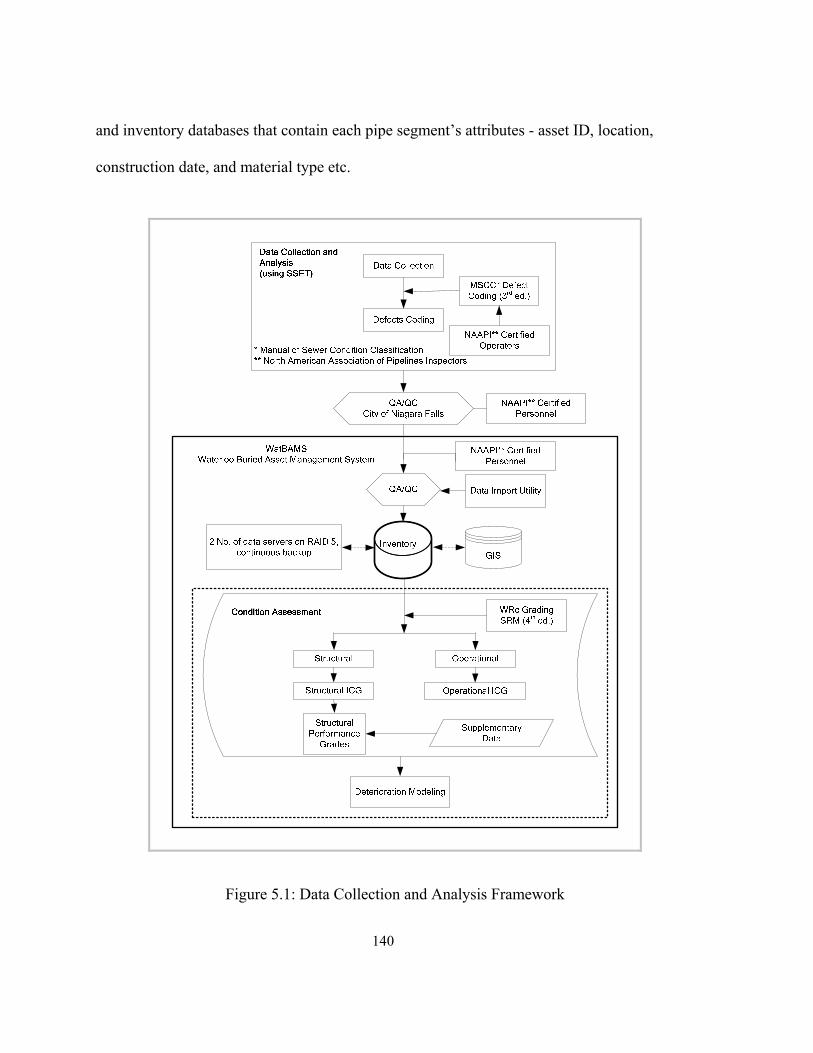
140
and inventory databases that contain each pipe segment’s attributes - asset ID, location,
construction date, and material type etc.
Figure 5.1: Data Collection and Analysis Framework

141
The City of Niagara Falls wastewater collection network consists of approximately 400 km
of pipelines that has approximately 5,500 pipe segments consisting of a variety of pipe
materials with ages that range from over 100 years to less than 20 years with an average age
of 47 years. Figure 5.2 shows that 35% of the network consists of Reinforced Concrete (RC),
17% PVC, 10% Vitrified Clay (VC), 10% Asbestos Cement (AC), and 25% of the network
has no assigned pipe material. The average age of the RC and VC pipes are 42 and 65 years,
respectively. Review of the SSET surveys and defect reports found that VC pipes have open
and displaced joints and service connections that were installed by creating a hole in the clay
pipe. Thus, there are holes and cracks where service connections enter into the VC pipes. RC
pipes were found to be generally in good condition except for locations with few displaced
joints and structural defects such as cracks, fractures, and broken segments. None of the
pipes in the sample were rehabilitated or replaced, and therefore, none of the observations
were censored.
Reinforced Concrete
35%
Unknown25%
PVC17%
Asbestos Concrete
10%
Vitrified Clay10%
Others3%
Figure 5.2: Distribution of Various Pipe Materials - City of Niagara Falls Sewer System

142
In the following sections, approximately 12% (45 km) of the City of Niagara Falls
wastewater collection network data (collected through stratified sampling) is used to
demonstrate the model development process shown in Figure 5.3. Table 5.1 presents the
observed data in the form of a contingency table – that is, the table cells contain the
frequency counts of the response variable, Internal Condition Grade (ICG). Table 5.1 shows
the average age of sampled pipes in each ICG as well as the pipelines frequency data
classified by material, age, and ICG. It is noted that the average age of RC pipes in the
sample – unlike the VC pipes – increases with increasing ICG (refer to Table 5.1). This
provides the first indication of age related deterioration in RC pipes. Some cells in the table
have low or zero counts. It is emphasized that the cells with zero counts are sampling zeros –
that is, it is possible to have observations in these cells when more data becomes available –
rather than structural zeros where observations are not possible. For wastewater pipelines,
low counts are possible in ICG 4 and 5 for newer pipes. Similarly, there can be smaller
number of observations in ICG 1, 2 and 3 for older pipes. The implications of low and zero
counts on model estimation and model fit are discussed in Section 5.4.7.
The model building process involves checking the linearity of continuous predictors with the
response and ordinality of response variable. If the linearity assumption is not satisfied then
correct parametric form of continuous predictors need to be determined. If the response is not
ordinal then alternative models such as multinomial logit may be considered. Once the
linearity and ordinality assumptions are satisfied, the estimates for model parameters are
determined and their statistical significance is checked. Then proportional odds assumption is

143
checked and model validation is carried out using goodness-of-fit tests. This is followed by
interpretation of results and conclusions.
Table 5.1: Pipelines Data Classified by Material, Age, and Internal Condition Grade
Material Age
(years)
Internal Condition Grades
1 2 3 4 5
Reinforced Concrete
0-20 7
20-40 131 13 13 18 3
40-60 24 8 7 8 5
60-80 1 1 1
80-100 1 1 2 3
100-120 2
Avg. Age (std. dev.) 35.7(10.7) 44.7(15.2) 43.7(14.9) 47.1(18.1) 61.9(27.7)
Vitrified Clay
0-20 1 1
20-40 4 1 1 3 5
40-60 8 6 8 7
60-80 3 1 1 1
80-100 4 9 5
100-120 6 1 3 10
Avg. Age (std. dev.) 66.5(27.2) 31.7 59.6(24.9) 67.5(23.2) 65.1(31.6)
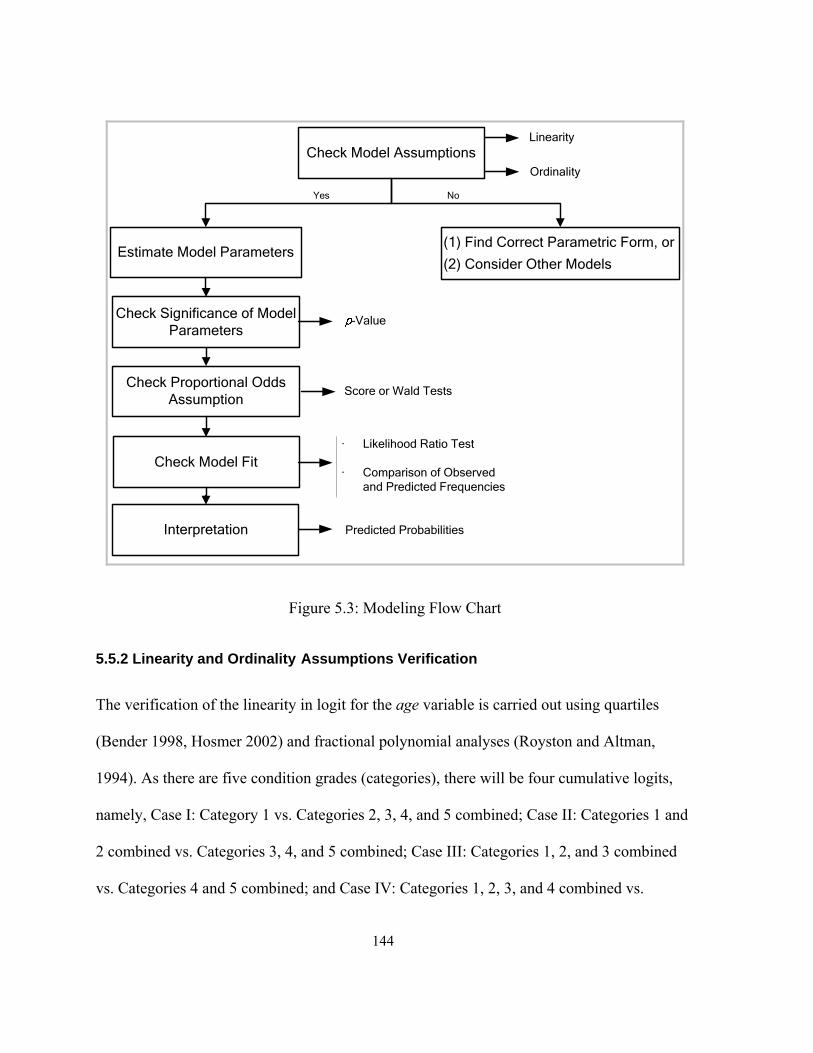
144
Check Model Assumptions Linearity
Ordinality
Estimate Model Parameters
Check Significance of Model Parameters
-Value
Check Model Fit· Likelihood Ratio Test
· Comparison of Observed and Predicted Frequencies
(1) Find Correct Parametric Form, or
(2) Consider Other Models
Interpretation Predicted Probabilities
Yes No
Check Proportional Odds Assumption
Score or Wald Tests
Figure 5.3: Modeling Flow Chart
5.5.2 Linearity and Ordinality Assumptions Verification
The verification of the linearity in logit for the age variable is carried out using quartiles
(Bender 1998, Hosmer 2002) and fractional polynomial analyses (Royston and Altman,
1994). As there are five condition grades (categories), there will be four cumulative logits,
namely, Case I: Category 1 vs. Categories 2, 3, 4, and 5 combined; Case II: Categories 1 and
2 combined vs. Categories 3, 4, and 5 combined; Case III: Categories 1, 2, and 3 combined
vs. Categories 4 and 5 combined; and Case IV: Categories 1, 2, 3, and 4 combined vs.
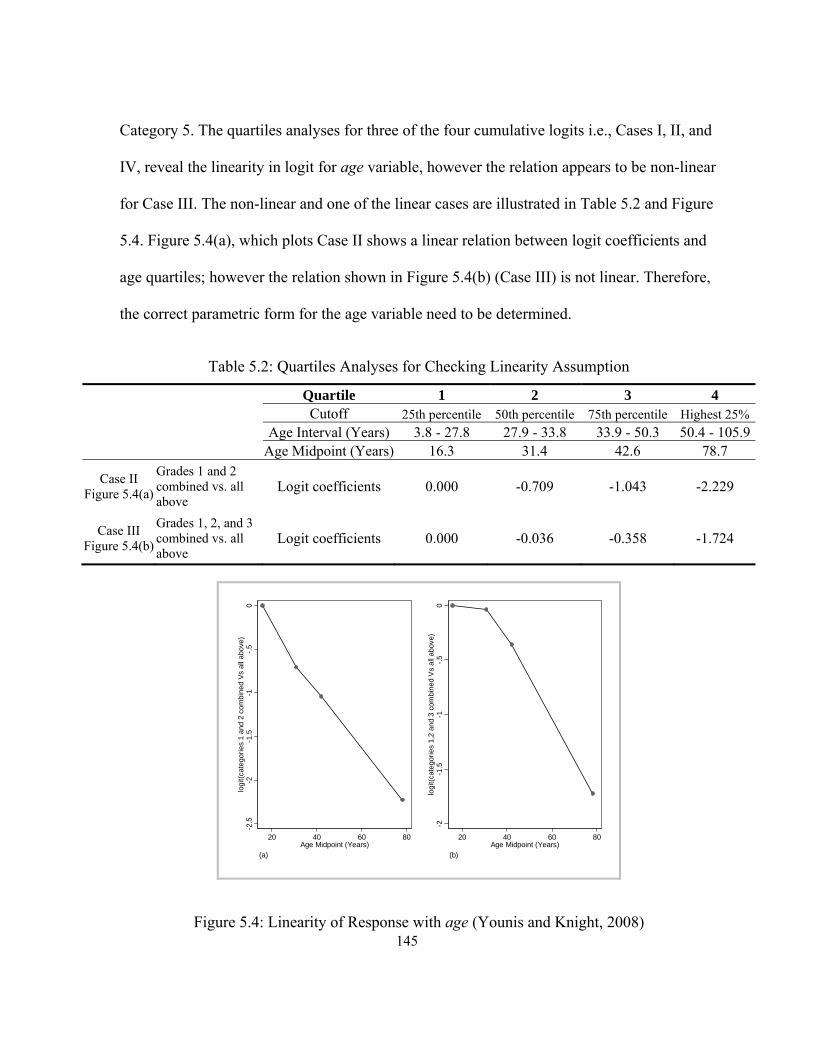
145
Category 5. The quartiles analyses for three of the four cumulative logits i.e., Cases I, II, and
IV, reveal the linearity in logit for age variable, however the relation appears to be non-linear
for Case III. The non-linear and one of the linear cases are illustrated in Table 5.2 and Figure
5.4. Figure 5.4(a), which plots Case II shows a linear relation between logit coefficients and
age quartiles; however the relation shown in Figure 5.4(b) (Case III) is not linear. Therefore,
the correct parametric form for the age variable need to be determined.
Table 5.2: Quartiles Analyses for Checking Linearity Assumption
Quartile 1 2 3 4 Cutoff 25th percentile 50th percentile 75th percentile Highest 25%
Age Interval (Years) 3.8 - 27.8 27.9 - 33.8 33.9 - 50.3 50.4 - 105.9 Age Midpoint (Years) 16.3 31.4 42.6 78.7
Case II Figure 5.4(a)
Grades 1 and 2 combined vs. all above
Logit coefficients 0.000 -0.709 -1.043 -2.229
Case III Figure 5.4(b)
Grades 1, 2, and 3 combined vs. all above
Logit coefficients 0.000 -0.036 -0.358 -1.724
-2.5
-2-1
.5-1
-.5
0lo
git(
cate
gori
es 1
and
2 c
ombi
ned
Vs
all a
bove
)
20 40 60 80Age Midpoint (Years)
(a)
-2-1
.5-1
-.5
0lo
git(
cate
gori
es
1,2
and
3 co
mbi
ned
Vs
all a
bove
)
20 40 60 80Age Midpoint (Years)
(b)
Figure 5.4: Linearity of Response with age (Younis and Knight, 2008)

146
To find out the correct parametric form for the age predictor, a Fractional Polynomial
Analysis (FPA) is performed. The FPA results are shown in Table 5.3, and reveal that the
deviance statistic is minimum (i.e., 245.5) for model M1. That is, the model M1 is the best
fitting non-linear transformation which contains age and age3 terms. Model M1 is compared
with the linear model (also shown in Table 5.3). The likelihood ratio test statistic, 2G (i.e.,
deviance for linear model minus the deviance for model M1) = 1.197. The significance level,
p-value is 2Pr 3 1.197 0.754 for three degree of freedom. Since the p-value is greater
than 0.05, model M1 is not significantly different from the linear model. Similar analyses for
the three cumulative logits found that the assumption of linearity in logit for age is
reasonable.
Table 5.3: Fractional Polynomial Analysis
Model df Deviance G2 p-value Powers
Not in model 0 278.212 32.703 0
Linear 1 246.706 1.197 0.754 age
M1: Non-linear 4 245.509 age, age3
To verify the ordinality of response variable i.e., Internal Condition Grades (ICG) with
respect to the continuous predictor, age, a simple graphical technique proposed by Harrell
(2001) is used. It involves the plot of mean values of age within each ICG category against
the corresponding condition grades. Figure 5.5 shows how different ICG categories are
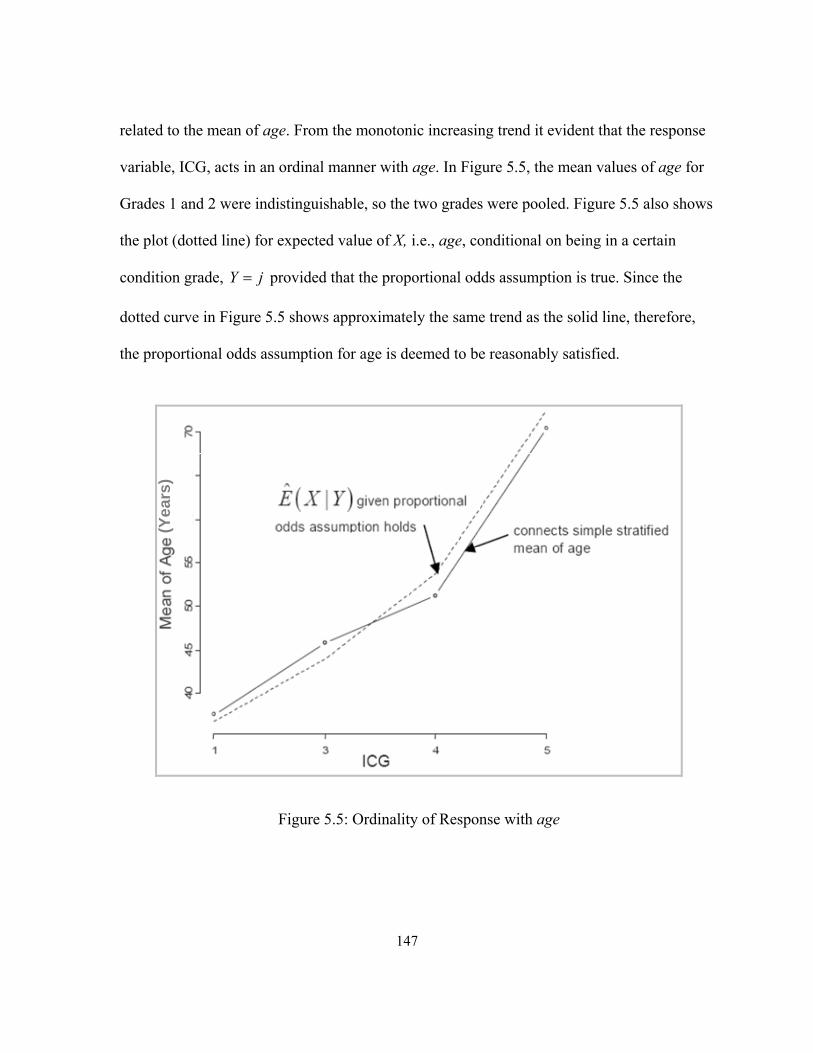
147
related to the mean of age. From the monotonic increasing trend it evident that the response
variable, ICG, acts in an ordinal manner with age. In Figure 5.5, the mean values of age for
Grades 1 and 2 were indistinguishable, so the two grades were pooled. Figure 5.5 also shows
the plot (dotted line) for expected value of X, i.e., age, conditional on being in a certain
condition grade, Y j provided that the proportional odds assumption is true. Since the
dotted curve in Figure 5.5 shows approximately the same trend as the solid line, therefore,
the proportional odds assumption for age is deemed to be reasonably satisfied.
(Ye
ars
)
Figure 5.5: Ordinality of Response with age

148
5.5.3 Parameter Estimates
Once the linearity and ordinality assumptions are verified a series of ordinal models are fitted
to systematically include, and analyze the material and age variables, and their interaction
agematerial. The results are presented in Table 5.4, where Model 1 contains the pipe
material predictor only; Model 2 contains pipe age and material; and Model 3 contains the
predictors, pipe age and material along with the term agematerial representing the
interaction between the two predictors. The estimates for 1J cutpoints, j , are shown for
Model 3 only. The change in deviance (or likelihood ratio test) statistic, 2G , along with
corresponding p-value is also provided in Table 5.4 to compare the models.
The estimate for material predictor changed from -1.853 in Model 1 to -1.064 in Model 2, a
change of 74.2%. This large change in parameter estimate for pipe material when age is
added to the model suggests a strong association of age with the probabilities of being in
various internal condition grades. The mean age for VC and RC pipes in the sample is 67 and
37 years, respectively. This difference in mean age for the two pipe materials also
contributed to the change in parameter values for the material predictor in Models 1 and 2.
When Model 2 is compared with Model 1, the likelihood ratio test statistic, 2G , is 25.31 with
p-value < 0.0001. Since p-value is less than 0.05, the change in deviance is significant, and
therefore, Model 2 is better than Model 1.
To determine the effect of age on the response variable (i.e., probabilities of being in certain
condition grades) for the two pipe materials, Model 3 contains the interaction term

149
agematerial in addition to age and material predictors. In Model 3, it is interesting to note
that the coefficient of age, 2ˆ , becomes non-significant as p = 0.223 is greater than the
generally accepted statistical significance level of 0.05. Using Equation 5.2, Model 3 can be
estimated as:
1 2 3ˆ ˆ ˆ ˆˆ ˆ ˆlogit | material,age,μ,β material age material agejP Y j (5.7)
A dummy/indicator variable that equals 0 in case of Vitrified Clay (VC) and 1 for Reinforced
Concrete (RC) is used for the material predictor. Therefore, for VC pipes, the right hand side
of Equation 5.7 reduces to: 2ˆˆ agej . The coefficient for age, 2
ˆ 0.008 for VC pipes,
which is not significant as discussed above. Thus, age is not related to the response for VC
pipes. For RC pipes, the right hand side of Equation 5.7 becomes: 1 2 3ˆ ˆ ˆˆ age.j
The parameter estimate for age for RC pipes is: 2 3ˆ ˆ .008 .046 .055. The
significance of 2 3ˆ ˆ( ) is tested using method of contrasts (Hosmer, 1999) which results in
Wald statistic, z = 6.50 with p-value < 0.0001, which is significant. Therefore, age is related
to the response for RC pipes. When Model 3 is compared with Model 2, the likelihood ratio
test statistic, 2G = 18.26 with p-value < 0.0001. Since the p-value is less than 0.05, Model 3
is determined to be statistically better than Model 2.
The model applied to the City of Niagara Falls data is a proportional odds model, i.e., it is a
fully constrained model and assumes the same effects, β , for each logit. The assumption of
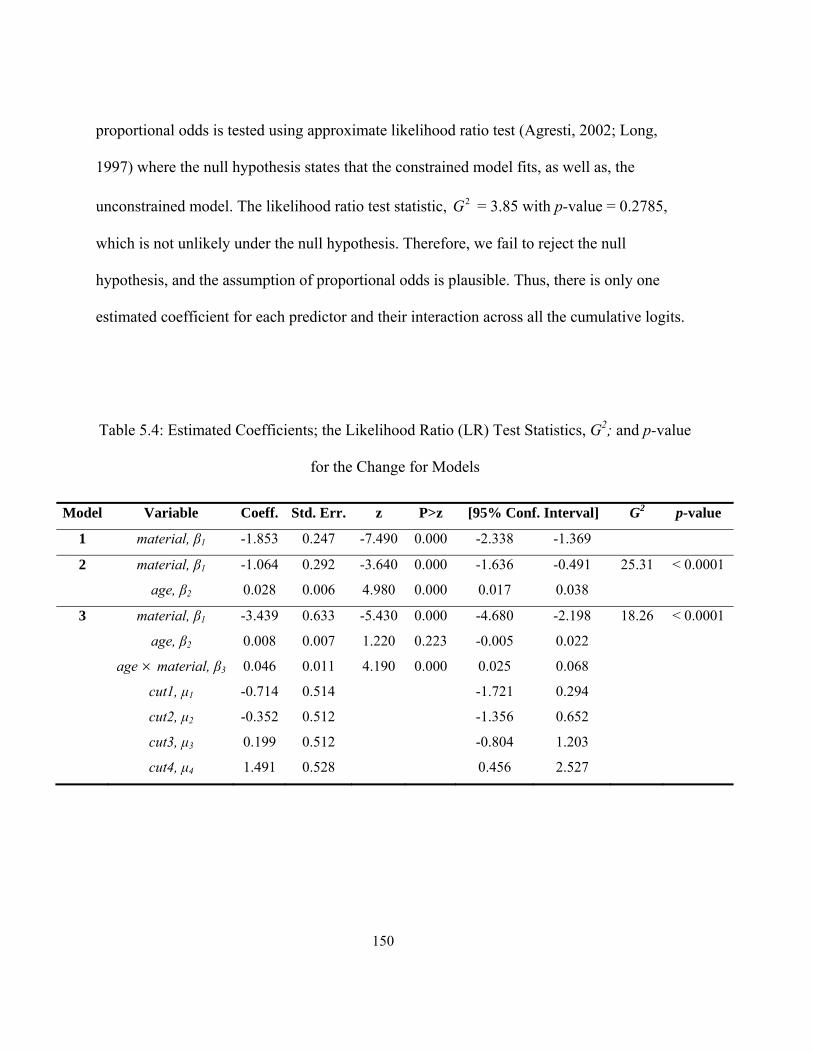
150
proportional odds is tested using approximate likelihood ratio test (Agresti, 2002; Long,
1997) where the null hypothesis states that the constrained model fits, as well as, the
unconstrained model. The likelihood ratio test statistic, 2G = 3.85 with p-value = 0.2785,
which is not unlikely under the null hypothesis. Therefore, we fail to reject the null
hypothesis, and the assumption of proportional odds is plausible. Thus, there is only one
estimated coefficient for each predictor and their interaction across all the cumulative logits.
Table 5.4: Estimated Coefficients; the Likelihood Ratio (LR) Test Statistics, G2; and p-value
for the Change for Models
Model Variable Coeff. Std. Err. z P>z [95% Conf. Interval] G2 p-value
1 material, β1 -1.853 0.247 -7.490 0.000 -2.338 -1.369
2 material, β1 -1.064 0.292 -3.640 0.000 -1.636 -0.491 25.31 < 0.0001
age, β2 0.028 0.006 4.980 0.000 0.017 0.038
3 material, β1 -3.439 0.633 -5.430 0.000 -4.680 -2.198 18.26 < 0.0001
age, β2 0.008 0.007 1.220 0.223 -0.005 0.022
age material, β3 0.046 0.011 4.190 0.000 0.025 0.068
cut1, μ1 -0.714 0.514 -1.721 0.294
cut2, μ2 -0.352 0.512 -1.356 0.652
cut3, μ3 0.199 0.512 -0.804 1.203
cut4, μ4 1.491 0.528 0.456 2.527

151
5.5.4 Model Validation
The validation, that is, the degree to which predicted outcomes match with the observed
outcomes, or how well the model describes the data (Hosmer, 2001) is carried out as
explained below:
The first test, likelihood-ratio chi-square (LR chi-square) compares the hypothesized model
to the null or intercept only model (Long, 1997; O’Connel 2006). LR chi-square statistic
provides an overall test of the null hypothesis that all the β coefficients for all the variables in
the model are 0. For the proposed model, the LR 23 110.390 ( -value 0.0001)p . This is
significant as p-value is less than 0.05. Therefore, the model with the predictors performs
better than the intercept only model.
Secondly, the expected frequencies from the hypothesized model are compared with the
observed frequencies to check the model performance. For this purpose, two measures,
Pearson and Deviance goodness-of-fit, are computed, and results are shown in Table 5.5. The
observed significance of both the measures is large (i.e., > 0.05), and therefore, it appears
that the proposed model fits the data well.
Table 5.5: Goodness-of-fit Statistics
Chi-Square df Sig.
Pearson 35.792 41 .701
Deviance 43.752 41 .355
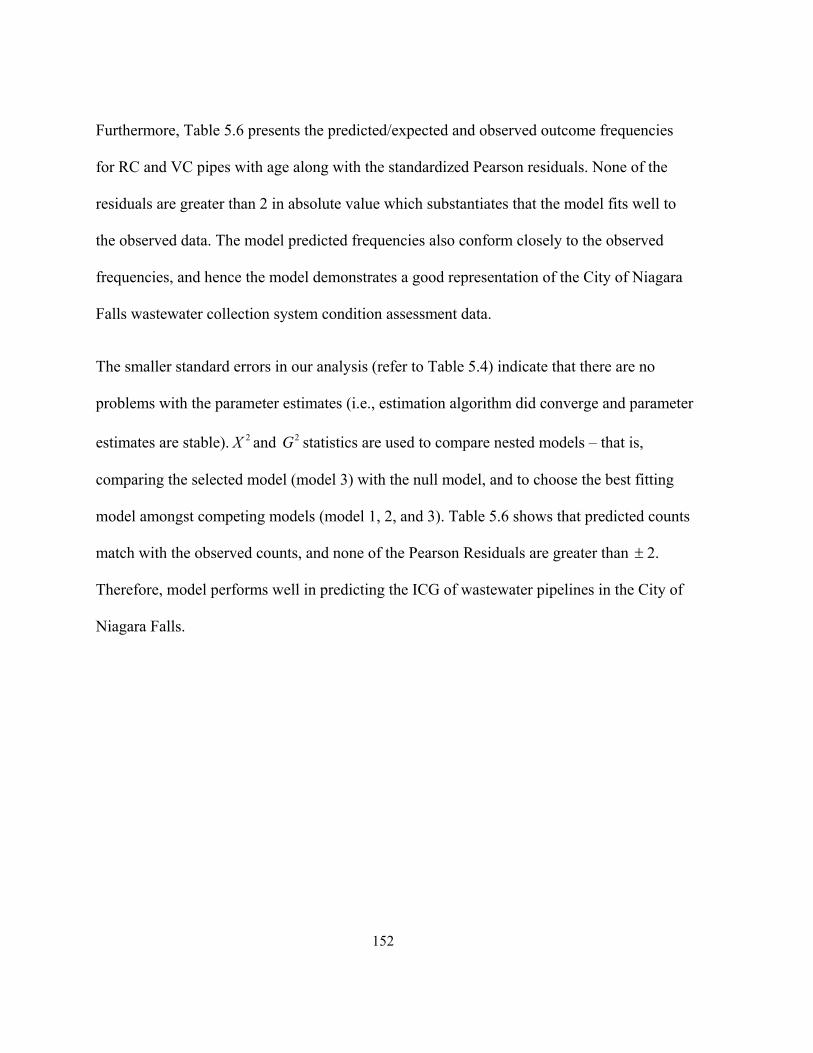
152
Furthermore, Table 5.6 presents the predicted/expected and observed outcome frequencies
for RC and VC pipes with age along with the standardized Pearson residuals. None of the
residuals are greater than 2 in absolute value which substantiates that the model fits well to
the observed data. The model predicted frequencies also conform closely to the observed
frequencies, and hence the model demonstrates a good representation of the City of Niagara
Falls wastewater collection system condition assessment data.
The smaller standard errors in our analysis (refer to Table 5.4) indicate that there are no
problems with the parameter estimates (i.e., estimation algorithm did converge and parameter
estimates are stable). 2X and 2G statistics are used to compare nested models – that is,
comparing the selected model (model 3) with the null model, and to choose the best fitting
model amongst competing models (model 1, 2, and 3). Table 5.6 shows that predicted counts
match with the observed counts, and none of the Pearson Residuals are greater than 2.
Therefore, model performs well in predicting the ICG of wastewater pipelines in the City of
Niagara Falls.

153
Table 5.6: Model Performance – Observed and Predicted Counts
Material Age Internal Condition Grade (ICG)
1 2 3 4 5
RC
0-20
Observed 7 0 0 0 0
Expected 6.071 .255 .269 .289 .117
Pearson Residual 1.035 -.514 -.529 -.549 -.344
20-40
Observed 131 13 13 18 3
Expected 133.231 11.000 12.584 14.796 6.389
Pearson Residual -.385 .622 .122 .870 -1.365
40-60
Observed 24 8 7 8 5
Expected 26.017 4.646 6.440 9.717 5.180
Pearson Residual -.559 1.631 .236 -.611 -.084
60-80
Observed 1 0 1 1 0
Expected .722 .216 .385 .900 .777
Pearson Residual .375 -.482 1.063 .125 -1.024
80-100
Observed 0 1 1 2 3
Expected .713 .267 .560 2.000 3.460
Pearson Residual -.891 1.447 .613 .000 -.348
>100
Observed 0 0 0 0 2
Expected .073 .030 .069 .339 1.488
Pearson Residual -.276 -.175 -.268 -.639 .830
VC
0-20
Observed 1 0 0 0 1
Expected .585 .160 .269 .563 .423
Pearson Residual .646 -.417 -.558 -.886 .999
20-40
Observed 4 1 1 3 5
Expected 3.753 1.071 1.850 4.075 3.251
Pearson Residual .149 -.071 -.671 -.632 1.107
40-60
Observed 8 0 6 8 7
Expected 6.980 2.088 3.717 8.704 7.510
Pearson Residual .443 -1.500 1.268 -.285 -.216
60-80
Observed 3 0 1 1 1
Expected 1.205 .385 .717 1.856 1.836
Pearson Residual 1.830 -.642 .356 -.756 -.741
80-100
Observed 4 0 0 9 5
Expected 3.522 1.136 2.127 5.582 5.633
Pearson Residual .284 -1.101 -1.553 1.742 -.322
>100
Observed 6 0 1 3 10
Expected 3.342 1.129 2.187 6.227 7.115
Pearson Residual 1.593 -1.094 -.850 -1.558 1.347

154
5.5.5 Model Interpretation
The problem is formulated as to determine the probability of wastewater pipelines being in a
specific category of Internal Condition Grades (ICGs) given covariates and their possible
interactions. To accomplish this objective, the interpretation is carried out in terms of
probabilities of outcomes given as:
1ˆ ˆˆ ˆ ˆ| x x xj j j jP Y j F F (5.8)
Specifically, the interest is to compare the predicted probabilities of being in ICGs of 1 to 5
for Vitrified Clay (VC) and Reinforced Concrete (RC) wastewater pipelines and to determine
if it changes with age. The significant interaction term, materialage suggests that the effect
of age varies by the type of pipe material.
For RC pipes, age is related to the degradation. Figure 5.6 shows the predicted probabilities
of being into one of the five ICGs with age. The probabilities of the lowest and highest
response categories (i.e., ICG = 1 and ICG = 5) are monotonic functions of age, whereas, the
probabilities of the intermediate categories (i.e., ICG = 2, 3, and 4) are unimodal or single-
peaked functions. Thus, the effect of age on the probability of being in grade 1 is negative
i.e., the probability of a pipeline being in acceptable condition decreases with the age of pipe.
On the other hand, the effect of age on the probability of being in grade 5 is positive, i.e., the
probability of a pipeline being in grade 5 increases with age. The predicted probabilities of
being in intermediate grades first increase with age, and then decrease after certain age
thresholds. For example, for RC pipes, the probability of being in ICG = 3 first increases
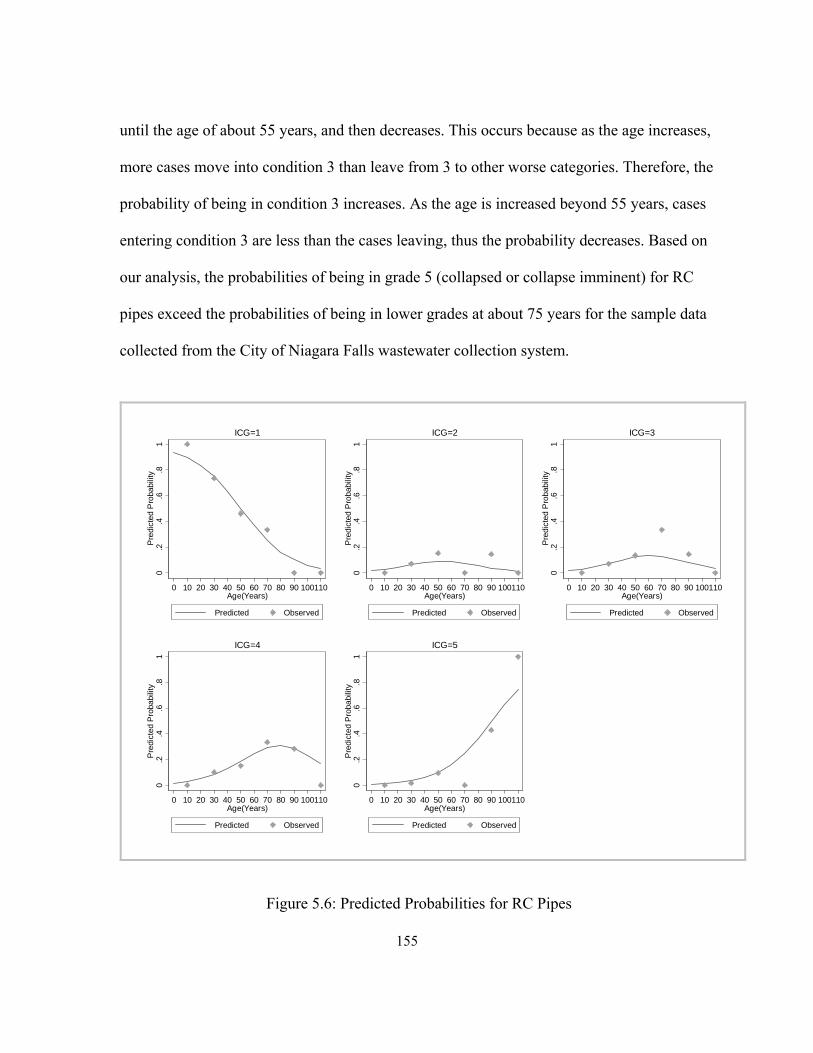
155
until the age of about 55 years, and then decreases. This occurs because as the age increases,
more cases move into condition 3 than leave from 3 to other worse categories. Therefore, the
probability of being in condition 3 increases. As the age is increased beyond 55 years, cases
entering condition 3 are less than the cases leaving, thus the probability decreases. Based on
our analysis, the probabilities of being in grade 5 (collapsed or collapse imminent) for RC
pipes exceed the probabilities of being in lower grades at about 75 years for the sample data
collected from the City of Niagara Falls wastewater collection system.
0.2
.4.6
.81
Pre
dict
ed P
roba
bilit
y
0 10 20 30 40 50 60 70 80 90 100110Age(Years)
Predicted Observed
ICG=1
0.2
.4.6
.81
Pre
dict
ed P
roba
bilit
y
0 10 20 30 40 50 60 70 80 90 100110Age(Years)
Predicted Observed
ICG=2
0.2
.4.6
.81
Pre
dict
ed P
roba
bilit
y
0 10 20 30 40 50 60 70 80 90 100110Age(Years)
Predicted Observed
ICG=3
0.2
.4.6
.81
Pre
dict
ed P
roba
bilit
y
0 10 20 30 40 50 60 70 80 90 100110Age(Years)
Predicted Observed
ICG=4
0.2
.4.6
.81
Pre
dict
ed P
roba
bilit
y
0 10 20 30 40 50 60 70 80 90 100110Age(Years)
Predicted Observed
ICG=5
Figure 5.6: Predicted Probabilities for RC Pipes
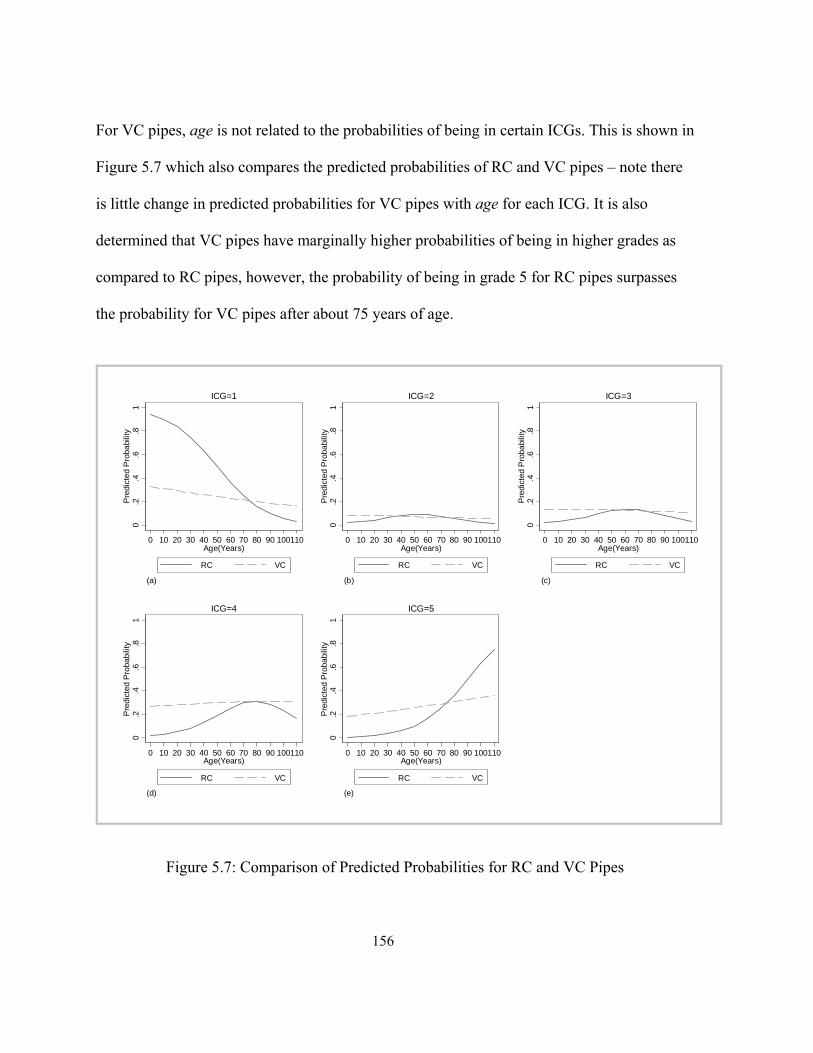
156
For VC pipes, age is not related to the probabilities of being in certain ICGs. This is shown in
Figure 5.7 which also compares the predicted probabilities of RC and VC pipes – note there
is little change in predicted probabilities for VC pipes with age for each ICG. It is also
determined that VC pipes have marginally higher probabilities of being in higher grades as
compared to RC pipes, however, the probability of being in grade 5 for RC pipes surpasses
the probability for VC pipes after about 75 years of age.
0.2
.4.6
.81
Pre
dict
ed P
roba
bilit
y
0 10 20 30 40 50 60 70 80 90 100110Age(Years)
RC VC
(a)
ICG=1
0.2
.4.6
.81
Pre
dict
ed P
roba
bilit
y
0 10 20 30 40 50 60 70 80 90 100110Age(Years)
RC VC
(b)
ICG=2
0.2
.4.6
.81
Pre
dict
ed P
roba
bilit
y
0 10 20 30 40 50 60 70 80 90 100110Age(Years)
RC VC
(c)
ICG=3
0.2
.4.6
.81
Pre
dict
ed P
roba
bilit
y
0 10 20 30 40 50 60 70 80 90 100110Age(Years)
RC VC
(d)
ICG=4
0.2
.4.6
.81
Pre
dict
ed P
roba
bilit
y
0 10 20 30 40 50 60 70 80 90 100110Age(Years)
RC VC
(e)
ICG=5
Figure 5.7: Comparison of Predicted Probabilities for RC and VC Pipes

157
The probabilities of being in worse condition grades are marginally higher for VC pipes as
compared to RC pipes. This finding is not attributable to the older age of VC pipes. The
relatively higher probabilities of being in worse condition grades for VC pipes as compared
to RC pipes may be due to: (1) poor installation practices; (2) excessive loading during their
lifespan; and/or (3) soil loss due to infiltration/ex-filtration through open joints and defective
connections. The majority of the inspected VC pipes in the system were found to have open
and displaced joints which might be due to poor installation practices. Laterals connections
were also found to be defective which could result in cracks, fractures, and holes in the VC
pipes.
5.6 Conclusions
Better deterioration models are needed to understand the performance of wastewater
pipelines and to make future predictions about their condition. A new cumulative logit
deterioration model for wastewater pipelines is developed and applied to the City of Niagara
Falls wastewater collection system. The model provides valuable information in terms of
predicted probabilities of being into one of the five Internal Condition Grades (ICGs) for
wastewater pipelines. It is emphasized that the conclusions presented in this paper are based
on our analysis of a sample of condition assessment data from the City of Niagara Falls
wastewater collection system. The data was captured using Side Scanner Evaluation
Technology (SSET) and defect coded using the 3rd edition of WRc’s Manual of Sewer
Condition Classification by NAAPI certified operators and analysts. The pipelines’ condition
is assessed using defect scores from the 4th edition of WRc’s Sewerage Rehabilitation
158
Manual using a custom built non-proprietary software application, WatBAMS, developed by
the authors.
The deterioration in RC pipes was found to be age related. Since RC pipes are prone to
corrosion due to hydrogen sulfide and moisture in addition to other reactive agents in
domestic sewage, material loss and deterioration will occur over time. Thus, the finding that
the probability of being in certain ICG is age related for RC pipes is deemed reasonable.
Based on our analysis, the service life for RC pipes is approximately 75 years for the City of
Niagara Falls wastewater pipelines data. VC pipes were found to last indefinitely provided
they are installed in good condition and are not subject to installation damage or excessive
loadings. This indefinite service life is greater than the current assumed life of 80 years.
The cumulative logit model was found to accurately predict both RC and VC pipelines
deterioration. This model can be used to determine the wastewater pipelines service life,
predict future condition states, and future rehabilitation and maintenance needs. The model
can also be used to develop realistic future maintenance and operation budgets over the life
of the asset and to satisfy regulatory reporting requirements. Further research is required to
validate the cumulative logit model in other networks and to model the deterioration of pipe
materials other than RC and VC.
159
Acknowledgments
The research presented in this paper is sponsored by the Canadian Water Network (CWN)
and Natural Sciences and Engineering Research Council of Canada (NSERC). The ongoing
research partners include the Centre for Advancement of Trenchless Technologies at the
University of Waterloo, the City of Niagara Falls, and Pipeflo Contracting Corp. Their
assistance is gratefully appreciated and acknowledged.

160
References
Agresti, A. (2002). Categorical data analysis (Second ed.). Canada: Wiley Interscience.
Baik, H.S. (2003). Development of an asset valuation model for wastewater infrastructure
assets. Ph.D. Thesis.
Baik, H.-S., H. S. Jeong, & D. M. Abraham (2006). Estimating transition probabilities in
Markov chain-based deterioration models for management of wastewater systems.
Journal of Water Resources Planning and Management, 132 (1), 15–24.
Bender, R. & U. Grouven (1998). Using binary logistic regression models for ordinal
data with non-proportional odds. Journal of clinical epidemiology, 51 (10), 809–816.
Boorah, V. K. (2001). Logit and Probit: Ordered and Multinomial Models. USA: Sage
Publications Inc.
Chae, M. J. A., T. Iseley, & D. M. Abraham (2003). Computerized sewer pipe condition
assessment. In Proceedings of the ASCE International Conference on Pipeline
Engineering and Construction, Jul. 13-16, 2003, Volume 1 of New Pipeline
Technologies, Security, and Safety, Baltimore, MD, USA. pp. 477–493.
Clogg, C. C. & E. S. Shihadeh (1994). Statistical Models for Ordinal Variables. USA:
Sage Publications, Inc.
Davies, J. P., Clarke, B. A., Whiter, J. T., & Cunningham, R. J. (2001). Factors influencing
the structural deterioration and collapse of rigid sewer pipes. Urban Water, 3, 73-89.
FHWA (1995). Recording and coding guide for the structure inventory and appraisal of the
nation’s bridges. Technical Report FHWA-PD-96-001, Federal Highway
Administration, U.S. Department of Transportation.
FHWA (2000). Primer: GASB 34. Technical report, FHWA Office of Asset Management.

161
Harrell, Jr., F. E. (2001). Regression Modeling Strategies with Applications to Linear
Models, Logistic Regression, and Survival Analysis. New York, USA: Springer.
Hosmer, David W. (1991). Applied Survival Analysis, Regression Modeling of Time to Event
Data. Wiley Publication.
Howard, R. J. (2001). Infrastructure asset management under Australian accounting
standard 27 (AAS27). Proceedings of the Institution of Civil Engineers: Municipal
Engineer, 145 (4), 305–310.
Knight, M., Younis, R., Darrall, B., Russin, M., & Manners, C. (2009). Advances in
pipeline asset management using digital side scanning evaluation technology.
Proceedings of the International No-Dig 2009, Toronto, ON Canada.
Long, J. S. (1997). Regression Models for Categorical and Limited Dependent Variables.
USA: SAGE Publications.
Madanat, S., S. Bulusu, & A. Mahmoud (1995). Estimation of infrastructure distress
initiation and progression models. Journal of Infrastructure Systems, 1 (3), 146–150.
Ministry of the Environment, Ontario (2007). Toward financially sustainable drinking-
water and wastewater systems. Financial Plans Guideline EBR Registry Number:
010-0490, Ministry of Environment, Ontario.
Mirza, S. (2007). Danger ahead: The coming collapse of Canada’s municipal infrastructure.
Technical Report FCM 1060E, Federation of Canadian Municipalities.
NAMS (2002). International Infrastructure Management Manual, Volume 2. Australia:
Institute of Public Works Engineering.
Nelder, J. A., & McCullah, P. (1989). Generalized linear models (Second ed.). USA:
Chapman & Hall/CRC.

162
NASSCO. (2006). NASSCO's pipeline assessment and certification program (PACP).
Retrieved July 13, 2006, from http://www.nassco.org/pdf/editorial.pdf
OMBI (2007). Implementation of accounting for tangible capital assets -reference manual.
Technical report, Sub-Committee of the Treasures Group OMBI.
PricewaterhouseCoopers. (2003). Analysis of asset management, accounting, finance and
pricing practices for municipal water and wastewater systems in Ontario. Ontario:
Ministry of Finance.
TD Economics. (2002). A choice between investing in Canada’s cities or disinvesting in
Canada’s future. Technical report, TD Bank Financial Group.
Thornhill, R. (2005, November/December). NASSCO's pipeline assessment and certification
program: A Swiss army knife for pipeline condition management applications.
Underground Infrastructure Management, 41-42.
Younis, R., & Knight, M. A. (2008). An empirical model for the prediction of structural
behaviour of wastewater collection systems. ASCE International Pipelines
Conference 2008, Atlanta, GA.
WRc. (1993). Manual of sewer condition classification (Third ed.). UK: Water Research
Centre.
WRc. (2001). Sewerage rehabilitation manual (Fourth ed.). Swindon, UK: Water Research Centre.

163
Chapter 6
Continuation-ratio Model for the Performance Behavior of
Wastewater Collection Networks
This paper has been submitted to the Tunneling and Underground Space Technology journal.

164
6.1 Abstract
Canada’s aged wastewater infrastructure is rapidly failing. New financial and environmental
regulatory requirements demand the municipalities to estimate operating and capital
expenditures for running the systems into the future, and come up with plans for financial
sustainability keeping in view the public health and environmental protection. Wastewater
pipelines’ deterioration is not well understood, and realistic deterioration models need to be
developed for effective and efficient maintenance management of wastewater collection
systems.
This paper presents a new ordinal regression model for the deterioration of wastewater
pipelines based on continuation ratio logits. The model is presented using the generalized
linear model formulation, and takes into account the ordinal nature of dependent variable and
interaction effects between explanatory variables. The model provides estimates of
conditional probabilities for a pipeline to advance beyond a particular internal condition
grade – to worse condition – depending on pipe material and age. The model development
and validation procedure is demonstrated using high quality condition assessment data for
Reinforced Concrete (RC) and Vitrified Clay (VC) pipes from the City of Niagara Falls
wastewater collection system.
The new model was found to represent the RC and VC pipes degradation behavior for in
service pipes up to 110 years of age for the City of Niagara Falls wastewater collection
system. RC pipes deterioration was found to be age dependent while VC pipes deterioration
was not age dependent. This finding is contrary to other deterioration model studies that
165
indicate that type of pipe material is not significant and that the deterioration of VC pipes is
also age dependent. The present analysis shows, for example, that the predicted conditional
probability for RC pipes to advance beyond internal condition grade 3 is estimated to be 60%
at 40 years of age, and it increases to 90% at 80 years. Similarly, there is a 60% chance of
advancing beyond grade 4 to collapsed/collapse imminent condition at 80 years of age for
RC pipes. VC pipes were found to have an indefinite service life if installed without
structural damage. However, VC pipes exhibited relatively higher conditional probabilities of
advancing to worse internal condition grades as compared to RC pipes up to 60 years of age.
This is attributable to poor installation practices that resulted into pipe defects such as
open/displaced joints and defective connections.
The findings from the presented continuation ratio model can be used for risk-based policy
development for maintenance management of wastewater collection systems. The proposed
model can help in devising appropriate intervention plans and optimum network maintenance
management strategies based on pipelines’ age, material type, and internal condition grades.
This is critical to develop realistic wastewater networks’ future maintenance and operation
budgets for the life of asset, and to meet new regulatory reporting requirements. Further
research is required to validate this model for other networks, and modeling deterioration of
pipe materials other than RC and VC.
Keywords: Wastewater pipelines; Deterioration modeling; Continuation ratio model;
Ordinal regression; Asset management; Sewer systems.

166
6.2 Introduction
A large percentage of Canada’s buried municipal water and wastewater piping networks have
exceeded or are approaching its design life of 50 to 75 years. Therefore, this aging and
deteriorating infrastructure needs to be renewed or replaced. Estimates of Canada’s
municipal infrastructure deficit vary from a $44 billion total municipal infrastructure shortfall
(TD Economics, 2002) to over $125 billion (Mirza, 2007). The municipal infrastructure
deficit is an estimate of the total additional investment needed to repair and prevent
deterioration in existing, municipally owned infrastructure assets. Mirza (2007) reports that
the infrastructure funding gap for existing water and wastewater is $31 billion, and to meet
new needs an additional $56.6 billion is required. The size and scope of the infrastructure
problems facing municipalities and local governments is enormous as the decay of Canada’s
infrastructure creates severe domino effects – higher cost of maintenance, operation,
rehabilitation, and repair; inefficiency and increased vulnerability; and increased threats to
public safety and the environment. Mirza (2007) states that “without maintenance or with
deferred maintenance, the municipal infrastructure deficit could be close to $2 trillion by
2065, and that with regular maintenance and good scientific management, the escalating
infrastructure deterioration and the resulting infrastructure deficit can be controlled within
manageable levels.”
In 2006, the Canadian Institute of Chartered Accountants Public Sector Accounting Board
(PSAB) issued statement PS3150 which requires all Canadian municipalities and utilities,
starting in January 2009, to report their tangible capital assets along with their depreciation

167
on financial statements (OMBI, 2007). One of the PSAB requirements is the estimation of
operating and capital expenditures for running the systems into the future. In the United
States, the Governmental Accounting Standards Board (GASB) Statement 34, and in
Australia, the Australian Accounting Research Foundation Standard 27 specify similar
accounting practices (see FHWA, 2000; Howard, 2001). To meet these specified accounting
practices, knowledge on how the assets behave and deteriorate over time is imperative.
Current Canadian government guidelines suggest the useful life for various civil
infrastructure assets. For example, for wastewater pipelines, the estimates of useful service
life may range from 40 to 75 years with limited or no asset deterioration knowledge
according to Ministry of the Environment, Ontario (2007) and NAMS (2002). The absence of
asset deterioration knowledge necessitates Canadian municipalities to make unsubstantiated
assumptions about the timing and volume of capital expenditures so that they can comply
with PSAB and other government and regulatory requirements. These unsubstantiated
assumptions will most likely result in an under or over-estimation of assets future operational
and capital needs. To develop realistic future life-cycle asset operation and maintenance
financial needs it is imperative that asset deterioration behavior is understood and realistic
deterioration models are developed and used for future predictions.
This paper provides an overview of wastewater condition assessment methodology and
protocols. It also discusses ordinal regression models and their applications in civil
engineering. An ordinal regression model, based on continuation ratios is developed and
described along with its assumptions and estimation procedure for predicting wastewater
168
infrastructure deterioration. The new deterioration model is demonstrated using the City of
Niagara Falls wastewater collection system pipeline condition assessment data. The
procedures for verification of assumptions, determination of parameter estimates, validation,
and model interpretation are presented. The paper concludes with a discussion on the results,
and deterioration model limitations.
6.3 Literature Review
A review of current industry practices with respect to wastewater pipelines condition
assessment and deterioration modeling is provided in the following sections.
6.3.1 Condition Assessment of Wastewater Pipelines
Remotely controlled Closed Circuit Television (CCTV) and more recently Side Scanning
Evaluation Technology (SSET) cameras also known as Sewer Scanner and Evaluation
Technology (SSETTM) are used for visual inspections of interior of wastewater pipelines.
Pipeline inspections are completed by an operator remotely moving the camera down the
pipeline and coding all observed defects using a defect condition coding system. In North
America, two wastewater pipeline defect condition Classification systems are predominately
used: (1) Manual of Sewer Condition Classification (MSCC) 3rd edition defect coding
system developed by Water Research Center (WRc) in the United Kingdom; and (2) Pipeline
Assessment and Certification Program (PACP) developed by National Association of Sewer
Service Companies (NASSCO) and WRc.
169
The Manual of Sewer Condition Classification, first published in 1980, became the national
standard in UK and many other parts of the world. In 1994 and 2004, the 3rd and 4th editions
of MSCC were published by WRc, respectively. In 1994, the North American Association of
Pipeline Inspectors (NAAPI) adopted WRc’s MSCC 3rd edition and developed a
Certification program for CCTV operators and reviewers. In 2002, NASSCO published
PACP to meet the needs of the United States. The Sewerage Rehabilitation Manual (SRM),
also published by WRc, describes a wastewater pipelines renovation decision making process
that is adopted in the United Kingdom and Canada. The first edition of the SRM was
published in 1986 and the current fourth edition was published in 2001. The SRM determines
the structural and operational performance of wastewater pipelines by assigning scores to
MSCC defects based on their type and severity. The structural defect scores are transformed
– based on pipeline’s peak defect score – to structural Internal Condition Grade (ICG) of 1 to
5, with 1 being the best or acceptable and 5 being the worst or near collapsed state. The
continued use of the SRM methodology, in United Kingdom and Canada since 1994,
validates the methodology as an acceptable and good approach for determining pipeline
current condition states. The general principles of the SRM also form the basis for the
European Standard EN752-5 – Drain and Sewer Systems Outside Buildings: Part 5
Rehabilitation. This further validates the SRM approach. NASSCO’s PACP manual contains
a pipeline condition rating scheme that varies from 1 to 5. The PACP condition rating
depends on average score (total defects score divided by the number of defects) rather than
peak score as used by the WRc. Unlike WRc’s SRM, the PACP manual has no detailed
decision making process. Presently, limited published data exists to validate the PACP defect
170
scores rating system in North America. According to Stantec (2009), usage of average scores
instead of peak scores for condition rating is a limiting issue of PACP methodology. PACP
methodology, therefore, may not be able to accurately prioritize rehabilitation needs of
wastewater collection systems (Stantec, 2009).
In 2004, the Ministry of Finance in Ontario, Canada, completed a survey to investigate
municipal water and wastewater systems asset management practices. This survey found that
among the responding Ontario municipalities, 17% do not perform inspections for condition
assessment, and of those who do perform inspections, 33% do not record the results of the
inspections (PricewaterhouseCoopers, 2003). The survey also found that large municipalities
(more than 50,000 populations) typically have better asset management practices and that
asset management approaches range from “don’t fix it if it is not broken” strategies to the use
of computationally intensive and sophisticated software tools. This survey demonstrates the
current state-of-art in asset management by municipalities in Canada and most likely in
North America.
6.3.2 Wastewater Pipelines Deterioration Models
State-of-the-art techniques for deterioration modeling of wastewater pipelines include: (1)
expert judgment, (2) expected value methodology, (3) binary logistic regression, (4) ordinal
probit regression, and (4) Markov chains. Kathula et al. (1999) proposed a Sanitary Sewer
Management System (SSMS) based on experts’ opinion. Wirahadikusumah et al. (1999)
developed a Markov chains model for deterioration of wastewater pipelines. The transition
probabilities matrix for Markov chains model was developed on the basis of discussions with

171
asset managers. Baik et al. (2004); Wirahadikusumah et al. (1999); Wirahadikusumah et al.
(2001); and Wirahadikusumah (2003) used the expected value approach to compute
transition probabilities for deterioration models based on Markov chains. Their approach
involved categorization of pipelines based on material, soil type etc. Then, regression curves
were developed for each category by regressing between pipelines condition and age. Davies
et al. (2001) and Ariaratnam et al. (2001) used binary logistic regression for modeling
wastewater pipelines’ deterioration. The response variable i.e., wastewater pipelines’ internal
condition grades were modeled as a binary/dichotomous variable that could take values either
1 or 0, corresponding to good/non-deficient or failed/deficient states, respectively. Baik
(2003); Baik et al. (2006); and Jeong et al. (2005) used ordered probit regression using latent
variable formulation to develop deterioration curves for wastewater pipelines. The estimated
probabilities from the ordered probit model were described as transition probabilities of
Markov chains to model the deterioration of wastewater pipelines as a stochastic process.
Micevski et al. (2002) employed Bayesian multinomial analysis to compute transition
probabilities of Markov chains model for storm water pipelines.
Summary of Key Findings
Expert probability estimates, while commonly used in decision analysis when data is not
available or knowledge is vague, can be highly inaccurate. Meyer and Booker (1991)
discussed issues such as bias and calibration of expert judgment, and acknowledged that
humans are not good estimators of probability values and predictions. Asking experts to

172
assign probability values to predict the likelihood of the occurrence some event, or to
comment on the condition of an asset without inspection is too much to ask.
Ariaratnam et al. (2001); Baik et al. (2006); and Davies et al. (2001) concluded that the type
of pipe material was not a significant factor in deterioration. Davies et al. (2001) further
concluded that concrete and vitrified clay pipes exhibited identical risk of failure, and age
was not a significant variable. Ariaratnam et al. (2001), however, found that age had
significant effect on deterioration. The model proposed by Baik et al. (2006) was overly
complex in terms of number of parameters to be estimated/interpreted, and therefore, some of
their conclusions were uncertain. The expected value methodology employed by Baik et al.
(2004); Wirahadikusumah et al. (1999); Wirahadikusumah et al. (2001); and
Wirahadikusumah (2003) tend to violate model assumptions as it did not take into account
the discrete and rank-ordered nature of condition assessment data. Micevski et al. (2002)
concluded that pipe material and age affect deterioration. All the above cited studies ignored
the interaction effect between pipe age and material.
Majority of the data used in the above cited studies were obtained from third party sources
with limited information on data collection, and coding consistency and uniformity.
Furthermore, some datasets were reported to have quality assurance and quality control
problems, and missing information such as asset age. The development of deterioration
models using poor quality datasets is challenging due to difficulties in rationalizing the
findings, and possible inconsistencies between model predictions and observed field
behavior.

173
Deterioration of wastewater pipelines is assessed in discrete and ordinal (i.e., non-
continuous) measures – in terms of structural Internal Condition Grades (ICGs) or Structural
Performance Grades (SPGs). The statistical techniques that take into account the ordinal
information are discussed in the following section.
6.3.3 Ordinal Regression Models for Wastewater Pipelines Deterioration
Ordinal variables are a type of categorical variables that have natural ordering of categories,
however, the distances between the categories is not known (Agresti, 2002). Ordinal
regression models are extensively used in social and life sciences, epidemiology, and
biomedical research for analyzing data where response variable is rank-ordered or ordinal.
These models are extensions of binary logit and probit models to polytomous response cases.
The difference between logit and probit models is in the distribution of error terms. In case of
probit models, the errors are normally distributed, whereas in case of logit models, the errors
are logistically distributed. The choice between logit and probit link functions is arbitrary and
depends on how well the models fit the data (Johnson and Albert, 1999) and preference in
interpretation (O'Connell, 2006). According to Liao (1994) logit models are more suitable for
data distributions with heavier tails.
Clogg and Shihadeh (1994) discusses a variety of ways of forming “response functions” for
ordinal data which result in the development of different models. The choice of response
functions, and hence the type of ordinal model, depends on the research problem. Agresti
(2002) and Nelder and McCullah (1989) provide extensive details on these models.

174
In the published civil engineering literature, ordinal regression models are generally referred
to as econometric models. To date, the application of ordinal regression models to solve civil
engineering problems is limited, although the data encountered is predominantly rank-
ordered. For example, FHWA (1995) specifies ten condition grades from 0 (failed condition)
to 9 (excellent condition) for condition ratings of bridge decks, and super and sub-structures.
Similarly, Pavement Condition Index (a value between 0 to 100 based on multiple pavement
distress indicators) is often discretized into 8 rank-ordered categories from 1 representing
failed to 8 representing excellent state (Madanat, Mishalani, and Wan Ibrahim, 1995). Baik,
Jeong, and Abraham (2006) reviewed the application of ordinal regression models for civil
infrastructure deterioration. Baik (2006) found that mostly ordered probit models are used
for modeling the deterioration of pavement and bridges. Ordered probit and logit models use
cumulative probabilities to compute the probabilities of an object being in certain internal
condition grade depending on covariates. Madanat et al. (1995) and Baik et al. (2006) used
ordered probit models based on latent variable formulation to model the deterioration of
bridges and wastewater pipelines, respectively. Younis and Knight (2008) developed a partial
proportional odds model based on cumulative logits for wastewater pipelines, and Younis
and Knight (2009) proposed an ordinal logit model based on generalized linear model
formulation.
6.4 Purpose/Problem Statement
This paper presents a new model based on conditional probabilities to compute the
probability that a pipe moves beyond a condition grade from its current condition.

175
Furthermore, it also investigates and quantifies the effects of pipe age and material on the
degradation behavior of reinforced concrete and vitrified clay wastewater pipelines.
6.5 Continuation Ratio Model
A Continuation Ratio (CR) model can be obtained from the generalized linear model.
Definition of continuation ratio, various types of continuation ratios, and CR model
formulation from the generalized linear model is described in the following paragraphs.
Continuation Ratio
The continuation ratio, ,j is a “conditional probability that an object moves beyond a stage
once a particular stage has been reached, or its complement, the probability that an object
does not move beyond a stage once a particular stage has been reached” (O'Connell, 2006).
In case of CR models, the response represents a progression of stages such that objects pass
through lower stages before they move to higher stages. Thus, for wastewater pipelines, the
response i.e., structural Internal Condition Grades (ICGs) of inspected pipes may be
considered to represent a direction or sequential mechanism through which pipelines move
from lower grades to higher – from good/acceptable condition to bad/collapsed condition.
Types of Continuation Ratios
Different types of continuation ratios – forward or backward – can be uniquely formed
depending on research objectives (Bender and Benner, 2000; O'Connell, 2006). For example,
if interest lies in estimating the probability of a pipeline to move to higher/worse internal
condition grades provided that it is already in at least that particular condition grade, a
176
forward continuation ratio can be used. However, backward continuation ratio must be used
if the objective is to estimate the conditional probability of being in a particular condition
grade amongst all objects which are already at or below that condition grade. The forward
continuation ratio, ,j x is represented as (O'Connell, 2006):
Pr | ,j x Y j Y j X x (6.1)
where Pr(.) is the conditional probability that response, ,Y is greater than a particular
condition grade , ,j depending on covariates , .X
Or, in terms of complement of Equation 6.1 (Agresti, 2002; O'Connell, 2006):
1 Pr | ,j x Y j Y j X x (6.2)
which gives the conditional probability of staying in condition .j
The backward continuation formulation is given as (Bender and Benner, 2000):
Pr( | )Pr | ,
Pr( | )j
Y j X xx Y j Y j X x
Y j X x
(6.3)
Continuation Ratio Model Formulation from Generalized Linear Model
The generalized linear model is defined as:
, 1, 2,..., 1j j jf x x j J (6.4)
177
where f is a link function (logit in the present paper); Pr |j x Y j X x , i.e., the
probability of a response Y being in certain condition grade j depending on
covariates ;X j are the cutpoints for condition grades ;j and j are the regression
coefficients for covariates .X
A Continuation Ratio (CR) model is obtained when the probability , ,j x in Equation 6.4 is
replaced with continuation ratio , j x (Agresti, 2002). That is a CR model is given as:
, 1,..., 1j j jf x x j J (6.5)
Different types of link functions , ,f such as logit, probit and complimentary log-log may be
employed to describe the relation between response and predictors. For example, in case of a
logit link, i.e., log 1j j jf x x x , Equation 6.5 becomes:
log1
jj j
j
xx
x
(6.6)
exp
1 exp
j j
j
j j
xx
x
(6.7)
exp
1 exp
j j
j
j j
xx
x
Similarly, when a complementary log-log link, log log 1j jf x x , is used,
the following continuation ratio model results from Equation 6.5:

178
log log 1 j j jx x (6.8)
1 exp expj j jx x (6.9)
The marginal probabilities of being in certain condition grade represented as , ,j x can be
determined using (O'Connell 2006):
11 1j j jx x x (6.10)
where Pr |j x Y j X x , j x is the continuation ratio given by Equation 6.1, and
j x is the cumulative probability given as Pr | .Y j X x
6.5.1 Estimation
Data Restructuring
To develop a Continuation Ratio Model (CRM), original dataset needs to be restructured
such that at each particular stage (i.e., Internal Condition Grades (ICG) in case of pipelines)
the objects that fail to make it to the stage are excluded. For a response variable with
J ordered categories, there will be a nested set of 1J dichotomies. A dummy variable for
each object indicates whether or not that object advanced to the next stage. Table 6.1 and
Figure 6.1 show separate nested binary models derived from polytomous response having
5J categories. M1, M2, M3, and M4 represent the continuation of pipelines from grade 1
through 5. For model M1, a dummy variable 1Y is included such that 1 0Y if the response,
ICG , is in 1,j and 1 1,Y if the response is in 1.j For model M2, all the observations
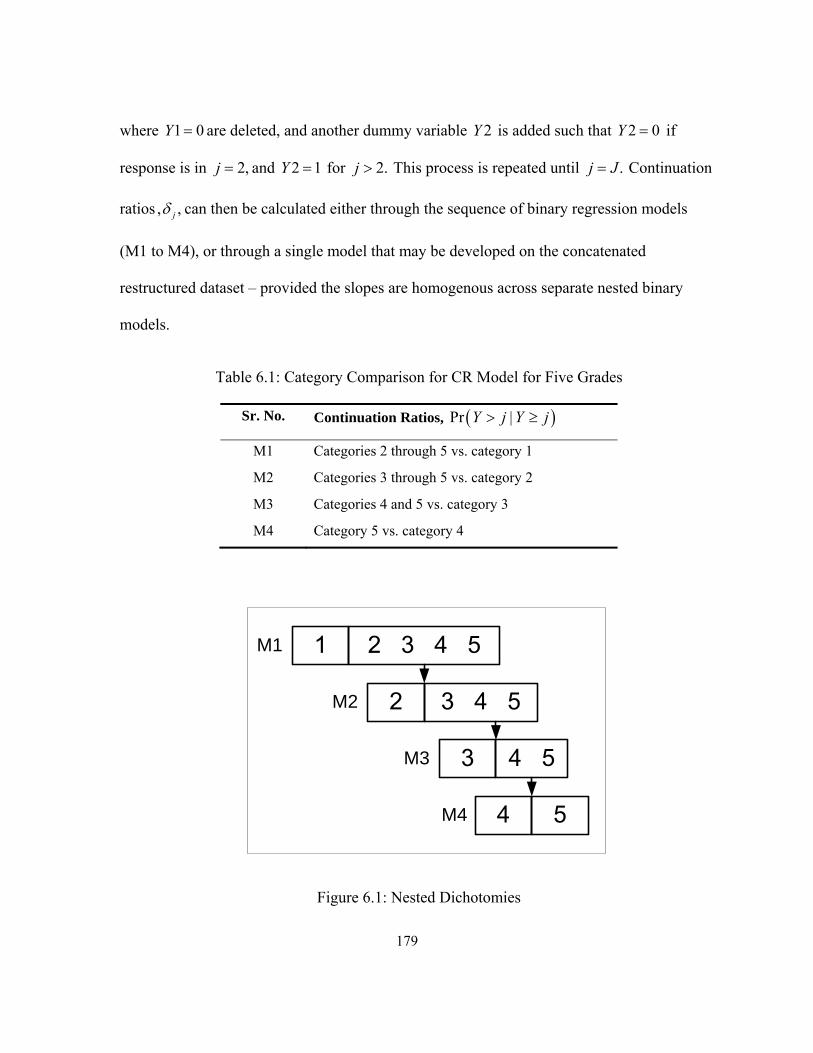
179
where 1 0Y are deleted, and another dummy variable 2Y is added such that 2 0Y if
response is in 2,j and 2 1Y for 2.j This process is repeated until .j J Continuation
ratios , ,j can then be calculated either through the sequence of binary regression models
(M1 to M4), or through a single model that may be developed on the concatenated
restructured dataset – provided the slopes are homogenous across separate nested binary
models.
Table 6.1: Category Comparison for CR Model for Five Grades
Sr. No. Continuation Ratios, Pr |Y j Y j
M1 Categories 2 through 5 vs. category 1
M2 Categories 3 through 5 vs. category 2
M3 Categories 4 and 5 vs. category 3
M4 Category 5 vs. category 4
M1
M4
M3
M2
Figure 6.1: Nested Dichotomies

180
6.5.2 Assumptions
This section presents two assumptions related to ordinal regression models. The
methodologies to verify these assumptions are discussed in the validation section.
1. According to Long (1997), the mere fact that a response variable can be written in an
ordered form is not a justification for using ordinal modeling techniques. To use ordinal
regression models, Long (1997) and Harrell (2001) suggest to check the ordinality of
response variable with respect to continuous predictors before starting an analysis. If this
assumption is violated, other models such as multinomial logit should be considered.
2. The simplest continuation ratio model – fully constrained CR model – assumes that the
slope coefficients, , are equal for all the computed conditional probabilities across
category cutpoints, j . That is, j for 1,2,..., 1.j J Thus, Equation 6.5
becomes:
, 1,..., 1j jf x x j J (6.11)
If the assumption of parallel slopes is not satisfied, extended CR model (Harrell, 2001)
should be employed.
6.5.3 Validation
Validation involves the verification of model assumptions, as well as, assessing the fit of the
continuation ratio model.
181
Assumptions Verification
Harrell (2001) discussed different strategies to check the Continuation Ratio (CR) model
assumptions. For example, to verify the ordinality of response variable i.e., Internal
Condition Grades (ICG), with respect to the continuous predictor, age, a simple graphical
technique may be employed. This requires development of a plot between response and
predictor’s stratified mean values. That is, the average age of pipes in each ICG is plotted
against the ICG. A monotonic relation confirms that the ordinality assumption holds well for
the predictor.
To check the assumption of parallel slopes, interaction terms between the category cutpoints
and predictors are included in the model. If the assumption of parallel slopes is true, the
inclusion of interaction terms between categories cutpoints and predictors will not improve
the fit of the model. A significant interaction effect, however, suggests that the effect of a
particular predictor is not homogenous across categories, and a more complex model –
extended CR – should be considered.
Assessment of Model Fit
Overall model fit can be assessed using the likelihood-ratio chi-square test which compares
the likelihoods of null (i.e., intercept only) and fitted/proposed models (Long, 1997). If
M and M represent proposed and null models, respectively, likelihood ratio chi-square
statistics represented as 2 ,G M is defined as (Long, 1997) :
182
2 2 ln 2lnG M L M L M
where L M and L M are likelihood values of proposed and null models, respectively. If
the null hypothesis is true (i.e., all are 0 in model M ), 2G M have chi-square
distribution with degrees of freedom equal to the number of parameters in the proposed
model.
To assess how well the proposed model reproduces observed data, estimated conditional
probabilities from the model are compared with the observed conditional probabilities.
6.6 Case Study
To test the proposed model, City of Niagara Falls wastewater pipeline condition assessment
data collected by the authors is used. The City of Niagara Falls data is unique as condition
surveys are carried out using Side Scanner and Evaluation Technology (SSET).
Demonstrated advantages of SSET over traditional CCTV pipeline inspection technologies
include the ability to: (1) complete defect rating after the survey is completed; (2) measure
pipeline defect changes over time; and (3) more accurately code pipeline defects. Chae et al.
(2003) and Knight et al. (2009) present a good discussion on the advantages of SSET over
traditional CCTV inspection surveys.
6.6.1 City of Niagara Falls Pipeline Condition Assessment Data
To ensure that a high quality SSET pipeline condition assessment database is developed for
the City of Niagara Falls wastewater network, the data collection and data analysis procedure

183
shown in Figure 6.2 is implemented. A contractor supplied North American Association of
Pipelines Inspectors (NAAPI) certified operator completed all SSET pipeline surveys, and
coded all pipeline defects in accordance with the Manual of Sewer Condition Classification
3rd edition (WRc, 1993). Using NAAPI certified City of Niagara Falls personnel, a second
Quality Assurance (QA) and Quality Control (QC) check is performed on all the contractor
provided data.
All of the City of Niagara Falls quality pipeline inspection data is transported to the
University of Waterloo to be stored on two geographically distributed data servers that are
backed up using RAID 5 technology to ensure data security, availability, and seamless
recovery. Using a University of Waterloo custom built software application, the City of
Niagara Falls QA/QC data is uploaded into a database management system named
WatBAMS (Waterloo – Buried Asset Management System). The software import utility
contains further QA/QC protocols to ensure that only high quality data is uploaded in the
WatBAMS database for each pipe segment survey. Using WatBAMS programmed routines,
each pipeline segment is analyzed in accordance with the Sewerage Rehabilitation Manual
4th edition methodology to determine the corresponding Internal Condition Grade (ICG).
WatBAMS also allows for the upload and integration with the City’s of Niagara Falls GIS
and inventory databases that contain each pipe segment’s attributes – asset ID, location,
construction date, depth, and material type.

184
Figure 6.2: Data Collection and Analysis Framework
The City of Niagara Falls wastewater collection network consists of approximately 400 kms
of pipelines that has approximately 5,500 pipe segments consisting of a variety of pipe
materials with ages that range from over 100 years to less than 20 years with an average age

185
of 47 years. Figure 6.3 shows that 35% of the network consists of Reinforced Concrete (RC),
17% PVC, 10% Vitrified Clay (VC), 10% Asbestos Cement (AC), and 25% of the network
has no assigned pipe material. The average age of the RC and VC pipes are 42 and 65 years,
respectively. Review of the SSET surveys and defect reports found that VC pipes have open
and displaced joints and service connections that were installed by creating a hole in the clay
pipe as shown in Figure 6.4 (a) and (b). Thus, there are holes and cracks where service
connections enter into the VC pipes. Figure 6.4 (c) shows an example of good workmanship
– a perfect connection for VC pipes. RC pipes were found to be generally in good condition
except for locations with some displaced joints and structural defects such as exposed rebars,
surface wear and spalling, corrosion, cracks, fractures, and broken segments. RC pipes were
found to have evidence of hydrogen sulphide and rebar corrosion. Figure 6.4 (d) shows an
example of RC pipe with exposed reinforcement due to predisposed corrosion.
Reinforced Concrete
35%
Unknown25%
PVC17%
Asbestos Concrete
10%
Vitrified Clay10%
Others3%
Figure 6.3: Distribution of Various Pipe Materials - City of Niagara Falls Sewer System

186
Figure 6.4(a): Open and Defective Joint – VC Pipe Figure 6.4(b): Defective Connection – VC Pipe
Figure 6.4(c): Perfect Connection – VC Pipe Figure 6.4(d): Exposed Reinforcement – RC Pipe
In the following sections, approximately 12% (45 km) of the City of Niagara Falls
wastewater collection network data (collected through stratified sampling) is used to
demonstrate the application of the proposed model. The model building process involves
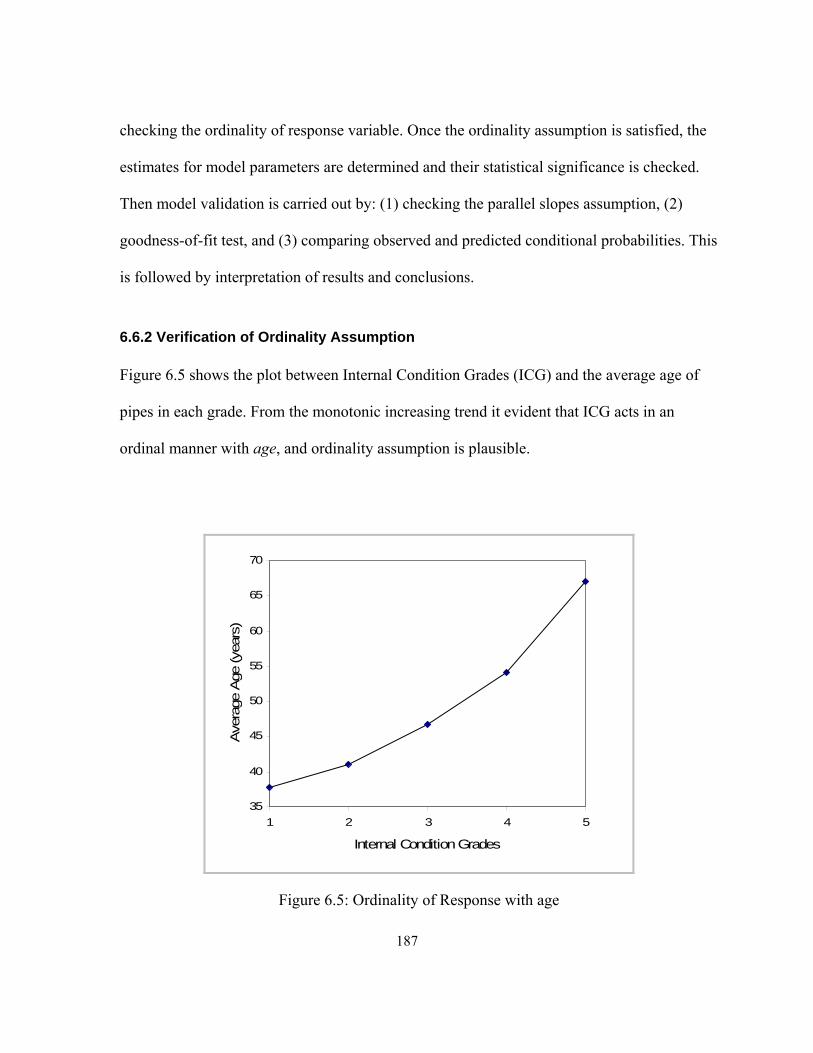
187
checking the ordinality of response variable. Once the ordinality assumption is satisfied, the
estimates for model parameters are determined and their statistical significance is checked.
Then model validation is carried out by: (1) checking the parallel slopes assumption, (2)
goodness-of-fit test, and (3) comparing observed and predicted conditional probabilities. This
is followed by interpretation of results and conclusions.
6.6.2 Verification of Ordinality Assumption
Figure 6.5 shows the plot between Internal Condition Grades (ICG) and the average age of
pipes in each grade. From the monotonic increasing trend it evident that ICG acts in an
ordinal manner with age, and ordinality assumption is plausible.
35
40
45
50
55
60
65
70
1 2 3 4 5
Internal Condition Grades
Ave
rage
Age
(ye
ars)
Figure 6.5: Ordinality of Response with age

188
6.6.3 Model Parameter Estimates
A series of continuation ratio models are evaluated to systematically include and analyze the
covariates material, age, and their interaction agematerial. The results are presented in
Table 6.2, where Model 1 contains the pipe material predictor only; Model 2 contains pipe
age and material; and Model 3 contains the pipe age and material along with the term
agematerial representing the interaction between the two predictors. The estimates for
1J cutoffs, j , are shown for Model 3 only. The change in deviance (or likelihood ratio
test) statistic, G, along with corresponding p-value is also provided in Table 6.2 to compare
the models.
The estimate for material predictor changed from -1.453 in Model 1 to -0.966 in Model 2, a
change of 50.4%. This large change in parameter estimate for pipe material when age is
added to the model suggests a strong association of age with the response. The average age
for VC and RC pipes in the sample is 67 and 37 years, respectively. This difference in
average age for the two pipe materials also contributed to the change in parameter values for
the material predictor in Models 1 and 2. When Model 2 is compared with Model 1, the
likelihood ratio test statistic, G, is 25.41 with p-value < 0.0001. Since p-value is less than
0.05, the change in deviance is significant, and therefore, Model 2 is considered better than
Model 1.
To determine the effect of age on the response variable for the two pipe materials, Model 3
contains the interaction term agematerial in addition to age and material predictors. In
Model 3, it is interesting to note that the coefficient of age, 2ˆ , becomes non-significant as p
189
= 0.248 is greater than the generally accepted statistical significance level of 0.05. Using
Equation 6.6, Model 3 can be developed as:
1 2 3ˆ ˆ ˆ ˆˆ ˆ ˆlogit | , material,age, ,β material age material agejP Y j Y j (6.12)
A dummy/indicator variable that equals 0 in case of Vitrified Clay (VC) and 1 for Reinforced
Concrete (RC) is used for the material predictor. Therefore, for VC pipes, the right hand side
of Equation 6.12 reduces to: 2ˆˆ agej . The coefficient for age, 2
ˆ 0.006 for VC pipes is
not significant since the p-value is greater than 0.05. Thus, age is not related to the response
for VC pipes. For RC pipes, the right hand side of Equation 6.12 becomes:
1 2 3ˆ ˆ ˆˆ .j age The parameter estimate for age for RC pipes is:
2 3ˆ ˆ .006 .035 .041. The significance of 2 3
ˆ ˆ( ) is tested using the method of
contrasts (Hosmer, 1999) which results in Wald statistic, z = 5.64 with p-value less than
0.0001, which is significant. Therefore, age is found to be related to the response for RC
pipes. When Model 3 is compared with Model 2, the likelihood ratio test statistic, G = 17
with p-value less than 0.0001. Since the p-value is less than 0.05, Model 3 is determined to
be statistically better than Model 2.
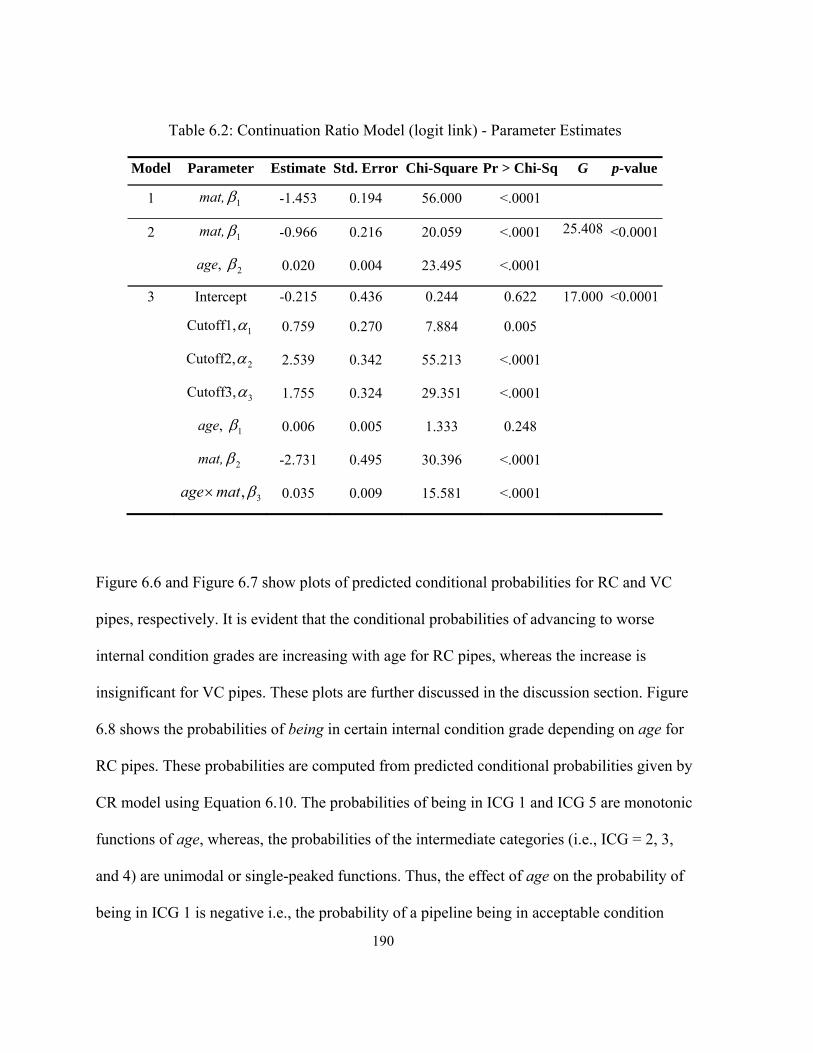
190
Table 6.2: Continuation Ratio Model (logit link) - Parameter Estimates
Model Parameter Estimate Std. Error Chi-Square Pr > Chi-Sq G p-value
1 mat, 1 -1.453 0.194 56.000 <.0001
2 mat, 1 -0.966 0.216 20.059 <.0001 25.408 <0.0001
age, 2 0.020 0.004 23.495 <.0001
3 Intercept -0.215 0.436 0.244 0.622 17.000 <0.0001
Cutoff1, 1 0.759 0.270 7.884 0.005
Cutoff2, 2 2.539 0.342 55.213 <.0001
Cutoff3, 3 1.755 0.324 29.351 <.0001
age, 1 0.006 0.005 1.333 0.248
mat, 2 -2.731 0.495 30.396 <.0001
3,age mat 0.035 0.009 15.581 <.0001
Figure 6.6 and Figure 6.7 show plots of predicted conditional probabilities for RC and VC
pipes, respectively. It is evident that the conditional probabilities of advancing to worse
internal condition grades are increasing with age for RC pipes, whereas the increase is
insignificant for VC pipes. These plots are further discussed in the discussion section. Figure
6.8 shows the probabilities of being in certain internal condition grade depending on age for
RC pipes. These probabilities are computed from predicted conditional probabilities given by
CR model using Equation 6.10. The probabilities of being in ICG 1 and ICG 5 are monotonic
functions of age, whereas, the probabilities of the intermediate categories (i.e., ICG = 2, 3,
and 4) are unimodal or single-peaked functions. Thus, the effect of age on the probability of
being in ICG 1 is negative i.e., the probability of a pipeline being in acceptable condition

191
decreases with age of pipe. On the other hand, the effect of age on probability of being in
ICG 5 is positive, i.e., probability of a pipeline being in ICG 5 increases with age. The
predicted probabilities of being in intermediate grades first increase with age, and then
decrease after certain age thresholds. For example, for RC pipes, the probability of being in
ICG 3 first increases until the age of about 55 years, and then decreases. This occurs because
as the age increases, more pipes move into ICG 3 than leave from ICG 3 to other worse
categories. Therefore, the probability of being in ICG 3 increases. As the age is increased
beyond 55 years, cases entering ICG 3 are less than the cases leaving, thus the probability
decreases. Based on our analysis, the probabilities of being in ICG 5 (collapsed or collapse
imminent) for RC pipes exceed the probabilities of being in lower grades at about 75 years
for the sample data collected from the City of Niagara Falls wastewater collection system.
0.000.100.200.300.400.50
0.600.700.800.901.00
0 20 40 60 80 100 120
Age (years)
Pre
dict
ed C
ondi
tiona
l Pro
babi
litie
s
Pr(Y>1|Y>=1)
Pr(Y>2|Y>=2)
Pr(Y>3|Y>=3)
Pr(Y>4|Y>=4)
Figure 6.6: Predicted Conditional Probabilities for RC Pipes

192
Figure 6.7: Predicted Conditional Probabilities for VC Pipes
0.00
0.10
0.20
0.30
0.40
0.50
0.60
0.70
0.80
0.90
1.00
0 20 40 60 80 100 120
Age (Years)
Pre
dict
ed P
roba
bilit
ies
Pr(ICG=1)
Pr(ICG=2)
Pr(ICG=3)
Pr(ICG=4)
Pr(ICG=5)
Figure 6.8: Predicted Probabilities of Being in Different ICG for RC Pipes

193
6.6.4 Model Validation
Checking Parallel Slopes Assumption
The model applied to the City of Niagara Falls data is fully constrained, i.e., it assumes the
same effects, , for each logit. To test this assumption, interaction terms between covariates:
age; material; agematerial, and the continuation ratio cutpoints, , 1,..., 1j j J are
added. The resulting interaction model (calculations not shown) is compared with Model 3
using likelihood-ratio chi-square test. The likelihood-ratio chi-square test statistics 2
3, ,G M
is given as:
23 3 interaction2 ln 2 lnG M L M L M
where 3L M and interactionL M are likelihood values of Model 3 and interaction model,
respectively. 2
3 16.202,G M with corresponding p-value of 2Pr 9 16.202 0.063
for 9 degree of freedom. Since the p-value is greater than 0.05, Model 4 is not significantly
different from Model 3. Therefore, the assumption of parallel slopes, i.e., j is
considered plausible.
Goodness-of-fit Test
To test the overall model fit, the likelihood-ratio chi-square test statistics,
23 32 ln 2ln nullG M L M L M is computed. 2
3 204,G M with corresponding p-
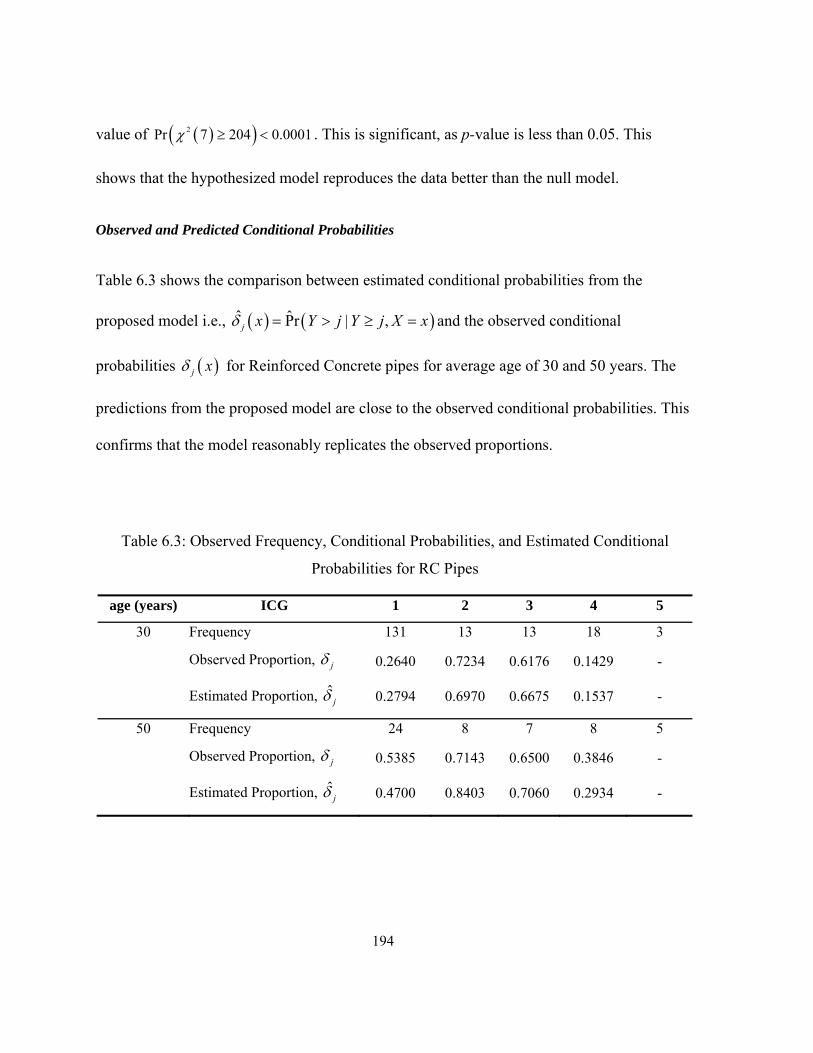
194
value of 2Pr 7 204 0.0001 . This is significant, as p-value is less than 0.05. This
shows that the hypothesized model reproduces the data better than the null model.
Observed and Predicted Conditional Probabilities
Table 6.3 shows the comparison between estimated conditional probabilities from the
proposed model i.e., ˆ P̂r | ,j x Y j Y j X x and the observed conditional
probabilities j x for Reinforced Concrete pipes for average age of 30 and 50 years. The
predictions from the proposed model are close to the observed conditional probabilities. This
confirms that the model reasonably replicates the observed proportions.
Table 6.3: Observed Frequency, Conditional Probabilities, and Estimated Conditional
Probabilities for RC Pipes
age (years) ICG 1 2 3 4 5
30 Frequency 131 13 13 18 3
Observed Proportion, j 0.2640 0.7234 0.6176 0.1429 -
Estimated Proportion, ˆj 0.2794 0.6970 0.6675 0.1537 -
50 Frequency 24 8 7 8 5
Observed Proportion, j 0.5385 0.7143 0.6500 0.3846 -
Estimated Proportion, ˆj 0.4700 0.8403 0.7060 0.2934 -
195
6.6.5 Discussion
The results presented in this paper are based on our analysis of a sample of condition
assessment data from the City of Niagara Falls wastewater collection system. The data was
captured using Side Scanner Evaluation Technology (SSET) and defect coded using the 3rd
edition of WRc’s Manual of Sewer Condition Classification by NAAPI certified operators
and analysts. The pipelines’ condition is assessed using defect scores from the 4th edition of
WRc’s Sewerage Rehabilitation Manual using a custom built non-proprietary software
application, WatBAMS, developed by the authors.
The presented analysis shows that the degradation behavior of Reinforced Concrete (RC) and
Vitrified Clay (VC) pipes is different. For RC pipes, the degradation is found to be age
related. The conditional probabilities of advancing beyond a particular Internal Condition
Grade (ICG) – to worse condition – from a given ICG increase with age for RC pipes. For
example, Figure 6.6 shows that the probability of moving to a worse condition grade from
ICG 3 is 60% at 40 years of age, whereas this probability increases to 90% at about 80 years.
Since RC pipes are prone to corrosion due to hydrogen sulfide and moisture in addition to
other reactive agents in domestic sewage, material loss and deterioration will occur over
time. Thus, this finding for RC pipes is deemed reasonable.
The degradation of Vitrified Clay (VC) pipes is found not to be age dependent. Figure 6.7
shows that there is no significant change in conditional probabilities with age. Comparing
Figure 6.6 and Figure 6.7, it is evident that the conditional probabilities of advancing to
worse internal condition grades from a particular internal condition grade are higher for VC
196
pipes up to 65 years of age as compared to RC pipes. For example, at age 40, the conditional
probability of advancing to worse condition grades from ICG 1 is about 0.38 for RC pipes
(refer to Figure 6.6) and 0.63 for VC pipes (refer to Figure 6.7). However, the probability has
increased to about 0.89 at age 80 for RC pipes, whereas there is no appreciable change in
probability for VC pipes. The higher probabilities for VC pipes up to 65 years of age as
compared to RC pipes may be attributed to poor installation practices as the majority of the
inspected VC pipes in the system were found to have open and displaced joints. Furthermore,
laterals’ connections were found to be defective which could result in cracks, fractures, and
holes in VC pipes. These defects due to poor workmanship pushed the VC pipes in worse
internal condition grades at earlier age as compared to RC pipes. However, VC, being inert
material, is not prone to hydrogen sulphide or corrosion attack, and therefore, does not
degrade with age.
Figure 6.6 also shows that the conditional probabilities of advancing to worse internal
condition grades from ICG 2 and ICG 3 vary from 0.50 to 0.98 and 0.32 to 0.96,
respectively. Whereas, the conditional probabilities of advancing to worse internal condition
grades from ICG 1 and ICG 4 vary from 0.15 to 0.92 and 0.07 to 0.83, respectively. The high
probabilities of advancing from ICG 2 and 3 are attributable to low probabilities of being in
ICG 2 and 3 for the sampled pipes – the probabilities of being in ICG 2 and ICG 3 are below
0.1 (refer to Figure 6.8).
The presented results are consistent with (Younis and Knight, 2009) which found that the
deterioration mechanism for VC and RC pipes is not identical. The results, however, did not

197
support the findings of Ariaratnam et al. (2001); Baik et al. (2006); and Davies et al. (2001)
which concluded that the type of pipe material is not a significant factor in deterioration.
Davies et al. (2001) used adjacent property age to estimate the age of sewer pipes as they did
not have age information of the pipes in their sample. The findings of Davies et al. (2001) are
uncertain due to unreliable data for age of pipelines used in their analysis. Davies et al.
(2001) and Ariaratnam et al. (2001) used binary logistic regression that did not take into
account the ordinal nature of response data. The unconstrained ordered probit model based
on latent variable formulation proposed by Baik et al. (2006) was overly complex in terms of
number of estimated parameters. This made the interpretation of results quite challenging.
The results of our analysis partly confirm the findings of Micevski et al. (2002) which
concluded that the type of pipe material affects deterioration. Micevski et al. (2002),
however, used multinomial model which did not take into account the rank-ordered
information. When different pipe materials have different age distributions, it is important to
consider interaction to adjust for age differences, however, all the above cited studies ignored
the interaction effect between pipe age and material.
The estimated conditional probabilities from the presented CR model are used to compute the
marginal probabilities of wastewater pipelines being in certain internal condition grades
depending on pipe age and material. The conditional probabilities provide the deterioration
pattern, whereas the marginal probabilities present the deterioration trend for wastewater
pipelines. The marginal probabilities calculated from the CR model using Equation 6.10 are
the same as given by the cumulative logit model developed in Younis and Knight (2009).
The same dataset was used in the two analyses, and the CR model served as a check on
198
computational accuracy of the cumulative logit model. It is to be noted, however, that direct
comparison of parameter estimates from CR and cumulative logit models is not feasible, as
both models are inherently different, and estimate different types of probabilities.
6.7 Conclusions
State-of-the-art deterioration models for wastewater pipelines suffer from many
shortcomings, such as: (1) models based on expert judgment suffer from bias and validation
issues; (2) most of the models do not take into account the ordinal nature of condition
assessment data; (3) models are based on inadequate data which was collected with little or
no quality assurance and quality control procedures in place; (4) some models are complex in
terms of number of parameters to be estimated; (5) models violate assumptions or
assumptions could not be verified due to data limitations; and (6) analyses provide limited
model interpretations. Therefore, better deterioration models are needed to understand the
degradation behavior of wastewater pipelines, and to develop effective and efficient
maintenance management plans using reasonable predictions about their condition.
A new deterioration model for wastewater pipelines is developed and applied to the high
quality condition assessment data from the City of Niagara Falls wastewater collection
system. The model assumptions are checked, and found to be plausible. The model provides
valuable information in terms of predicted conditional probabilities of advancing to worse
internal condition grades from a particular Internal Condition Grade (ICG) for wastewater
pipelines depending on pipe age and material. The continuation ratio model was found to
accurately predict the conditional probabilities of advancing beyond an ICG – to worse

199
condition. The Reinforced Concrete (RC) and Vitrified Clay (VC) pipes were found to
exhibit different degradation behavior. For RC pipes, the degradation was age dependent,
whereas for VC pipes, age was not a factor in deterioration.
The proposed model can be used to establish benchmarks for wastewater pipelines useful
service life, predict progression to worse condition states, and determine future rehabilitation
and maintenance needs. The model can also be used to develop realistic future maintenance
and operation budgets over the life of the asset, and to satisfy regulatory reporting
requirements. Further research is required to validate the continuation ratio model in other
networks, and to model the deterioration of pipe materials other than RC and VC.
Acknowledgments
The research presented in this paper is sponsored by the Canadian Water Network (CWN)
and Natural Sciences and Engineering Research Council of Canada (NSERC). The ongoing
research partners include the Centre for Advancement of Trenchless Technologies at the
University of Waterloo, the City of Niagara Falls, and Pipeflo Contracting Corp. Their
assistance is gratefully appreciated and acknowledged.

200
References
Agresti, A. (2002). Categorical data analysis (Second ed.). Canada: Wiley Interscience.
Ariaratnam, S. T., El-Assaly, A., and Yang, Y. (2001). Assessment of infrastructure
inspection needs using logistic models. Journal of Infrastructure Systems, 7(4), 160-165.
Baik, H., Jeong, H. S., and Abraham, D. M. (2006). Estimating transition probabilities in
Markov chain-based deterioration models for management of wastewater systems.
Journal of Water Resources Planning and Management, 132(1), 15-24.
Baik, H. S., Abraham, D. M., and Gipson, D. J. (2004). Impacts of deterioration based life
cycle cost analysis (LCCA) on the assessment of values of wastewater infrastructure
assets. ASCE Pipeline Division Specialty Congress - Pipeline Engineering and
Construction - what's on the Horizon, PIPELINES 2004, Aug 1-4 2004, 45-54.
Baik, H. (2003). Development of an asset valuation model for wastewater infrastructure
assets. Purdue University).
Bender, R. (., and Benner, A. (. (2000). Calculating ordinal regression models in SAS and S-
plus. Biometrical Journal, 42(6), 677.
Clogg, C. C., and Shihadeh, E. S. (1994). Statistical models for ordinal variables. USA: Sage
Publications, Inc.
Davies, J. P., Clarke, B. A., Whiter, J. T., Cunningham, R. J., and Leidi, A. (2001). The
structural condition of rigid sewer pipes: A statistical investigation. Urban Water, 3,
277-286.
201
FHWA. (2000). Primer: GASB 34. USA: FHWA Office of Asset Management, U.S.
Department of Transportation.
Harrell, J., Frank E. (2001). Regression modeling strategies with applications to linear
models, logistic regression, and survival analysis. New York, USA: Springer.
Howard, R. J. (2001). Infrastructure asset management under Australian accounting standard
27 (AAS27). Proceedings of the Institution of Civil Engineers: Municipal Engineer,
145(4), 305-310.
Jeong, H. S., Baik, H., and Abraham, D. M. (2005). An ordered probit model approach for
developing Markov chain based deterioration model for wastewater infrastructure
systems. ASCE Pipeline Division Specialty Conference - PIPELINES 2005, Aug 21-24
2005, 649-661.
Johnson, V. E., and Albert, J. H. (1999). Ordinal data modeling. New York: Springer.
Kathula, V. S., Jr., N. D. P., Roberts, F. L., and Nassar, R. (1999). Integrating sewer
condition with sewer management. No Dig 1999 Conference, Orlando, Florida.
Liao, T. F. (1994). Interpreting probability models logit, probit, and other generalized linear
models. Thousand Oaks, CA: Sage Publications, Inc.
Long, J. S. (1997). Regression models for categorical and limited dependent variables. USA:
SAGE Publications.
Madanat, S., Mishalani, R., and Wan Ibrahim, W. H. (1995). Estimation of infrastructure
transition probabilities from condition rating data. Journal of Infrastructure Systems,
1(2), 120-125.

202
Meyer, M. A., & Booker, J. M. (1991). Eliciting and analyzing expert judgment: A practical
guide. (Reprint Edition). Society for Industrial Mathematics.
Micevski, T., Kuczera, G., and Coombes, P. (2002). Markov model for storm water pipe
deterioration. Journal of Infrastructure Systems, 8(2), 49-56.
Ministry of the Environment, Ontario. (2007). Toward financially sustainable drinking-water
and wastewater systems (Financial Plans Guideline No. EBR Registry Number: 010-
0490). Ontario, Canada: Ministry of Environment, Ontario. Retrieved from
<http://www.ebr.gov.on.ca/ERS-WEB-
External/displaynoticecontent.do?noticeId=MTAwNDkxandstatusId=MTUxNDM3andl
anguage=en>
Mirza, S. (2007). Danger ahead: The coming collapse of Canada's municipal infrastructure
No. FCM 1060E). Ottawa, ON, Canada: Federation of Canadian Municipalities.
NAMS. (2002). International infrastructure management manual (2nd ed.). Australia:
Institute of Public Works Engineering.
Nelder, J. A., and McCullah, P. (1989). Generalized linear models (Second ed.). USA:
Chapman and Hall/CRC.
O'Connell, A. A. (2006). Logistic regression models for ordinal response variables (v. 146
ed.). USA: Sage Publications Inc.
OMBI. (2007). Implementation of accounting for tangible capital assets - reference manual.
Ontario, Canada: Sub-Committee of the Treasures Group OMBI. Retrieved from
http://www.ombi.ca/docs/db2file.asp?fileid=187

203
PricewaterhouseCoopers. (2003). Analysis of asset management, accounting, finance and
pricing practices for municipal water and wastewater systems in Ontario. Ontario:
Ministry of Finance.
Stantec (2009). Review of Sewer Defect Condition Classification Methodologies. Roster
Category 26: Subsurface Infrastructure Assessment and Trenchless Technologies
2007/2008. City of Hamilton.
TD Economics. (2002). A choice between investing in Canada's cities or disinvesting in
Canada's future. Canada: TD Bank Financial Group.
Wirahadikusumah, R., Abraham, D., and Iseley, T. (2001). Challenging issues in modeling
deterioration of combined sewers. Journal of Infrastructure Systems, 7(2), 77-84.
Wirahadikusumah, R., Abraham, D. M., and Castello, J. (1999). Markov decision process for
sewer management. Engineering, Construction and Architectural Management, 6(4),
358-370.
Wirahadikusumah, R., and Abraham, D. M. (2003). Application of dynamic programming
and simulation for sewer management. Engineering, Construction and Architectural
Management, 10(3), 193-208.
WRc. (2001). Sewerage rehabilitation manual (4th ed.). Swindon, UK: Water Research
Centre.
Younis, R., and Knight, A. M. (2009). A probability model for investigating the trend of
structural deterioration of wastewater pipelines. Tunneling and Underground Space
Technology (submitted).

204
Younis, R., and Knight, M. A. (2008). An empirical model for the prediction of structural
behavior of wastewater collection systems. ASCE International Pipelines Conference
2008, Atlanta, GA.
205
Chapter 7
Strategic Asset Management Framework for Wastewater Collection
Systems Based on Modified Balanced Scorecard Model
This chapter consists of two parts.
Part 1 – up to Section 7.6 – provides an overview of published literature on civil
infrastructure asset management frameworks.
Part 2 – starting from Section 7.7 – discusses the new strategic management framework.

206
7.1 Abstract
This paper presents a strategic planning and management framework to develop, implement,
and communicate an integrated asset management plan for wastewater collection networks.
New legislative requirements demand increasing accountability to meet stakeholders’
expectations, protection of public health and environment, efficient allocation of funds, and
greater disclosure. The state-of-the-art civil infrastructure management systems fail to
address the gaps between strategy formulation and execution to meet an organization’s
mandate and mission. The proposed framework takes into account four strategic perspectives
– Social/Political, Financial, Operational/Technical, and Regulatory – and devises four
strategic themes for sustainable wastewater collection systems. Due to the enormity of the
task, and time, space, and data limitations, only the Operational/Technical perspective is
discussed in detail.
The asset management strategic themes, perspectives, and objectives presented in this paper
are developed on the basis of collaborative working sessions held at the first Canadian
National Asset Managers workshop in 2007. The themes and objectives are illustrated in a
strategy map and detailed in the modified balanced scorecard model. The use of business
intelligence tools to implement, monitor, and report various components of the proposed
framework is demonstrated. An example implementation for the City of Niagara Falls
wastewater utility is presented. Unlike the existing asset management systems, the proposed
system provides a unified gateway to manage wastewater utilities in a timely and effective
207
manner. The proposed framework can be adapted to devise and implement strategic asset
management plans in comparable organizations.
Keywords: Wastewater Collection Systems; Strategic Management; Balanced Scorecard;
Asset Management; Strategy Maps; Business Intelligence; Sewer Systems.

208
7.2 Introduction
Urban infrastructure consists of capital intensive physical systems that provide essential
services to society such as transportation (pavements and bridges), utilities (water,
wastewater, hydro, gas, and telephone), and buildings (offices, health, and education
facilities). Wastewater collection networks – an important component of municipal
infrastructure systems – are responsible for safe and secure dispose of domestic, industrial,
commercial, and public water. It is vital for the utilities – public works departments at
municipal or regional level – to maintain and manage these networks for in an effective,
efficient, and sustainable manner. Public works departments are accountable with respect to
increased public expectations and new government regulatory requirements of protection of
public health and environment, efficient use of public funds, and greater disclosure. For
example, in Ontario, Canada, Regulation 453/07 under Safe Drinking Water Act, 2002
(SDWA) (not proclaimed yet) requires that utilities prepare and submit yearly reports
regarding current and estimated future condition of water and wastewater infrastructure.
Furthermore, to obtain yearly operating licenses from the Ontario Ministry of Environment,
utilities must prepare and publish financial plans for long-term sustainability of water and
wastewater systems (Ontario Ministry of Environment, 2007). The SDWA also requires
municipalities to disclose services quality information to the public. The Canadian Institute
of Chartered Accountants Public Sector Accounting Board (PSAB) issued statement PS3150
in 2006 which requires all Canadian municipalities and utilities, starting in January 2009, to
report their tangible capital assets along with their depreciation on financial statements
(OMBI, 2007). In the United States, the Governmental Accounting Standards Board (GASB)

209
Statement 34, and in Australia, the Australian Accounting Research Foundation Standard 27
specifies similar accounting practices (FHWA, 2000; Howard et al., 2001).
In Canada, utilities are required to balance their budgets every year (Miller, 2008), and at the
same time expected to meet social/political, environmental, operational/technical, and
financial obligations. Due to limited revenue, municipalities historically failed to invest in
urban infrastructure. This has resulted in a massive infrastructure deficit. The municipal
infrastructure deficit is an estimate of the total additional investment needed to repair and
prevent deterioration in existing, municipally owned infrastructure assets. Estimates of
Canada’s municipal infrastructure deficit vary from a $44 billion total municipal
infrastructure shortfall (TD Economics, 2002) to over $125 billion (Mirza, 2007). Mirza
(2007) reports that the infrastructure funding gap for existing water and wastewater systems
is $31 billion, and to meet new needs an additional $56.6 billion is required. The size and
scope of the infrastructure problems facing municipalities and local governments is
enormous as the decay of Canada’s infrastructure creates severe domino effects – higher cost
of maintenance, operation, rehabilitation, and repair; inefficiency and increased vulnerability;
and increased threats to public safety and the environment. Mirza (2007) states that “without
maintenance or with deferred maintenance, the municipal infrastructure deficit could be close
to $2 trillion by 2065, and that with regular maintenance and good scientific management,
the escalating infrastructure deterioration and the resulting infrastructure deficit can be
controlled within manageable levels.”

210
The management of wastewater collection pipelines is a challenging issue since wastewater
collection systems are usually characterized as ‘out of sight, out of mind’ (buried
underground), and remain virtually untouched and neglected until a failure occurs
(Wirahadikusumah et al., 2001). A number of technical guidelines and best management
practices have been published to help the municipalities in developing asset management
plans to proactively maintain and manage these systems. The majority of these publications
and existing practices envisage asset management consisting of the following steps: data
analysis – provided that necessary data is available, optimization, and subsequent course of
actions. The implementation of the asset management processes is a challenging task due to
many constraints such as: lack of knowledge and strategy, lack of tools to implement and
execute strategies, financial constraints, human resource issues, lack of understanding of
specific legislative requirements, and no single consistent method to measure and
communicate performance and educate stakeholders. To address these constraints and to
satisfy new regulatory requirements and customer expectations, an integrated strategic
management system is required.
The specific objectives of this paper are to: (1) provide a brief overview of the state-of-the-
art civil infrastructure asset management literature and practices; (2) present a new strategic
management framework for wastewater utilities based on modified balanced scorecard
model; (3) describe the application approach and tools for implementing the proposed
framework; and (4) illustrate the use of the proposed framework.
211
7.3 Literature Overview
The need for effective and efficient maintenance management of municipal infrastructure
systems, especially wastewater infrastructure, gained substantial prominence in the last
decade. As a result, a number of tools such as asset management plans, methodologies, best
management practices guidelines, management frameworks, and benchmarking initiatives
have been proposed for sustainable municipal infrastructure. This section provides an
overview of asset management definition and processes, and reviews some of the prominent
published literature on infrastructure management. The section concludes with a discussion
on published literature and initiatives, and the need for an improved methodology for
implementing strategic asset management practices in water/wastewater utilities.
7.4 Infrastructure/Asset Management
According to Grigg (2003), Infrastructure Management is the process of planning,
coordinating, and executing civil infrastructure systems over the life-cycle i.e., “from cradle
to grave”; whereas Asset Management applies financial concepts to infrastructure systems
management. Grigg (2003) emphasized that infrastructure management and asset
management are one and the same thing.
Asset Management Definition
There are numerous definitions of asset management which are continuously refined with the
emergence of the field (FHWA, 1999). US Department of Transportation, Federal Highway
Administration (FWHA) suggested the following working definition of asset management:
212
“Asset management is a systematic process of maintaining, upgrading, and operating
physical assets cost-effectively. It combines engineering principles with sound business
practices and economic theory, and it provides tools to facilitate a more organized, logical
approach to decision-making. Thus, asset management provides a framework for handling
both short and long-range planning” (FHWA, 1999).
Essential Technical Elements of Asset Management
Figure 7.1 shows the basic technical elements of an asset management system in terms of
seven questions proposed by Gohier (2006). The asset management processes can be divided
into three distinct components: (1) inventory: includes a catalog of physical assets and their
market value; (2) maintenance management plan: consists of condition assessment,
maintenance/rehabilitation/reconstruction strategies and their timelines; and (3) financial
plan: deals with money requirements and funding mechanisms.

213
Figure 7.1: Technical Elements of Asset Management (adapted from Gohier, 2006)
There are two levels of maintenance management (Hudson et al., 1997): (1) Network level;
and (2) Project level.
Network level management envisages maintenance and rehabilitation decisions regarding the
whole network. For wastewater collection systems, it involves prioritization among entire
214
wastewater collection network based on condition assessment, and then optimizing available
resources. This essentially translates to knowing the number of pipes in different condition
states, their criticality, and devising engineering and economic strategies for capital planning
and long-term sustainability.
Project level management refers to maintenance and rehabilitation decisions regarding
individual components. In case of wastewater systems, it involves formulating cost-effective
maintenance and rehabilitation alternatives for each pipe segment from the available options.
7.5 Infrastructure Management Frameworks
Many publications exist on how to manage civil infrastructure facilities. For example,
Hudson et al. (1997) discussed an overall framework for infrastructure management and
provided a systematic methodology for infrastructure management. Figure 7.2 shows that
Hudson et al. (1997) differentiated between program/network/system-wide and
project/section levels management. The main components of their infrastructure management
framework include ongoing in-service monitoring and evaluation, and database systems.
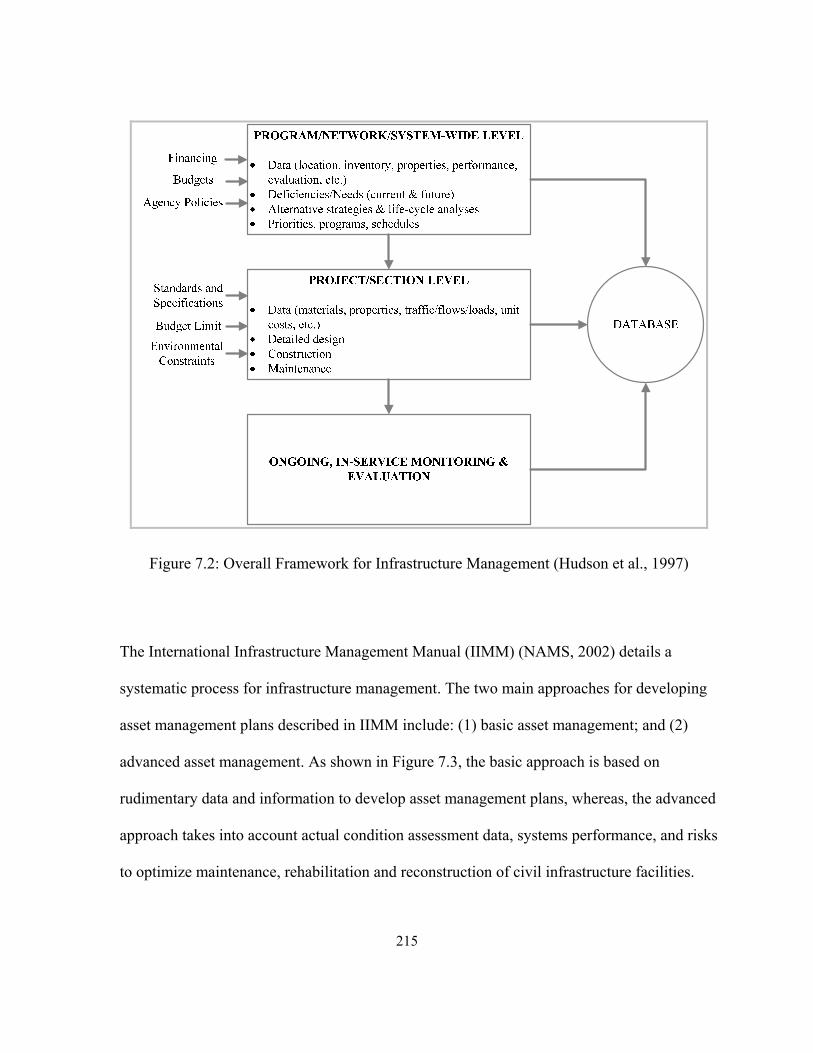
215
Figure 7.2: Overall Framework for Infrastructure Management (Hudson et al., 1997)
The International Infrastructure Management Manual (IIMM) (NAMS, 2002) details a
systematic process for infrastructure management. The two main approaches for developing
asset management plans described in IIMM include: (1) basic asset management; and (2)
advanced asset management. As shown in Figure 7.3, the basic approach is based on
rudimentary data and information to develop asset management plans, whereas, the advanced
approach takes into account actual condition assessment data, systems performance, and risks
to optimize maintenance, rehabilitation and reconstruction of civil infrastructure facilities.

216
Existing AssetKnowledge
Identify Levelsof Service
Predict DemandAssess Financial
Cashflows
Prepare AssetManagement Plan
Collect Data/Measure Performance
Assess Condition,Measure
Performance
Failure ModeAnalysis
Assess Risksof Failures
Evaluate/SelectTreatment Options
Identify OptimumSolution
Figure 7.3: Basic and Advanced Asset Management Strategies (adapted from NAMS, 2002)
In Canada, the National Roundtable on Sustainable Infrastructure (NRTSI) proposed a
National Asset Management (NAM) Framework (see NAMWG, 2009). Figure 7.4 presents
the NAM framework that NRTSI foresee to be the foundation of every asset management
activity in Canada. The framework consists of objectives, assessment criteria and
performance indicators for core public infrastructure – pavements, bridges, water,

217
wastewater, etc. The framework provides definitions of selected performance indicators but
lacks information about how to measure the proposed performance indicators. Furthermore,
it also does not provide implementation details.
Sustainability of Communities – building environmental, financial and social resilience and adaptability to face a changing world
· Infrastructure needs to be managed as a valuable asset· Assets need to be defined within the context of community goals for level of service· Assets need to be defined on the basis of full lifecycle assessments· Assets need to be managed as interconnected systems considering the relationship
between various categories of assets· Asset management activities themselves need to be managed as integrated
processes to optimize investment decisions
Technical
PolicyUsers
FinancialPlanning
NATIONAL
LOCAL
REGIONAL
OPERATIONAL ACTIVITIES
· Own (manage fund and administrate
· Create (plan, design, build, finance)
· Operate & maintain
· Monitor
· Renew and replace
· Regulate
CAPACITY BUILDING ACTIVITIES
· Public & private finance
· Research/development – processes & tools
· Education & training
· Procurement
· Innovation in design and construction
· Data management
Integrated
MULTI-DISCIPLINARY
Figure 7.4: National Asset Management Framework (NAMWG, 2009)

218
7.5.1 Sewerage Rehabilitation Manual
The Sewerage Rehabilitation Manual (SRM), published by Water Research Center in UK,
describes a wastewater pipelines renovation decision making process as shown in Figure 7.5.
The SRM discusses in detail the techniques for carrying out initial planning and performing
diagnostic studies from hydraulic, environmental, structural, and operations viewpoints. It
further elaborates the development and implementation of rehabilitation techniques and
monitoring systems for wastewater collection networks.
7.5.2 Best Management Practices Guides
A number of guides for best management practices have been published. For example, in
Canada, the Federation of Canadian Municipalities, the National Research Council, and
Infrastructure Canada produced InfraGuide: The National Guide to Sustainable Infrastructure
(FCM & NRC, 2003). InfraGuide is a collection of case studies, best practices reports, and e-
learning tools for maintenance management of civil infrastructure facilities in Canada. In the
USA, the Environmental Protection Agency published guides such as (1) Asset Management:
A Best Practices Guide; (2) Asset Management for Local Officials; and (3) Building an Asset
Management Team (U.S. Environmental Protection Agency, 2009). These guides are meant
to help asset managers at cities, corporations, and utilities to understand, develop, and
implement asset management plans.
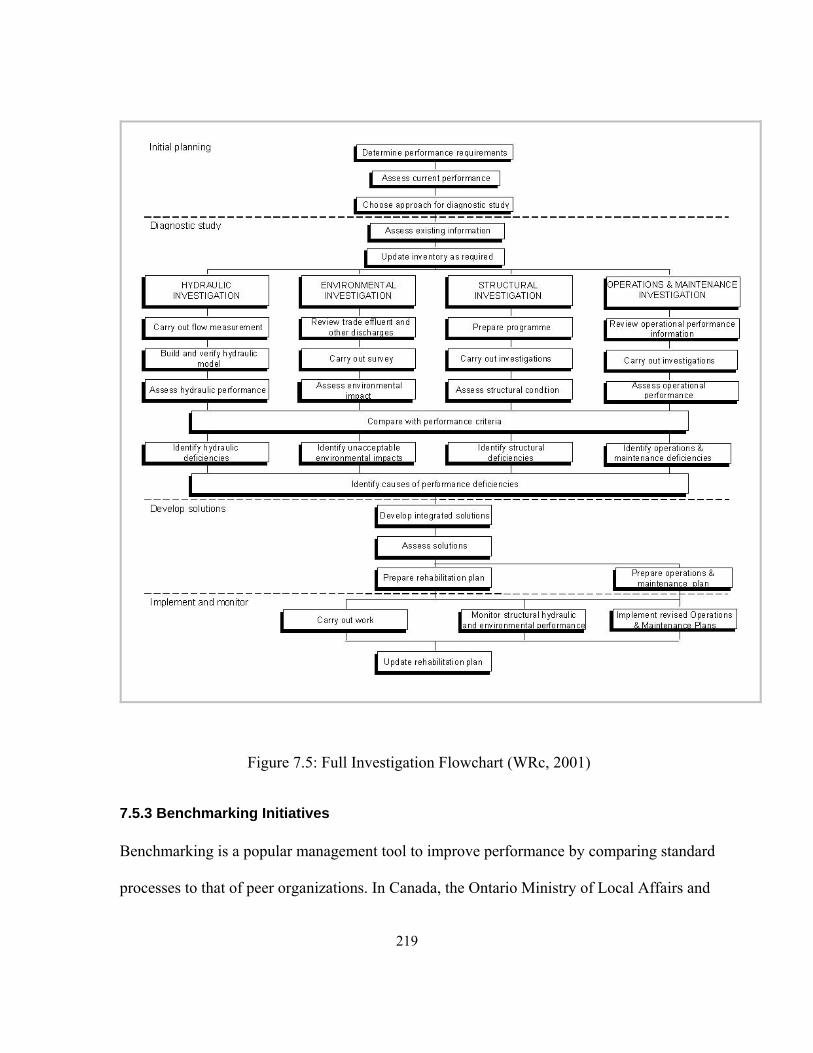
219
Figure 7.5: Full Investigation Flowchart (WRc, 2001)
7.5.3 Benchmarking Initiatives
Benchmarking is a popular management tool to improve performance by comparing standard
processes to that of peer organizations. In Canada, the Ontario Ministry of Local Affairs and

220
Housing requires all the municipalities to report on efficiency and effectiveness measures for
their services under the Municipal Performance Measurement Program (Burke, 2005). The
list of measures include elements such as operating costs for governance and corporate
management, as well as, for various services – water, wastewater, police, fire, transpiration,
libraries etc. For wastewater infrastructure, municipalities are required to provide information
on the number of wastewater main backups per 100 kms of wastewater main in a year, and
estimated percentage of wastewater that by-passed treatment.
Ontario Municipal Benchmarking Initiative (OMBI, 2008) is a project by Chief
Administrative Officers and City Managers from OMBI partner municipalities to identify
and develop performance measurements, collect data from partner municipalities, and
benchmark the results to identify best management practices. The OMBI project intends to
develop an integrated management tool by aggregating financial and performance data to
facilitate decision making at the municipalities.
The Canadian National Water and Wastewater Benchmarking Initiative (NWWBI) (Main et
al., 2006; NWWBI, 2009) was launched in 1997 to help the participating utilities to manage,
monitor, and improve their performance. NWWBI proposed a Utility Management Model
with seven goals related to cost minimization, systems reliability and sustainability,
infrastructure adequacy, public health and safety, work environment, customers’ satisfaction,
and environmental protection. For each goal, a number of performance measures are defined
for water and wastewater infrastructure. The participating utilities are surveyed annually by
NWWBI representatives to collect data on mutually agreed performance measures. NWWBI

221
advocates a collaborative approach to benchmarking where the participants learn by sharing
performance data rather than the traditional private sector’s competitive approach where
organizations are pitted against each other to be the best on the market.
7.5.4 CARE-S and CARE-W
In 2001 and 2002 the European Commission allocated €8 million for CARE-W (Computer
Aided REhabilitation of Water Networks) (CARE-W, 2008) and CARE-S (Computer Aided
REhabilitation of Sewer Networks) (CARE-S, 2008) projects, respectively. The CARE-S
project included 15 partners from ten European countries for the development of a decision
support system for the management of wastewater collection networks. The final outcome
consists of 21 software pieces, 31 reports, and numerous publications. The proposed decision
support system was tested at twenty cities (end-users). The proponents of the program hope
that CARE-S and CARE-W systems will become leading instruments for managing water
and wastewater infrastructure in the future (Saegrov, 2006).
7.5.5 Asset Management Software
A number of commercial and proprietary software are available for infrastructure asset
management. Halfawy et al. (2006) carried out a review of key features, capabilities, and
limitations of some of the most widely used software systems, and concluded that the vast
majority of existing software systems mainly focus on operational aspects such as work
orders or service requests with little or no functionality for making long-term maintenance
and rehabilitation decisions – that is, existing systems offer little help in strategic
management. Newton and Vanier (2005) conceded that efficient operations and cost-
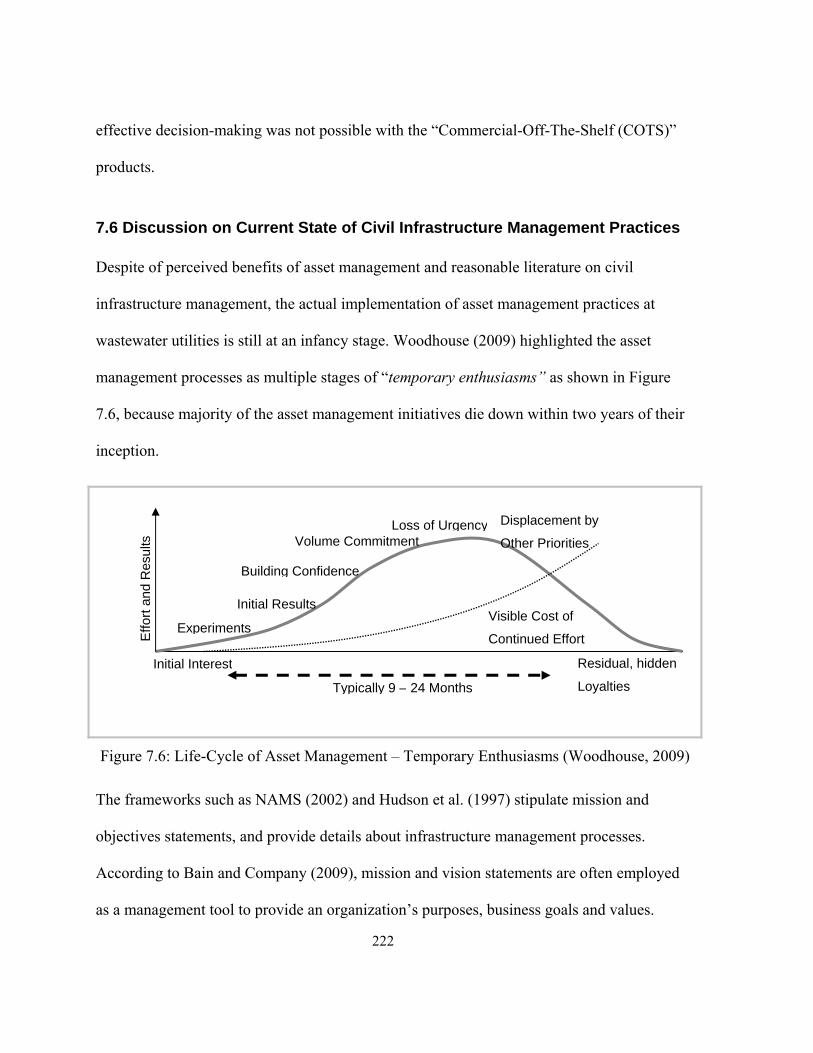
222
effective decision-making was not possible with the “Commercial-Off-The-Shelf (COTS)”
products.
7.6 Discussion on Current State of Civil Infrastructure Management Practices
Despite of perceived benefits of asset management and reasonable literature on civil
infrastructure management, the actual implementation of asset management practices at
wastewater utilities is still at an infancy stage. Woodhouse (2009) highlighted the asset
management processes as multiple stages of “temporary enthusiasms” as shown in Figure
7.6, because majority of the asset management initiatives die down within two years of their
inception.
Figure 7.6: Life-Cycle of Asset Management – Temporary Enthusiasms (Woodhouse, 2009)
The frameworks such as NAMS (2002) and Hudson et al. (1997) stipulate mission and
objectives statements, and provide details about infrastructure management processes.
According to Bain and Company (2009), mission and vision statements are often employed
as a management tool to provide an organization’s purposes, business goals and values.
Initial Interest
Experiments
Building Confidence
Volume Commitment
Initial Results
Typically 9 – 24 Months
Visible Cost of
Continued Effort
Displacement by
Other Priorities Loss of Urgency
Effo
rt a
nd R
esul
ts
Residual, hidden
Loyalties

223
Many public and private sector organizations have mission, values, and vision statements,
and describe strategies in terms of programs and initiatives to carry out their mission and
accomplish their vision. However, strategy implementation is more challenging than strategy
formulation. According to Niven (2005), about 90% of organizations fail to execute their
strategy due to barriers, such as lack of vision, management, and resources. Despite of a
number of proposed asset management systems, plans, frameworks, and on-going initiatives,
utilities still struggle to implement and execute their strategies to effectively and efficiently
manage civil infrastructure systems. This is evident from periodic surveys (e.g.,
PricewaterhouseCoopers, 2003) and reports on the status of asset management practices at
various municipalities as well as workshop proceedings on asset management challenges
(e.g., CNAM, 2009; Frangopol et al., 2003). In 2004, the Ministry of Finance in Ontario,
Canada, completed a survey to investigate municipal water and wastewater systems asset
management practices. This survey found that among the responding Ontario municipalities,
52% do not perform inspections for condition assessment or record the results of inspections
(PricewaterhouseCoopers, 2003). The survey also found that large municipalities – more than
50,000 population – typically have better asset management practices, and asset management
approaches ranged from “don’t fix it if it is not broken” strategies to the use of
computationally intensive and sophisticated software tools. These surveys demonstrate
current state-of-the-art in asset management by municipalities in Canada and most likely in
North America.
Municipal benchmarking initiatives can be useful to improve asset management practices if
the systems being benchmarked have the same characteristics at participating municipalities

224
or they follow the same business practices. However, benchmarking is not a useful
management tool when it is used to compare fundamentally different systems and business
processes. For example, different wastewater collection systems can have different age and
material distributions for pipelines, and can be operating under different environments and
demands. Similarly, the costs to provide services can depend on many localized factors.
Performance measures, such as number of pipe breaks or sewer overflow events, provide
little information to assess a utility, and mean little to improve the business processes or
systems’ performance.
The major problem – in addition to resource barrier – is the complexity and lack of
understanding in implementing and aligning asset management processes in the overall
organizational strategy. The asset management plans – if they exist – are not consistent with
strategic plans.
7.7 Proposed Asset Management Framework
This section introduces an integrated strategic asset management framework based on the
Balanced Scorecard (BSC) model. The framework provides the essential supporting structure
and system for an efficient, effective, and sustainable provision of wastewater collection
services. The review of strategic management and traditional BSC model is provided
followed by the development of integrated strategic management framework using a
modified BSC model. An example framework is discussed to elaborate the application of the
proposed framework.

225
7.7.1 Strategic Management
Strategic management is a continuous process of specifying an organization’s mission,
vision, and objectives, and developing policies, plans, and initiatives – in terms of projects
and programs – designed to achieve organizational objectives. According to Dess et al.
(2006), strategic management: (1) directs organizations towards overall goals and objectives;
(2) involves multiple stakeholders in decision making; (3) incorporates both short- and long-
terms perspectives; and (4) recognizes tradeoffs between efficiency and effectiveness.
Strategic planning, an integral element of strategic management, is the second most widely
used management tool – listed as first for ‘satisfaction with results’ according to the Bain &
Company’s Top Ten list of most used tools (Rigby and Bilodeau, 2009). Many organizations
employ more than one management tools to conduct and manage their businesses. According
to Kaplan and Norton (2004), organizations develop mission and vision statements as
management tools but fail to translate them into actionable strategies, or their mission and
vision are misaligned within the organization (Niven, 2005). The Balanced Scorecard Model
has been proven to be an effective tool to develop strategic management systems for private
and public sector organizations.
7.7.2 The Balanced Scorecard Model
The Balanced Scorecard (BSC) provides a useful framework for strategic management and
corporate governance. The BSC model is a flexible and simple management tool introduced
by Kaplan and Norton for coordinating between business organizations’ strategic and
operational objectives (Kaplan, 1996). BSC was initially developed as a measurement tool to
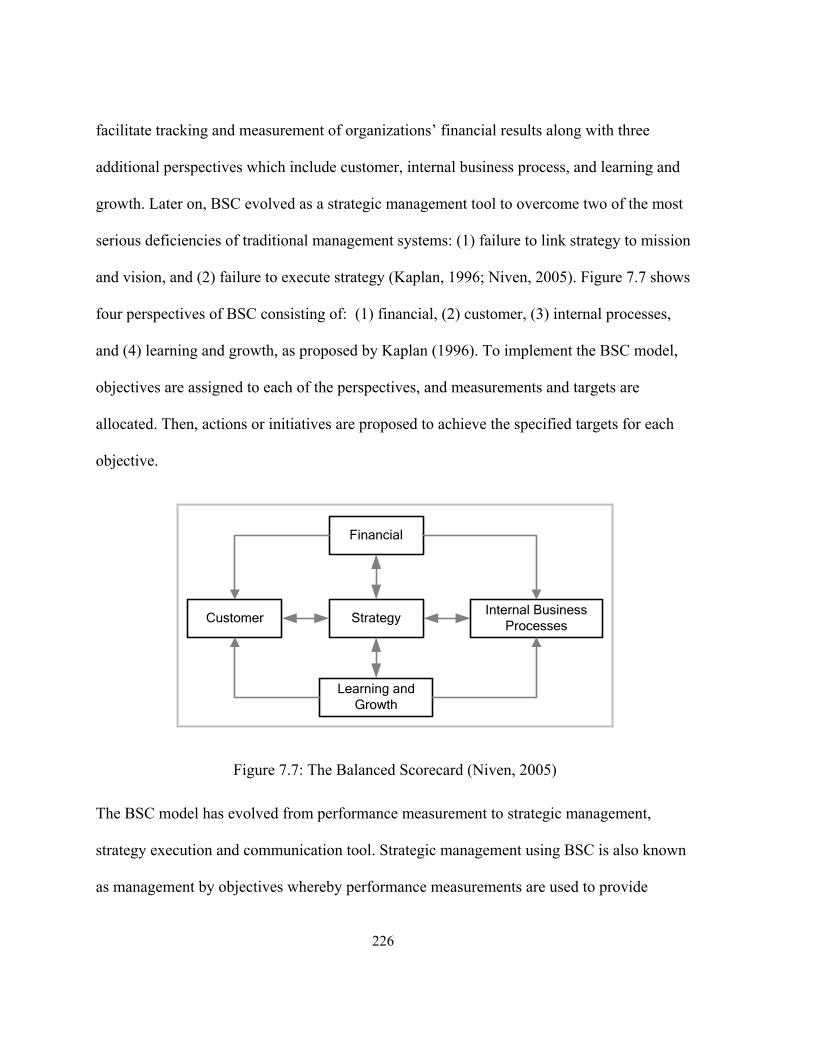
226
facilitate tracking and measurement of organizations’ financial results along with three
additional perspectives which include customer, internal business process, and learning and
growth. Later on, BSC evolved as a strategic management tool to overcome two of the most
serious deficiencies of traditional management systems: (1) failure to link strategy to mission
and vision, and (2) failure to execute strategy (Kaplan, 1996; Niven, 2005). Figure 7.7 shows
four perspectives of BSC consisting of: (1) financial, (2) customer, (3) internal processes,
and (4) learning and growth, as proposed by Kaplan (1996). To implement the BSC model,
objectives are assigned to each of the perspectives, and measurements and targets are
allocated. Then, actions or initiatives are proposed to achieve the specified targets for each
objective.
Customer
Learning and Growth
Internal Business Processes
Financial
Strategy
Figure 7.7: The Balanced Scorecard (Niven, 2005)
The BSC model has evolved from performance measurement to strategic management,
strategy execution and communication tool. Strategic management using BSC is also known
as management by objectives whereby performance measurements are used to provide
227
feedback on internal processes and external outcomes to meet an entity’s desired mission and
vision. Two main components of BSC model are (Chenoweth and Bird, 2005):
Management Tool consisting of: (1) objectives, (2) Key Performance Indicators (KPIs) –
leading indicators or measures to assess achievement of objectives, and (3) KPIs – lagging
indicators consisting of targets and results, and
Management Strategy consisting of action plans or initiatives to achieve objectives.
The proposed integrated strategic wastewater asset management framework modifies and
enhances the number and naming of perspectives and objectives in the traditional BSC model
and related tools e.g., vision and mission statements; strategy themes and maps etc., – as
discussed in Kaplan (1996), Kaplan and Norton (2004), and Niven (2005) – to specifically
reflect the objectives, issues, and needs of a typical wastewater utility. The following section
describes the proposed framework for wastewater collection networks.
7.8 Strategic Management Framework for Wastewater Collection Networks
The key components of the proposed strategic management framework are shown in Figure
7.8 and defined in Table 7.1. These components are further explained using an example
framework provided in Section 7.10. Figure 7.8 shows that the strategic management process
starts with defining/reviewing the mission, values, and vision statements of the wastewater
utility. Mission, values and vision are required to provide guidance for the organization.
Strategic and performance goals and objectives are derived from the mission, values and
vision statements. Strategy – consisting of multiple strategic themes – provides an elaborate

228
and systematic plan to accomplish stated mission and vision in terms of objectives. For
example, the strategic themes of a wastewater utility may comprise of: (1) ensuring public
health and safety; and (2) reducing long-term costs of services. Strategy maps along with the
balanced scorecard model are management tools to describe, measure, and communicate
strategy. The balanced scorecard initiatives – short and long-term actions/projects – are
assessed for financial feasibility, and operating and capital budgets are specified for feasible
programs. For unfeasible initiatives, a review may necessitate the revision of mission, values,
and vision. An effective communication and feedback mechanism is critical to connect
wastewater network internal and external stakeholders.

229
Figure 7.8: Proposed Strategic Management Framework

230
Table 7.1: Components of Strategic Management Framework (Glossary)
Mission, Values, and Vision
Mission – Basis for existence of an organization.
Values – Philosophy and important operational elements and principles.
Vision – Long-term goals and objectives.
Strategy
Strategy is the scheme or a systematic plan of action to achieve objectives over the long-term.
Strategy Map
Strategy map communicates organizational objectives and logic of strategy. It is used as a tool to translate strategy into actionable objectives, and to facilitate the link between strategy formulation and strategy execution.
Modified Balanced Scorecard
Balanced scorecard translates strategy map objectives into measures and targets. Balanced scorecard consists of the following key components:
Perspectives refer to different viewpoints or important elements that define performance.
Measures are the metrics used to track and evaluate performance on objectives.
Targets are the desired results of a performance measure.
Initiatives/Actions/Plans refer to programs and activities to achieve targets.
Financial Planning/Feasibility/Budgeting
This involves assessing the financial feasibility of proposed programs and projects, and allocating resources for feasible initiatives.
Communicate/Feedback
This pertains to involving all the stakeholders into strategic management program by formulating and communicating mission, vision, strategy, initiatives, and strategic outcomes, and getting their feedback.
Review
This involves regular evaluation and audit to ensure that management system is working satisfactorily.

231
7.9 Modified Balanced Scorecard – Formulation of Perspectives and
Objectives
The perspectives and objectives of the proposed balanced scorecard model were developed
on the basis of multiple collaborative working sessions held during the first Canadian
National Asset Management (CNAM) Workshop held in Hamilton, Ontario, Canada in 2007
(CNAM, 2009). During the CNAM workshop, over 120 experts including representatives
from 35 Canadian municipalities, academia, industry, and specialists from Australia and New
Zealand, deliberated in focus groups, and discussed and debated asset management
challenges and opportunities. The authors – being part of the organizing committee –
participated in every aspect of the workshop from organization to compiling and analyzing
the findings, and dissemination of results. The deliberations were iterative, and the following
steps were implemented.
The participants were divided into four different groups to avoid potential skewness/bias
from few dominant members. All the four groups deliberated in isolation from each other
under the guidance of skilled and experienced moderators. To ensure maximum participation
and to facilitate the free-flowing discussion, all the focus groups were further subdivided into
subgroups.
In each focus group, no fixed questions or directions were provided, and all the participants
were given freedom to brainstorm and comment on anything they deem important with
respect to infrastructure asset management.
232
All the issues that were brought up by the participants were documented on flip charts. Then,
each participant was given fixed number of voting stickers to vote for the issues that they felt
important. The participants were free to cast as many votes to a certain issue as they wished
according to their own weighing criterion.
The same procedure was repeated for all the four prescribed perspectives – social/political,
financial, regulatory, and operational/technical – of municipal infrastructure management.
The issues that received zero votes were dropped out, and the issues that obtained top votes
in each of the category were selected as the top priority objectives.
Later, all the groups were convened, and the aggregated results were analyzed and discussed.
Additionally, interviews with infrastructure managers and in-depth review of published
literature and current practices were carried out to formulate the objectives in the modified
BSC model.
Results
The findings from the workshop were compiled to formulate the modified balanced scorecard
as shown in Figure 7.10. From the workshop proceedings and subsequent analysis, the
mission of infrastructure providers is defined to provide safe, secure, and reliable
infrastructure to the society. The vision of infrastructure providers is to become self-
sustainable in the future while providing adequate services to customers at minimum long-
term cost. Four identified strategic themes include: (1) meet regulatory requirements; (2)

233
provide a reliable and adequate infrastructure; (3) meet stakeholders’ expectations; and (4)
minimize long-term cost. The four proposed key perspectives for municipal infrastructure
management include: (1) social/political; (2) financial; (3) operational/technical; and (4)
regulatory. The social/political perspective takes into account the stakeholders – customers,
service providers, and governments – to address public safety, environmental protection, and
education issues. The objectives in financial perspective include developing long-term
financial plans and becoming financially self-sustainable. The regulatory perspective
specifies objectives such as to develop a better understanding of regulatory requirements, to
comply with regulatory requirements, and to create specifications for consistent reporting.
Operational and technical objectives include developing better understanding of systems’
performance and prediction models, adopting data QA/QC and better knowledge
management practices, and ensuring proper staff education/training.
The workshop fell short of specifying measures, targets, and initiatives to achieve the
objectives. These aspects are covered in the example framework discussed in the following
sections.
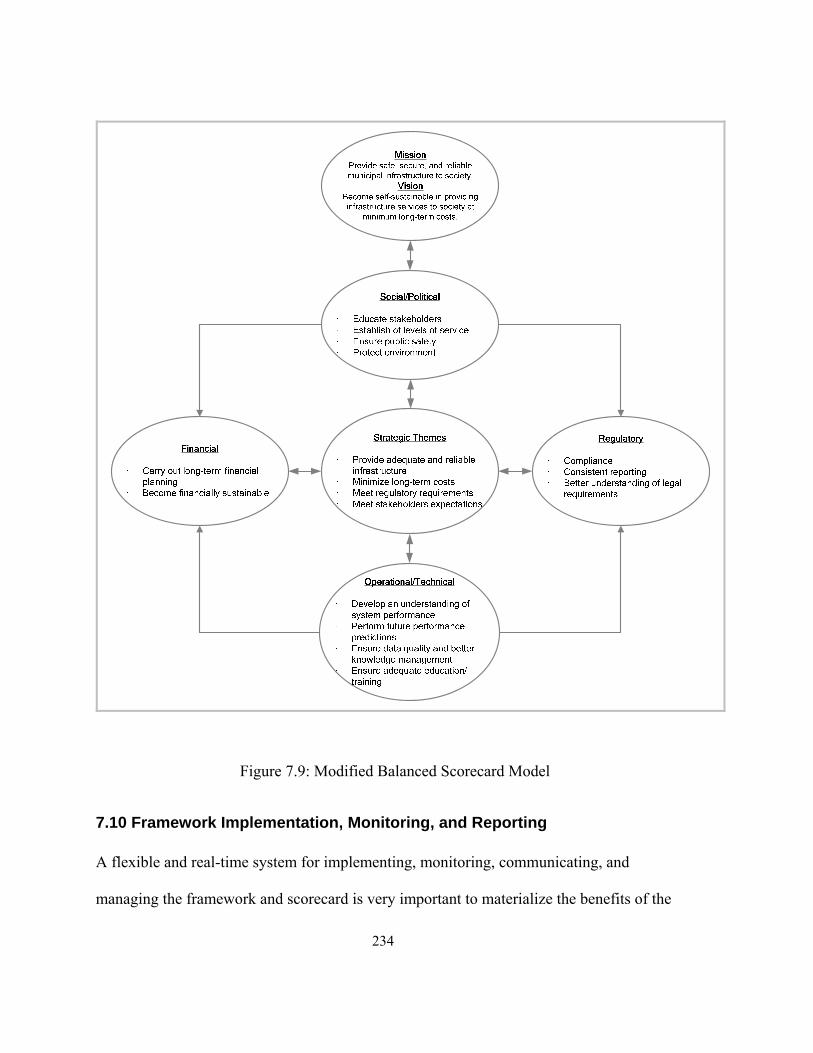
234
Figure 7.9: Modified Balanced Scorecard Model
7.10 Framework Implementation, Monitoring, and Reporting
A flexible and real-time system for implementing, monitoring, communicating, and
managing the framework and scorecard is very important to materialize the benefits of the

235
proposed methodology. For this purpose, data from various business units of the utility are to
be aggregated into a data warehouse. Data sources can include departmental information
systems from operations, planning and development, finance, infrastructure management,
projects and construction, and human resources. In-house or proprietary information
technology solutions can be employed to retrieve, store, and disseminate data and
information from various data servers. Tools such as Microsoft’s SharePoint Server and SQL
Server, Oracle’s Enterprise Performance Management and Business Intelligence, IBM’s
Cognos Scorecarding and Business Intelligence, SAP Strategic Enterprise Management, and
SAS Strategic Performance Management and Enterprise Intelligence can be used to develop
and implement balanced scorecards, manage strategy, and to monitor performance. Other
specialty performance and process management systems such as QPR ScoreCard and
Corporator Enterprise Performance Management Suite provide useful functionality to
manage strategy and operational performance. The software choice and system architecture
depends on particular circumstances and requirements of an organization. Specialty tools can
be inflexible and difficult to customize for particular utility needs. In-house development, on
the other hand, can be slow due to resource constraints. For communicating and reporting
performance, dashboard reporting is an indispensable tool. Dashboard reports provides
visual summary of critical data for efficient and effective decision making.
7.11 Example Framework
The modified balanced scorecard model is used to develop an example management
framework for the City of Niagara Falls wastewater collection utility. Due to data constraints

236
and the enormity of the scope of work involved, only operational/technical perspective is
described. The following paragraphs discuss the background information, and the
implementation of the proposed strategic management system.
7.11.1 The Situation
The City of Niagara Falls wastewater collection network consists of about 400 km of
pipelines with a total replacement value of approximately $250 million. Dwindling
inspection budgets in mid 80’s to mid 90’s made the task of network repair and replacement
prioritization next to impossible. The historic condition assessment data is virtually useless
due to data quality issues resulting from widely varying inspection and reporting practices
using Closed Circuit Television cameras. The integrated strategic management framework
described in this paper and implemented in the following paragraphs serves as a template and
guideline only.
7.11.2 Mission and Vision
The mission of the utility is to provide safe and secure disposal of water from domestic,
industrial, commercial, and public usage. The vision is to become self-sustainable to provide
reliable service to customers at a minimum cost.
7.11.3 Strategy
Provide adequate and reliable infrastructure at the minimum long-term cost while meeting
regulatory requirements and customer expectations.
237
Thus, the key strategic themes for the City of Niagara Falls wastewater utility include: (1)
meet regulatory requirements, (2) provide a reliable and adequate infrastructure, (3) meet
customers’ expectations, and (4) minimize long-term costs.
7.11.4 The Strategy Map
Figure 7.10 shows the strategy map of objectives for sustainable wastewater infrastructure
systems. Four perspectives, shown on the left side of the map, include: operational/technical,
social/political, regulatory, and financial. The strategic themes are highly interrelated. The
objectives in the operational/technical perspective will dictate/support how the goals in other
perspectives (i.e., social/political, regulatory, and financial) will be achieved. For example, in
social/political perspective, to ensure public health and safety and to protect environment,
current condition – structural, operational, and hydraulic – of wastewater collection network
needs to be ascertained. Similarly, in financial perspective, the objective to determine future
needs requires that models to understand performance behavior are developed as articulated
by objective OT3: Carry out performance modeling/future predictions in
operational/technical perspective.
The social/political perspective takes into account various stakeholders – customers and
regulatory agencies – that must be satisfied. The objectives of ensuring public health and
safety, protecting environment, and meeting customers’ expectations under this perspective
will ensure the utility’s focus on strategic themes. The financial objectives are drawn from
the mission and vision of wastewater utility, and are aligned with the strategic themes. To
carry out the mission of providing safe and secure disposal of wastewater and fulfill the
238
vision of financial sustainability in the long-run, the utility needs to assess real costs of
providing services, devise plans to reduce costs, and determine future financial needs to meet
stakeholders’ requirements. For example, the current water/wastewater rates, at many
utilities, only include operational costs and do not cover the cost of renovation of aging
infrastructure. Similarly, many households, which pay flat fee for water and wastewater
services, may be brought under metering systems to increase revenue. The objective for
regulatory perspective is to ensure that a utility meets all the regulatory requirements and is
accountable for its performance.
7.11.5 Modified Balanced Scorecard
The key strategic themes – meet financial and environmental regulatory requirements,
provide adequate and reliable infrastructure, meet customers’ expectations, and minimize
long-term costs – are included in the balanced scorecard. Initially, 14 strategic objectives are
identified as shown in Figure 7.10. The objectives are then related to the four identified
perspectives of municipal infrastructure management, and measures, targets, and initiatives
specified.
Performance Measures, Targets and Strategic Initiatives
The strategy map shown in Figure 7.10 provides an overview of the utility’s endeavors. The
objectives are translated into measures and targets to keep track of a utility’s performance.
Strategic initiatives which include plans and projects to achieve objectives are then proposed.

239
Table 7.2 presents an example of the development of modified BSC for a wastewater
collection system with objectives provided in the strategy map. Table 7.2 integrates strategic
objectives, and provides measures for the objectives, current and target values for the
measures, strategic initiatives, timelines, and resource requirements. As discussed earlier, the
presented perspectives, objectives, KPIs, and action plans are provided as a template, and
may be revised as deem fit by the utility. The purpose is to provide an example of generic
and systematic methodology to link objectives with action plans through KPIs to achieve the
strategic mission and vision of the utility.
To facilitate the implementation of the balanced scorecard, an example Data Definition Table
(DDT) is provided in Table 7.3 for some of the measures. The DDT defines a measure and
provides details such as: measure background – perspective under which it falls, strategic
theme, objective, and description; measure characteristics – type, frequency, measurement
unit, and polarity; calculation and data – formulae, data source, data quality; and performance
information – current/actual/achieved, target, rationale, and initiatives (Niven, 2005).
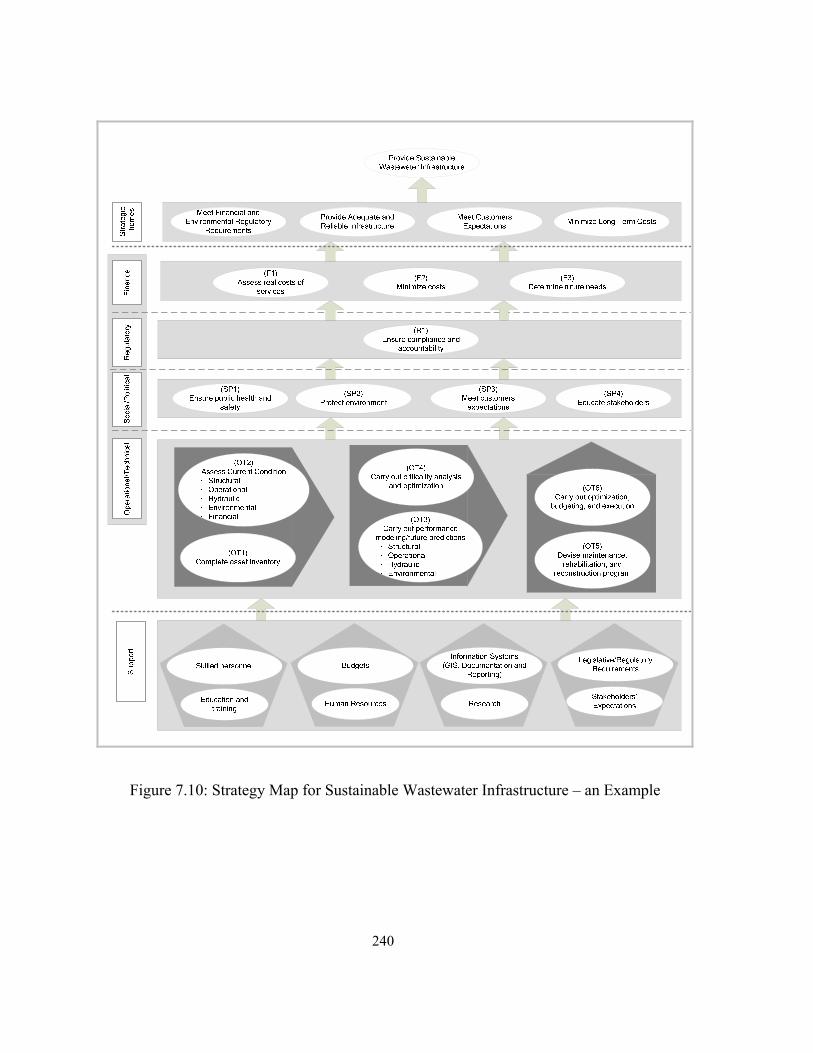
240
Figure 7.10: Strategy Map for Sustainable Wastewater Infrastructure – an Example
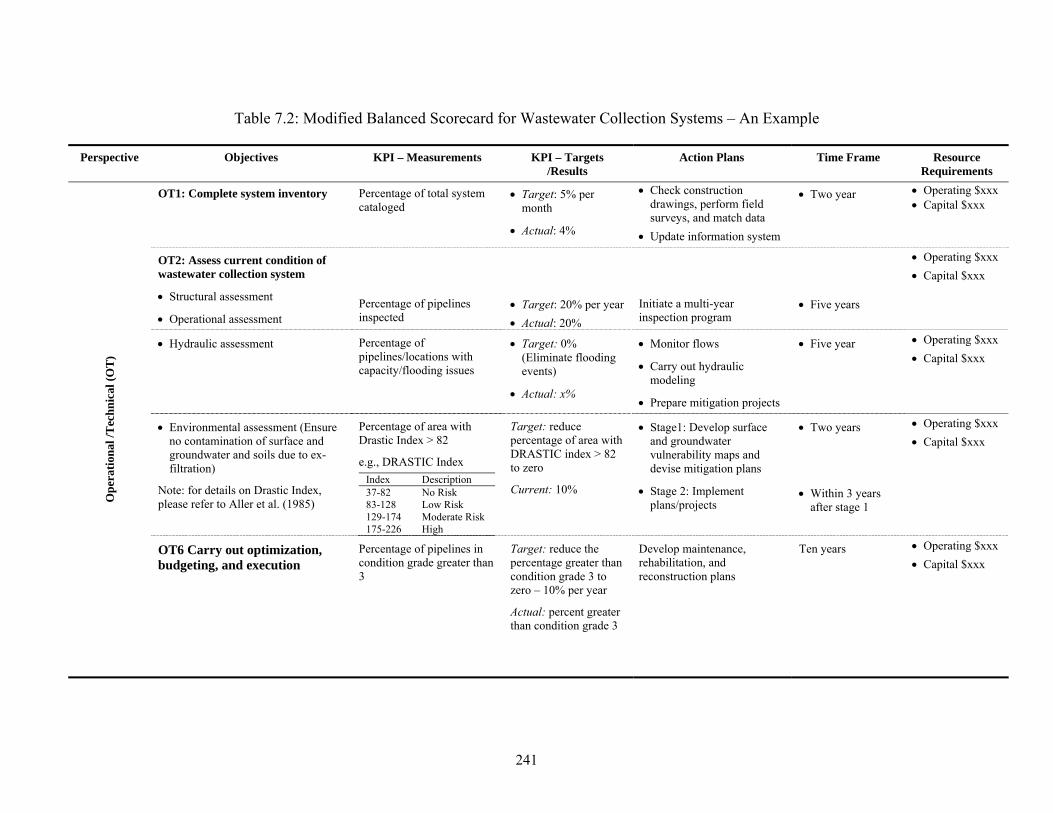
241
Table 7.2: Modified Balanced Scorecard for Wastewater Collection Systems – An Example
Perspective Objectives KPI – Measurements KPI – Targets /Results
Action Plans Time Frame Resource Requirements
Op
erat
ion
al /T
ech
nic
al (
OT
)
OT1: Complete system inventory Percentage of total system cataloged
Target: 5% per month
Actual: 4%
Check construction drawings, perform field surveys, and match data
Update information system
Two year Operating $xxx Capital $xxx
OT2: Assess current condition of wastewater collection system
Structural assessment
Operational assessment
Percentage of pipelines inspected
Target: 20% per year
Actual: 20%
Initiate a multi-year inspection program
Five years
Operating $xxx
Capital $xxx
Hydraulic assessment Percentage of pipelines/locations with capacity/flooding issues
Target: 0% (Eliminate flooding events)
Actual: x%
Monitor flows
Carry out hydraulic modeling
Prepare mitigation projects
Five year Operating $xxx
Capital $xxx
Environmental assessment (Ensure no contamination of surface and groundwater and soils due to ex-filtration)
Note: for details on Drastic Index, please refer to Aller et al. (1985)
Percentage of area with Drastic Index > 82
e.g., DRASTIC Index
Index Description 37-82 No Risk 83-128 Low Risk 129-174 Moderate Risk 175-226 High
Target: reduce percentage of area with DRASTIC index > 82 to zero
Current: 10%
Stage1: Develop surface and groundwater vulnerability maps and devise mitigation plans
Stage 2: Implement plans/projects
Two years
Within 3 years after stage 1
Operating $xxx
Capital $xxx
OT6 Carry out optimization, budgeting, and execution
Percentage of pipelines in condition grade greater than 3
Target: reduce the percentage greater than condition grade 3 to zero – 10% per year
Actual: percent greater than condition grade 3
Develop maintenance, rehabilitation, and reconstruction plans
Ten years Operating $xxx
Capital $xxx
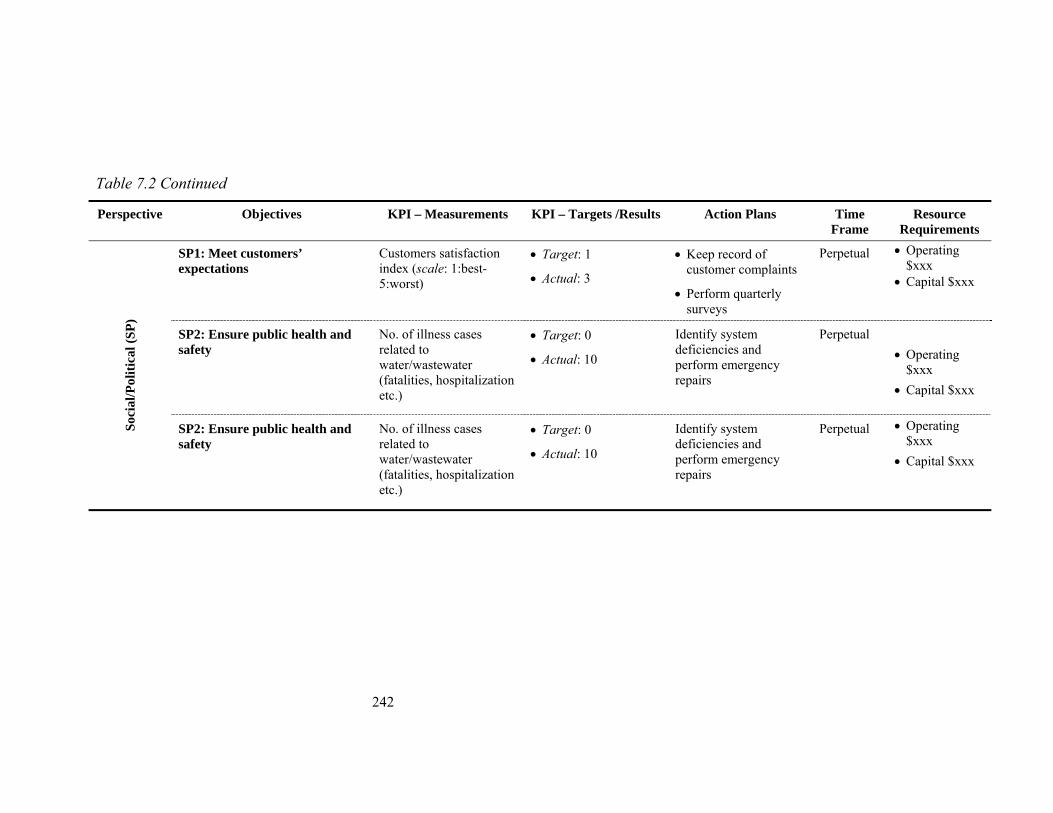
242
Table 7.2 Continued
Perspective Objectives KPI – Measurements KPI – Targets /Results Action Plans Time Frame
Resource Requirements
Soc
ial/
Pol
itic
al (
SP
)
SP1: Meet customers’ expectations
Customers satisfaction index (scale: 1:best-5:worst)
Target: 1
Actual: 3
Keep record of customer complaints
Perform quarterly surveys
Perpetual Operating $xxx
Capital $xxx
SP2: Ensure public health and safety
No. of illness cases related to water/wastewater (fatalities, hospitalization etc.)
Target: 0
Actual: 10
Identify system deficiencies and perform emergency repairs
Perpetual
Operating $xxx
Capital $xxx
SP2: Ensure public health and safety
No. of illness cases related to water/wastewater (fatalities, hospitalization etc.)
Target: 0
Actual: 10
Identify system deficiencies and perform emergency repairs
Perpetual Operating $xxx
Capital $xxx

243
Table 7.3: Data Definition Table
Objective: OT1 Complete system inventory Perspective: Operational/Technical Strategy Theme: Provide reliable and adequate infrastructure Measure: Percentage of total system cataloged. Weight: 5. Maximum Points: 50 (rating x weight) Formula:
Range Rating 91% - 100 % 10 81% - 90 % 9
… … 0% - 10% 1
Unit Type: Points Frequency: Quarterly Polarity: Higher values are good Description: This objective provides information regarding the size and scope of infrastructure such as total length, age, material type, depth, soil conditions, live and dead loads, and spatial characteristics. Initiatives: 1. Check construction drawings, perform field surveys, and match data
2. Update information system Objective: OT2 Assess current condition of wastewater collection system
Perspective: Operational/Technical
Strategy Theme: Provide reliable and adequate infrastructure Measures:
Structural condition Percentage of total system inspected. Weight: 5. Maximum Points: 50 (rating x weight). Use rating as in OT1.
Operational condition Percentage of total system inspected. Weight: 5. Maximum Points: 50 (rating x weight). Use rating as in OT1.
Hydraulic condition Percentage of pipelines/locations with capacity/flooding issues. Weight: 5. Maximum Points: 50 (rating x weight), Use rating as in OT1.
Environmental condition
Percentage of area with DRASTIC Index >82, Weight: 5. Maximum Points: 50 (rating x weight x area)
Example Index Description Rating Area
(%) Points
(RatingxAreaxWeight) 37-82 No Risk 10 50 30.0 83-128 Low Risk 7 10 3.5 129-174
Moderate Risk
5 10 2.5
175-226
High 1 20 1.0
Total 37
Unit Type: Points Frequency: Quarterly Polarity: Higher values are good Description: This objective is to assess the overall condition of the network. Initiatives: 1. Initiate a multiyear inspection program to collect quality condition assessment data.
2. Update information system. 3. Carry out hydraulic and environmental modeling.

244
Table 7.3 continued
Objective: OT3 Carry out performance modeling Perspective: Operational/Technical Strategy Theme: Provide reliable and adequate infrastructure Measure: Models exist for each of structural, operational, hydraulic, environment, financial; Weight: 2 for each; Maximum Points: 80 Formula:
Values Rating Yes 10 No 0
Unit Type: Points Frequency: Perpetual Polarity: Higher values are good Description: This objective provides estimates for future condition predictions. Initiatives: 1. Same as in objectives OT1 and OT2
2. Carry out modeling
Objective: OT4 Criticality analysis Perspective: Operational/Technical Strategy Theme: Provide reliable and adequate infrastructure Measure: Percentage length of pipelines with Hazard Rating Number (HRN) >10. Weight: 5. Maximum Points: 50 (rating x weight) Formula:
Example HRN Range Risk Rating Internal
Condition Grade
Percentage Points (RatingxPercentagexWeight)
0-1 Acceptable 10 1 40 20 1-5 Very low 8 2 10 4
5-10 Low 6 3 10 3 10-50 Significant 5 3 50-100 High 4 4
100-500 Very high 3 4 20 3 500-1000 Extreme 2 5
1000+ Unacceptable 1 5 20 1 Total 31
Unit Type: Points Frequency: Perpetual Polarity: Higher values are good Description: This objective provides an evidence of risk consideration, regulatory compliance, and helps in prioritizing. Initiatives: Carry out analysis using, for example, risk assessment or analytical hierarchy process
techniques and prioritize assets according to risk
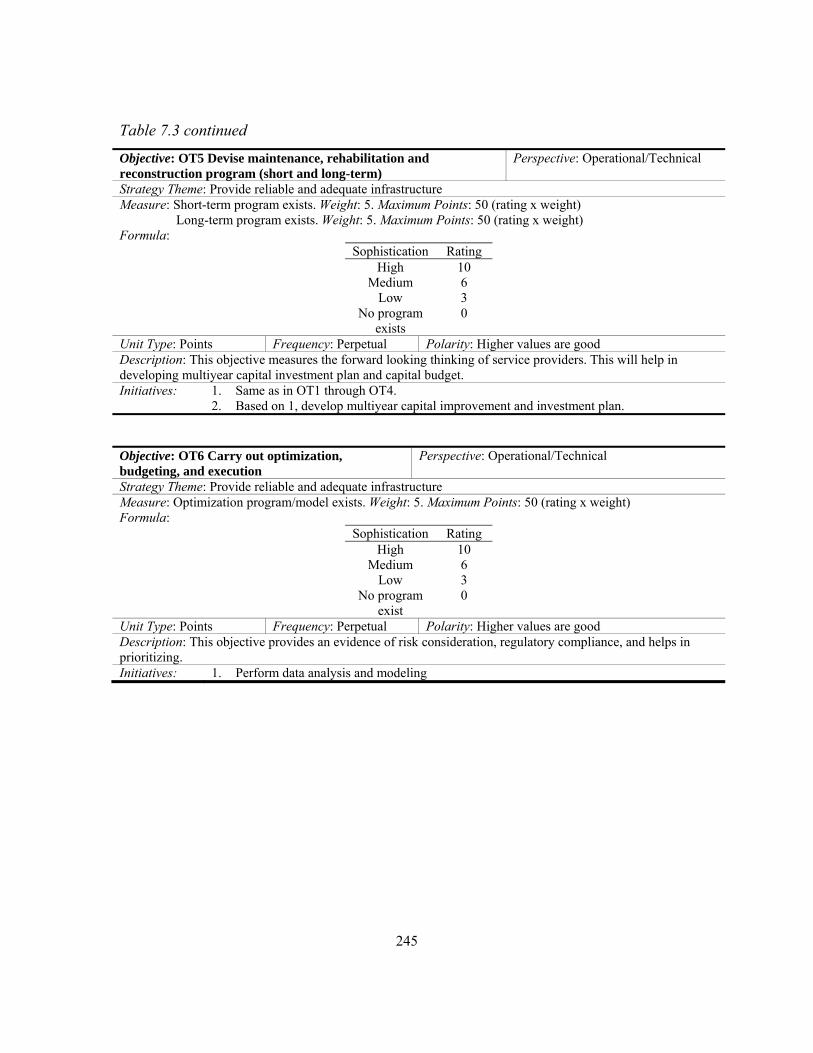
245
Table 7.3 continued
Objective: OT5 Devise maintenance, rehabilitation and reconstruction program (short and long-term)
Perspective: Operational/Technical
Strategy Theme: Provide reliable and adequate infrastructure Measure: Short-term program exists. Weight: 5. Maximum Points: 50 (rating x weight) Long-term program exists. Weight: 5. Maximum Points: 50 (rating x weight) Formula:
Sophistication Rating High 10
Medium 6 Low 3
No program exists
0
Unit Type: Points Frequency: Perpetual Polarity: Higher values are good Description: This objective measures the forward looking thinking of service providers. This will help in developing multiyear capital investment plan and capital budget. Initiatives: 1. Same as in OT1 through OT4.
2. Based on 1, develop multiyear capital improvement and investment plan. Objective: OT6 Carry out optimization, budgeting, and execution
Perspective: Operational/Technical
Strategy Theme: Provide reliable and adequate infrastructure Measure: Optimization program/model exists. Weight: 5. Maximum Points: 50 (rating x weight) Formula:
Sophistication Rating High 10
Medium 6 Low 3
No program exist
0
Unit Type: Points Frequency: Perpetual Polarity: Higher values are good Description: This objective provides an evidence of risk consideration, regulatory compliance, and helps in prioritizing. Initiatives: 1. Perform data analysis and modeling

246
7.11.6 Implementation, Monitoring, and Reporting
There are many possible system configurations for implementing, monitoring,
communicating, and managing the proposed framework. One such architecture is presented
in Figure 7.11 where data from various business units of the utility are aggregated into a data
warehouse. For the City of Niagara Falls, the example framework has been implemented
using QPR ScoreCard software. A sample metrics system is provided for each of the
objectives (refer to Table 7.3 and Table 7.4) to monitor the performance and progress within
each of the perspectives. For example, from Operational/Technical viewpoint, estimated
target score is 450 for a system to be sustainable as shown in Table 7.4.
The City of Niagara Falls, in 2005, embarked on a multi-year wastewater collection system
condition assessment program using the Side Scanner and Evaluation Technology. Figure
7.12 shows a sample dashboard report presenting the actual and target progress for objectives
OT1 and OT2 since the start of the project. The dial gauges represent the current
performance whereas line charts show the trend for the measures actual and target
performance. Using the proposed metrics and additional information on other initiatives at
the City, the total score in Operational/Technical perspective is estimated to be 232 as shown
in Table 7.5. Similarly, scores can be developed for other perspectives.

247
Figure 7.11: System Configuration for Strategic Management Framework
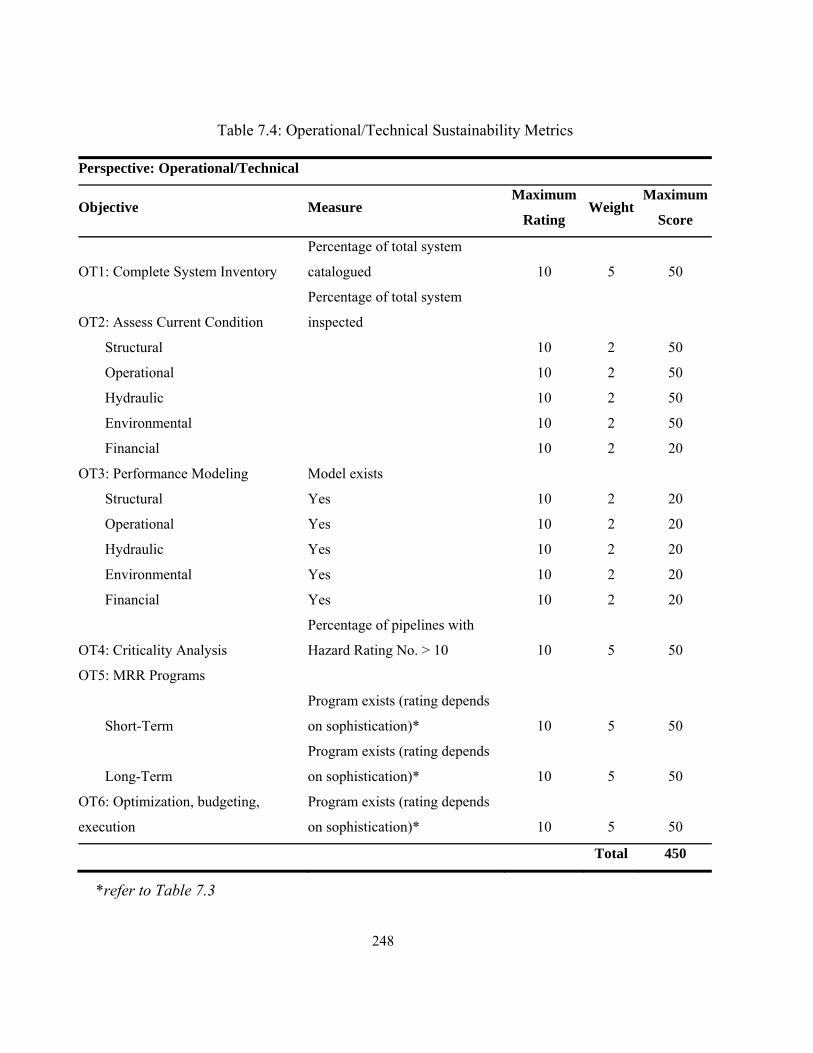
248
Table 7.4: Operational/Technical Sustainability Metrics
Perspective: Operational/Technical
Objective Measure Maximum
Rating Weight
Maximum
Score
OT1: Complete System Inventory
Percentage of total system
catalogued 10 5 50
OT2: Assess Current Condition
Percentage of total system
inspected
Structural 10 2 50
Operational 10 2 50
Hydraulic 10 2 50
Environmental 10 2 50
Financial 10 2 20
OT3: Performance Modeling Model exists
Structural Yes 10 2 20
Operational Yes 10 2 20
Hydraulic Yes 10 2 20
Environmental Yes 10 2 20
Financial Yes 10 2 20
OT4: Criticality Analysis
Percentage of pipelines with
Hazard Rating No. > 10 10 5 50
OT5: MRR Programs
Short-Term
Program exists (rating depends
on sophistication)* 10 5 50
Long-Term
Program exists (rating depends
on sophistication)* 10 5 50
OT6: Optimization, budgeting,
execution
Program exists (rating depends
on sophistication)* 10 5 50
Total 450
*refer to Table 7.3
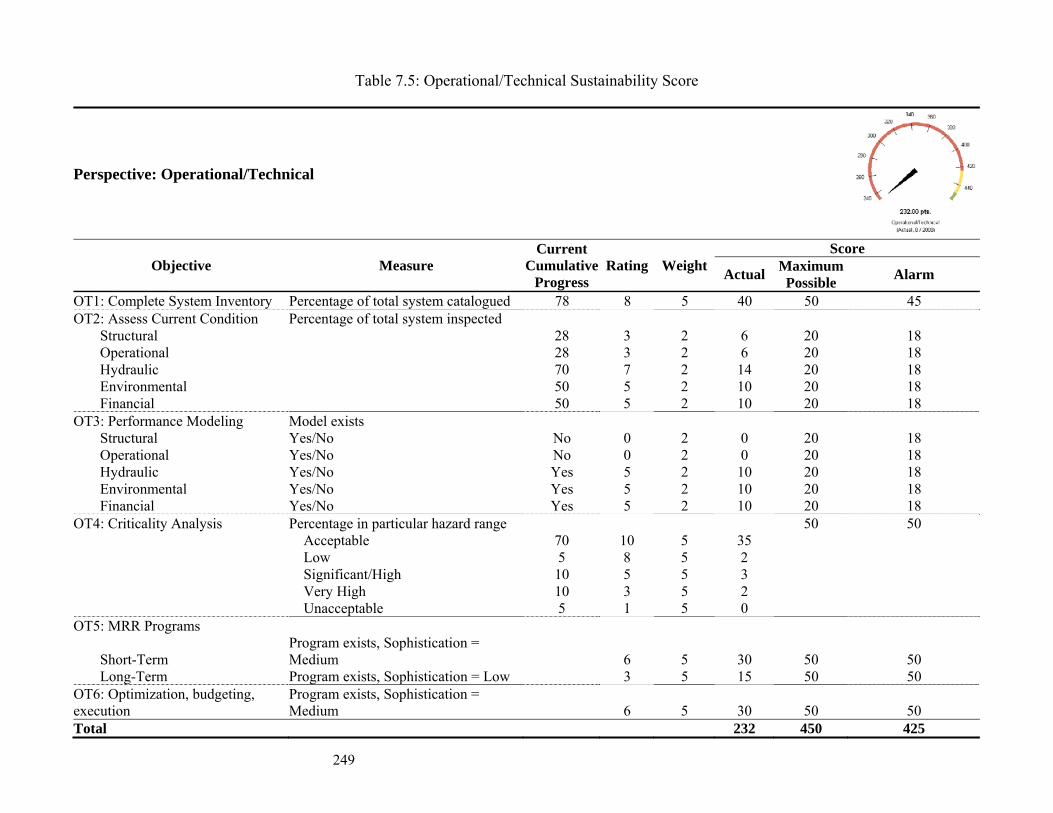
249
Table 7.5: Operational/Technical Sustainability Score
Perspective: Operational/Technical
Objective Measure Current
Cumulative Progress
Rating Weight Score
Actual Maximum Possible
Alarm
OT1: Complete System Inventory Percentage of total system catalogued 78 8 5 40 50 45 OT2: Assess Current Condition Percentage of total system inspected
Structural 28 3 2 6 20 18 Operational 28 3 2 6 20 18 Hydraulic 70 7 2 14 20 18 Environmental 50 5 2 10 20 18 Financial 50 5 2 10 20 18
OT3: Performance Modeling Model exists Structural Yes/No No 0 2 0 20 18 Operational Yes/No No 0 2 0 20 18 Hydraulic Yes/No Yes 5 2 10 20 18 Environmental Yes/No Yes 5 2 10 20 18 Financial Yes/No Yes 5 2 10 20 18
OT4: Criticality Analysis Percentage in particular hazard range 50 50 Acceptable 70 10 5 35 Low 5 8 5 2 Significant/High 10 5 5 3 Very High 10 3 5 2 Unacceptable 5 1 5 0
OT5: MRR Programs
Short-Term Program exists, Sophistication = Medium 6 5 30 50 50
Long-Term Program exists, Sophistication = Low 3 5 15 50 50 OT6: Optimization, budgeting, execution
Program exists, Sophistication = Medium 6 5 30 50 50
Total 232 450 425

250
Structural and Operational
Environmental
Figure 7.12: Part of the Example Dashboard
OT2: Assess Current
Condition
OT1: Complete System
Inventory

251
7.12 Conclusions
Despite ample published literature on asset management, the implementation of asset
management from strategic viewpoint is disappointing. An overwhelming number of utilities
either do not have asset management plans or they fail to execute their plans because of gaps
between strategy formulation and implementation. Half-hearted and incoherent asset
management implementation attempts result in abandonment of initiatives and lead to
failures in addressing fundamental infrastructure challenges. Some management tools, such
as benchmarking initiatives, are useful for diagnosing problems and identifying utilities that
need extra support. However, they are meaningless to assess and compare the real
performance of utilities because they evaluate heterogeneous systems and business processes.
Benchmarking is also useless in terms of predicting if the services will improve in the future
at participating organizations.
To overcome the issues with existing infrastructure management approaches, this paper
proposed a new integrated strategic management framework based on modified balanced
scorecard model for wastewater collection systems. The proposed framework helps in
aligning the asset management strategies with an organization’s mission and vision. By using
the proposed framework, gaps between strategy formulation and implementation become
obvious, and mitigating strategies can be formulated in real time.
The mission, vision, strategy, strategy map, and modified balanced scorecard presented in
this paper are meant to provide an example and guide for wastewater utilities. Due to the
enormity of the subject, the paper did not discuss all the perspectives in detail. Wastewater
252
Utilities, being heterogeneous organizations – that is, they have their own independent
business processes and organizational structures – may find it necessary to modify the
proposed model to suit their own circumstances.
Acknowledgments
The research presented in this paper is sponsored by the Canadian Water Network (CWN)
and Natural Sciences and Engineering Research Council of Canada (NSERC). The ongoing
research partners include the Centre for Advancement of Trenchless Technologies at the
University of Waterloo, the City of Niagara Falls, and Pipeflo Contracting Corp. Their
assistance is gratefully appreciated and acknowledged.
253
References
Aller, L., Bennett, T., Lehr, J., & Petty, R. (1985). DRASTIC: A standardized system for
evaluating ground water pollution potential using hydrogeologic settings. No.
EPA/600/2-85/018. Washington, D.C.: U.S. Environmental Protection Agency.
Retrieved from http://cfpub.epa.gov/si/si_public_record_Report.cfm?dirEntryID=35474
Bain & Company. (2009). Mission & vision. Retrieved July 10, 2009, from
http://www.bain.com/bainweb/Consulting_Expertise/capabilities_detail.asp?capID=92
Burke, J. (2005). Ontario's Municipal Performance Measurement Program: Fostering
innovation and accountability in local government. Government Finance Review, 21(3),
22-27.
CARE-S. (2008). Computer aided REhabilitation of sewer networks. Retrieved May, 15,
2008, from http://www.sintef.no/Projectweb/CARE-S/Objectives/
CARE-W. (2008). Computer aided REhabilitation of water networks. Retrieved May 10,
2008, from http://www.sintef.no/Projectweb/CARE-W/
Chenoweth, J., & Bird, J. (Eds.). (2005). The business of water and sustainable development.
Sheffield, UK: Greenleaf Publishing.
CNAM. (2009). Canadian national asset management working session. Retrieved
December/28, 2008, from http://www.cnam.ca/2007/results.htm
Dess, G. G., Lumpkin, G. T., & Peridis, T. (2006). Strategic management: Creating
competitive advantages (1st Canadian ed.). USA: McGraw-Hill Ryerson.
FCM, & NRC. (2003). Best practices for utility-based data. Ottawa, Canada: Federation of
Canadian Municipalities and National Research Council. Retrieved from
254
http://sustainablecommunities.fcm.ca/files/Infraguide/Integrated_Infrastructure/Best_Pra
ct_Utility_Based_Data.pdf
FHWA. (1999). Asset management primer (U.S. Department of Transportation. Retrieved
from http://www.fhwa.dot.gov/infrastructure/asstmgmt/amprimer.pdf
FHWA. (2000). Primer: GASB 34. USA: FHWA Office of Asset Management, U.S.
Department of Transportation.
Frangopol, D. M., Bruhwiler, E., Faber, M. H., & Adey, B. (Eds.). (2003). Life-cycle
performance of deteriorating structures: Assessment, design and management. USA:
American Society of Civil Engineers.
Gohier, L. (2006). InfraGuide and bill 175: A good fit. Retrieved August 4, 2006, from
http://www.owwa.com/activities/committee-detail.php?id=67
Grigg, N. S. (2003). Water, wastewater, and stormwater infrastructure management. Florida:
Lewis Publishers.
Halfawy, M. M. R., Newton, L. A., & Vanier, D. J. (2006). Review of commercial municipal
infrastructure asset management systems. Electronic Journal of Information Technology
in Construction, 1, 211-224.
Howard, A., Anketell, S., & Sung, T. (2001). Rehabilitation of deteriorated sewers by the
county sanitation districts of Los Angeles county. 107(40574) 70.
Hudson, W. R., Haas, R., & Uddin, W. (1997). Infrastructure management: Integrating
design, construction, maintenance, rehabilitation, and renovation. New York: McGraw-
Hill.
Kaplan, R. S., & Norton, D. P. (2004). Strategy maps: Converting intangible assets into
tangible outcomes. Massachusetts, USA: Harvard Business School Publishing
Corporation.

255
Kaplan, R. S. (1996). The balanced scorecard : Translating strategy into action. Boston,
Mass.: Harvard Business School Press.
Main, D., Ng, L., & North, A. (2006). The Canadian national water and wastewater
benchmarking initiative. Using process to drive improvement: Strategic management of
water in urban areas. Water Science & Technology: Water Supply, 6(5), 111-121.
Miller, G. (2008). Backgrounder: The municipal infrastructure deficit. Report No.
sinfrastructure1PFA-4172008-7676. Ottawa, Canada: Federation of Canadian
Municipalities. Retrieved from http://www.fcm.ca/CMFiles/sinfrastructure1PFA-
4172008-7676.pdf
Mirza, S. (2007). Danger ahead: The coming collapse of Canada's municipal infrastructure
No. FCM 1060E). Ottawa, ON, Canada: Federation of Canadian Municipalities.
NAMS. (2002). International Infrastructure Management Manual (2nd ed.). Australia:
Institute of Public Works Engineering.
Newton, L. A., & Vanier, D. J. (2005). Geographic Information Systems (GIS) and
interoperability of software for municipal infrastructure applications No. B-5123.4).
Ottawa, Canada: National Research Council.
Niven, P. R. (2005). Balanced scorecard diagnostics : Maintaining maximum performance.
Hoboken, N.J.: Hoboken, N.J. : Wiley.
NWWBI. (2009). National water & wastewater benchmarking initiative. Retrieved May 15,
2008, from http://www.nationalbenchmarking.ca/
OMBI. (2007). Implementation of accounting for tangible capital assets - reference manual.
Ontario, Canada: Sub-Committee of the Treasures Group OMBI. Retrieved from
http://www.ombi.ca/docs/db2file.asp?fileid=187
256
OMBI. (2008). Ontario municipal CAO's benchmarking initiative. Retrieved May 10, 2007,
from http://www.ombi.ca.proxy.lib.uwaterloo.ca/index.asp
Ontario Regulation 453/07 made Under the Safe Drinking Water Act 2002, (2007). Retrieved
from http://www.e-
laws.gov.on.ca.proxy.lib.uwaterloo.ca/html/source/regs/english/2007/elaws_src_regs_r0
7453_e.htm
PricewaterhouseCoopers. (2003). Analysis of asset management, accounting, finance and
pricing practices for municipal water and wastewater systems in Ontario. Ontario
Ministry of Finance.
Rigby, D., & Bilodeau, B. (2009). Management tools and trends 2009. Bain & Company.
Retrieved from
http://www.bain.com/bainweb/PDFs/cms/Public/Management_Tools_2009.pdf
Saegrov, S. (2006). CARE-S: Computer aided rehabilitation of sewer and storm water
networks. London, UK: IWA Publishing.
U.S. Environmental Protection Agency. (2009). About asset management. Retrieved June/27,
2009, from http://www.epa.gov/owm/assetmanage/index.htm
Wirahadikusumah, R., Abraham, D., & Iseley, T. (2001). Challenging issues in modeling
deterioration of combined sewers. Journal of Infrastructure Systems, 7(2), 77-84.
Woodhouse, J. (2009). Asset management: Latest thinking. Paper presented at the Building
Foundations 2009. Canadian Network of Asset Managers Workshop, Calgary, Canada.
Retrieved from http://www.cnam.ca/2009/pdf/Keynote-J.%20Woodhouse.pdf
WRc. (2001). Sewerage rehabilitation manual (Fourth ed.). Swindon, UK: Water Research
Centre.

257
Chapter 8
Strategic Financial Planning for Wastewater Collection Networks
Part 1: The Framework

258
8.1 Abstract
The issue of chronic under investment in urban infrastructure maintenance, rehabilitation and
replacement (M,R&R) and the resulting infrastructure deficit is well documented in civil
infrastructure management literature. This is partly attributed to poor understanding about
infrastructure performance behaviour and funding requirements. This paper – first of two
papers – presents a framework for strategic financial planning for wastewater collection
networks. The framework consisting of four interrelated components – that is, strategic
planning, system support, economic analysis and decision support – integrates wastewater
collection systems’ performance model and economic analysis principles to provide
sustainable wastewater collection system at desired service levels. A deterioration model is
proposed to predict service levels – in terms of internal condition grades of wastewater
collection pipelines – for alternative management scenarios over the planning horizon. The
cash flows and decision metrics are then established. A risk-based methodology
incorporating Monte Carlo simulations is proposed to take into account the variability in
input variables. The rehabilitation costs at different stages of life-cycle of wastewater
pipelines, lengths of pipelines in different condition grades and interest (discount) rates are
important input variables.
Strategic financial planning has long-term implications on the performance of public works
departments – responsible for providing wastewater infrastructure. The proposed framework
and methodology will help wastewater collection network administrators to proactively

259
maintain and manage their wastewater infrastructure and to estimate long-term M,R&R
funding requirements.
Keywords: Wastewater pipelines; Economic analysis, Monte Carlo simulations; Deterioration
modeling; Ordinal regression; Asset management; Sewer systems.

260
8.2 Introduction
Civil or urban infrastructure consists of capital intensive physical systems that provide
essential services such as transportation (pavements and bridges), utilities (water,
wastewater, hydro, gas, telephone), and buildings (offices, health and education facilities).
Wastewater collection networks – an important component of municipal civil infrastructure
systems – are responsible for safe and secure disposal of water from domestic, industrial, and
commercial usage. Aging pipelines, increased structural and operational defects due to
continual neglect, and additional demands due to population growth and new developments
pose latest challenges in providing these services. Due to financial constraints and competing
demands on limited resources it is vital for service providers – that is, public works
departments at municipal or regional level along with provincial and federal counterparts – to
provide, maintain and manage these systems in an effective, efficient, and sustainable
manner.
In Canada, the majority of wastewater collection networks are approaching the end of their
estimated service life of 75 to 100 years. Limited understanding about networks’
deterioration behaviour and lack of useful estimates about monetary requirements contributed
to the chronic under investments in the management and renewal of existing municipal
infrastructure systems (Lufkin et al., 2005). Historically, governments at all levels failed to
invest adequately into the maintenance, management, and rehabilitation of existing urban
infrastructure due to resource constraints (Miller, 2008; Mirza and Haider, 2003; Mirza,
2007). This has resulted in local governments resorting to balance their budgets by deferring

261
maintenance spending (Miller, 2008). Estimates of Canada’s municipal infrastructure deficit
vary from $44 billion total municipal infrastructure shortfall (TD Economics, 2002) to over
$125 billion (Mirza, 2007). The municipal infrastructure deficit is an estimate of the total
additional investment needed to repair and prevent deterioration in existing, municipally
owned infrastructure assets. Mirza (2007) reports that the infrastructure funding gap for
existing water and wastewater systems is $31 billion, and to meet new needs an additional
$56.6 billion is required. The size and scope of the infrastructure problems facing
municipalities and local governments is enormous as the decay of Canada’s infrastructure
creates severe domino effects – higher cost of maintenance, operation, rehabilitation, and
repair; inefficiency and increased vulnerability; and increased threats to public safety and the
environment. Mirza (2007) states that “without maintenance or with deferred maintenance,
the municipal infrastructure deficit could be close to $2 trillion by 2065, and that with regular
maintenance and good scientific management, the escalating infrastructure deterioration and
the resulting infrastructure deficit can be controlled within manageable levels.”
Budgetary shortfalls have placed public works departments under increased pressure to be
financially self-sustainable while at the same time meeting increased public fiscal scrutiny
and regulatory requirements. For example, in Ontario, Canada, Regulation 453/07 under Safe
Drinking Water Act, 2002, requires that current and future financial plans for water systems
sustainability must be prepared and made public to obtain operating permits. The Canadian
Institute of Chartered Accountants Public Sector Accounting Board (PSAB) issued statement
PS3150 in 2006 which requires all Canadian municipalities and utilities, starting in January
2009, to report their tangible capital assets along with their depreciation on financial
262
statements (OMBI, 2007). In the United States, the Governmental Accounting Standards
Board (GASB) Statement 34, and in Australia, the Australian Accounting Research
Foundation Standard 27 specifies similar accounting practices (see FHWA, 2000; Howard,
2001).
Strategic financial plans need to be developed to implement asset management strategy,
ascertain real costs of providing desired level of services, and achieve strategic objective of
providing sustainable wastewater collection networks. Strategic financial planning – an
integration of economic analysis principles with strategic planning process – can help in
urban infrastructure strategic management. It involves decision-making about significant
investments in long-lived assets, and has long-term impacts and implications on an
organization’s performance. To develop useful management plans, an understanding of
system performance behaviour – in terms of structural deterioration model(s) – of wastewater
collection systems is critical. This will enable wastewater service providers to assess the
timing and extent of capital expenditures, and hence develop a long-term fiscal policy to pro-
actively maintain and manage these systems.
This paper discusses a framework for strategic financial and rehabilitation/reconstruction
planning for wastewater collection systems based on service orientation principles. The
framework integrates strategic planning process with the performance and financial
simulation models to develop and analyze a range of possible strategies for effective
management of wastewater collection networks. Fundamental definitions/formulas for
economic analysis are provided, and Monte Carlo simulations are used to demonstrate the

263
impact of variability of input variables on decision metric(s). Part 2 of the series presents a
case study showing the application of performance model and financial simulation for
strategic financial and rehabilitation/reconstruction planning of wastewater collection
pipelines.
8.3 Overview of Economic Analysis for Wastewater Infrastructure Management
The literature on civil infrastructure life-cycle economic analysis and financial planning can
be broadly classified into two categories: (1) optimized selection of maintenance,
rehabilitation, and replacement (M,R&R) techniques with or without financial constraints;
and (2) strategic financial planning – that is, the identification of short- and long-term
funding needs and development of capital budgets. The work in strategic financial planning –
that is, the development of long-term financial plans for sustainable wastewater infrastructure
at network-level – is scarce. According to Lufkin et al. (2005), estimates of public
infrastructure restoration and modernization costs, at many organizations, are “based on ad
hoc approximations or historical trends,” and are not credible.
The most commonly used methods for infrastructure investment analysis include
Benefit/Cost Ratio, Internal Rate of Return, Equivalent Uniform Annual Costs, Cost-
Effectiveness, and Present Worth (Hudson et al., 1997). Haas et al. (2006) noted that Present
Worth method has been used exclusively in pavement management field. Markov Decision
Process (MDP) or Probabilistic Dynamic Programming (PDP) is another commonly used
technique for maintenance, management, and rehabilitation planning for transportation
(pavements and bridges) and water/wastewater infrastructure. According to Hillier and

264
Lieberman (1980), “MDP is a general model for PDP where stages [that is, condition grades
in case of civil infrastructure] continue to recur indefinitely.” In MDP applications,
deterioration is modeled as a finite-state Markov chain process with known or assumed state
transition probabilities. Alternative maintenance and rehabilitation policies – that is,
decisions and actions – and costs are specified for different condition grades of infrastructure
over the planning horizon. An optimal decision is then selected using linear programming or
policy improvement algorithms for each condition grade.
Considerable literature exists on the application of above methods for transportation
infrastructure management. The U.S. Department of Transportation, Federal Highway
Administration (FHWA) emphasizes the use of life-cycle costing analysis to quantify the
costs for alternative investments for new and existing transportation infrastructure (FHWA,
2002). NCHRP (2003) published a detailed report on life-cycle cost analysis for bridges. The
NCHRP report describes a procedure for the selection of cost-effective techniques for repair
and rehabilitation of bridges for short- and long-term planning. Haas (2007) highlighted the
need for new and better tools for Life-Cycle Cost Analysis (LCCA), and noted that the
selection of the best LCCA method for civil infrastructure depends on the application,
understanding, and consistency. Further details on published studies are provided in the
second paper of the two paper series.
8.4 Proposed Strategic Financial Planning Framework
Strategic planning is not new, and there is a considerable body of strategic planning literature
applicable to private, government and non-profit sectors. However, it is noted that strategic
265
planning theories and principles found limited application in wastewater infrastructure
management field. The proposed strategic financial planning framework comprises of four
interrelated components – that is, strategic planning, system support, economic analysis and
decision support – having 12 elements as illustrated in Figure 8.1 and detailed in Table 8.1.
The following sections discuss the proposed framework and provide basic definitions and
processes involved in strategic financial planning.
8.4.1 Strategic Planning
The strategic planning is a cyclic process that involves envisioning and describing a future,
assessing present situation, defining initiatives and key success factors, and identifying
desired programs and alternatives (Bryson, 2004). Figure 8.1 shows the four basic elements
of strategic planning component, that include: (1) vision, mission and goals; (2) situation
analysis; (3) decision metrics; and (4) desired scenarios and programs/initiatives.
Vision, Mission, and Goals
Vision defines an organization’s desired future – that is, what it wants to ultimately achieve;
whereas, mission describes business(s) that an organization intends to pursue (Dess et al.,
2006). According to Dess et al. (2006) and Thompson (1998), sometimes vision and mission
are used interchangeably; however, vision is the foundation of mission. Developing vision
and mission statements, as well as, creation of goals and specific objectives are the first step
in the strategic planning process. Many municipalities have developed vision and mission
statements and identified programs/actions, but they usually fall short on implementing their
strategy due to lack of knowledge, incomplete information, and insufficient resources.
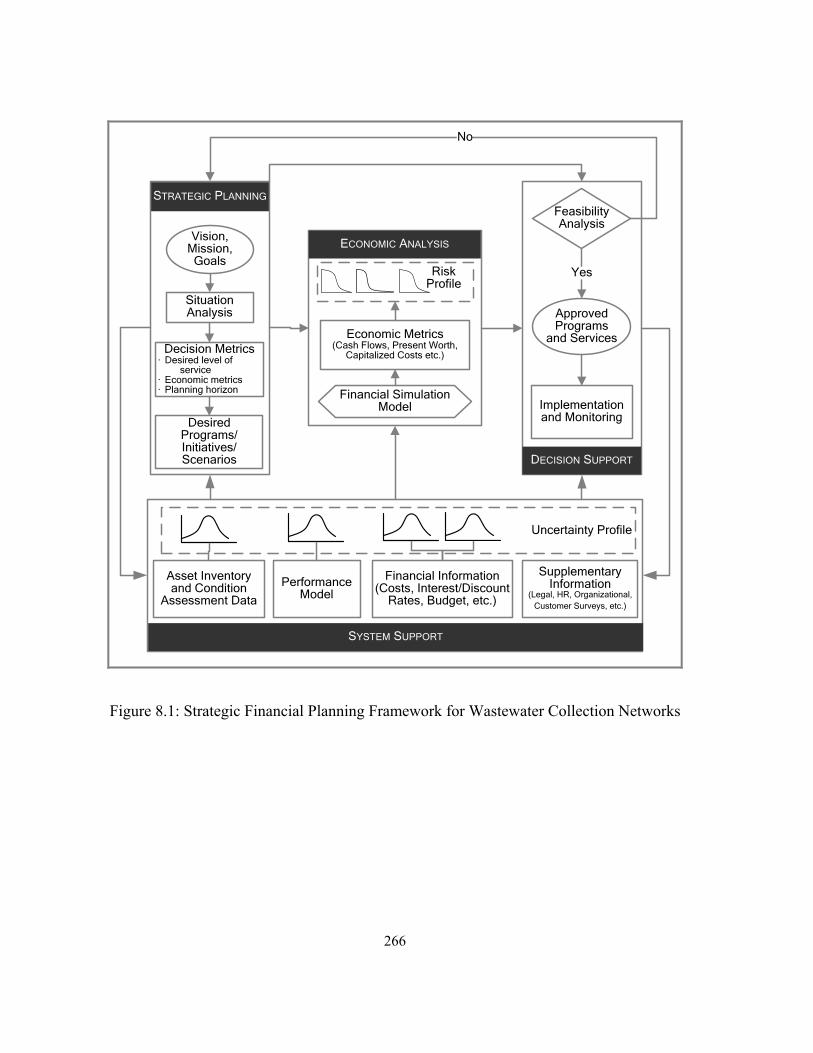
266
STRATEGIC PLANNING
Decision Metrics· Desired level of
service· Economic metrics· Planning horizon
Desired Programs/Initiatives/Scenarios
Vision, Mission,
Goals
Asset Inventory and Condition
Assessment Data
Financial Information (Costs, Interest/Discount
Rates, Budget, etc.)
Performance Model
Economic Metrics (Cash Flows, Present Worth,
Capitalized Costs etc.)
Financial Simulation Model
Feasibility Analysis
Approved Programs
and Services
Implementation and Monitoring
Situation Analysis
Uncertainty Profile
Risk Profile
Yes
No
SYSTEM SUPPORT
ECONOMIC ANALYSIS
DECISION SUPPORT
Supplementary Information
(Legal, HR, Organizational, Customer Surveys, etc.)
Figure 8.1: Strategic Financial Planning Framework for Wastewater Collection Networks
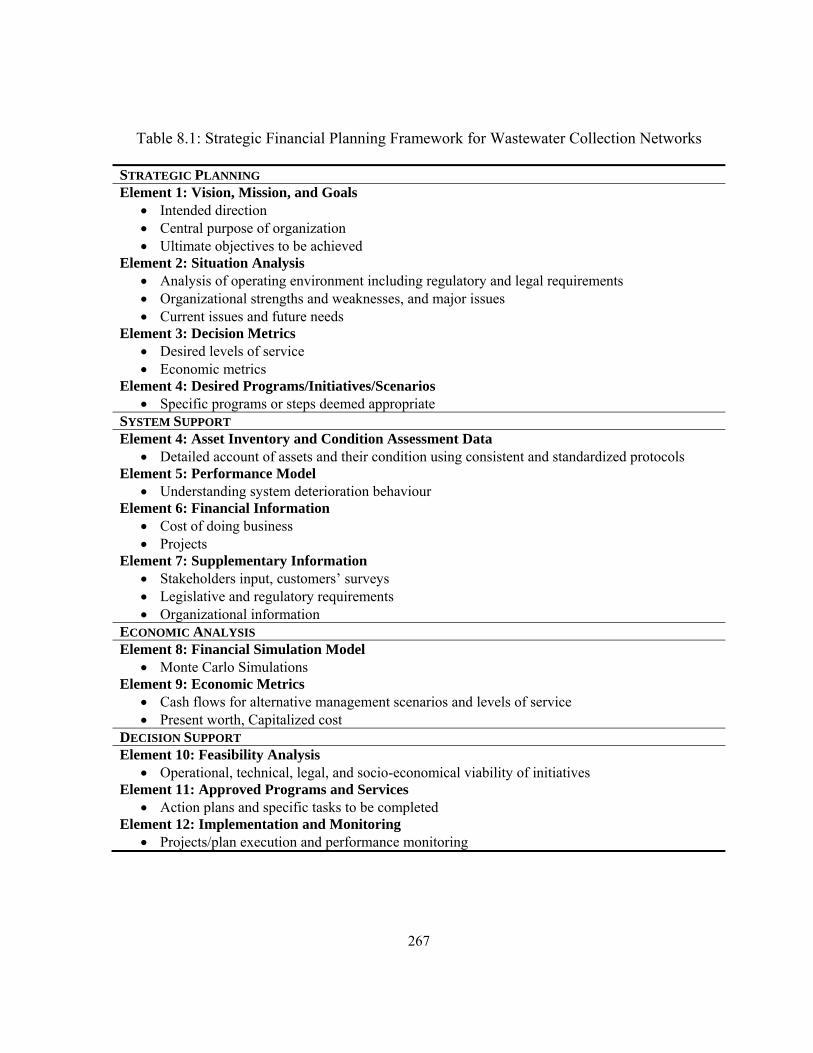
267
Table 8.1: Strategic Financial Planning Framework for Wastewater Collection Networks
STRATEGIC PLANNING Element 1: Vision, Mission, and Goals
Intended direction Central purpose of organization Ultimate objectives to be achieved
Element 2: Situation Analysis Analysis of operating environment including regulatory and legal requirements Organizational strengths and weaknesses, and major issues Current issues and future needs
Element 3: Decision Metrics Desired levels of service Economic metrics
Element 4: Desired Programs/Initiatives/Scenarios Specific programs or steps deemed appropriate
SYSTEM SUPPORT Element 4: Asset Inventory and Condition Assessment Data
Detailed account of assets and their condition using consistent and standardized protocols Element 5: Performance Model
Understanding system deterioration behaviour Element 6: Financial Information
Cost of doing business Projects
Element 7: Supplementary Information Stakeholders input, customers’ surveys Legislative and regulatory requirements Organizational information
ECONOMIC ANALYSIS Element 8: Financial Simulation Model
Monte Carlo Simulations Element 9: Economic Metrics
Cash flows for alternative management scenarios and levels of service Present worth, Capitalized cost
DECISION SUPPORT Element 10: Feasibility Analysis
Operational, technical, legal, and socio-economical viability of initiatives Element 11: Approved Programs and Services
Action plans and specific tasks to be completed Element 12: Implementation and Monitoring
Projects/plan execution and performance monitoring

268
Situation Analysis
The purpose of situation analysis is to assess current operating environment, identify present
and future trends, perform needs analysis and discover gaps. Part of situation analysis
involves carrying out a SWOT (Strengths, Weaknesses, Opportunities, and Threats) analysis.
As shown in Figure 8.1, System Support component of the proposed framework provides
necessary data and information for performing this task.
Decision Metrics
Decision metrics are the measures against which organizational and system performance or
projects’ outcomes are evaluated (Greenberg, 2003). To assess alternatives, multiple decision
metrics, such as desired and/or agreed level of service and economic metrics (i.e., present
value, capitalized costs) can be applied. Additional metrics, e.g., environmental indices, can
also be included.
Desired and/or Agreed Level of Service
Level of service (LOS) can be defined as operational standards desired and/or need to be
maintained by a wastewater collection service provider in consultation with various
stakeholders. The stakeholders may include customers and federal, provincial and municipal
governments and regulators. Although, there have been attempts to devise performance
indicators for wastewater collection systems (see for e.g., Ashley and Hopkinson, 2002;
Burke, 2005; Cox et al., 2003; Crotty, 2003; Lafferty and Lauer, 2005), there are no known,
established levels of service for wastewater collection systems. For illustration, WRc’s

269
(Water Research Centre, UK) structural internal condition grades are considered as the levels
of service in this framework; although, additional service measures may be devised.
WRc specified four performance perspectives, namely, hydraulic, environmental, structural
and operational. Majority of the hydraulic and environmental issues, such as overflows,
surcharging and infiltration/exfiltration, result from structural and operational defects (e.g.,
open joints, cracks, fractures, holes, broken pipe segments, grease, debris, roots, blockages
etc.,) provided there is adequate flow capacity in system. Therefore, considering structural
internal condition grades as a metric for service level is plausible. Table 8.2 shows the
WRc’s structural internal condition grades and their implications.
Economic Metrics
A wide variety of financial performance metrics are available depending upon an
organization’s objectives. According to Greenberg (2003), economic metrics can be
classified into cost- and price-based decision measures, and multiple metrics are employed in
government and private sectors. Greenberg (2003) further argued that cost-based metrics
(e.g., net present value) seek cost minimization and are most suitable for governmental
service providers, whereas price-based metrics (e.g., return on investment) seek profit
maximization and are generally employed by private sector. For illustration, present worth is
selected as an economic metrics. Present worth and additional economic metrics are further
detailed in Section 8.4.3.

270
Planning Horizon (Life-Cycle Analysis Period) and Co-termination
Planning horizon – finite or infinite – is the time under study. Different project alternatives or
scenarios can have different life-cycles. Therefore, for valid comparisons of competing
alternatives, it is important to have same planning horizon (Hudson et al., 1997; Lang and
Merino, 1993). Co-termination is used to provide common planning horizon for competing
alternatives. Lang and Merino (1993) discussed: (1) The Lowest-Common-Multiple; and (2)
Early-Sale, co-termination methods in detail. Another option to co-terminate different project
alternatives is to consider an infinite planning horizon. According to Lang and Merino
(1993), the assumption of infinite life for long-lived assets simplifies the analyses and results
in negligible error in computations.
Wastewater pipelines are long-lived assets, and therefore, capital investment plans, budgeting
decisions and cash flows may spread over many years. For wastewater pipelines, the life-
cycle can be in the range of 50 to over 100 years (Hudson et al., 1997; NAMS, 2002; Younis
and Knight, 2009).
Desired Programs/Initiatives/Scenarios
This involves articulating specific programs and alternate scenarios for further analyses. For
example, an organization may contemplate between options, such as replacing all grade 5
(i.e., collapsed or nearly collapsed) sewers versus replacing grade 5 and renovating grade 4
(i.e., pipes having major defects e.g., multiple fractures, holes etc.) pipes. After economic and
feasibility analyses, some programs or initiatives may turn out to be unfeasible and need
271
revision. For example, it is possible that logistics for a desired imitative may not be practical
due to financial limitations, or technical and socio-political reasons.
8.4.2 System Support
The system support provides necessary data and information – that include, inventory and
condition, performance, environmental, statutes and regulatory law, stakeholders’ input, and
financial – for carrying out situation/gap analysis, developing an understanding of systems’
performance, and performing out life-cycle analysis.
Asset Inventory and Condition Assessment Data
Remotely controlled Closed Circuit Television (CCTV) and more recently Side Scanning
Evaluation Technology (SSET) cameras also known as Sewer Scanner and Evaluation
Technology (SSETTM) are used for visual inspections of interior of wastewater pipelines.
Pipeline inspections are completed by an operator remotely moving the camera down the
pipeline and coding all observed defects using a defect condition coding system. In North
America, two wastewater pipeline defect condition Classification systems are predominately
used: (1) Manual of Sewer Condition Classification (MSCC) 3rd edition defect coding
system developed by Water Research Center (WRc) in the United Kingdom; and (2) Pipeline
Assessment and Certification Program (PACP) developed by National Association of Sewer
Service Companies (NASSCO) and WRc.
The Manual of Sewer Condition Classification, first published in 1980, became the national
standard in the UK and many other parts of the world. In 1994 and 2004, the 3rd and 4th

272
editions of MSCC were published by WRc, respectively. In 1994, the North American
Association of Pipeline Inspectors (NAAPI) adopted WRc’s MSCC 3rd edition and
developed a certification program for CCTV operators and reviewers. In 2002, NASSCO
published PACP to meet the needs of the United States. The Sewerage Rehabilitation Manual
(SRM), also published by WRc, describes a wastewater pipelines renovation decision-
making process that is adopted in the United Kingdom and Canada. The first edition of the
SRM was published in 1986 and the current fourth edition was published in 2001.
The SRM determines the structural and operational performance of wastewater pipelines by
assigning scores to MSCC defects based on their type and severity. The structural defect
scores are transformed – based on pipeline’s peak defect score – to structural Internal
Condition Grade (ICG) of 1 to 5, with 1 being the best or acceptable and 5 being the worst or
near collapsed state. Table 8.2 provides a summary of implications for each internal
condition grade. The continued use of the SRM methodology, in United Kingdom and
Canada since 1994, validates the methodology as an acceptable and good approach for
determining pipeline current condition states. The general principles of the SRM also form
the basis for the European Standard EN752-5 – Drain and Sewer Systems Outside Buildings:
Part 5 Rehabilitation. This further validates the SRM approach and provides the rationale for
considering ICG as potential service levels in addition to other criteria.

273
Table 8.2: Internal Condition Grades (WRc, 2001)
Grade Implication
5 Collapsed or collapse imminent
4 Collapse likely in foreseeable future
3 Collapse unlikely in near future but further deterioration likely
2 Minimal collapse likelihood in short term but potential for further
deterioration
1 Accepted structural condition
Performance Model
Performance models reveal degradation behaviour of physical infrastructure systems and
provide estimates of their service lives. According to Hudson, Hass et al. (1997), “a
performance model relates a selected performance indicator to a set of causal variables such
as age, load, load repetitions, usage history, material properties, environmental factors, and
M,R&R (maintenance, rehabilitation and reconstruction) history.”
Performance models are one of the most important components of infrastructure strategic
management and life-cycle analyses. For wastewater pipelines, the performance behaviour
can be affected by factors, such as, age, material, design and construction practices, and
operating environments (Ariaratnam et al., 2001; Baik et al., 2006; Hudson et al., 1997;
Younis and Knight, 1999).
Depending upon modeling objectives, study design and data, various statistical techniques
can be applied to develop useful performance models (see for example, Chapters 5, 6 and 7).
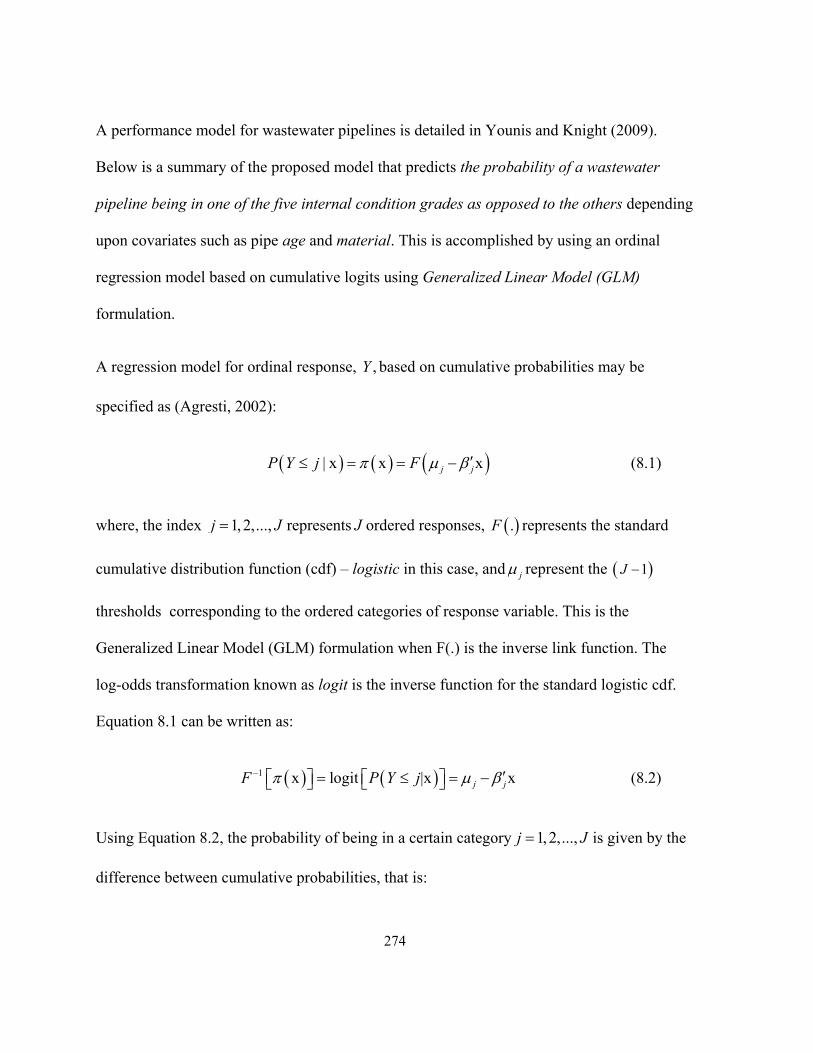
274
A performance model for wastewater pipelines is detailed in Younis and Knight (2009).
Below is a summary of the proposed model that predicts the probability of a wastewater
pipeline being in one of the five internal condition grades as opposed to the others depending
upon covariates such as pipe age and material. This is accomplished by using an ordinal
regression model based on cumulative logits using Generalized Linear Model (GLM)
formulation.
A regression model for ordinal response, ,Y based on cumulative probabilities may be
specified as (Agresti, 2002):
| x x xj jP Y j F (8.1)
where, the index 1,2,...,j J represents J ordered responses, .F represents the standard
cumulative distribution function (cdf) – logistic in this case, and j represent the 1J
thresholds corresponding to the ordered categories of response variable. This is the
Generalized Linear Model (GLM) formulation when F(.) is the inverse link function. The
log-odds transformation known as logit is the inverse function for the standard logistic cdf.
Equation 8.1 can be written as:
1 x logit |x xj jF P Y j (8.2)
Using Equation 8.2, the probability of being in a certain category 1,2,...,j J is given by the
difference between cumulative probabilities, that is:
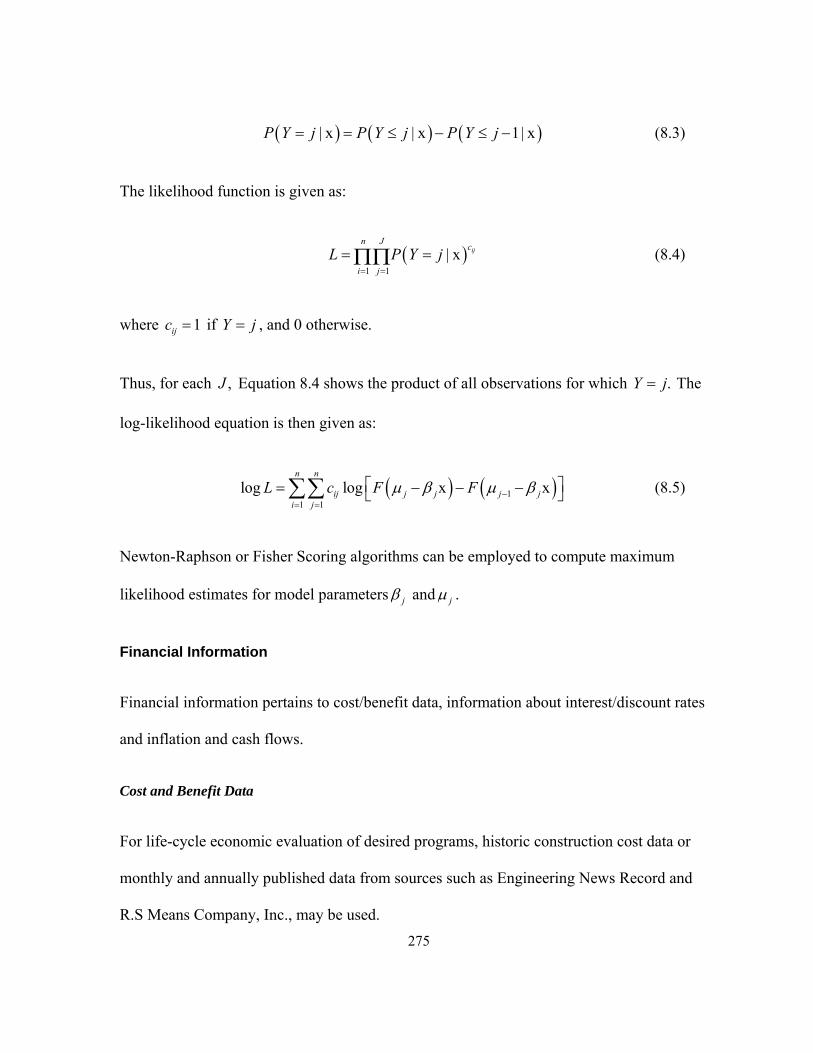
275
| x | x 1| xP Y j P Y j P Y j (8.3)
The likelihood function is given as:
1 1
| x ijn J
c
i j
L P Y j
(8.4)
where 1ijc if Y j , and 0 otherwise.
Thus, for each ,J Equation 8.4 shows the product of all observations for which .Y j The
log-likelihood equation is then given as:
11 1
log log x xn n
ij j j j ji j
L c F F
(8.5)
Newton-Raphson or Fisher Scoring algorithms can be employed to compute maximum
likelihood estimates for model parameters j and j .
Financial Information
Financial information pertains to cost/benefit data, information about interest/discount rates
and inflation and cash flows.
Cost and Benefit Data
For life-cycle economic evaluation of desired programs, historic construction cost data or
monthly and annually published data from sources such as Engineering News Record and
R.S Means Company, Inc., may be used.

276
Interest/Discount Rate and Inflation
According to Hudson et al. (1997), many agencies look at a range of discount rates and use
inflation adjusted discount rate – that is, the difference between borrowing or investing
interest rate minus inflation – for comparing infrastructure investment alternatives. Hudson et
al. (1997) argued that “inflation should only be used for setting real discount rates” in
economic analysis for infrastructure management systems, and that considering inflation as
an additional factor does not result in better selection of alternatives. The study by
Wirahadikusumah and Abraham (2003) found that optimal maintenance and rehabilitation
alternatives were not affected by inflation and interest rates.
Cash Flows – Timing and Compounding
End-of-year cash flows assumption is commonly used in economic analysis. Lang and
Merino (1993) state that the error due to this assumption is negligible and does not distort the
results. Another common practice in economic analysis is to use discrete cash flows with
discrete compounding for preliminary studies (Lang and Merino, 1993). However, discrete
cash flows with continuous compounding or continuous cash flows with continuous
compounding are also possible.
End-of-year discrete cash flows and discrete compounding are proposed for financial
analysis in this framework. According to Lang and Merino (1993), cash flows far into the
future do not significantly contribute to present worth, and therefore, the discrete cash flows
assumption is plausible for restoration/rehabilitation costs.
277
Supplementary Information
Scope of Work
The pipe lengths to be rehabilitated during a specified period (e.g., per year or per five year
etc.) over the life-cycle analysis horizon need to be estimated using the deterioration model.
However, actual rehabilitated length during each period may vary, and may be assumed to
follow a particular distribution (e.g., normal) with upper and lower bounds set for alternative
management scenarios, for example, as: (1) predicted length in internal condition grades 4
and 5 20% for management scenario 1; and (2) predicted length in internal condition
grades 3, 4, and 5 20% for management scenario 2, and so on.
Stakeholders’ Input and Education
One of the most critical and important elements to provide sustainable wastewater collection services
involves the determination levels of service and associated costs. The stakeholders need to know and
agree upon cost of service and related service levels. This may also require revamping of accounting
systems to estimate actual costs of providing wastewater collection services. Bryson (2004) discussed
more than a dozen techniques and models for stakeholders’ identification, consultation and analysis,
which may be useful to obtain stakeholders’ input, resolving conflicts and consensus building.
8.4.3 Economic Analysis
Economic analysis supports decision-making related to allocation of resources for
infrastructure management initiatives. The economic analysis techniques may be classified as
(Crundwell, 2008; Dayananda et al., 2002; Outreville, 1998): (1) discounted cash flow (e.g.,
net present value, internal rate of return); and (2) non-discounted cash flows (e.g., payback
period, accounting rate of return). According to Crundwell (2008); Dayananda et al. (2002);
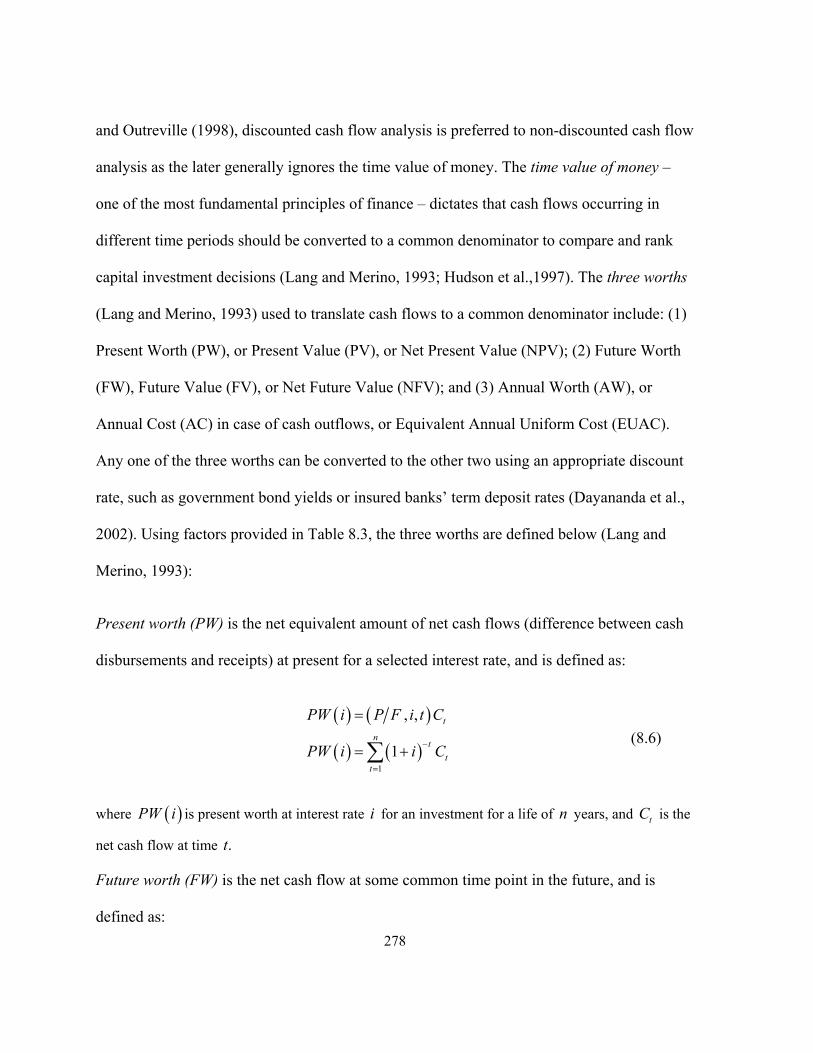
278
and Outreville (1998), discounted cash flow analysis is preferred to non-discounted cash flow
analysis as the later generally ignores the time value of money. The time value of money –
one of the most fundamental principles of finance – dictates that cash flows occurring in
different time periods should be converted to a common denominator to compare and rank
capital investment decisions (Lang and Merino, 1993; Hudson et al.,1997). The three worths
(Lang and Merino, 1993) used to translate cash flows to a common denominator include: (1)
Present Worth (PW), or Present Value (PV), or Net Present Value (NPV); (2) Future Worth
(FW), Future Value (FV), or Net Future Value (NFV); and (3) Annual Worth (AW), or
Annual Cost (AC) in case of cash outflows, or Equivalent Annual Uniform Cost (EUAC).
Any one of the three worths can be converted to the other two using an appropriate discount
rate, such as government bond yields or insured banks’ term deposit rates (Dayananda et al.,
2002). Using factors provided in Table 8.3, the three worths are defined below (Lang and
Merino, 1993):
Present worth (PW) is the net equivalent amount of net cash flows (difference between cash
disbursements and receipts) at present for a selected interest rate, and is defined as:
1
, ,
1
t
nt
tt
PW i P F i t C
PW i i C
(8.6)
where PW i is present worth at interest rate i for an investment for a life of n years, and tC is the
net cash flow at time .t
Future worth (FW) is the net cash flow at some common time point in the future, and is
defined as:
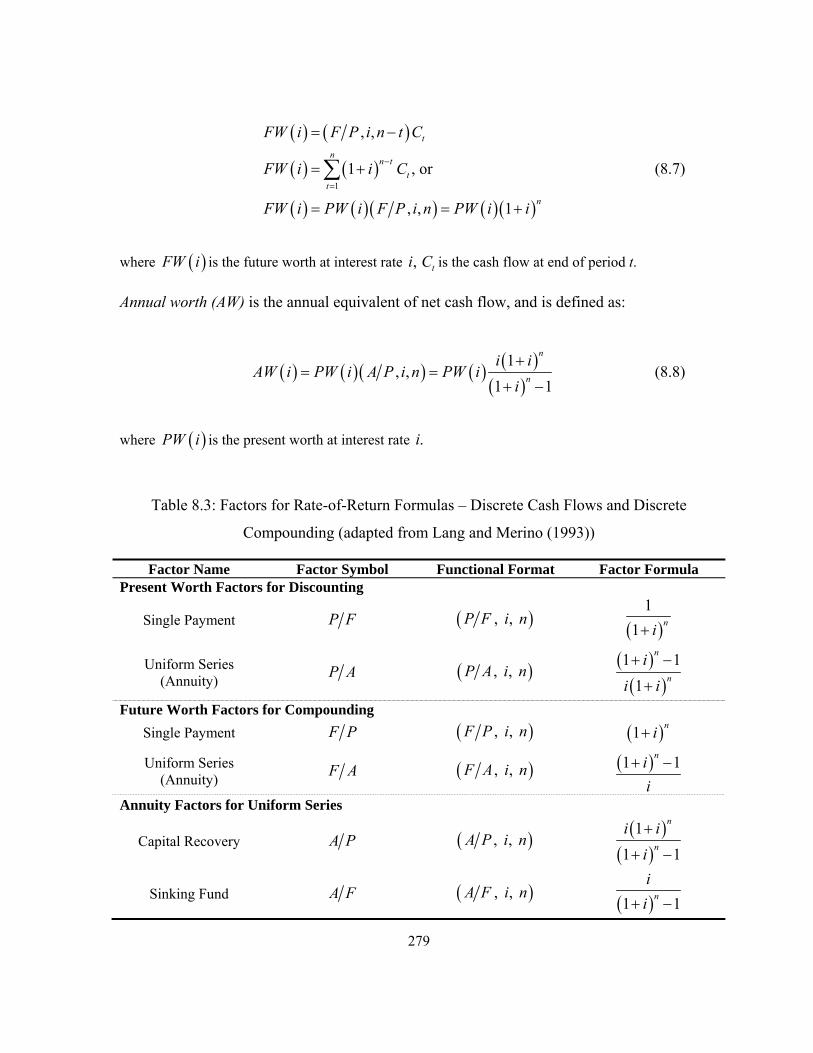
279
1
, ,
1 , or
, , 1
t
nn t
tt
n
FW i F P i n t C
FW i i C
FW i PW i F P i n PW i i
(8.7)
where FW i is the future worth at interest rate ,i tC is the cash flow at end of period t.
Annual worth (AW) is the annual equivalent of net cash flow, and is defined as:
1, ,
1 1
n
n
i iAW i PW i A P i n PW i
i
(8.8)
where PW i is the present worth at interest rate .i
Table 8.3: Factors for Rate-of-Return Formulas – Discrete Cash Flows and Discrete
Compounding (adapted from Lang and Merino (1993))
Factor Name Factor Symbol Functional Format Factor Formula Present Worth Factors for Discounting
Single Payment P F , , P F i n
1
1n
i
Uniform Series (Annuity)
P A , , P A i n
1 1
1
n
n
i
i i
Future Worth Factors for Compounding
Single Payment F P , , F P i n 1n
i
Uniform Series (Annuity)
F A , , F A i n
1 1n
i
i
Annuity Factors for Uniform Series
Capital Recovery A P , , A P i n
1
1 1
n
n
i i
i
Sinking Fund A F , , A F i n 1 1
n
i
i

280
Financial Simulation Modeling
The variability in input variables (i.e., cash flows, interest rates, and forecasted scope of
renovation/replacement work) results in uncertainty in decision metrics (i.e., present worth or
capitalized cost). Emblemsvag (2003) mentioned, “in the literature, many talk about handling
uncertainty, but very few actually do it, and in the industry even fewer do it.” Emblemsvag
(2003) discussed three methodologies to deal with uncertainty that include: (1) probability
estimates; (2) Bayesian statistics; and (3) theory of fuzzy numbers and fuzzy inference.
Monte Carlo Simulation (MCS) can be employed to account for uncertainty of input
variables. Emblemsvag (2003) argued that Monte Carlo simulations provide “the most
versatile handling of uncertainty” and outperforms other numerical methods in solving
management problems.
MCS involves generating a series of values for model variables within the user-specified
parameters using a computer program (e.g., @Risk: http://www.palisade.com/risk/ or Oracle
Crystal Ball). The model is evaluated at each of the possible values resulting in a series of
output values. Figure 8.2 shows the steps involved in MCS, namely: (1) identifying key input
variables and parameters, such as costs, cash flows, discount rates, and pipe lengths to be
rehabilitated; (2) specifying probability distributions for input variables to incorporate
uncertainty; (3) generating pseudo random numbers of input variables from assumed
distributions; and (4) calculating decision metric(s). This procedure is repeated many times –
hundreds or thousands – to produce the distribution of output variable. Risk related to
uncertainty is estimated as the probability that decision metrics will exceed certain threshold

281
values. According to Chouddry (2006), parameters are specified such that simulated input
variable values approximate to normal distribution. However, other distributions such as
triangular, uniform, and truncated normal are also used in MCS (Emblemsvag, 2003; Lang
and Merino, 1993).
Identify key variables/parameters, e.g.,Discount ratePipe lengths to be rehabilitated during each period over the planning horizonCost
Specify probability distributions for each input variable
Generate pseudo-random samples for each input variable and run simulation model to generate corresponding cash
flows
Collect output variable (decision metric) and analyze its distribution
Figure 8.2: Financial Simulation Steps

282
8.4.4 Decision Support
It is highly unlikely that all the proposed programs and initiatives meet strategic objectives,
socio-political constraints, and technical and resource requirements. Decision support
component involves carrying out feasibility analysis for various alternatives, prioritizing
candidate program(s) and selecting the one(s) that best meet strategic objectives.
Feasibility Analysis, Approved Programs and Services
The proposed alternatives are evaluated against strategic objectives over the planning
horizon. Feasible programs proceed to the execution stage, whereas unfeasible initiatives are
dropped or revised. For some alternatives, suitable materials, personnel and equipment may
not be available or proposed programs may not be feasible in terms of scope and extent of
work. For others, appropriate finances may not be readily available and, therefore, they need
to be revised or delayed to an indefinite time. Thus, feasibility evaluation concerns with
technical, environmental, socio-economic, and legal perspectives. In some instances,
unfeasible initiatives can force the redefinition of an organization’s strategic objectives.
The economic feasibility may be determined by plotting risk profiles for selected economic
metric(s) and carrying out risk comparison of alternatives (Greenberg, 2003). Figure 8.3(a)
shows hypothetical risk profiles. It may be noted that alternatives A and B, in Figure 8.3, has
same expected costs (at probability=0.5), however, the flatter slope for alternative A shows
that it is riskier (more variability) than alternative B. In Figure 8.3(b), hypothetical risk
comparison of alternatives 1, 2, 3 and 4 is shown. Alternatives 1 and 2 assume similar risk,
but alternative 2 is costly. Alternative 4 offers least cost and risk option. Majority of the
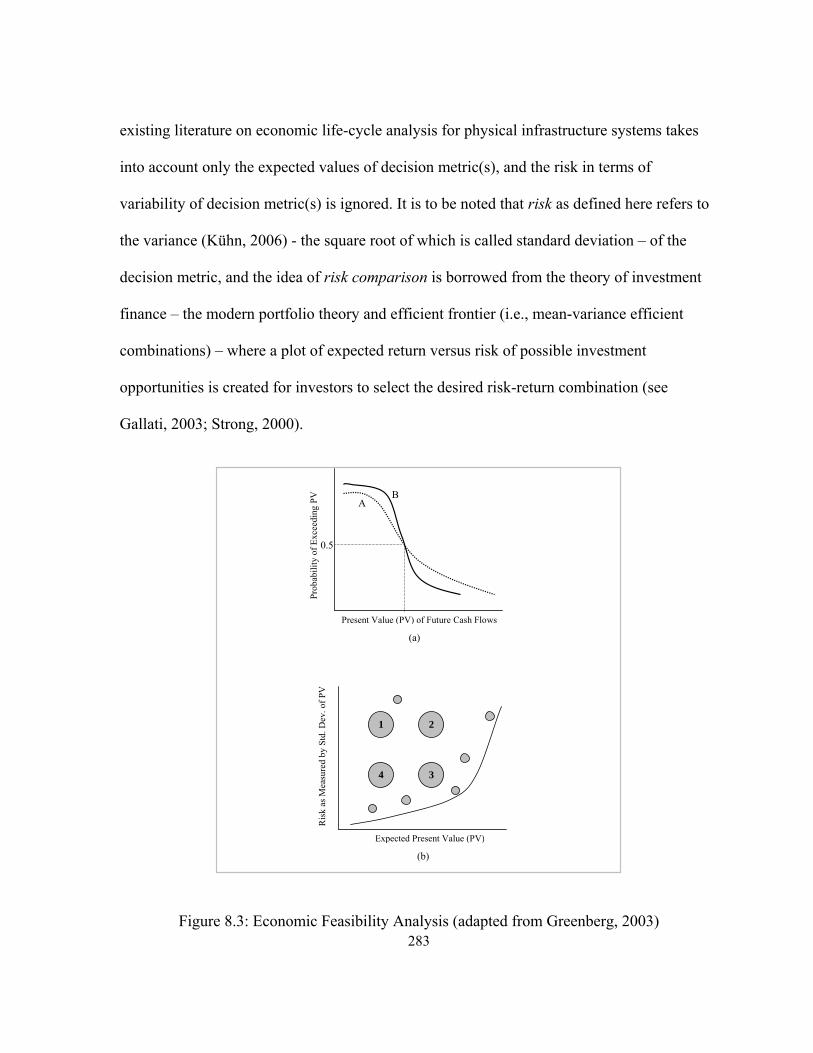
283
existing literature on economic life-cycle analysis for physical infrastructure systems takes
into account only the expected values of decision metric(s), and the risk in terms of
variability of decision metric(s) is ignored. It is to be noted that risk as defined here refers to
the variance (Kühn, 2006) - the square root of which is called standard deviation – of the
decision metric, and the idea of risk comparison is borrowed from the theory of investment
finance – the modern portfolio theory and efficient frontier (i.e., mean-variance efficient
combinations) – where a plot of expected return versus risk of possible investment
opportunities is created for investors to select the desired risk-return combination (see
Gallati, 2003; Strong, 2000).
Present Value (PV) of Future Cash Flows
Prob
abil
ity
of E
xcee
ding
PV
Expected Present Value (PV)
Ris
k as
Mea
sure
d by
Std
. Dev
. of
PV
1 2
4 3
(a)
(b)
A B
0.5
Figure 8.3: Economic Feasibility Analysis (adapted from Greenberg, 2003)
284
Implementation and Monitoring
This stage involves developing an implementation plan, implementing the plan, and
measuring and communicating results. Implementation plan contains details about specific
actions required under selected alternative(s), timeline, and a resource plan that includes
information about roles and responsibilities, funding and material etc. The results should be
evaluated against decision measures, and strategies may be amended based on feedback
analysis.
8.5 Discussion and Conclusions
Strategic financial planning – not prevalent in the provision of wastewater collection
infrastructure – involves decisions about alternative investment strategies in long-lived
assets. Most of the economic decisions relating to infrastructure management involve
uncertainty and risk due to unpredictable events, decisions and actions, as well as, variability
in cost and interest/discount rates. The risk-based economic analysis methodologies found in
literature – mostly in transportation infrastructure management – do not explicitly and
quantitatively characterize the uncertainty of output variable or decision metric. This may
result in the selection of a low-cost, high-risk management decision.
This paper presented a financial planning framework that integrates performance modeling
and service levels with economic principles for risk-based strategic financial planning and
decision-making for sustainable wastewater collection infrastructure. The service level is
described in terms of structural internal condition grades of wastewater pipelines. The

285
proposed deterioration model provides estimates of probabilities of being in a particular
condition grade depending upon age and material for wastewater pipelines. The deterioration
model is used to predict the condition of pipelines and corresponding cash flows under a
variety of management scenarios. Suitable probability distributions are specified for input
variables and random samples (pseudo random) are generated for each of the input variable.
The output from Monte Carlo simulation is represented as risk profiles (e.g., a cumulative
distribution function plots) and summarized in terms of mean and variance.
The second paper of the two paper series uses the proposed framework to addresses the
following questions at the network level:
1. How various management strategies/scenarios will affect network condition over the life-
cycle analysis period?
2. What are the financial implications of different intervention plans – that is, the amount of
yearly renovation/replacement work – over the life-cycle analysis period?
3. What funding level is required to get the network to a sustainable level?; and
4. What happens if economic conditions – that is, interest rate – change over the life-cycle
analysis period?

286
References
Agresti, A. (2002). Categorical data analysis (Second ed.). Canada: Wiley Interscience.
Ariaratnam, S. T., El-Assaly, A., & Yang, Y. (2001). Assessment of infrastructure inspection
needs using logistic models. Journal of Infrastructure Systems, 7(4), 160-165.
Ashley, R., & Hopkinson, P. (2002). Sewer systems and performance indicators–into the 21st
century. Urban Water, 4(2), 123-135.
Baik, H., Jeong, H. S., & Abraham, D. M. (2006). Estimating transition probabilities in
Markov chain-based deterioration models for management of wastewater systems.
Journal of Water Resources Planning and Management, 132(1), 15-24.
Bryson, J. M. (2004). Strategic planning for public and non-profit organizations: A guide to
strengthening and sustaining organizational achievement (Third ed.). San Francisco:
Jossey-Bass Publishers.
Burke, J. (2005). Ontario's municipal performance measurement program: Fostering
innovation and accountability in local government. Government Finance Review, 21(3),
22-27.
Chouddry, M. (2006). An introduction to value-at-risk (4th ed.). England: John Wiley &
Sons.
Cox, R. F., Issa, R. R. A., & Ahrens, D. (2003). Management's perception of key
performance indicators for construction. Journal of Construction Engineering and
Management, 129(2), 142-151.
Crotty, P. A. (2003). Selection and definition of performance indicators for water and
wastewater utilities. USA: American Water Works Association.
Crundwell, F. K. (2008). Finance for engineers evaluation and funding of capital projects.
London: London : Springer.

287
Dayananda, D., Irons, R., Harrison, S., Herbohn, J., & Rowland, P. (2002). Capital budgeting
financial appraisal of investment projects. Cambridge, UK ; New York; Cambridge, UK
; New York, NY: Cambridge, UK ; New York : Cambridge University Press.
Dess, G. G., Lumpkin, G. T., & Peridis, T. (2006). Strategic management: Creating
competitive advantages (1st Canadian ed.). USA: McGraw-Hill Ryerson.
Emblemsvag, J. (2003). Life-cycle costing, using activity-based costing and Monte Carlo
methods to manage future costs and risks. New Jersey, USA: John Wiley & Sons, Inc.
FHWA. (2002). Life-cycle cost analysis primer No. FHWA-IF-02-047). Washington, USA:
U.S. Department of Transportation. Retrieved from
http://isddc.dot.gov/OLPFiles/FHWA/010621.pdf
Gallati, R. R. (2003). Risk management and capital adequacy. New York ; London: New
York ; London : McGraw-Hill.
Greenberg, J. S., 1931-. (2003). In American Institute of Aeronautics and Astronautics (Ed.),
Economic principles applied to space industry decisions. Reston, Virginia: Reston,
Virginia : American Institute of Aeronautics and Astronautics.
Haas, R. (2007, May 28-29). New and better tools for life cycle assessment. Message posted
to http://sustainabletransforum.ca/presentations.html
Haas, R., Tighe, S. L., & Cowe Falls, L. (2006). Determining return on long-life pavement
investments. (1974) 10-17.
Hillier, F. S., & Lieberman, G. J. (1980). Introduction to operations research (3rd ed.). San
Francisco, USA: Holden-Day, Inc.
Hudson, W. R., Haas, R., & Uddin, W. (1997). Infrastructure management: Integrating
design, construction, maintenance, rehabilitation, and renovation. New York: McGraw-
Hill.
288
Hudson, W. R., Hass, R., & Uddin, W. (1997). Infrastructure management. New York, USA:
McGraw-Hill.
Kühn, J. (2006). Optimal risk-return trade-offs of commercial banks and the suitability of
profitability measures for loan portfolios. Berlin: Springer Berlin Heidelberg.
Lafferty, A. K., & Lauer, W. C. (Eds.). (2005). Benchmarking performance indicators for
water and wastewater utilities: Survey data and analyses report. Denver, CO: USA:
American Water Works Association.
Lang, H. J., & Merino, D. N. (1993). The selection process for capital projects. New York:
New York : J. Wiley & Sons.
Lufkin, P. S., Desai, A., & Janke, J. (2005). Estimating the restoration and modernization
costs of infrastructure and facilities. Public Works Management & Policy, 10(1), 40-52.
Miller, G. (2008). Backgrounder: The municipal infrastructure deficit No.
sinfrastructure1PFA-4172008-7676). Ottawa, Canada: Federation of Canadian
Municipalities. Retrieved from http://www.fcm.ca/CMFiles/sinfrastructure1PFA-
4172008-7676.pdf
Mirza, M. S., & Haider, M. (2003). The state of infrastructure in Canada: Implications for
infrastructure planning and policy. Ottawa, Ontario: Infrastructure Canada. Retrieved
from http://www.infrastructure.gc.ca/research-recherche/rresul/rs/documents/rs02_e.pdf
Mirza, S. (2007). Danger ahead: The coming collapse of Canada's municipal infrastructure
No. FCM 1060E). Ottawa, ON, Canada: Federation of Canadian Municipalities.
NAMS. (2002). International infrastructure management manual (2nd ed.). Australia:
Institute of Public Works Engineering.
NCHRP. (2003). Bridge life-cycle cost analysis No. 483). Washington, D.C.: Transportation
Research Board.
289
OMBI. (2007). Implementation of accounting for tangible capital assets - reference manual.
Ontario, Canada: Sub-Committee of the Treasures Group OMBI. Retrieved from
http://www.ombi.ca/docs/db2file.asp?fileid=187
Outreville, J. F. (1998). Theory and practice of insurance. Dordrecht ; Boston: Dordrecht ;
Boston : Kluwer Academic Publishers.
Strong, R. A. (2000). Portfolio construction, management and protection. Cincinnati, Ohio:
Cincinnati, Ohio : South Western College Pub.
Thompson, A. A., 1940-. (1998). In Strickland A. J. (. J. ). (Ed.), Strategic management :
Concepts and cases. Boston: Boston McGraw-Hill.
Wirahadikusumah, R., & Abraham, D. M. (2003). Application of dynamic programming and
simulation for sewer management. Engineering, Construction and Architectural
Management, 10(3), 193-208.
WRc (2001). Sewerage rehabilitation manual (Fourth ed.). Swindon, UK: Water Research
Centre.
Younis, R., & Knight, A. M. (2009). A probability model for investigating the trend of
structural deterioration of wastewater pipelines. Tunneling and Underground Space
Technology (Accepted)
290
Chapter 9
Strategic Financial Planning for Wastewater Collection Networks
Part 2: Application and Results
291
9.1 Abstract
This paper, second in the two part series, presents a case study demonstrating the application
of the structured economic modeling and analysis framework for cost-effective and efficient
management, rehabilitation and replacement of wastewater collection networks.
High quality condition assessment data is collected from the City of Niagara Falls
wastewater collection network using the Side Scanner and Evaluation Technology. The data
is condition coded and analyzed using Water Research Centre, UK, condition assessment
protocols. A 50 year planning horizon is considered for five example management scenarios,
namely: (1) do-nothing; (2) status quo; (3) replace pipes in Internal Condition Grade (ICG) 5;
(4) renovate ICG 4 pipes and replace ICG 5 pipes; and (5) include ICG 3 pipes along with
ICG 4 and ICG 5 pipes in the maintenance, renovation and replacement plan. A new ordinal
regression model based on cumulative logits predicts the condition of wastewater pipelines
for the five management scenarios over the planning horizon. The uncertainty of key input
variables, such as cost and discount rate, is quantified using probability distributions. A risk-
based approach using Monte Carlo simulation is applied for comparing alternative
management scenarios, and selecting the one that best meet the strategic objectives of the
organization. The presented case study investigates the impacts of various management
strategies on the condition of reinforced concrete (RC) wastewater pipelines at the City of
Niagara Falls. The uncertainty in future cash flows is quantified and implications on life-
cycle cost for RC pipes are examined.
292
It is estimated that the City can save up to $50M over the 50 year planning horizon by
following a proactive maintenance, renovation and replacement plan (i.e., alternative 5) for
RC sewers when compared to status quo (i.e., alternative 2). Do-nothing is the worst scenario
in terms of risks and impacts on the system whereas maintaining status-quo is the most
expensive option. It should be noted that the results must not be taken as a general rule for
other wastewater collection networks.
The presented study is deemed to be versatile in several ways. First, the deterioration model
and planning takes into consideration the ordinal nature of response data. Second, the
specified methodology specifically addresses the uncertainty and risk in strategic financial
planning due to input variables that are not known with certainty. Third, the need to properly
characterize the distribution of decision metric or output variable is demonstrated.
The presented analyses and findings will improve decision making related to: (1) the
development of long-term wastewater infrastructure management plans; (2) the commitment
of resources; and (3) the establishment of defensible policies.
Keywords: Life-cycle cost analysis; Wastewater collection networks; Monte Carlo simulation;
Deterioration modeling
293
9.2 Introduction
This paper is the second in a two part series. Part 1 detailed an economic analysis framework
for strategic decision-making related to the maintenance, renovation and replacement
(M,R&R) of wastewater collection pipelines. In particular, Part 1 discusses: (1) the
wastewater pipelines condition assessment; (2) deterioration modeling; (3) economic
principles and concepts; (4) consideration of risk and uncertainty; and (5) Monte Carlo
simulation technique, for financial sustainability planning of wastewater collection systems.
This paper presents an overview of literature on economic analysis and life-cycle costing for
civil infrastructure M,R&R. The application of the proposed structured framework is
demonstrated using high quality condition assessment data collected by the authors from the
City of Niagara Falls wastewater collection system. Five example management scenarios –
namely, do-nothing, status-quo, replace ICG (internal condition grade) 5 pipes, renovate ICG
4 pipes and replace ICG 5 pipes, and renovate ICG 3 and ICG 4 pipes, and replace pipes in
ICG 5 – are considered. The deterioration behaviour of Reinforced Concrete (RC)
wastewater collection pipelines is estimated using a new ordinal regression model based on
cumulative logits. The deterioration model predicts the impact of five example management
strategies on the condition of RC pipelines. A life-cycle cost analysis is carried out for a 50
year planning period in terms of present value of future costs. The use of Monte Carlo
simulation is demonstrated to explicitly and quantitatively address uncertainty and risk in the
decision-making process. Typical results of the performed analyses are presented and
discussed.
294
9.3 Literature Overview
The literature review revealed different perspectives to life-cycle cost analysis for civil
infrastructure. Shahata and Zayed (2008) used Monte Carlo simulation for repair, renovation
and replacement of watermains. The watermains service life was represented using normal
and lognormal distributions. Log-logistic and lognormal models were deemed to fit the two
optimal rehabilitation scenarios. Shahata and Zayed (2008) did not carry out a risk
comparison of selected rehabilitation strategies.
The rate-of-return and cost-effectiveness methodologies discussed and demonstrated in Haas
et al. (2006) are one of several possible techniques for economic analyses. Haas et al. (2006)
used hypothetical data to demonstrate rate-of-return methodology for comparing life-cycle
costs of alternative pavement designs. To check the variation in net present values, Haas et
al. (2006) used three discount rates. The cost-effectiveness methodology presented in Haas et
al. (2006) used ordinary regression for deterioration modeling of sidewalks. The condition of
sidewalks, like other civil infrastructure, is estimated using an ordinal scale, and therefore,
the deterioration model presented in Haas et al. (2006) violates the normal regression
assumptions. Zayed et al. (2002) demonstrated the application of economic analysis and
Markov Decision Process for life-cycle cost analysis for steel bridge paint systems, and
found contradicting results. Tighe (2001) used Monte Carlo simulation to characterize the
distribution of life-cycle costs (LCC) for pavements. Tighe (2001) found that input variables
such as material costs and pavement thickness, and output variable (i.e., life-cycle cost)
follow lognormal distributions. Tighe (2001) then repeated the analysis assuming normal
distributions for input and output variables and compared normally distributed LCC with that
295
from the lognormal model. Tighe (2001) concluded that the assumption of normal
distribution for variables resulted in overestimation of LCC and potential to overdesign a
pavement. Salem et al. (2003) compared the LCC cumulative distribution plots for different
construction alternatives for pavements, and reported the risk as the probability of LCC
exceeding a pre-specified budget. Osman (2005) proposed a framework to investigate
investment opportunities in privatized civil infrastructure and used internal rate-of-return
(IRR) as the decision metric. Osman (2005) used hypothetical data and noted the difficulties
of collecting meaningful data to quantify infrastructure investment benefits and to perform
useful LCC analyses.
The work in strategic financial planning and the development of long-term financial plans for
sustainable wastewater infrastructure management is scarce and still in its infancy. Burgess
(1990) proposed a planning model for sewer system rehabilitation using Markov chains (for
deterioration model) in conjunction with present worth analysis for multiple rehabilitation
scenarios. Burgess (1990) reported an optimal strategy which called for replacement of all
pipes facing imminent failure (represented as pipes in grade E) and rehabilitation of
significantly deteriorated pipes (represented as pipes in grade D). Burgess (1990) did not
discuss the strategy of including moderately deteriorated (i.e., grade C) pipes along with the
pipes in grades D and E in the rehabilitation plan. Furthermore, Burgess (1990) did not
perform risk comparison of the proposed alternatives. Wirahadikusumah et al. (1999) and
Wirahadikusumah and Abraham (2003) used Markov Decision Process (MDP) and
Probabilistic Dynamic Programming (PDP) to prioritize M,R&R (maintenance, rehabilitation
and replacement) techniques for wastewater pipelines. The application of MDP and PDP

296
was elaborated using cost estimates for 1.5 m diameter pipe in Indianapolis, USA. In
particular, renovation alternatives, such as cleaning, shotcrete coating, cured-in-place pipe
lining, fiberglass reinforced sliplining, and open-cut replacement, were considered for
pipelines in particular structural condition grades of 1 to 5. The model output consists of an
optimum policy for cost-effective M,R&R techniques at particular stages of the planning
horizon and condition states. Wirahadikusumah et al. (1999) repeated the analysis for
different planning horizons and estimated long-term rehabilitation costs. According to
Wirahadikusumah and Abraham (2003), “optimal decisions vary with pipe diameter.”
Bainbridge and Macey (2005) discussed the application of a Markov chain deterioration
model for the development of long-term budgets. The ratio of change in asset value to the net
present value was considered as an indicator of the effectiveness of a particular rehabilitation
strategy. The Sustainable Funding Model proposed by Bainbridge and Macey (2005)
provides optimum funding levels for short and long-term rehabilitation plans. However, it did
not take into account the risk and uncertainty related to input variables.
9.4 Objective and Problem Description
For a wastewater utility, one of the infrastructure management strategic objectives can be
defined as to provide safe and reliable wastewater collection services at the minimum long-
term costs. To achieve this objective, life-cycle costs of alternative M,R&R strategies need to
be investigated keeping in view the uncertainty and risk due to changes in input variables,
such as costs, work quantities, and economic conditions over the planning horizon. The
output of the analysis consists of an economic decision metric e.g., present worth of future
297
net costs that provides an estimate of long-term monetary requirements to maintain, renovate
and replace existing wastewater pipelines. The proposed framework from Part 1 is applied to
address the following specific questions at the network level:
1. How alternative management strategies will impact network condition over the life-cycle
analysis period?
2. What are the life-cycle financial implications of the proposed management scenarios –
that is, the impact of renovation and replacement work quantities on cash flows and
costs?
3. What funding level is required to get the network to a sustainable level? and
4. What happens if economic conditions, e.g., interest rate, change over the life-cycle
analysis period?
A tacit assumption is that the estimated quantity of work under a selected alternative is
manageable from operational perspectives and within the specified time period. Figure 9.1
illustrates the methodology for Monte Carlo based financial simulation modeling used in this
research. The methodology is further described in the following sections (for illustration,
only reinforced concrete (RC) pipes are considered in the economic analysis).

298
Figure 9.1: Flowchart Illustrating the Methodology for Economic Analysis

299
9.5 City of Niagara Falls Pipeline Condition Assessment Data
The City of Niagara Falls wastewater collection network consists of approximately 400 Kms
of pipelines that has approximately 5,500 pipe segments consisting of a variety of pipe
materials with age ranging from 10 to over 100 years. The average age of the network is 47
years. The distribution of various pipe materials is as follows: 35% of the network consists of
Reinforced Concrete (RC); 17% PVC; 10% Vitrified Clay (VC); 10% Asbestos Cement
(AC); and 25% of the network has no assigned pipe material. The average age of the RC and
VC pipes are 42 and 65 years, respectively.
Wastewater pipelines’ inspections were carried out using the Side Scanner and Evaluation
Technology (SSET) camera. Water Research Centre’s (WRc) protocols as detailed in the
Manual of Sewer Condition Classification (MSCC, 3rd ed.) and Sewerage Rehabilitation
Manual (SRM, 4th ed.) were used for pipelines condition assessment. A contractor supplied
North American Association of Pipelines Inspectors (NAAPI) certified operator completed
all the SSET pipeline surveys, and coded all pipeline defects in accordance with the MSCC.
The NAAPI certified City of Niagara Falls personnel and authors carried out additional
Quality Assurance (QA) and Quality Control (QC) checks on all the contractor provided
data.
The quality pipeline inspection data from the City of Niagara Falls was transported to the
University of Waterloo to be stored on two geographically distributed data servers. The
servers are backed-up using RAID 5 technology to ensure data security, availability, and
seamless recovery. Using a University of Waterloo custom built software application, the
300
City of Niagara Falls QA/QC data is uploaded into a database management system named
WatBAMS (Waterloo – Buried Asset Management System). The software import utility
contains further QA/QC protocols to ensure that only high quality data is uploaded in the
database for each inspected pipe segment. Using programmed routines in WatBAMS, each
pipe segment is analyzed in accordance with the Sewerage Rehabilitation Manual (4th
edition) methodology to determine its Internal Condition Grade (ICG). WatBAMS also
allows for the upload and integration with the City’s of Niagara Falls GIS and inventory
database that contain each pipe segment’s attributes, e.g., asset ID, location, construction
date, and material type, etc.
9.6 Deterioration Model
Approximately 12% (45 Kms) of the City of Niagara Falls wastewater collection network
data is used in the model development. The detailed procedure for model development,
evaluation, and analysis is discussed in Younis and Knight (2009). Equation 9.1 presents the
functional form and Table 9.1 provides the parameter estimates of the proposed deterioration
model. The deterioration model is developed for reinforced concrete and vitrified clay pipes;
however, only reinforced concrete pipes are considered in the analyses and discussion
presented in this paper.
1 2 3ˆ ˆ ˆ ˆˆ ˆ ˆlogit | material,age,μ,β material age material agejP Y j (9.1)
Figure 9.2 shows the predicted probabilities of being into one of the five ICG (internal
condition grades) with age for reinforced concrete wastewater pipelines at the City of

301
Niagara Falls. The probabilities of the lowest and highest response categories (i.e., ICG = 1
and ICG = 5) are monotonic functions of age, whereas, the probabilities of the intermediate
categories (i.e., ICG = 2, 3, and 4) are unimodal or single-peaked functions.
The effect of age on the probability of being in ICG 1 is negative i.e., the probability of a
pipeline being in acceptable condition decreases with the age of pipe. On the other hand, the
effect of age on the probability of being in grade 5 is positive, i.e., the probability of a
pipeline being in grade 5 increases with age. The predicted probabilities of being in
intermediate grades first increase with age, and then decrease after certain age thresholds.
For example, in Figure 9.2, the probability of being in ICG 3 first increases until the age of
about 55 years and then decreases for RC pipes. This occurs because as the age increases,
more cases move into ICG 3 than leave from ICG 3 to other worse categories. Therefore, the
probability of being in ICG 3 increases. As the age is increased beyond 55 years, cases
entering ICG 3 are less than the cases leaving, thus the probability decreases.
Table 9.1: Deterioration Model Parameter Estimates
Variable Coeff. Std. Err. z P>z [95% Conf. Interval]
material, β1 -3.439 0.633 -5.430 0.000 -4.680 -2.198
age, β2 0.008 0.007 1.220 0.223 -0.005 0.022
age x material, β3 0.046 0.011 4.190 0.000 0.025 0.068
cut1, μ1 -0.714 0.514 -1.721 0.294
cut2, μ2 -0.352 0.512 -1.356 0.652
cut3, μ3 0.199 0.512 -0.804 1.203
cut4, μ4 1.491 0.528 0.456 2.527
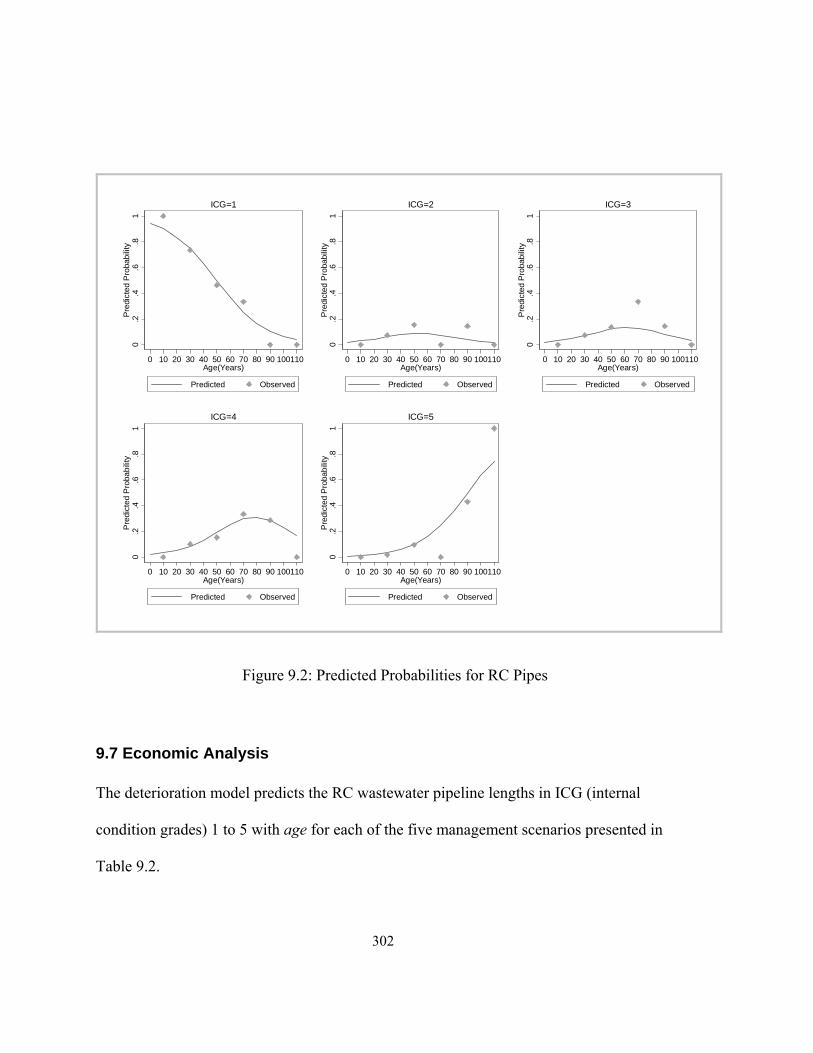
302
0
.2.4
.6.8
1P
redi
cted
Pro
babi
lity
0 10 20 30 40 50 60 70 80 90 100110Age(Years)
Predicted Observed
ICG=1
0.2
.4.6
.81
Pre
dict
ed P
roba
bilit
y
0 10 20 30 40 50 60 70 80 90 100110Age(Years)
Predicted Observed
ICG=2
0.2
.4.6
.81
Pre
dict
ed P
roba
bilit
y
0 10 20 30 40 50 60 70 80 90 100110Age(Years)
Predicted Observed
ICG=3
0.2
.4.6
.81
Pre
dict
ed P
roba
bilit
y
0 10 20 30 40 50 60 70 80 90 100110Age(Years)
Predicted Observed
ICG=4
0.2
.4.6
.81
Pre
dict
ed P
roba
bilit
y
0 10 20 30 40 50 60 70 80 90 100110Age(Years)
Predicted Observed
ICG=5
Figure 9.2: Predicted Probabilities for RC Pipes
9.7 Economic Analysis
The deterioration model predicts the RC wastewater pipeline lengths in ICG (internal
condition grades) 1 to 5 with age for each of the five management scenarios presented in
Table 9.2.
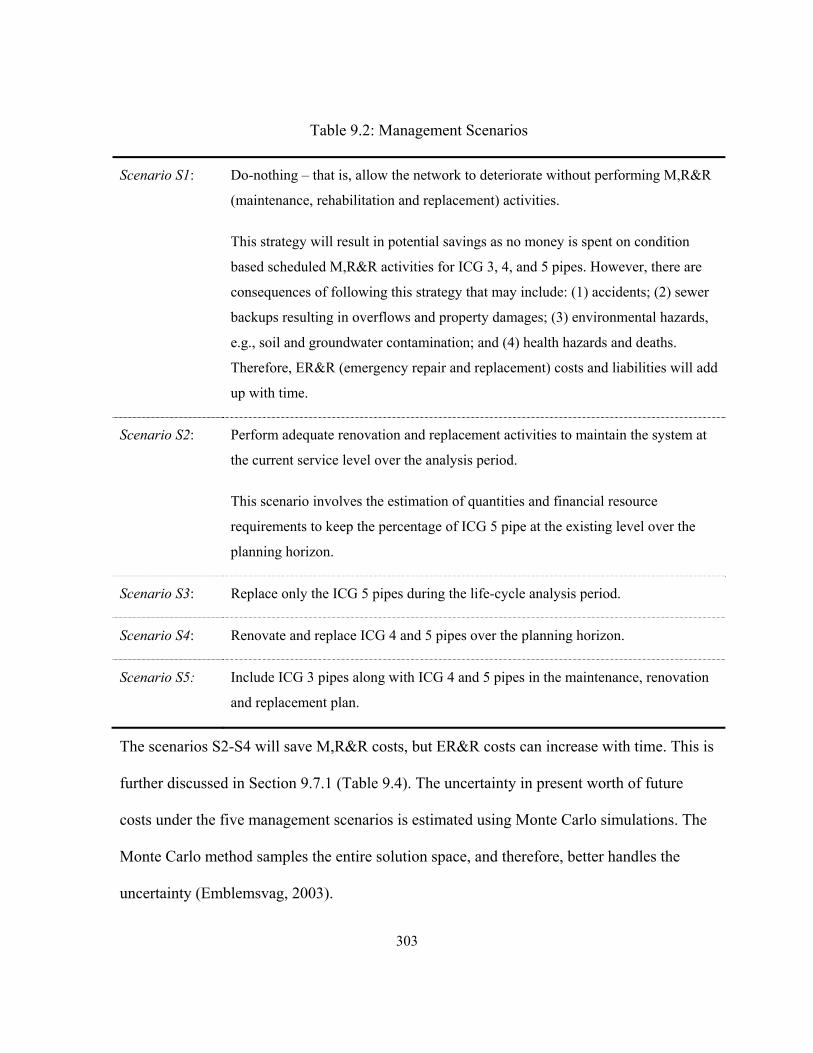
303
Table 9.2: Management Scenarios
Scenario S1: Do-nothing – that is, allow the network to deteriorate without performing M,R&R
(maintenance, rehabilitation and replacement) activities.
This strategy will result in potential savings as no money is spent on condition
based scheduled M,R&R activities for ICG 3, 4, and 5 pipes. However, there are
consequences of following this strategy that may include: (1) accidents; (2) sewer
backups resulting in overflows and property damages; (3) environmental hazards,
e.g., soil and groundwater contamination; and (4) health hazards and deaths.
Therefore, ER&R (emergency repair and replacement) costs and liabilities will add
up with time.
Scenario S2: Perform adequate renovation and replacement activities to maintain the system at
the current service level over the analysis period.
This scenario involves the estimation of quantities and financial resource
requirements to keep the percentage of ICG 5 pipe at the existing level over the
planning horizon.
Scenario S3: Replace only the ICG 5 pipes during the life-cycle analysis period.
Scenario S4: Renovate and replace ICG 4 and 5 pipes over the planning horizon.
Scenario S5: Include ICG 3 pipes along with ICG 4 and 5 pipes in the maintenance, renovation
and replacement plan.
The scenarios S2-S4 will save M,R&R costs, but ER&R costs can increase with time. This is
further discussed in Section 9.7.1 (Table 9.4). The uncertainty in present worth of future
costs under the five management scenarios is estimated using Monte Carlo simulations. The
Monte Carlo method samples the entire solution space, and therefore, better handles the
uncertainty (Emblemsvag, 2003).

304
9.7.1 Input Variables
Important input variables include the following:
1. Rehabilitation Costs
The sampled data in the presented study consists of pipes with diameter ranging from 250
mm to 750 mm. Bainbridge and Macey (2005) and Leung et al. (2007) reported average
manhole-to-manhole renovation costs per meter of pipe length at various stages of
deterioration cycle for the wastewater collection systems at the Cities of Winnipeg and New
Westminister, Canada. It is noted that Bainbridge and Macey (2005) and Leung et al. (2007)
used a combination of six manhole-to-manhole rehabilitation work streams for condition
grades of 3, 4 and 5. Table 9.3 provides their estimated average renovation/replacement costs
in each condition grade for pipes with diameter ranging from 150 mm to 1200 mm.
Bainbridge and Macey (2005) and Leung et al. (2007) further noted that the reported cost
estimates did not include emergency repairs and that the costs were not affected by pipe
diameter.
Zhao and Rajani (2002) reported costs of rehabilitation and construction projects for buried
pipes. They concluded that trenchless rehabilitation costs tend to increase with pipe diameter
and emergency repairs can cost three times the scheduled repair costs. MacLeod et al. (2000)
performed an analysis of historical repair cost data for the wastewater collection network at
the City of Edmonton, Canada. According to their analysis, the mean emergency repair cost
was 55% greater than the scheduled repairs and its variance was three times higher than that
of the scheduled repairs.
305
Wirahadikusumah and Abraham (2003) considered renovation alternatives, such as cleaning,
shotcrete coating, cured-in-place pipe lining, fiberglass reinforced sliplining, and open-cut
replacement, at unit costs of $16/m, $656/m, $1,558/m, $2,231/m, and $1,066/m,
respectively, for 1500 mm diameter pipelines in various condition grades. Wirahadikusumah
and Abraham (2003) estimated optimal rehabilitation costs of $377/m, $719/m, $1,145/m,
$1,703/m and $1,421/m for pipes in structural grades 1, 2, 3, 4 and 5, respectively for the
general case.
Table 9.3 shows the intervention ratios – that is, the ratios of renovation costs in intermediate
internal condition grades to the cost in ICG (internal condition grade) 5 – for rehabilitation
costs at ICG 3 and ICG 4. Bainbridge and Macey (2005) and Leung et al. (2007) concluded
that intervention ratios roughly follow one-third and two-third rule – that is, rehabilitation
costs at ICG 3 and ICG 4 are one-third and two-third of cost at ICG 5.
For this study, average intervention costs of $1000, $700, and $300 are assumed for
scheduled replacements and repairs of pipelines in ICG 5, 4, and 3, respectively. The ER&R
(emergency repair & replacement) costs are assumed to vary from 1.5 to 3 times the costs for
scheduled repairs/replacements. These cost estimates are in line with the assertions made by
Bainbridge and Macey (2005) and Leung et al. (2007). To model cost uncertainty, a normal
distribution is assumed. Figure 9.3 shows the cost distribution with mean values of $1000,
$700, and $300 for pipes in ICG 5, 4 and 3, respectively.

306
Table 9.3: Rehabilitation Costs (adapted from Bainbridge and Macey, 2005; Leung et al.
2007)
Condition Grade Winnipeg New Westminister
Cost/meter/MH-
to-MH Segment
Intervention Ratio Cost/meter/MH-
to-MH Segment
Intervention Ratio
5 $841 1.00 $416 1.00
4 $604 0.72 $279 0.67
3 $241 0.29 $144 0.34
A uniform distribution is assumed to quantify the uncertainty in ER&R costs. Social costs
such as traffic disruptions due to a particular renovation/replacement technique and property
damages from sewer overflows and blockages are assumed to be included in ER&R costs.
Figure 9.3: Renovation/Replacement Cost Distributions in Internal Condition Grades (ICG)
3, 4 and 5

307
2. Interest Rate and Inflation
Average interest rate (discount rate) of 6% is assumed to relate future cost estimates to
present worth. According to Hudson et al. (1997), many agencies use inflation adjusted
discount rate – that is, the difference between borrowing or investing interest rate minus
inflation – for comparing infrastructure investment alternatives. Hudson et al. (1997) argued
that “inflation should only be used for setting real discount rates” in economic analysis for
infrastructure management systems, and that considering inflation as an additional factor
does not result in better selection of alternatives. The study by Wirahadikusumah and
Abraham (2003) found that optimal maintenance and rehabilitation alternatives were not
affected by inflation and interest rates. Figure 9.4 shows uncertainty distribution – a
truncated Normal – for discount rate, ~ .06,.025i N with 1% and 11% as the lower and
upper bounds.
Discount Rate (%)
Densi
ty
2 4 6 8 10
0.00
0.05
0.1
00.1
5
Figure 9.4: Discount Rate, ~ (6%,.025)i N

308
3. Rehabilitated/Replaced Pipe Lengths (i.e., Quantity of Work to be Carried Out)
The proposed deterioration model (see Section 9.6) is used to estimate the pipe lengths to be
rehabilitated or replaced during five year periods over the life-cycle planning horizon of 50
years. Table 9.4 provides additional information about how the pipe lengths for each of the
five management scenario are computed.
Table 9.4: Management Scenarios and Assumed Pipe Lengths for Renovation and
Replacement
Management
Scenario
Description Pipe Lengths Renovated and/or
Replaced
1 Do-nothing Emergency Repairs and Replacements
(ER&R): assumed Uniform distribution
with 50-100% of ICG 5, 30-70% of ICG
4, and 5-20% of ICG 3 pipe lengths may
need ER&R
2 Status quo i.e., maintain the system in
its current condition
Predicted length in ICG 4 and 5 20%.
Assumed Uniform distribution with 30-
70% of remaining ICG 4 and 5-20% of
ICG 3 pipes may need ER&R
3 Replace ICG 5 pipes Predicted length in ICG 5 20%.
Assumed Uniform distribution with 30-
70% of ICG 4 and 5-20% of ICG 3 pipes
may need ER&R
4 Renovate and replace ICG 4 and 5
pipes
Predicted length in ICG 4 and 5 20%.
Assumed Uniform distribution with 5-
20% of ICG3 pipes may need ER&R
5 Renovate and replace ICG 3, 4 and 5
pipes
Predicted length in ICG 3, 4 and 5
20%
309
4. Planning Horizon
The analysis is based on a life-cycle period of 50 years as suggested by Hudson et al. (1997)
for wastewater collection pipelines.
9.7.2 Output Variable or Decision Metric
The decision metric or the output variable is the Present Worth (PW) of future net costs (i.e.,
cost minus savings). One thousand trials of Monte Carlo simulation were performed and
present worth of future net costs are estimated for the five management scenarios using
present worth formula and rate-of-return factors as presented in Section 8.4.3.
9.8 Results
Figures 9.5 to 9.9 show the estimated RC pipe lengths in each ICG with time over the life-
cycle analysis horizon for the five M,R&R scenarios.
Figure 9.5 shows the predicted lengths of RC wastewater pipelines for the case, S1, when no
rehabilitation or replacement work is carried out over the 50 year life-cycle analysis period.
The deterioration trend corresponds to the predicted probability chart shown in Figure 9.2.
The predicted lengths in ICG 3 and 4 first increase and then decrease with age whereas the
predicted lengths in ICG 5 continue to increase. At time 0, the estimated lengths of RC
pipelines in ICG 3, 4, and 5 are 13.4 Kms, 18.7 Kms, and 9.6 Kms, respectively. If no
renovation and replacement is performed over the next 50 years, the predicted lengths in ICG
3, 4 and 5 will be 10.5 Kms, 36.3 Kms and 68.3 Kms, respectively. The percentage increase
in ICG 5 pipes is 611% . ., 68.3 9.6 9.6i e in 50 years.
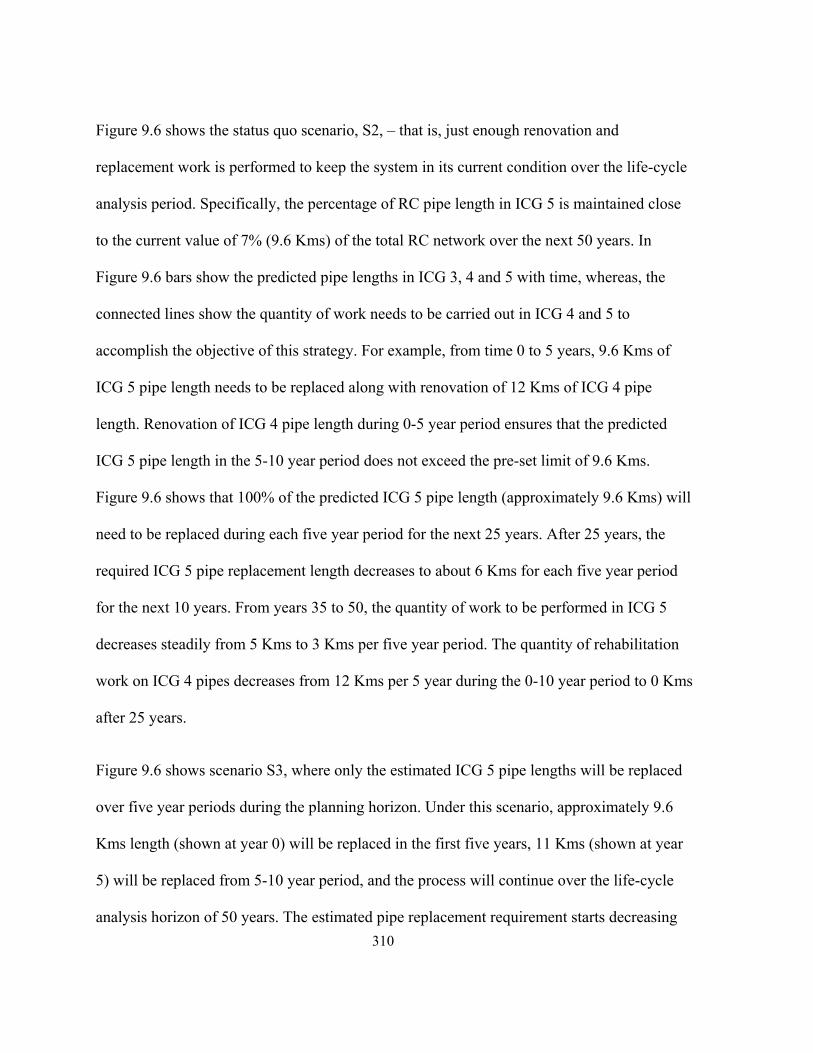
310
Figure 9.6 shows the status quo scenario, S2, – that is, just enough renovation and
replacement work is performed to keep the system in its current condition over the life-cycle
analysis period. Specifically, the percentage of RC pipe length in ICG 5 is maintained close
to the current value of 7% (9.6 Kms) of the total RC network over the next 50 years. In
Figure 9.6 bars show the predicted pipe lengths in ICG 3, 4 and 5 with time, whereas, the
connected lines show the quantity of work needs to be carried out in ICG 4 and 5 to
accomplish the objective of this strategy. For example, from time 0 to 5 years, 9.6 Kms of
ICG 5 pipe length needs to be replaced along with renovation of 12 Kms of ICG 4 pipe
length. Renovation of ICG 4 pipe length during 0-5 year period ensures that the predicted
ICG 5 pipe length in the 5-10 year period does not exceed the pre-set limit of 9.6 Kms.
Figure 9.6 shows that 100% of the predicted ICG 5 pipe length (approximately 9.6 Kms) will
need to be replaced during each five year period for the next 25 years. After 25 years, the
required ICG 5 pipe replacement length decreases to about 6 Kms for each five year period
for the next 10 years. From years 35 to 50, the quantity of work to be performed in ICG 5
decreases steadily from 5 Kms to 3 Kms per five year period. The quantity of rehabilitation
work on ICG 4 pipes decreases from 12 Kms per 5 year during the 0-10 year period to 0 Kms
after 25 years.
Figure 9.6 shows scenario S3, where only the estimated ICG 5 pipe lengths will be replaced
over five year periods during the planning horizon. Under this scenario, approximately 9.6
Kms length (shown at year 0) will be replaced in the first five years, 11 Kms (shown at year
5) will be replaced from 5-10 year period, and the process will continue over the life-cycle
analysis horizon of 50 years. The estimated pipe replacement requirement starts decreasing

311
after 35 years of age. By year 50, about 120 Kms 120 134.9 89% length of RC pipes will
be replaced. This represents an average replacement rate of 2.4 Kms per year.
Figure 9.8 presents scenario S4 and shows the estimated required renovation and replacement
pipe lengths in ICG 4 and 5 with time. At year 0, the estimated lengths of RC pipes in ICG 4
and 5 are 18.7 Kms and 9.6 Kms, respectively. These lengths are renovated and replaced
from 0-5 year period. Figure 9.8 shows that approximately 3.7 Kms of RC pipes will be in
ICG 4 and 2.7 Kms will be in ICG 5 after 35 years – that is, less than 5%
. ., 3.7 2.7 134.9i e of RC pipelines are estimated to be in ICG 4 and 5 under this
management scenario.
Figure 9.9 shows the estimated renovation and replacement requirements with time under
scenario S5. This scenario is similar to S4 with the exception that ICG 3 pipes are also
considered in the maintenance, rehabilitation and replacement plan along with ICG 4 and 5
pipelines. Under this alternative, the ICG 4 and 5 pipe lengths reduce at a much faster rate
than other scenarios. For example, from 5-10 year period, 7.7 Kms of pipes need to be
replaced in this scenario as compared to scenario S4 where approximately 9 Kms of pipes
will need replacement during the same time period. In 25 years, less than 5% of the RC pipes
in the network will be in ICG 4 and 5 under this strategy.

312
010203040506070
0 5 10 15 20 25 30 35 40 45 50
Time (Years)
Le
ng
th (
km
)
ICG 3 ICG4 ICG5
Figure 9.5: Scenario S1 – Do Nothing (No Rehabilitation/Replacement Work Performed) RC
Pipelines’ Predicted Lengths
0
5
10
15
20
0 5 10 15 20 25 30 35 40 45 50
Time (Years)
Le
ng
th (
Km
)
ICG3 ICG4 ICG5
Replaced ICG5 Rehabilitated ICG 4
Figure 9.6: Scenario S2 – Predicted, Rehabilitated and Replaced RC Pipes’ Length to Sustain
Current Network Condition

313
02468
10121416
0 5 10 15 20 25 30 35 40 45 50
Le
ng
th (K
m)
Time (Years)
ICG 5
Figure 9.7: Scenario S3 – Predicted ICG 5, RC Pipes’ Length to Be Replaced
0
5
10
15
20
0 5 10 15 20 25 30 35 40 45 50
Len
gth
(K
m)
Time (Years)
ICG4 ICG5
Figure 9.8: Scenario S4 – Predicted ICG 4 and 5, RC Pipes Length to be Renovated and
Replaced
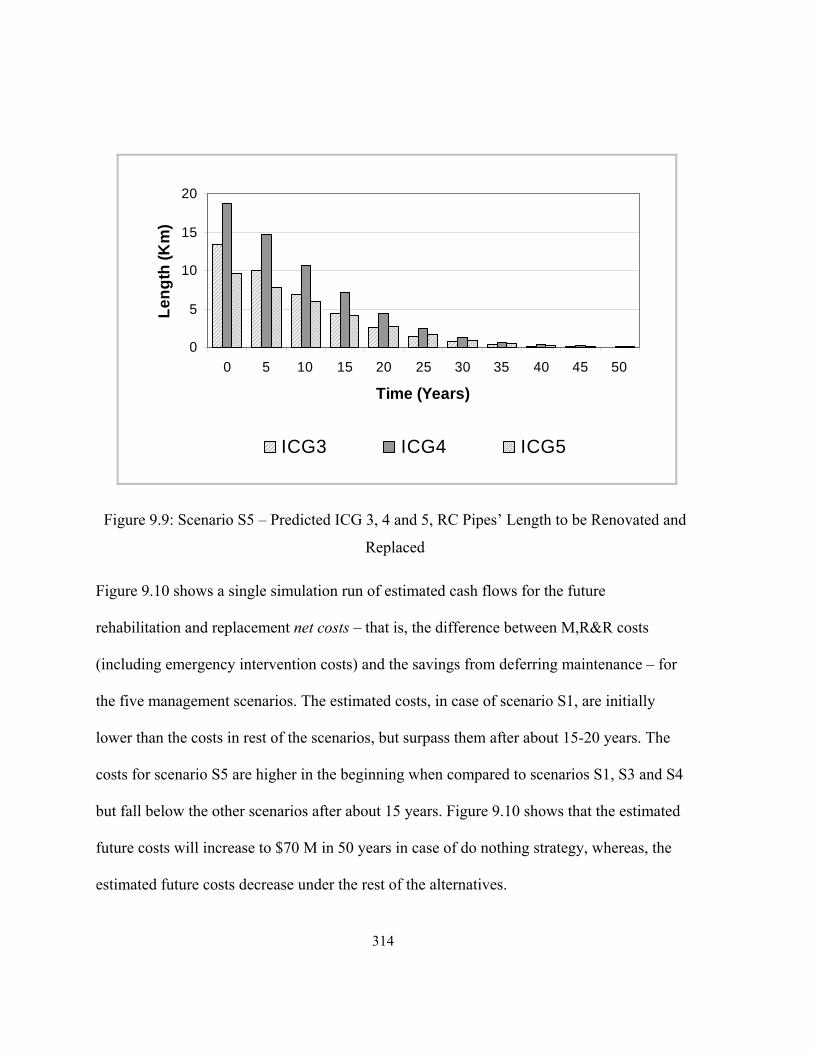
314
0
5
10
15
20
0 5 10 15 20 25 30 35 40 45 50
Time (Years)
Le
ng
th (
Km
)
ICG3 ICG4 ICG5
Figure 9.9: Scenario S5 – Predicted ICG 3, 4 and 5, RC Pipes’ Length to be Renovated and
Replaced
Figure 9.10 shows a single simulation run of estimated cash flows for the future
rehabilitation and replacement net costs – that is, the difference between M,R&R costs
(including emergency intervention costs) and the savings from deferring maintenance – for
the five management scenarios. The estimated costs, in case of scenario S1, are initially
lower than the costs in rest of the scenarios, but surpass them after about 15-20 years. The
costs for scenario S5 are higher in the beginning when compared to scenarios S1, S3 and S4
but fall below the other scenarios after about 15 years. Figure 9.10 shows that the estimated
future costs will increase to $70 M in 50 years in case of do nothing strategy, whereas, the
estimated future costs decrease under the rest of the alternatives.

315
-
10
20
30
40
50
60
70
80
0 10 20 30 40 50
Time (Years)
Ne
t C
os
t ($
, Mill
ion
)
Scenario 1 Scenario 2 Scenario 3 Scenario 4 Scenario 5
Figure 9.10: Estimated Future Net Cost Cash Flows
Figure 9.11 shows the distribution plots of Present Worth (PW) of future net cash flows for
the five example scenarios. It is noted that PW distributions for scenarios S1 and S2 are
highly skewed to the right, whereas for scenarios S3, S4 and S5, they are mildly skewed.
This means that the estimated PW are not normally distributed. To confirm this, Figure 9.12
shows the normal Q-Q plots for PW values from five alternatives. The plots show that the
point pattern is not linear but is curved with slope increasing from left to right for scenarios
S1, S2, S4 and S5. This indicates a right skewed distribution with estimated PW values
greater than zero. For S3, the left end of the pattern is above the line and right end is below
the straight line. This indicates symmetric, short tails at both ends. These patterns are further
evident from Figure 9.13 that shows the histograms of PW values with lognormal curve
overlays for the five alternatives. According to Limpert et al. (2001), lognormal distribution
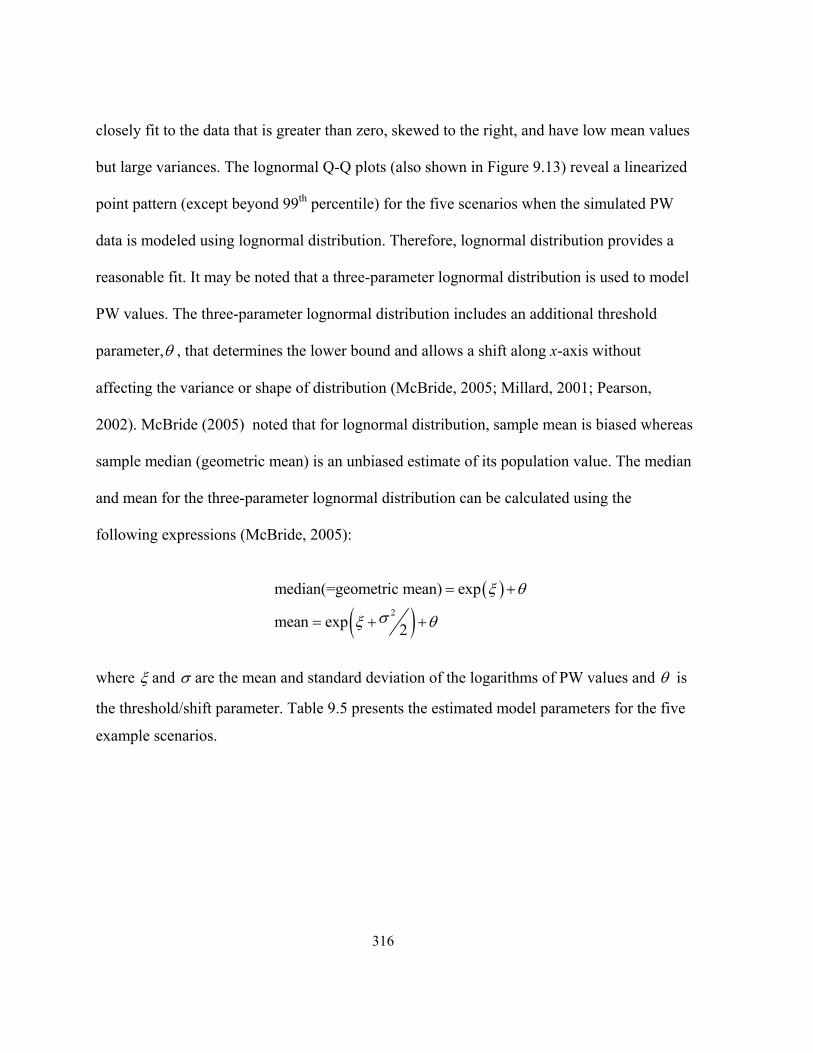
316
closely fit to the data that is greater than zero, skewed to the right, and have low mean values
but large variances. The lognormal Q-Q plots (also shown in Figure 9.13) reveal a linearized
point pattern (except beyond 99th percentile) for the five scenarios when the simulated PW
data is modeled using lognormal distribution. Therefore, lognormal distribution provides a
reasonable fit. It may be noted that a three-parameter lognormal distribution is used to model
PW values. The three-parameter lognormal distribution includes an additional threshold
parameter, , that determines the lower bound and allows a shift along x-axis without
affecting the variance or shape of distribution (McBride, 2005; Millard, 2001; Pearson,
2002). McBride (2005) noted that for lognormal distribution, sample mean is biased whereas
sample median (geometric mean) is an unbiased estimate of its population value. The median
and mean for the three-parameter lognormal distribution can be calculated using the
following expressions (McBride, 2005):
2
median(=geometric mean) exp
mean exp 2
where and are the mean and standard deviation of the logarithms of PW values and is
the threshold/shift parameter. Table 9.5 presents the estimated model parameters for the five
example scenarios.
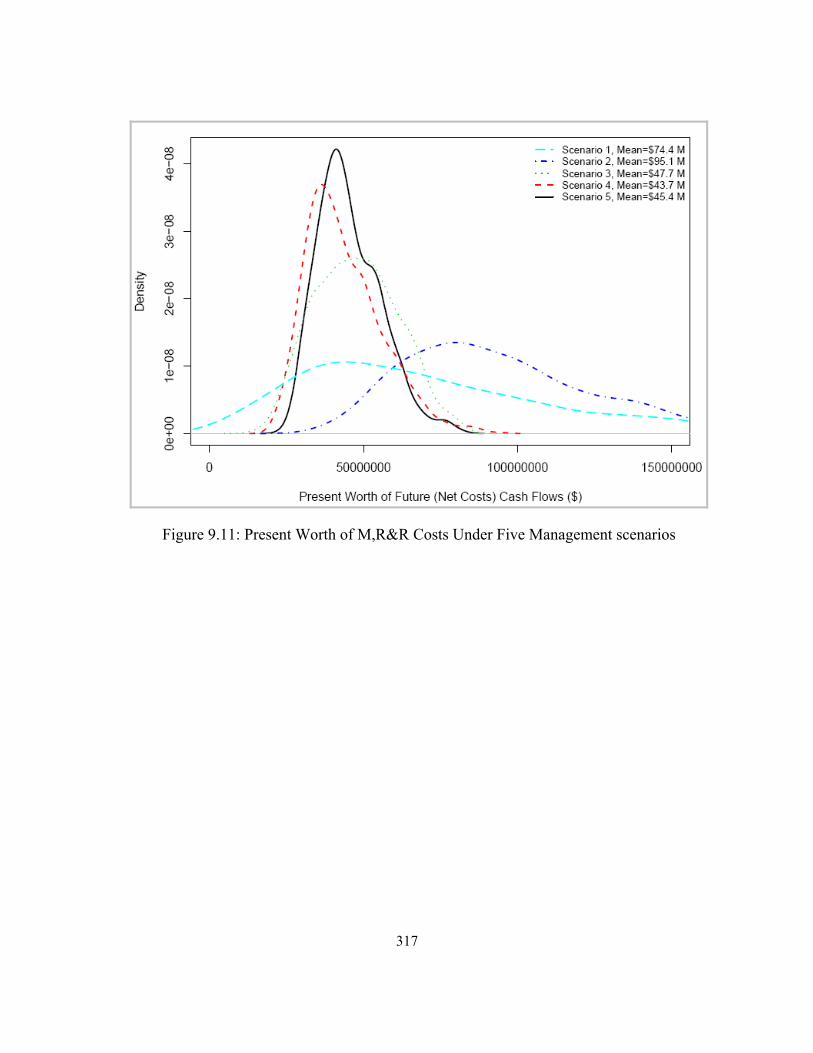
317
Figure 9.11: Present Worth of M,R&R Costs Under Five Management scenarios
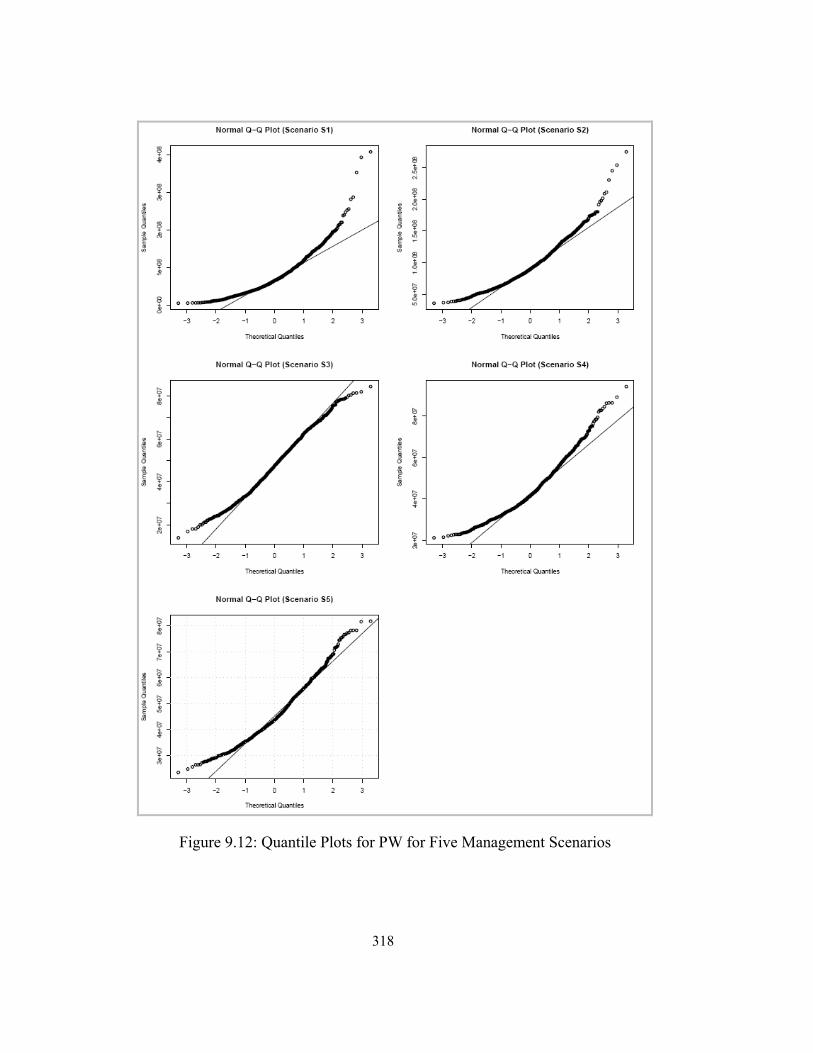
318
Figure 9.12: Quantile Plots for PW for Five Management Scenarios
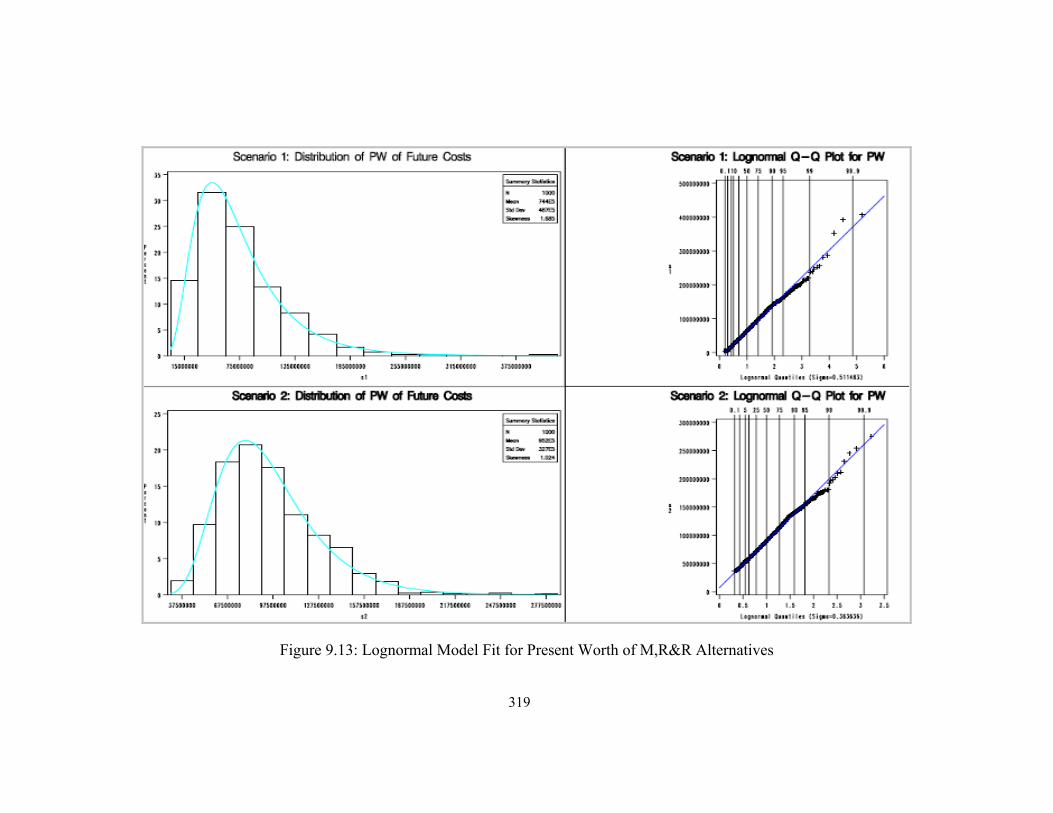
319
Figure 9.13: Lognormal Model Fit for Present Worth of M,R&R Alternatives

320
Figure 9.13 (Cont’d)

321
Figure 9.13 (Cont’d)
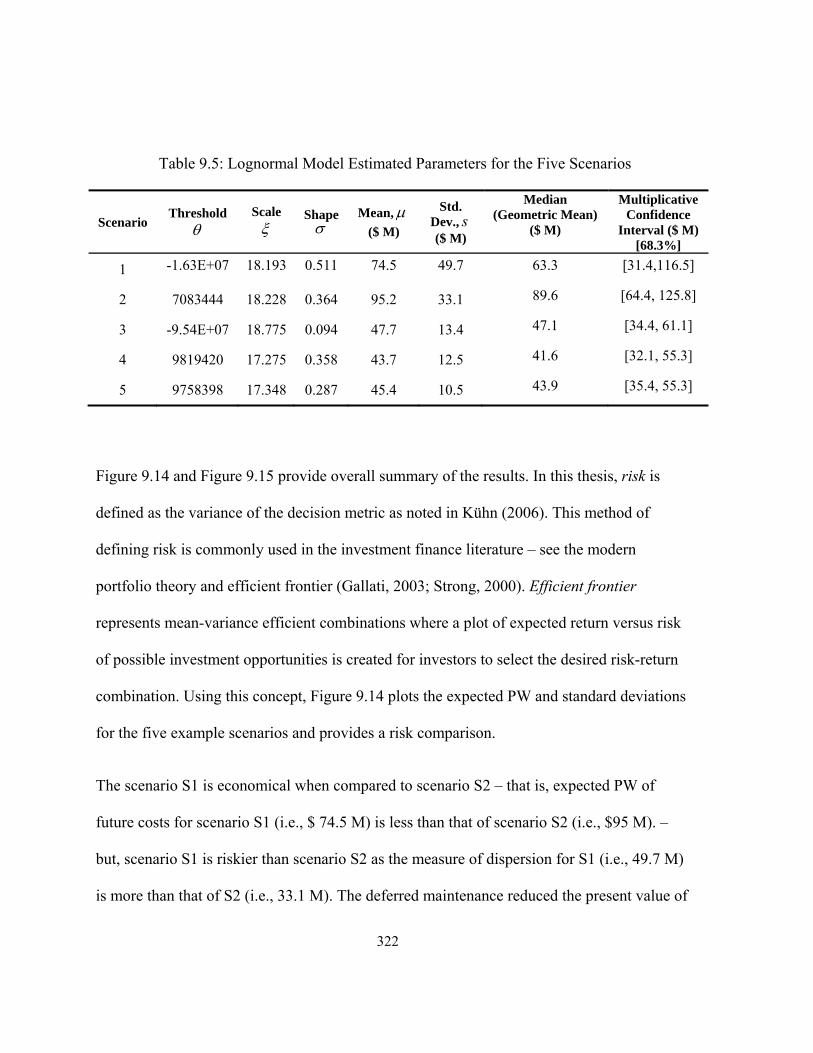
322
Table 9.5: Lognormal Model Estimated Parameters for the Five Scenarios
Scenario Threshold
Scale
Shape
Mean,
($ M)
Std. Dev., s ($ M)
Median (Geometric Mean)
($ M)
Multiplicative Confidence
Interval ($ M) [68.3%]
1 -1.63E+07 18.193 0.511 74.5 49.7 63.3 [31.4,116.5]
2 7083444 18.228 0.364 95.2 33.1 89.6 [64.4, 125.8]
3 -9.54E+07 18.775 0.094 47.7 13.4 47.1 [34.4, 61.1]
4 9819420 17.275 0.358 43.7 12.5 41.6 [32.1, 55.3]
5 9758398 17.348 0.287 45.4 10.5 43.9 [35.4, 55.3]
Figure 9.14 and Figure 9.15 provide overall summary of the results. In this thesis, risk is
defined as the variance of the decision metric as noted in Kühn (2006). This method of
defining risk is commonly used in the investment finance literature – see the modern
portfolio theory and efficient frontier (Gallati, 2003; Strong, 2000). Efficient frontier
represents mean-variance efficient combinations where a plot of expected return versus risk
of possible investment opportunities is created for investors to select the desired risk-return
combination. Using this concept, Figure 9.14 plots the expected PW and standard deviations
for the five example scenarios and provides a risk comparison.
The scenario S1 is economical when compared to scenario S2 – that is, expected PW of
future costs for scenario S1 (i.e., $ 74.5 M) is less than that of scenario S2 (i.e., $95 M). –
but, scenario S1 is riskier than scenario S2 as the measure of dispersion for S1 (i.e., 49.7 M)
is more than that of S2 (i.e., 33.1 M). The deferred maintenance reduced the present value of

323
future net costs, but increased the variability that shows significant risk and impacts on the
system. Figure 9.14 shows that S1 is the most risky strategy (Std. Dev. = $49.7 M), whereas
S5 is the least risky one (Std. Dev. = $10.5 M). Scenario S4 is the least cost alternative (i.e.,
$43.7 M), whereas the scenario S2 has the highest cost (i.e., $95.2 M).
Figure 9.15 shows the risk profiles of estimated PW values for scenarios S3, S4 and S5
(scenario S1 and S2 are dropped because of high expected PW and risk values). The vertical
scale in Figure 9.15 represents the probability of exceeding various levels of PW. For
example, there is 50% probability that the PW of future costs will be between $40M and
$50M under scenarios S3, S4, and S5. The slopes of the plot represent the risk in terms of
variability – that is, flatter the slope, higher the risk. Scenarios S3, S4 and S5 are close to
each other, and the estimated PW and standard deviation appear to be indistinguishable. To
verify if the difference between estimated PW values for scenarios S4 and S5 is statistically
significant, two non-parametric tests, namely, Mann-Whitney Two Sample Rank-Sum Test
and Median Test are performed. Unlike the Independent-Samples t test, Mann-Whitney Two
Sample Rank-Sum Test and Median Test do not require the dependent variable to have
normal distribution (Chatfield, 1995; Schlotzhauer, 1987).
Mann-Whitney Two Sample Rank-Sum Test assesses the hypothesis that two independent
samples of data have identical distributions. The results presented in Table 9.6 show that the
Wilcoxson statistic equals 942216.

324
Figure 9.14: Risk Comparison of Five Management Scenarios
0%
25%
50%
75%
100%
10 20 30 40 50 60 70 80 90 100
Present Worth ($, Millions)
Pro
bab
ilit
y o
f E
xcee
din
g
Pre
sen
t W
roth
Scenario S3 Scenario S4 Scenario S5
Figure 9.15: Risk Profile – Present Worth of Future Costs Vs Probability
0
10
20
30
40
50
60
0 20 40 60 80 100
St.
Dev
. of P
rese
nt
Wo
rth
($ M
)
Expected Present Worth ($ M)
S1
S2
S3
S4
S5

325
The normal approximation results one-sided and two-sided p-value less than 0.0001 which is
significant at 0.05 level. Therefore, there is statistically significant difference between the
underlying distributions of PW of future costs under scenarios S4 and S5.
Mann-Whitney Two Sample Rank-Sum Test assesses the hypothesis that two independent
samples of data have identical distributions. The results presented in Table 9.6 show that the
Wilcoxson statistic equals 942216. The normal approximation results one-sided and two-
sided p-value less than 0.0001 which is significant at 0.05 level. Therefore, there is
statistically significant difference between the underlying distributions of PW of future costs
under scenarios S4 and S5.
The Mann-Whitney Two Sample Rank-Sum Test compares entire distributions, and it is
possible for two data samples to have significant Wilcoxson statistic but the same median –
that is, two samples may have different distributions but approximately equal medians
(Acock, 2008). The Median Test performs a K-sample test on equality of medians. To assess
if the PW values under scenarios S4 and S5 are drawn from populations having the same
median, a two-sample Median test is performed. The results presented in Table 9.7 show a
2 1 value of 13.448 with corresponding p-value of less than 0.001. This is significant as p-
value is less than the significance level of 0.05. Therefore, the null hypothesis, that medians
are equal, is rejected in favor of alternative hypothesis that they are not equal. Thus, the
differences in present worth of future net costs are statistically significant.
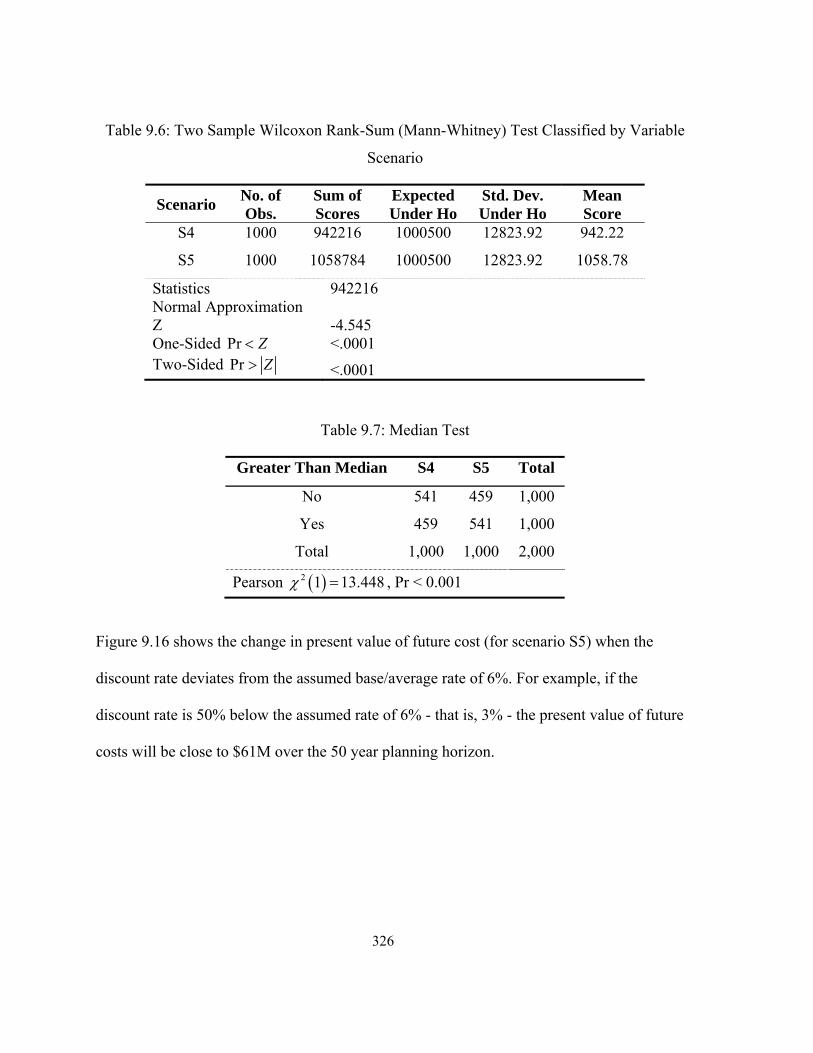
326
Table 9.6: Two Sample Wilcoxon Rank-Sum (Mann-Whitney) Test Classified by Variable
Scenario
Scenario No. of Obs.
Sum of Scores
Expected Under Ho
Std. Dev. Under Ho
Mean Score
S4 1000 942216 1000500 12823.92 942.22
S5 1000 1058784 1000500 12823.92 1058.78
Statistics 942216 Normal Approximation Z -4.545 One-Sided Pr Z <.0001 Two-Sided Pr Z <.0001
Table 9.7: Median Test
Greater Than Median S4 S5 Total
No 541 459 1,000
Yes 459 541 1,000
Total 1,000 1,000 2,000
Pearson 2 1 13.448 , Pr < 0.001
Figure 9.16 shows the change in present value of future cost (for scenario S5) when the
discount rate deviates from the assumed base/average rate of 6%. For example, if the
discount rate is 50% below the assumed rate of 6% - that is, 3% - the present value of future
costs will be close to $61M over the 50 year planning horizon.

327
30
35
40
45
50
55
60
65
-50% -40% -30% -20% -10% 0% 10% 20% 30% 40% 50%
Discount Rate Deviation from Base Case (i.e., 6%)
Pre
se
nt
Va
lue
of
Co
st
($M
)
Figure 9.16: Sensitivity Analysis for Scenario S5 – Change in Present Value of Costs with
Discount Rate
9.9 Discussion and Conclusions
This paper, second in the two part series, presented application of the strategic financial
planning framework detailed in Part 1. The deterioration modeling and economic analysis is
employed as a management tool for long-term financial planning and proactive management,
rehabilitation, and replacement of wastewater pipelines. The analyses show that deferred
maintenance of wastewater infrastructure is not cost-effective in the long-term, and that an
early intervention can save millions of dollars for governments and public works departments
responsible for providing and managing wastewater collection systems. The example case
study used high quality condition assessment data from the City of Niagara Falls wastewater
collection pipelines. Reinforced concrete pipes with diameter ranging from 250 mm to 750

328
mm – making up approximately 35% of the system – are considered. The analyses revealed
that scenario S2 – that is, keeping the system at the current level of service – is the most
expensive option with an estimated present worth of future costs ranging from $64.4M to
$125.8M over the 50 year planning horizon. Scenario S4 – that is, replacing ICG 5 pipes and
renovating ICG 4 pipes – is the most cost-effective alternative, and the estimated present
worth of future costs for this option is $32.1M to $55.3M over the life-cycle analysis period
of 50 years. Scenario S5, i.e., renovating ICG 3 and 4 pipes along with replacing ICG 5
pipes, is the least risky option having minimum uncertainty in terms of variability of present
worth of costs. The estimated costs for this option vary between $35.4M and $55.3M over a
50 year period. Based on our analyses, we conclude that scenario S4 is the most cost-
effective strategy, but assumes more risk as compared to scenario S5. Comparing scenario S5
(i.e., proactive maintenance, rehabilitation, and replacement) with scenario S2 (status-quo),
the City can save up to $50M over the 50 year planning horizon.
The analysis presented in this paper supports the finding of Burgess (1990) provided that the
least cost option is the only decision criteria and the risk dimension is ignored. The
sustainable funding model proposed by Bainbridge and Macey (2005) did not take into
account the risk resulting from the uncertainty associated with input variables. The
methodology presented in NCHRP (2003) and Haas et al. (2006) for Life-Cycle Cost
Analysis (LCCA) of transportation assets could be very laborious if large number of
scenarios were involved. The deterioration model and LCCA presented in Haas et al. (2006)
can be improved by using ordinal regression model and financial simulation. Tighe (2001)
compared the life-cycle costs for pavements by fitting (a) normal, and (b) lognormal
329
distributions to input and out variables. According to Limpert et al. (2001), the normal and
lognormal distributions cannot be described in the same way – that is, using mean and
standard deviation for both types of distributions. Salem et al. (2003) did not describe any
model for output variable, and fell short of discussing the risk resulting from the variability in
LCC (life-cycle costs) for alternative pavement management strategies. Variability in LCC
for different alternatives should be taken into account because the least cost alternative –
selected by ignoring the variability – may not be the least risky scenario. The risk-based LCC
methodology for pavement infrastructure presented by Osman (2005) and FHWA (1998) is
comparable to this study. However, Osman (2005) used internal rate-of-return as the decision
metric, and both FHWA (1998) and Osman (2005) did not characterize the distribution of
output variables.
Typically, output variable(s) from Monte Carlo distributions are characterized by their mean,
, and standard deviation, , (see for e.g., Osman, 2005; Salem et al., 2003; Tighe, 2001
Greenberg, 2003). This practice assumes that the output variable is normal. This assumption
needs to be verified before drawing conclusions. Furthermore, the risk due to variability of
decision metric(s) is often overlooked which may result in selecting minimum cost but high
risk alternative.
The framework and analyses presented in this series of papers provide a useful tool for
strategic planning related to wastewater infrastructure management activities. The presented
analyses and findings will improve decision-making concerning the development of long-
term wastewater infrastructure management plans, commitment of resources, and

330
establishment of defensible policies. It is recommended that the life-cycle cost studies be
reviewed and revised (if necessary) at the end of every strategic planning cycle – may vary
between 5 to 10 years depending upon a particular utility – due to changes in technology,
operating environments, government legislations, business processes, and stakeholders’
expectations. It is noted that the consideration of uncertainty and risk in economic analysis
and financial planning is data intensive. Developing and maintaining a proper database
system for inventory and condition assessment, and maintenance, renovation and
replacement projects will provide the much needed data for future research in this area. At
the minimum, such database should include the system attributes (e.g., pipe size, condition,
rehabilitated/replaced length along with chainage, material, depth, original date of
construction, rehabilitation/replacement date), site attributes (e.g., depth, location, traffic),
and information about renovation/replacement techniques and related costs for each project.
Collecting good quality data is the foundation for improved decision making related to the
investment of billions of dollars in restoration and reconstruction of existing infrastructure,
and will result in cost savings in the order of millions of dollars.
Acknowledgments
The research presented in this paper is sponsored by the Canadian Water Network (CWN)
and Natural Sciences and Engineering Research Council of Canada (NSERC). The ongoing
research partners include the Centre for Advancement of Trenchless Technologies at the
University of Waterloo, the City of Niagara Falls, and Pipeflo Contracting Corp. Their
assistance is gratefully appreciated and acknowledged.
331
References
Acock, A. C. (2008). A gentle introduction to Stata (Second ed.). Texas, USA: Stata Press.
Bainbridge, K., & Macey, C. (2005). The development of advanced asset deterioration
models and their role in making better rehabilitation decisions. No-Dig 2004, Orlando,
Florida.
Burgess, E. H. (1990). Planning model for sewer system rehabilitation. Water Resources
Infrastructure: Needs, Economics, and Financing, Apr 18-20 1990, 12-17.
Chatfield, C. (1995). Problem solving : A statistician's guide. London ; New York: London ;
New York : Chapman & Hall.
Emblemsvag, J. (2003). Life-cycle costing, using activity-based costing and Monte Carlo
methods to manage future costs and risks. New Jersey, USA: John Wiley & Sons, Inc.
FHWA. (1998). Life-cycle cost analysis in pavement design (Technical Bulletin No. FHWA-
SA-98-079). Washington, DC, USA: U.S. Department of Transportation. Retrieved from
http://isddc.dot.gov/OLPFiles/FHWA/013017.pdf
FHWA. (2002). Life-cycle cost analysis primer No. FHWA-IF-02-047). Washington, USA:
U.S. Department of Transportation. Retrieved from
http://isddc.dot.gov/OLPFiles/FHWA/010621.pdf
Gallati, R. R. (2003). Risk management and capital adequacy. New York ; London: New
York ; London : McGraw-Hill.
Greenberg, J. S., 1931-. (2003). In American Institute of Aeronautics and Astronautics (Ed.),
Economic principles applied to space industry decisions. Reston, Virginia: Reston,
Virginia : American Institute of Aeronautics and Astronautics.

332
Haas, R., Tighe, S. L., & Cowe Falls, L. (2006). Determining return on long-life pavement
investments. (1974) 10-17.
Hudson, W. R., Haas, R., & Uddin, W. (1997). Infrastructure management: Integrating
design, construction, maintenance, rehabilitation, and renovation. New York: McGraw-
Hill.
Kühn, J. (2006). Optimal risk-return trade-offs of commercial banks and the suitability of
profitability measures for loan portfolios. Berlin: Springer Berlin Heidelberg.
Leung, K., Macey, C., & Toupin, E. (2007). Development of Deterioration and Sustainable
Funding Models for Sewer Infrastructure in the Lower Mainland of B.C.. British
Columbia, Canada: British Columbia Water & Waste Association. Retrieved from
http://www.bcwwa.org/annual_conference/BCWWA_Papers_2007.php
Limpert, E., Stahel, W. A., & Abbt, M. (2001). Log-normal distributions across the sciences:
Keys and clues. Bioscience, 51(5), 341-352.
MacLeod, C. W., Ariaratnam, S. T., & Chua, K. (2000). Evaluation of emergency repair
attributes for sewer infrastructure management. Canadian Society for Civil Engineering,
Annual Conference, 10.
Madanat, S., Mishalani, R., & Wan Ibrahim, W. H. (1995). Estimation of infrastructure
transition probabilities from condition rating data. Journal of Infrastructure Systems,
1(2), 120-125.
McBride, G. B., 1948-. (2005). Using statistical methods for water quality management :
Issues, problems and solutions. Hoboken, N.J.: Hoboken, N.J. : John Wiley.
Millard, S. P. (2001). In Neerchal N. K. (Ed.), Environmental statistics with S-plus. Boca
Raton: Boca Raton : CRC Press.
333
Mishalani, R. G., & Madanat, S. M. (2002). Computation of infrastructure transition
probabilities using stochastic duration models. Journal of Infrastructure Systems, 8(4),
139-148.
NCHRP. (2003). Bridge life-cycle cost analysis No. 483). Washington, D.C.: Transportation
Research Board.
Osman, H. (2005). Risk-based life-cycle cost analysis of privatized infrastructure. (1924)
192-196.
Pearson, N. D. (2002). Risk budgeting: Portfolio problem solving with value-at-risk .
Canada: John Wiley & Sons, Inc.
Salem, O., AbouRizk, S., & Ariaratnam, S. (2003). Risk-based life-cycle costing of
infrastructure rehabilitation and construction alternatives. Journal of Infrastructure
Systems, 9(1), 6-15.
Schlotzhauer, S. D. (1987). In SAS I. (Ed.), SAS system for elementary statistical analysis.
Cary, NC : SAS Institute, c1987: Cary, NC : SAS Institute, c1987.
Shahata, K., & Zayed, T. (2008). Simulation as a tool for life cycle cost analysis. 2008
Winter Simulation Conference, WSC 2008, pp. 2497-2503.
Strong, R. A. (2000). Portfolio construction, management and protection. Cincinnati, Ohio:
Cincinnati, Ohio : South Western College Pub.
Tighe, S. (2001). Guidelines for probabilistic pavement life cycle cost analysis.
Transportation Research Record, (1769), 28-38.
Wirahadikusumah, R., Abraham, D., & Iseley, T. (2001). Challenging issues in modeling
deterioration of combined sewers. Journal of Infrastructure Systems, 7(2), 77-84.

334
Wirahadikusumah, R., & Abraham, D. M. (2003). Application of dynamic programming and
simulation for sewer management. Engineering, Construction and Architectural
Management, 10(3), 193-208.
Younis, R., & Knight, M. A. (2008). An empirical model for the prediction of structural
behaviour of wastewater collection systems. ASCE International Pipelines Conference
2008, Atlanta, GA.
Zayed, T. M., Chang, L., & Fricker, J. D. (2002). Life-cycle cost analysis using deterministic
and stochastic methods: Conflicting results. Journal of Performance of Constructed
Facilities, 16(2), 63-74.
Zhao, J., & Rajani, B. (2002). Construction and rehabilitation costs for buried pipe with a
focus on trenchless technologies No. 101). Ottawa, Canada: Institute for Research in
Construction, National Research Council of Canada. Retrieved from http://www.nrc-
cnrc.gc.ca/obj/irc/doc/pubs/rr/rr101/rr101.pdf

335
Chapter 10
Conclusions, Contributions and Future Recommendations
10.1 General Summary
Wastewater collection networks continue to be the most neglected of all the civil
infrastructure systems. The emphasis of this thesis was what should be done and how to do it
for cost-effective and intelligent maintenance, rehabilitation and replacement of wastewater
collection systems. Five research goals are established: (1) development of a high quality
wastewater pipelines condition assessment database; (2) development of a framework to
integrate heterogeneous data from various wastewater collection networks; (3) investigating
the degradation behaviour of wastewater pipelines; (4) presenting a new strategic
management framework; and (5) demonstrating the use of economic principles and
deterioration model to support decision-making process. The conclusions from each of the
above undertakings are discussed in detail at the end of each chapter. The following sections
provide a summary of the limitations, and key findings and contributions of this research.
10.2 Conclusions and Contributions
10.2.1 Condition Assessment Database
Lack of good quality inventory and condition assessment data on wastewater collection
networks is one of the limiting issues in understanding their performance behaviour. A high
quality condition assessment database, WatBAMS (Waterloo Buried Asset Management
Systems), using state-of-the-art Side Scanning and Evaluation Technology is developed. The

336
development of WatBAMS not only provided the foundation for the research presented in
this thesis but will support future research projects in this area that are not possible due to
non-existent or incomplete datasets. WatBAMS integrates with the GIS (geographic
information system) and can be easily upgraded to include operational and financial data. It
contains key asset attributes, such as pipelines age, location, length, diameter, depth, and
structural and operational condition, and can be easily mined to generate detailed reports on
various types of defects and their severity along the length of a pipe.
10.2.2 Data Integration Framework
A standard data model for wastewater collection networks is highly unlikely as
municipalities operate independent of each other, and define their business processes and
data needs at local levels. This data needs to be aggregated by resolving data representational
heterogeneity to create new knowledge. A data warehousing technique for wastewater
infrastructure data integration is proposed. The example implementation – using XML
technologies and specifications – suggests that it is a viable approach to aggregate data and
information from a variety of municipal organizations. This will help in developing more
powerful deterioration models and enhance our understanding about wastewater pipelines
performance under a variety of operating conditions.
10.2.3 Deterioration Models
Two new deterioration models are proposed. The presented analyses are more vigorous and
the proposed models are more parsimonious – have lesser number of parameters – than the
337
existing deterioration models for wastewater pipelines. Parsimonious models tend to
generalize because it is relatively easy to apply these models to untested situations. The
importance of verifying model assumptions is also highlighted. The research found that the
majority of existing models violate model assumptions and/or that assumptions were not
verified due to data limitations. The deterioration of reinforced concrete (RC) pipes is found
to be age related, owing to their susceptibility to corrosion due hydrogen sulphide, moisture,
and other reactive agents in domestic sewage. For the City of Niagara Falls, it is estimated
that, for RC pipes, the probability of being in the worst internal condition grade (WRc’s ICG
5) surpassed the probabilities of being in lower grades at about 75 years of age. For vitrified
clay (VC) pipes, it is concluded that they can have infinite life provided they are installed in
good condition and are not subject to installation damage or excessive loadings. This infinite
service life is greater than the current assumed life of 80 years. The proposed model(s) can be
used to determine the wastewater pipelines service life, predict future condition states, and
future rehabilitation and maintenance needs.
10.2.4 Framework for Multi-Perspective Management of Wastewater Collection
Networks
New regulatory requirements demand more effective infrastructure management systems that
are able to meet end-users expectations, protect public health and environment, and allow for
efficient allocation of funds and greater disclosure. The research shows that the majority of
asset management initiatives die down due to the gaps between strategy formulation and
execution. A comprehensive review of management theories and tools is carried out. The
review revealed that a multi-perspective strategic management framework based on modified

338
balanced scorecard model will best meet the objectives of accountability, protecting public
health and environment, and providing sustainable wastewater collection networks. The
proposed framework takes into account four strategic perspectives – Social/Political,
Financial, Operational/Technical, and Regulatory – and devises four strategic themes for
sustainable wastewater collection systems. It should be noted that due to the enormity of the
task, and time, space, and data limitations, only Operational/Technical perspective is
discussed in detail with an example application using management tools, such as strategy
maps and dashboard reports. The proposed framework and allied system helps in aligning
asset management processes with an organization’s mission and vision. By using the
proposed framework, gaps between strategy formulation and implementation become
obvious, and mitigating strategies can be formulated in real time.
10.2.5 Strategic Financial Planning
The work in strategic financial planning – that is, identification of short- and long-term
funding needs and development of financial plans – at the wastewater collection network
level is scarce. The proposed strategic financial planning framework takes into account the
uncertainty of input variables to estimate short- and long-term financial requirements for
effective maintenance, rehabilitation and replacement of wastewater collection systems. It
also assists with devising capital improvement plans and answering critical questions, such
as: (1) impact of alternative management strategies on the network condition over the
planning horizon; (2) financial implications of various management alternatives; and (3)
impact of discount rate on life-cycle costs. Research found that, for RC pipes at the City of
339
Niagara Falls wastewater collection network, rehabilitating ICG (internal condition grade) 4
pipes and replacing ICG 5 pipes is the most cost-effective strategy, whereas, rehabilitating
ICG 3 and 4 pipes and replacing ICG 5 pipes is the least risky option. The analysis reveals
that a proactive M,R&R strategy for RC pipelines can save up to $50 million for the City of
Niagara Falls over the 50 year analysis period.
10.3 Considerations for the Research Implementation
The presented analyses and results are based on 400 Kms of wastewater pipelines’ condition
assessment data collected by the City of Niagara Falls. To develop deterioration models, utmost
efforts were expended to ensure high quality, representative data for reinforced concrete (RC) and
vitrified clay (VC) pipes from the City of Niagara Falls’ wastewater collection system. As such, the
presented deterioration models are applicable to the RC and VC wastewater pipelines at the City of
Niagara Falls. It is recommended that these models be validated on data from other wastewater
collection systems prior to their use.
The proposed models consider only the effects of pipes’ age and material on the degradation
behaviour of wastewater pipelines. It is to be noted that wastewater pipelines’ deterioration is
influenced by additional factors, such as workmanship during installation, soil type, soil corrosivity,
ground conditions and disturbances, operating environment and load history, and pipelines’ cleaning
activities. It is the author’s opinion that data required to quantify the impact of these factors is not
readily available. For the City of Niagara Falls wastewater collection network, a review of
geotechnical reports found that the ground water table was below the pipes’ invert along with no
significant difference in the soil backfill and pipe depth. Therefore, ground water table, depth of
340
pipes’ burial and soil backfill type were nearly constant across the City of Niagara Falls network and
have no impact on pipes’ deterioration.
The presented management framework proposed a mechanism to quantify the strategic
management objectives with respect to the four perspectives: socio-political,
operational/technical, financial, and regulatory. It is recommended that network owners
update, standardize and implement the proposed performance indicators, as well as, the
measurements’ ratings and weights.
The wastewater pipelines’ maintenance, rehabilitation and replacement (M,R&R) decisions
are often site-specific and, therefore, depends – in addition to costs – on wastewater service
providers’ experience and availability of particular M,R&R technologies in the area. The
case study to demonstrate the application of deterioration model and economic principles for
long-term financial planning, considered average costs of intervention (from the published
literature) for the M,R&R of wastewater pipelines in various internal condition grades during
pipes’ life-cycle. Furthermore, the condition of the RC wastewater pipes in the network was
predicted using the deterioration model based on the condition assessment data from the City
of Niagara Falls. It is recommended that a network specific analysis, similar to the one
presented in this thesis, be completed to estimate long-term financial requirements for
providing sustainable wastewater collection infrastructure.

341
10.4 Future Recommendations
To provide sustainable wastewater collection infrastructure, governments and regulators are
emphasizing the importance of determining actual costs of service provision. The focus of
physical infrastructure asset management is shifting towards service-oriented management
where end-users are involved to define level of service and associated costs. Understanding
the long-term performance of wastewater collection networks is very critical in this regards.
The following recommendations are provided for the future work:
High quality data needs to be collected and aggregated from various wastewater
collection networks to generalize the deterioration behaviour of wastewater collection
pipelines.
Further research is required to validate the proposed deterioration model(s) in other
networks and to model the deterioration of pipe materials other than RC and VC.
A long-term pipelines condition assessment and performance monitoring initiative is
highly desired.
The proposed strategic model and related system needs to be implemented, and scoring
system and weighting validated. An overall serviceability index, using a consensus
building methodology, such as Delphi technique, will be useful.

342
Historical cost and project data need to be compiled to ascertain materials, labour and
construction costs over time. This is required to develop more reliable financial models,
and will help in establishing a more useful and relevant construction cost index for
buried utilities.