development of w-beam slotted rail end terminal design
TRANSCRIPT

TEXAS TRANSPORTATION INS Tl TU TE
DEVELOPMENT OF W-BEAM SLOTTED RAIL END TERMINAL DESIGN
by
King K. Mak Research Engineer
Roger P. Bligh Engineering Research Associate
and
Wanda C. Menges Research Associate
Research Report RF 7199-3F Research Study No. RF 7199
"Crash Testing and Evaluation of Tennessee Bridge Rail and Guardrail Designs"
Sponsored by
Tennessee Department of Transportation Nashville, Tennessee
May 1994
Texas Transportation Institute THE TEXAS A&M UNIVERSITY SYSTEM
COLLEGE STATION, TEXAS

APPROXIMATE CONVERSIONS TO SI UNITS APPROXIMATE CONVERSIONS FROM SI UNITS
Symbol When You Know Multiply By To Find Symbol Symbol When You Know Multiply By To Find Symbol
LENGTH LENGTH
in inches 25.4 millimeters mm mm millimeters 0.039 inches in ft feet 0.305 meters m m meters 3.28 feet ft yd yards 0.914 meters m m meters 1.09 yards yd mi miles 1.61 kilometers km km kilometers 0.621 miles mi
AREA AREA
in2 square inches 645.2 square millimeters mm2 mrn2 square millimeters 0.0016 square inches in2
ft2 square feet 0.093 square meters mZ mZ square meters 10.764 square feet ft2 yd2 square yards 0.836 square meters mZ mZ square meters 1.195 square yards ac ac acres 0.405 hectares ha ha hectares 2.47 acres mi2
mi2 square miles 2.59 square kilometers km2 km2 square kilometers 0.386 square miles
VOLUME VOLUME
floz fluid ounces 29.57 milliliters ml ml milliliters 0.034 fluid ounces floz gal gallons 3.785 liters I I liters 0.264 gallons gal
..... ft3 cubic feet 0.028 cubic meters m3 m3 cubic meters 35.71 cubic feet ft3 ..... ycP cubic yards 0.765 cubic meters m3 m3 cubic meters 1.307 cubic yards ycP
NOTE: Volumes greater than 1000 I shall be shown in m3•
MASS MASS
oz ounces 28.35 grams g g grams 0.035 ounces oz lb pounds 0.454 kilograms kg kg kilograms 2.202 pounds lb T short tons (2000 lb) 0.907 megagrams Mg Mg megagrams 1.103 short tons (2000 lb) T
TEMPERATURE (exact) TEMPERATURE (exact)
OF Fahrenheit 5(F-32)/9 Celcius oc oc Celcius 1.8C +32 Fahrenheit OF temperature or (F-32)/1.8 temperature temperature temperature
ILLUMINATION ILLUMINATION
fc foot-candles 10.76 lux Ix lux 0.0929 foot-candles fc fl foot-Lamberts 3.426 candela/m2 c;d'mZ c;d'mZ candela/m2 0.2919 foot-Lamberts fl •
FORCE and PRESSURE or STRESS FORCE and PRESSURE or STRESS
lbf poundforce 4.45 newtons N N newtons 0.225 poundforce lbf
psi poundforce per 6.89 kilopascals kPa kPa kilopascals 0.145 poundforce per psi square inch square inch
• SI is the symbol for the International System of Units. Appropriate (Revised August 1992) rounding should be made to comply with Section 4 of ASTM E380.

DISCLAIMER
The contents of this report reflect the views of the authors who are solely responsible
for the opinions, findings, and conclusions presented herein. The contents do not necessarily
reflect the official views or policies of the Tennessee Department of Transportation or the
Federal Highway Administration. This report does not constitute a standard, specification or
regulation.
KEYWORDS
W-Beam Guardrail, End Treatment, End Terminal, Highway Safety
ACKNOWLEDGMENTS
The study was sponsored by the Tennessee ·Department of Transportation, in
cooperation with the Federal Highway Administration. Mr. Peter Falkenberg, Certification
Acceptance Engineer, was the Project Engineer for the Tennessee Department of Transportation
and his guidance and support are deeply appreciated. The study was overseen by a steering
committee consisting of Mr. Edward P. Wasserman, Engineering Director, Structures Division,
Mr. Clifford F. Stewart, Design Engineering Supervisor II, Special Design Office, and Mr.
Falkenberg of the Tennessee Department of Transportation and Mr. Clarence E. Bennett,
Bridge and Safety Management Engineer of the Federal Highway Administration - Tennessee
Division. The authors are very appreciative of their comments and suggestion. Dr. Dean L.
Sicking, currently Director of the Midwest Roadside Safety Facilities, University of Nebraska,
assisted the project staff in the design and development of the slotted rail end terminal and his
contribution is gratefully acknowledged.
111

EXECUTIVE SUMMARY
The overall objective of this study was to analyze and evaluate the impact performance
of various bridge rail, guardrail, transition, and end terminal designs currently in use by the
Tennessee Department of Transportation (TDOT). The project was divided into two phases.
Phase I involved the evaluation of various bridge rail, guardrail, transition, and end terminal
designs through theoretical analyses and computer simulation. Phase II involved the full-scale
crash testing and evaluation of existing and modified designs which were selected by TDOT
for further evaluation. There are three major areas in the Phase II study:
1. Crash testing and evaluation of bridge railing designs,
2. Crash testing and evaluation of W-beam guardrail to bridge parapet transition
designs, and
3. Design, development, crash testing and evaluation of a W-Beam slotted rail end
terminal design.
This is the third volume of the final report for Phase II of the study, summarizing the
effort undertaken to design, develop, crash test and evaluate a slotted-rail end terminal design
for use with standard W-beam guardrails on highways with speed limits of 45 miles per hour
(72.4 km/h) or less. The scope of work included design, theoretical analysis, pendulum testing
and full-scale crash testing. An end terminal design utilizing the slotted rail concept was
successfully developed and crash tested in this study.
IV

TABLE OF CONTENTS
METRIC CONVERSION TABLE . . . . . . . . . . . . . . . . . . . . . . . . . . . . . . . . . . . . . . 11
DISCLAIMER ................................................... 111
KEY WORDS . . . . . . . . . . . . . . . . . . . . . . . . . . . . . . . . . . . . . . . . . . . . . . . . . . . . 111
ACKNOWLEDGMENTS . . . . . . . . . . . . . . . . . . . . . . . . . . . . . . . . . . . . . . . . . . . . 111
EXECUTIVE SUMMARY ............................................ iv
LIST OF FIGURES . . . . . . . . . . . . . . . . . . . . . . . . . . . . . . . . . . . . . . . . . . . . . . . . vu
LIST OF TABLES ................................................. x
I. INTRODUCTION . . . . . . . . . . . . . . . . . . . . . . . . . . . . . . . . . . . . . . . . . . . . 1
1.1 BACKGROUND . . . . . . . . . . . . . . . . . . . . . . . . . . . . . . . . . . . . . . . 1 1.2 STUDY OBJECTIVE AND SCOPE . . . . . . . . . . . . . . . . . . . . . . . . . . 4
II. SLOTTED RAIL END TERMINAL DESIGN . . . . . . . . . . . . . . . . . . . . . . . . 5
2.1 SLOTTED RAIL END TERMINAL DESIGN CONCEPT . . . . . . . . . . . 5 2.2 DESIGN CRITERIA . . . . . . . . . . . . . . . . . . . . . . . . . . . . . . . . . . . . . 8 2.3 FINAL DESIGN DETAILS . . . . . . . . . . . . . . . . . . . . . . . . . . . . . . . . 9 2.4 COST ESTIMATE . . . . . . . . . . . . . . . . . . . . . . . . . . . . . . . . . . . . . . 16
III. STUDY APPROACH . . . . . . . . . . . . . . . . . . . . . . . . . . . . . . . . . . . . . . . . 17
3.1 PENDULUM TESTING . . . . . . . . . . . . . . . . . . . . . . . . . . . . . . . . . . 17 3.2 FULL-SCALE CRASH TESTING . . . . . . . . . . . . . . . . . . . . . . . . . . 19
3 .2.1 Electronic Instrumentation and Data Processing . . . . . . . . . . . . . 22 3.2.2 Photographic Instrumentation and Data Processing ........... 23 3.2.3 Test Vehicle Propulsion and Guidance .................... 23
IV. RESULTS OF PENDULUM AND DEVELOPMENTAL CRASH TESTS ..... 25
-
4.1 PENDULUM TESTS . . . . . . . . . . . . . . . . . . . . . . . . . . . . . . . . . . . . 25 4.2 DEVELOPMENT AL ·CRASH TESTS . . . . . . . . . . . . . . . . . . . . . . . . . 27
4.2.1 Test Number 7199-8 . . . . . . . . . . . . . . . . . . . . . . . . . . . . . . . . 28 4.2.2 Test Number 7199-8A ............................... 39 4.2.3 Test Number 7199-11 . . . . . . . . . . . . . . . . . . . . . . . . . . . . . . . 48 4.2.4 Test Number 7199-13 ............................... 67
v

TABLE OF CONTENTS (Continued)
V. RESULTS OF COMPLIANCE CRASH TESTS ....................... 79
5.1 TEST NUMBER 7199-7 ..... · ............................. 79 5.2 TEST NUMBER 7199-14 .................................. 89 5.3 TEST NUMBER 7199-15 .................................. 96
VI. SUMMARY OF FINDINGS AND RECOMMENDATIONS ............. 109
6.1 SUMMARY OF FINDINGS . . . . . . . . . . . . . . . . . . . . . . . . . . . . . . . 109 6.2 RECOMMENDATIONS AND DISCUSSIONS ................. 110
-.REFERENCES .................................................. 112
APPENDICES
A. DIMENSIONS AND INFORMATION OF THE TEST VEHICLES A-1
B. SEQUENTIAL PHOTOGRAPHS OF THE IMPACTS ................. B-1
C. VEHICULAR ACCELERATION VERSUS TIME TRACES ............. C-1
D. VEHICULAR ANGULAR DISPLACEMENT VERSUS TIME PLOTS ...... D-1
Vl

LIST OF FIGURES
Figure Page
1 Schematic of Slot Configuration . . . . . . . . . . . . . . . . . . . . . . . . . . . . . . . . . . 6
2 Schematic of Slotted Rail End Terminal Design . . . . . . . . . . . . . . . . . . . . . . 10
3 Photographs of Pendulum Testing Facility . . . . . . . . . . . . . . . . . . . . . . . . . . 18
4 Test Installation for Pendulum Testing . . . . . . . . . . . . . . . . . . . . . . . . . . . . . 20
5 Slotted rail end treatment before test 7199-8 .......................... 29
6 Vehicle prior to test 7199-8 ..................................... 30
7 Vehicle/slotted rail geometrics for test 7199-8 . . . . . . . . . . . . . . . . . . . . . . . . . 31
8 Vehicle/slotted rail after test 7199-8 ................................ 33
9 Slotted rail end treatment after test 7199-8 . . . . . . . . . . . . . . . . . . . . . . . . . . . 34
10 Vehicle after test 7199-8 ....................................... 35
11 Damage to door of vehicle after test 7199-8 .......................... 36
12 Summary of results for test 7199-8 ................................ 37
13 End treatment before test 7199-8A ................................. · 41
14 Vehicle before test 7199-8A ..................................... 42
15 Vehicle/end treatment geometrics for test 7199-8A ..................... 43
16 Vehicle/end treatment after test 7199-8A ............................ 44
17 End Treatment after test 7199-8A ................................. 45
18 Damage at post 3 . . . . . . . . . . . . . . . . . . . . . . . . . . . . . . . . . . . . . . . . . . . . . 46
19 Vehicle after test 7199-8A ...................................... 47
20 Summary of results for test 7199-8A ............................... 49
21 Front and rear view of slots ..................................... 52
Vll

LIST OF FIGURES (Continued)
Figure Page
22 End treatment before test 7199-11 ................................. 53
23 Vehicle prior to test 7199-11 . . . . . . . . . . . . . . . . . . . . . . . . . . . . . . . . . . . . . 54
24 Vehicle/end treatment geometrics for test 7199-11 ...................... 55
25 Test site after test 7199-11 ......... '.. ............................ 56
26 Damage to end treatment after test 7199-11 .......................... 57
27 Vehicle after test 7199-11 ....................................... 59
28 Vehicle after being uprighted (after test 7199-11) ...................... 60
29 Undercarriage of vehicle after test 7199-11 ........................... 61
30 Summary of results for test 7199-11 ............................... 64
31 End treatment before test 7199-11 . . . . . . . . . . . . . . . . . . . . . . . . . . . . . . . . . 68
32 Vehicle before test 7199-13 ..................................... 69
33 Vehicle end/treatment geometrics for test 7199-13 ...................... 70
34 Test site after test 7199-13 ...................................... 72
3 5 End treatment after removal of vehicle for test 7199-13 . . . . . . . . . . . . . . . . . . 73
36 Vehicle after test 7199-13 ....................................... 74
3 7 Summary of results for test 7199-13 . . . . . . . . . . . . . . . . . . . . . . . . . . . . . . . 7 5
38 Slotted rail end treatment before test 7199-7 .......................... 81
39 Vehicle before test 7199-78 ..................................... 82
40 Vehicle/slotted rail geometrics for test 7199-7 . . . . . . . . . . . . . . . . . . . . . . . . . 83
41 Slotted rail end treatment after test 7199-7 . . . . . . . . . . . . . . . . . . . . . . . . . . . 85
4 2 Vehicle after test 7199-7 . . . . . . . . . . . . . . . . . . . . . . . . . . . . . . . . . . . . . . . 86
Vlll

LIST OF FIGURES (Continued)
Figure Page
43 Summary of results for test 7199-7 ................................ 87
44 End treatment before test 7199-14 . . . . . . . . . . . . . . . . . . . . . . . . . . . . . . . . . 90
45 Vehicle prior to test 7199-14 ..................................... 91
46 Vehicle/end treatment geometrics for test 7199-14 . . . . . . . . . . . . . . . . . . . . . . 92
47 Test site after test 7199-14 ...................................... 93
48 Damage to end treatment after test 7199-14 . . . . . . . . . . . . . . . . . . . . . . . . . . 94
49 Vehicle after test 7199-14 ....................................... 95
50 Summary of results for test 7199-14 . . . . . . . . . . . . . . . . . . . . . . . . . . . . . . . 97
51 Slotted rail end treatment before test 7199-15 ....... , ................. 99
52 Slotted rail, posts 1 and 2, before test 7199-15 . . . . . . . . . . . . . . . . . . . . . . . 100
53 Vehicle before test 7199-15 . . . . . . . . . . . . . . . . . . . . . . . . . . . . . . . . . . . . 101
54 Vehicle/end treatment geometrics for test 7199-15 . . . . . . . . . . . . . . . . . . . . . 102
5 5 Test site after test 7199-15 . . . . . . . . . . . . . . . . . . . . . . . . . . . . . . . . . . . . . 104
56 Slotted rail erid treatment after test 7199-15 . . . . . . . . . . . . . . . . . . . . . . . . . 105
57 Vehicle after test 7199-15 . . . . . . . . . . . . . . . . . . . . . . . . . . . . . . . . . . . . . . 106
58 Summary of results for test 7199-15 . . . . . . . . . . . . . . . . . . . . . . . . . . . . . . 107
59 Details of Slotted Bearing Plate . . . . . . . . . . . . . . . . . . . . . . . . . . . . . . . . 111
IX

LIST OF TABLES
Table Page
1 Summary of Pendulum Test Results . . . . . . . . . . . . . . . . . . . . . . . . . . . . . . 26
2 Summary of Previous Pendulum Test Results . . . . . . . . . . . . . . . . . . . . . . . 26
3 Performance Evaluation Summary - Test Number 7199-8 . . . . . . . . . . . . . . . 38
4 Performance Evaluation Summary - Test Number 7199-8A . . . . . . . . . . . . . . 50
5 Performance Evaluation Summary - Test Number 7199-11 . . . . . . . . . . . . . . . 65
6 Performance Evaluation Summary - Test Number 7199-13 . . . . . . . . . . . . . . . 76
7 Performance Evaluation Summary - Test Number 7199-7 . . . . . . . . . . . . . . . . 88
8 Performance Evaluation Summary - Test Number 7199-14 . . . . . . . . . . . . . . . 98
9 Performance Evaluation Summary - Test Number 7199-15 108
x

I. INTRODUCTION
The overall purpose of this study was to analyze and evaluate the impact performance
of various bridge rail, guardrail, transition, and end terminal. designs currently in use by the
Tennessee Department of Transportation (TDOT). The project was divided into two phases.
Phase I involved the evaluation of various bridge rail, guardrail, transition, and end terminal
designs through theoretical analyses and computer simulationCL~. Phase II involved the full
scale crash testing and evaluation of existing and modified designs which were selected by
TDOT for further evaluation. There are three major areas in the Phase II study:
1. Crash testing and evaluation of bridge railing designs,
2. Crash testing and evaluation of W-beam guardrail to bridge parapet transition
designs, and
3. Design, development, crash testing and evaluation of a W-Beam slotted rail end
terminal design.
This is the third volume of the final report for Phase II of the study, summarizing the
effort undertaken to design and develop a crashworthy slotted-rail end terminal design for use
with standard W-beam guardrails for application on highways with speed limits of 45 mi/h
(72.4 km/h) or less.
1.1 BACKGROUND
The development of crashworthy guardrail end terminals has long been a difficult
problem for the roadside safety community. Early guardrails were constructed with untreated
stand-up ends, resulting in catastrophic accidents in which rail elements speared and impaled
impacting vehicles. Considerable efforts have been undertaken to develop crashworthy
guardrail end terminals in recent years with good success. Existing guardrail end safety
treatments for W-beam guardrails include: turned-down, breakaway cable terminal (BCT),
eccentric loader terminal (ELT), modified eccentric loader terminal (MELT), CAT, SENTRE,
BRAKEMASTER, and the ET-2000. Brief descriptions of these existing end treatments are
presented as follows.
1

Turned-down end treatments involve sloping the end of the W-beam rail down to the
ground and attaching it to a rigid foundation. The turned-down end terminal is the least
expensive of all the end treatments and used extensively in a number of states. However, it
has been found that the turned-down end terminal causes impacting vehicles to ramp up and
vault over the end treatment, oftentimes resulting in rollovers. For this reason, the Federal
Highway Administration (FHW A), in a memorandum dated June 28, 1990 from the Director
of the Office of Highway Safety to the Regional Federal Highway AdministratorsC3>, has
indicated that:
• Turned-down terminals should not be used on new installations of guardrails for
freeway, expressway, or other high-speed, high-volume facilities.
• Safety improvement projects, hazard elimination projects, or 3R/4R projects on
high-speed, high-volume facilities should require replacement of turned-down
terminals with approved terminals.
• Use of turned-down terminals on projects involving high-speed, but moderate
traffic carrying facilities should be considered on a case-by-case basis or an
approved State developed policy.
• Use of turned-down terminals on low-speed or any low-volume facility may be
allowed based on. reasonable risk management considerations.
The FHW A has thus prohibited the use of turned-down terminals for high-speed, high
volume facilities although the use of turned-down terminals is still permissible, after due risk
management considerations, for low-speed or low-volume facilities.
The breakaway cable terminal (BCT) is the most widely used end treatment since its
conception and initial testing in 1972. The BCT end treatment is designed to cause the W
beam guardrail to "gate" or buckle out of the way of an impacting vehicle and to allow the
impacting vehicle to penetrate behind the guardrail in a controlled manner. However, since
the design relies on the dynamic buckling of the W-beam rail, it has been found that the impact
performance of the BCT is very sensitive to installation details, such as barrier flare rate and
end offset. Consequently, the BCT end treatment has not had a favorable service history.
Furthermore, even when installed correctly with a 4-ft (1.22-m) parabolic flare offset, the BCT
has been shown to impart unacceptably high deceleration forces on 1,800-lb (817-kg) mini-size
2

vehicles during 60 mi/h (96.6 km/h) impacts and has failed to meet the evaluation criteria set
forth in National Cooperative Highway Research Program (NCHRP) Report 230.<1>
The eccentric loader terminal (EL T) and the modified eccentric loader terminal (MELT)
are improvements over the standard BCT. The designs are still based on the "gating" concept
and the dynamic buckling of the W-beam rail for energy dissipation and controlled penetration.
These end treatments have been successfully crash tested in accordance with NCHRP Report
230 requirements with a flare offset of 4 ft (1.22 m) and with marginally acceptable results for
a flare offset of 18 in ( 457 mm). The EL T and MELT end terminals suffer from similar
drawbacks as the standard BCT terminal, being sensitive to installation details. Further, the
mechanisms are relatively complicated and have presented problems in actual field installations.
Also, the costs of these end terminals are considerably higher than that of a standard BCT
terminal.
The CAT end treatment consists of overlapping guardrail sections that have a series of
closely spaced slots. Guardrail segments are attached with bolts through the slots. When a
vehicle impacts the end terminal, the bolts are forced to tear through the W-beam from one slot
to the next. As a result, the W-beam rail segments are cut into several long ribbons as the
impacting vehicle is being decelerated. This design is relatively new and does not yet have
an extensive field service record. The CAT end treatment is also very costly.
The SENTRE end treatment is constructed from a series of breakaway steel guardrail
posts and frangible plastic sand containers. Impacting vehicles are decelerated as the guardrail
posts are broken and the sand containers are impacted. A ground cable is incorporated to
direct vehicles away from the end of the barrier to which it is attached. The system is very
expensive and therefore has not gained wide acceptance.
The BRAKEMASTER end treatment attenuates impact energy through friction
developed when a steel clamp slides along a wire rope. The design suffers from the same
problems as the CAT and SENTRE in that it is very costly.
The ET-2000 end terminal attenuates head-on impacts through the flattening and
bending of the W-beam rail element which brings the impacting vehicle to a controlled stop.
The primary components of the terminal are a feeder chute which provides moment resistance
for the terminal during end-on impacts, and an extruder which dissipates the energy of an
3

impacting vehicle through plastic deformation of the W-beam rail element. One of the
advantages of this end terminal is that it is designed for use on a tangent section of the
guardrail with no flare or offset. This design is relatively new and does not have an extensive
field service record. It is also relatively expensive which limits its use to roadways with
relatively high speed and traffic volume.
With the exception of the turned-down and the standard BCT end terminals, the other
end terminal designs are relatively expensive. The turned-down end terminal is no longer
approved for federal-aid projects on high-speed highways. The standard BCT terminal requires
a 4-ft (1.22-m) flare offset which is oftentimes not available on low-speed, low-volume
highways. Furthermore, the standard BCT terminal does not meet the small car crash test
requirements set forth in NCHRP Report 230. There remains, therefore, a need for an end
terminal to be used with W-beam guardrails that is crashworthy, has a relatively low-cost, and
is applicable to installation with reduced flare offset.
1.2 STUDY OBJECTIVE AND SCOPE
The objective for this portion of the study was to design and develop a crashworthy end
terminal for use with standard W-beam guardrails on highways with speed limits of 45 mi/h
(72.4 km/h) or less.
Chapter II of this report provides detailed descriptions of the design concept, design
criteria, and the final end terminal design. Chapter III outlines the study approach. Results
of the pendulum tests and developmental crash tests are documented in Chapter IV of the
report. Chapter V presents the results of the compliance crash tests. A summary of the study
findings, conclusions and recommendations is presented in Chapter VI.
4

II. SLOTTED RAIL END TERMINAL DESIGN
The slotted rail end terminal design developed in this study was based on the split . rail
end terminal design concept, previously developed under another study conducted at Texas
Transportation Institute (TTI).@ This design concept was selected by TDOT as the basis for
developing a new crashworthy end-terminal design for W-beam guardrails on highways with
speed limits of 45 mi/h (72.4 km/h) or less. A number of modifications and refinements were
made to the initial conceptual design during the course of this study to arrive at the final
design. Discussions on the initial design concept, the design criteria, and the final design
details are presented in this chapter.
2.1 SLOTTED RAIL END TERMINAL DESIGN CONCEPT
The split rail end terminal concept involves cutting longitudinal slots in the W-beam rail
element to reduce its dynamic buckling strength sufficiently to safely accommodate small car
impacts while maintaining sufficient capacity to stop full-size vehicles within a reasonable
distance for end-on impacts and to contain and redirect impacting vehicles in side impacts with
the guardrail installation. As shown in figure 1, the W-beam rail element cross-section can be
cut into four relatively flat segments by placing a longitudinal slot at each peak and valley in
the cross-section. The three 0.5-in (13-mm) wide longitudinal slots reduce the cross-sectional
area in the slotted region from 1.99 to 1.83 in2 (1,284 to 1,181 mm2), which is still greater than
the cross-sectional area of 1.61 in2 (1,039 mm2) through the four bolt holes at a splice. Thus,
the tensile capacity of the W-beam is not reduced since the tensile capacity of the W-beam rail
element at the slotted segments is still higher than that at a splice.
On the other hand, the moment of inertia of the W-beam rail element is significantly
reduced by the slots. The moment of inertia of an unmodified 12-gauge W-beam rail element
is approximately 2.33 in4 (38,182 mm4). In comparison, the combined moments of inertia of
the four relatively flat segments is only 0.02 in4 (328 mm4). Thus, the buckling strength of a
slotted W-beam cross-section is only 1 percent of that of an unmodified cross-section.
The split rail end terminal design with a 4-ft (1.22-m) parabolic flare offset over the last
37.5 ft (11.4 m) of the guardrail has successfully passed all required compliance crash tests. W
5

Section A-A Standard W-beam
Section B-8 Slotted W-beam
Figure 1 . Schematic of slot configuration.
6

The test installation incorporated 27-in (686-mm) long slots and weakened wooden posts for
the first eight spans, i.e., the first 50 ft (15.24 m) of guardrail installation. The wooden end
post was placed in a_ concrete foundation and a BCT breakaway cable anchor assembly was
used to connect the W-beam rail element to theend post so as to provide tensile capacity for
the W-beam rail element. A ground line cable connected these weakened wooden posts to
prevent rotation of the posts and to ensure clean breaks at ground level. A buffered end
section was wrapped around the end of the terminal to distribute impact forces over the front
of the impacting vehicles.
The slots were protected with cover plates to prevent any intrusion by the bumper or
other parts of the impacting vehicle into the slots. It was found in one of the developmental
· crash tests that intrusion of parts of the impacting vehicle into the slots could lead to tearing,
ripping, and extending of one of the slots until it reached a splice, at which point the W-beam
rail element would rupture and allow the vehicle to penetrate through the guardrail. The cover
plate was bolted to one end of the slotted segment while the other end of the cover plate was
attached to the W-beam rail with clips that can slide relative to the W-beam, thereby allowing
the slots to collapse under axially compressive loading.
Also, two intermediate posts were added in spans 3 and 4, which effectively reduced
the post spacing in those spans to 3 ft-1.5 in (0.95 m). The reduced post spacing increased the
lateral stiffness of the guardrail which in turn improved the capacity of the terminal to handle
redirectional or side impacts by large cars. Note that these two additional posts were not
attached to the W-beam rail element.
Despite the successful impact performance and the relative low cost (estimated to be
$750 or less per installation), the split rail end terminal design was never adopted for field
installation, probably due to concerns over aesthetics and potential installation and maintenance
problems.
The original split rail end terminal concept was retained for the slotted rail end terminal
design, i.e., the use of slots in the rail element to reduce the bending moment of inertia and to
facilitate controlled buckling of the W-beam rail element. The emphasis of the redesign effort
was to: (1) reduce the offset from 4 ft (1.22 m) to 18 in (0.46 m); (2) optimize the slot lengths;
and (3) develop an alternative to replace the cover plate, which was considered a potential
7
maintenance problem and not aesthetically pleasing. More detailed discussions on the design
criteria used in designing and developing the slotted rail end terminal design are presented in
the next section.
2.2 DESIGN CRITERIA
The design criteria used in the development of this new end terminal for W-beam
guardrails are summarized below:
1. Meet nationally recognized safety standards, i.e., successfully crash tested in
accordance with guidelines presented in NCHRP Report 230.
2. For use on highways with speed limits of 45 mi/h (72.4 km/h) or lower.
3. Perform satisfactorily when installed with a flare offset of 18 in (0.46 m).
4. Have relatively low construction costs.
The most critical design consideration is perhaps the flare offset of the end terminal.
The standard BCT terminal design requires a flare offset of 4 ft (1.22 m). A flare offset of this
magnitude is oftentimes not available on low-speed, low-volume roadways due to the lack of
available clear recovery area on the roadside. It would be desirable to design the end terminal
for tangent application or at least to accommodate a smaller flare offset.
According to guidelines presented in NCHRP Report 230<1.>, barrier end treatments are
required to provide safe deceleration or controlled barrier penetration for vehicles impacting
upstream from the beginning of the length-of-need (LON) and barrier anchorage for redirecting
vehicles impacting beyond the LON. Most existing end terminal designs are based on either
the concept of gating, i.e., allowing the impacting vehicle to penetrate behind the guardrail in
a controlled manner such as the standard BCT terminal, or energy attenuation, i.e., bringing
the vehicle to a controlled and safe stop such as the ET-2000 terminal.
A tangent application, initially preferred by TDOT, would require the end terminal
design to be based strictly on the concept of energy attenuation since there is no eccentricity
in the system for the end terminal to gate. The slotted rail end terminal design does have
energy attenuation capability through buckling and collapsing of the slots and would likely
work well for small car end-on impacts. However, there would be some potential problems
for the large car end-on crash test. In a previous test of a 4,500-lb (2,043-kg) passenger car
8

head-on into the split rail end terminal design with no flare offset at 60 mi/h (96.6 km/h), the
vehicle ramped over the top of the end terminal and continued down the test installation on top
of the guardrail for some distance before coming to rest. <2> Even though the vehicle did not
roll over or sustain excessive deceleration rates, such ramping behavior is not considered
desirable.
The slotted rail end terminal design employs both of these concepts, i.e., gating and
energy attenuation. Energy from the impacting vehicle is dissipated through buckling and
collapsing of the slots, which slows down the impacting vehicle prior to gating. After some
consideration, the flare offset distance selected for the design was 18 in (0.46 m), which is the
same as that for the ELT and the MELT. This flare offset of 18 in (0.46 m) was considered
as the minimum offset for the gating mechanism to function properly.
Costs associated with the end terminal is also a major consideration. Roadside
guardrails are relatively inexpensive and are often constructed in short segments. Costs
associated with the end terminals have become a major part of the total cost of many barrier
installations. For example, W-beam guardrails generally costs approximately $12 per linear
foot while the lowest-cost end treatment (i.e., turned-down end terminal) costs about $500 per
installation. A typical 500-ft (152.4-m) guardrail installation would then cost $6,000 for the
guardrail and another $1,000 for the two turned-down end terminals. Other end treatments are
even more expensive, costing up to $3,000 or more per unit. The cost of two of these
terminals would be as high as or higher than the total cost of the guardrail for a typical
installation. Thus, the cost of the end terminal was an important factor considered during the
design process.
2.3 FINAL DESIGN DETAILS
Figure 2 shows details of the final design of the slotted rail end terminal that was
successfully crash tested. The major components of the slotted rail end terminal design are
listed as follows:
I. A 25-ft (7.62-m) section of slotted W-beam rail element with four sets of slots.
Slot guards are bolted to the downstream ends of the slots to minimize the
potential for tearing or ripping of the rail element at the slots.
9

...... 0
I
l I
I I I I I I
I l I I I I I I I I
LJ
Tangent line projected from the face of the last two post blocks in the standard post section.
Plan
25'-0" Slotted Rail (See Detail A)
18'-9" Flare
\Post not connected to rail
\---, ~A
Standard G4(1 S) Guardrail
Slotguard (See Detail B)
.- EH~, t·1 ) ~ I I ,_, I I
1-1 1-1 Ill
See Detail F I I I I lll L-J L-J 111
I ~-1 ~-~ Ill I I 1 I I 111
! I i ! J : Ill I I : I ! ! !Ji I I I I I I 111 I I t I I I 111 I I l.-J l_J W
6'-S' _t 6'-3"-L 6'-3" -L 6'-3" -L 6'-3" J Elevation
45 MPH SLOTTED RAIL TERMINAL
Figure 2. Schematic of slotted rail end terminal design.

--
~----------------------- 25'-0" -------------------------i
.__ ____ 6'-3" -----+-------- 6'-3" _____ F ____ 6'-3" -----.iF----- 5· 3"
21 s1s·r1s"--J 3·-1 112 .. -1 ~A • 3·-1 112 .. -1 . 3·-1 112 .. -1-20 3/4'~ I 1 16"1 12" rg·+g·~ I I
~-s-a-, ........... ~··· ~ .............. .. ===:::E~J
-~==>L~-:l-t..J ~-•-•..J
3/4" © Hole for Connection of Buffer End Section
6" -1 ~ I· 6" 6" ·I ~ I· 6"
Existing 3/4" x 2 1/2" Post Slot (Typ.)
Cable Anchor Plate
Slotted W-beam
3/ 4" © holes for 5/8" bolts (TYP)
Slotguard --~ (See Detail B)
SECTION A-A
Note: At locations shown, cut three 1 /2" slots. One on each peak, and one in the valley of the W-beam.
DETAIL A SLOTIED RAIL ELEMENT
8 1/2"
4 1 3/4"
+-2 1/2"
t-2 1/2"
+-1 3/4"
'
NOTE: All holes 3/ 4" diam.
DETAIL B SLOTGUARD
© ©
© c±>
©
©
(t)
(t)
1 3/16" R3/8"
Figure 2. Schematic of slotted rail end terminal design (continued).

...... N
Terminal Section (Adjust to Fit)
5 1 /2" x 7 1 /2" Breakaway Wooden Posts ARTBA P-59-76 (See Detail D)
1 '-9 5/8"
ARTBA F -3-76 Bolt with ARTBA F -13-73 Washer Under Bolt Head and Nut
6'-3" ----------i 1'-6" 1'-4" 1'-0"
1 '-8 3/4"
3/ 4" (J) Hole for----+----+---.. Slot Guard (See Detail
~-1--- Anchor Plate ARTBA RE - 71 - 79
Connection of Buffer End Section
Bearing Plate
sL
I I I I I eE> I I I I I I I
it- -1 I I
" I TS 6x8x3/16x5'-0 Longl: Steel Foundation Tube i
I I I I I I I I I I I I I I I I I I I
L---l
Wooden Breakaway Posts
'--- ARTBA F-37-76
>---- 5/8" Dia. Hex .Bolts and Nuts-3 (Typical) ARTBA F-8-76.
Soil Plate
DETAIL C END ANCHORAGE ASSEMBLY
.. ---
L---
Figure 2. Schematic of slotted rail end terminal design (continued).
Dia.
4'-10"

r 7 112" 7" ~---~-
7"
18" 3/4" © Hole 3/4" ()) Hole
3'-6 1/2'1_ 6'-0" 3 1 /2" Q) Hole
2" J =====-= 2 3/8" © Hole
3/4" © Hole
S4S
DETAIL D SHORT BREAKAWAY WOODEN POST
7"
18"
3/4" © Hole for 5/8" Bolt (Rail not attached)
DETAIL E WOODEN CRT POST
r3"-1 0
1;2·1_ Shelf Angle
3'-6 (See Detail) I I 3/4" Diam. Hole 7 1/2" 6 1/8"
2"J ------- 2 3/8" CD Hole L l_ 3/4" <D Hole l_
--
1-- 6" --l T, I 4" S4S ~ 2"~ Steel Plate
Shelf Angle
DETAIL F RAIL CONNECTION AT POST 2
Figure 2. Schematic of slotted rail end terminal design (continued).
13

2. A buffered end section, similar to that used with the standard BCT terminal, is
attached to the end of the slotted rail section to distribute the impact load.
3. All four posts (posts 1 through 4) within the 25-ft (7.62-m) end terminal section
are wooden breakaway posts. Posts 1 and 2 are placed in steel foundation tubes
while posts 3 and 4 are controlled release terminal (CRT) posts. Standard
wooden or steel guardrail posts are then used from post 5 on.
4. A post spacing of 6 ft 3 in (1.95 m) is used with the end terminal section.
5. A breakaway cable attachment, similar to that used with the BCT end terminal,
is used to provide anchorage for the guardrail.
6. A straight flare offset of 18 in (0.46 m) is used, starting at post 4, i.e., the
offsets at posts 1, 2, 3 and 4 are 18 in (457 mm), 12 in (305 mm), 6 in (152
mm), and zero (0), respectively.
The pattern of the slots for the first 25-ft (7.62-m) section of W-beam rail element is
shown in detail A of figure 2. Four sets of slots are used, one at mid-span for each of the first
four spans. Note that the slots in the first span (i.e., between posts 1 and 2) are offset 2 in (51
mm) toward post 1 to accommodate the breakaway cable anchor plate. The lengths of the slots
are 18 in (457 mm) for the first two spans and 12 in (305 mm) for the third and fourth spans.
The main reason for using longer slots for the first two spans is to separate the impulse
of breaking the wooden end post from that of buckling and collapsing the first set of slots.
The longer slots also have a slightly lower buckling force which helps to soften the initial
impulse and to reduce the yaw rate of the vehicle in the early stages of the impact. Shorter
slots are used in spans 3 and 4 to reduce the potential for the bumper or other parts of the
impacting vehicle to protrude into the slots during redirectional impacts and to stiffen the end
terminal for the large vehicle end-on impacts.
Cover plates used in the original split rail end terminal were replaced with bolt-on slot
guards. The slot guard is attached to the downstream end of each set of slots to prevent
extension of the slots as observed in the split rail end terminal testing. The slot guard both
reinforces the W-beam rail element and provides a 45-degree deflector plate to push the rail
element away from any vehicle component that intruded into the slots. The slot guard design
14

alleviates the perceived problems with aesthetics, installation and maintenance associated with
the use of cover plates. Details of the slot guard are shown as detail B of figure 2.
A standard buffered end or terminal section, similar to that used with the standard BCT
terminal, is attached to the end of the slotted rail section to distribute the impact load. The end
anchorage system is also similar to that of the BCT end terminal, as shown in detail C of
figure 2. A 6 in x 8 in (152 mm x 203 mm) x 5 ft (1.52 m) long steel foundation tube
provides the required anchorage capacity. A cable anchorage assembly is attached to the W
beam rail element at one end and anchored to the end wooden post and the foundation tube
through a hole in the base of the post.
The first two posts are 5-1/2 in x 7-112 in (140 mm x 191 mm) wooden breakaway
posts placed in foundation tubes to ensure proper breaking of the posts. These posts were
weakened with a 2-3/4-in (70-mm) diameter hole at the base, as shown in detail D of figure
2. The next two posts (posts 3 and 4) are wooden 6 in x 8 in (152 mm x 203 mm) CRT posts.
Two 3-112-in (89-mm) diameter holes are drilled into the CRT posts, one at ground line and
the other at 16 in (406 mm) below surface, to facilitate fracture of the post upon impact.
Details of the CRT post are shown as detail E in figure 2.
Note that the W-beam rail element is not bolted to post 2. Instead, a shelf angle is used
to support the rail element, as illustrated in detail F of figure 2. Based on crash test results,
there is concern that the bolt at post 2 may not disengage properly, which would cause
excessive force to build up and prevent downstream slotted sections from buckling properly.
On the other hand, it was found in another crash test that, without an intermediate support
between the first two sets of slots, the buckled rail element could potentially rotate downward,
thus allowing the vehicle to ramp over and mount the guardrail. The shelf angle, details of
which are shown in detail F of figure 2, provides support to the rail element at post 2 and
eliminates the need for a bolt at that post.
This slotted rail end terminal is designed for use with a minimum flare offset of 18 in
(0.46 m). As mentioned previously, a flare offset of 18 in (0.46 m) was considered as the
minimum offset for the gating mechanism to function properly and was therefore selected for
the design. A straight line flare starting at post 4 is used instead of the parabolic flare used
15

with the standard BCT end terminal. This straight flare configuration simplifies the layout and
installation of the end terminal.
2.4 COST ESTIMATE
The major components of this end terminal include: (1) one 25-ft (7.62 m) section of
slotted W-beam rail element, (2) four slot guards, (3) two breakaway wooden posts placed in
foundation tubes, (4) two wooden CRT posts, and (5) one buffered end section. With the
exception of the 25 ft (7.62-m) section of slotted W-beam rail element, the slot guards, and the
two CRT posts, the other components are standard BCT end terminal components. It is
difficult to estimate the actual costs of slotted rail and slot guards since these components were
manually fabricated in the prototype installation and the costs are, as may be expected, much
higher than what may be expected when these components are manufactured on a large scale.
For example, the slots were machined manually for the prototype installations. Discussions
with manufacturers indicate that, for mass production, the slots could be punched at a very low
cost. However, there will be some initial tooling costs, which can be amortized over all the
units manufactured and sold over the life of the special tools. Thus, the tooling cost per unit
of rail element is a function of the demand.
16

III. STUDY APPROACH
The study approach was divided into two major tasks:
1. Further development of conceptual design, and
2. Crash testing and evaluation of the end terminal design.
As mentioned previously, a split rail end terminal design was previously developed
under another study. <il The design concept was further improved and modified during the
course of this study. Additional pendulum testing was conducted to determine the energy
absorbing characteristics of different slot lengths and the effect of the slot guard. The results
of these pendulum tests were then used to select the appropriate slot lengths and configurations
for use with the end terminal design. Design details were added, deleted, or modified in
conjunction with the fabrication of the prototype installations. A series of crash tests were then
conducted to evaluate the performance of the end terminal design in accordance with guidelines
presented in NCHRP Report 230. Additional modifications were made to the design based on
the results of developmental crash tests.
Brief descriptions of the procedures used in the pendulum testing and full-scale crash
testing are presented in this chapter.
3.1 PENDULUM TESTING
Pendulum testing provides an inexpensive means of assessing the energy absorbing
characteristics of different slot lengths and configurations. The pendulum testing facility, as
shown in figure 3, consists of a structural frame for hanging of the pendulum mass. The
pendulum mass weighs approximately 2,300 lb (1,044 kg) and is supported by four steel cables
in such a manner as to insure continuous horizontal alignment and lateral stability of the
impacting mass. The nose of the pendulum mass is outfitted with a sliding mechanism which
can be used to house a honeycomb assembly to simulate the crush characteristics of selected
vehicles. Since the pendulum tests conducted in this study were developmental in nature, a
rigid nose cushioned with a piece of wood and a 1-112-in (38-mm) thick rubber pad was used
instead of the honeycomb assembly.
17

~ -··---·
Figure 3 Pendulum Testing Facility.
18

The pendulum mass can be raised to different heights using a winch mechanism to
attain different impact speeds of up to a maximum of 25 mi/h (40.2 km/h). After the
pendulum mass is raised to the desirable height for a pre-determined impact speed, a solenoid
release hook is then activated to release the pendulum mass to initiate the test. A soil pit or
a rigid steel mounting plate is available for installation of the test article into the ground, e.g.,
base plates for breakaway structures, posts for barriers,etc. Also, a rigid steel backup structure
is available for support of the test article in the horizontal direction.
The pendulum mass was instrumented with a single accelerometer in the longitudinal
direction to measure acceleration levels. The electronic signals from the accelerometer were
telemetered to a base station for recording on magnetic tape and for display on a real-time strip
chart. After the test, the data were filtered with a SAE J211 Class 180 filter and digitized
using a microcomputer. Data analyses included plots of acceleration level versus displacement
and energy dissipated versus displacement. Photographic coverage of the pendulum tests
included one 3/4-in videotape camcorder and still cameras for documentary purposes.
Figure 4 shows the test configuration for the pendulum testing. W-beam rail sections,
12.5 ft (3.81 m) in length, were used as test specimens. The back end of the W-beam rail
section was bolted to the rigid steel backup structure. A wooden CRT post, mounted in a steel
foundation tube, supported the rail section in the middle and separated the rail element into two
spans. Each test specimen had two sets of slots mid-span of the two spans. An impact plate
was bolted to the front end of the W-beam rail section to minimize the potential for non-axial
loading of the rail.
3.2 FULL-SCALE CRASH TESTING
According to guidelines presented in NCHRP Report 230, four compliance crash tests
are required to evaluate the performance of a barrier end terminal design. These four
compliance crash tests are as follows:
1. Test Designation 40. A 4,500-lb (2,041-kg) passenger car impacting the
installation at the beginning of length-of-need at the nominal speed and angle
of 60 mi/h (96.6 km/h) and 25 degrees. The objective of this test is to evaluate
the adequacy of the terminal anchorage.
19

Figure 4 Test installation for pendulum testing.
20

2. Test Designation 41. A 4,500-lb (2,041-kg) passenger car impacting the end
terminal head-on at the center of the nose at the nominal speed of 60 mi/h (96.6
km/h). _The objective of this test is to evaluate the energy-absorbing/dissipation
properties of the end terminal.
3. Test Designation 44. An 1,800-lb (817-kg) passenger car impacting the
installation midway between the nose and the length of need at a nominal impact
speed and angle of 60 mi/h (96.6 km/h) and 20 degrees. The objective of this
test is to assess the stability of the vehicle when impacting the end terminal
upstream of the length-of-need.
4. Test Designation 45. An 1,800-lb (817-kg) passenger car impacting the end
terminal head-on with an offset of 15 in (0.38 m) from the center of the nose at
a nominal impact speed of 60 mi/h (96.6 km/h). The objective of this test is to
evaluate the impact performance of the terminal for small-car end-on impacts.
Since the intended application of this new slotted rail end terminal design is for
highways with speed limits of 45 mi/h (72.4 km/h) or less, the nominal impact speeds for these
crash tests were reduced from 60 to 45 mi/h (96.6 to 72.4 km/h). Accordingly, all future
references to these crash tests in this report will refer to nominal impact speeds of 45 mi/h
(72.4 km/h) instead of the standard 60 mi/h (96.6 km/h).
For the purpose of evaluating the performance of this slotted rail end terminal design,
only three of the four compliance crash tests were deemed necessary. Test designation 44,
which involves an 1,800-lb (817-kg) passenger car impacting the installation midway between
the nose and the length of need at a nominal impact speed and angle of 45 mi/h (72.4 km/h)
and 20 degrees was considered not necessary. The rationale for this decision was that this
crash test was successfully conducted with the original split rail end terminal design at a
nominal speed of 60 mi/h (96.6 km/h). The modifications made to the end terminal design in
this study should not affect the stability of the vehicle or occupant risk factors for this small
car redirectional test. The nominal impact speed is lower at 45 mi/h (72.4 km/h). The angle
of impact is also lower since the slotted rail end terminal was designed for a flare offset of 18
in (0.46 m) as compared to a flare offset of 4 ft (l.22 m) for the split rail end terminal design.
It was therefore concluded that a repeat of this particular test was unnecessary and thus not
21

conducted. The Federal Highway Administration (FHWA) was consulted and agreed to this
decision. <tD
All crash tests and data analysis were conducted in accordance with guidelines
contained in NCHRP Report 230. Brief descriptions of the crash test and data analysis
procedures are presented as follows.
3.2.1 Electronic Instrumentation and Data Processing
Each test vehicle was instrumented with three solid-state angular rate transducers to
measure roll, pitch and yaw rates; a triaxial accelerometer at the vehicle center-of-gravity to
measure longitudinal, lateral, and vertical acceleration levels, and a back-up biaxial
accelerometer in the rear of the vehicle to measure longitudinal and lateral acceleration levels.
The accelerometers were strain gauge type with a linear millivolt output proportional to
acceleration.
The electronic signals from the accelerometers and transducers were transmitted to a
base station by means of constant bandwidth FM/FM telemetry link for recording on magnetic
tape and for display on a real-time strip chart. Provision was made for the transmission of
calibration signals before and after the test, and an accurate time reference signal was
simultaneously recorded with the data. Pressure sensitive contact switches on the bumper were
actuated just prior to impact by wooden dowels to indicate the elapsed time over a known
distance to provide a measurement of impact velocity. The initial contact also produced an
"event" mark on the data record to establish the exact instant of contact with the guardrail.
The multiplex of data channels, transmitted on one radio frequency, was received at a
data acquisition station, and demultiplexed into separate tracks of Intermediate Range
Instrumentation Group (LR.LG.) tape recorders. After the test, the data was played back from
the tape machines, filtered with a SAE J211 Class 180 filter, and were digitized using a
microcomputer, for analysis and evaluation of impact performance. The digitized data were
then processed using two computer programs: DIGITIZE and PLOTANGLE. Brief
descriptions on the functions of these two computer programs are given below.
The DIGITIZE program uses digitized data from vehicle-mounted linear accelerometers
to compute occupant/compartment impact velocities, time of occupant/compartment impact
22

after vehicle impact, and the highest 10-ms average ridedown acceleration. The DIGITIZE
program also calculates a vehicle impact velocity and the change in vehicle velocity at the end
of a given impulse period. In addition, maximum average accelerations over 50-ms intervals
in each of the three directions are computed. Acceleration versus time curves for the
longitudinal, lateral, and vertical directions are then plotted from the digitized data of the
vehicle-mounted linear accelerometers using a commercially available software package.
The PLOTANGLE program uses the digitized data from the yaw, pitch, and roll rate
charts to compute angular displacement in degrees at 0.00067-sec intervals and then instructs
a plotter to draw a reproducible plot of yaw, pitch, and roll versus time. It should be noted
that these angular displacements are sequence dependent with the sequence being yaw-pitch-roll
for the data presented herein. These displacements are in reference to the vehicle-fixed
coordinate system with the initial position and orientation of the vehicle-fixed coordinate
system being that which existed at initial impact.
3.2.2 Photographic Instrumentation and Data Processing
Photographic coverage of each test included three high-speed cameras: one overhead
with a field of view perpendicular to the ground and directly over the impact point; one placed
to have a field of view parallel to and aligned with the guardrail system at the downstre~ end;
and a third placed behind the barrier to document wheel contact on the guardrail posts and end
of the concrete parapet. A flash bulb activated by pressure sensitive tapeswitches was
positioned on the impacting vehicle to indicate the instant of contact with the guardrail system
and was visible from each camera. The films from these high-speed cameras were analyzed
on a computer-linked Motion Analyzer to observe phenomena occurring during the collision
and to obtain time-event, displacement, ruid angular data. A 3/4-in videotape camcorder and
still cameras were used for documentary purposes and to record conditions of the test vehicle
and guardrail system before and after the test.
3.2.3 Test Vehicle Propulsion and Guidance
The test vehicles were towed into the guardrail system using a steel cable guidance and
reverse tow system. A steel cable for guiding the test vehicles was stretched along the impact
23

path, anchored at each end, and threaded through an attachment to the front wheel of the test
vehicle. Anoth~r steel cable was connected to the test vehicles, passed around a pulley near
the impact point, through a pulley on the tow vehicle, and then anchored to the ground such
that the tow vehicle moved away from the test site. A 2 to 1 speed ratio between the test and
tow vehicle existed with this system. Just prior to impact with the guardrail system, the test
vehicle was released to be free-wheeling and unrestrained. The vehicle remained free
wheeling, i.e., no steering or braking inputs, until the vehicle cleared the immediate area of the
test site, at which time brakes on the vehicle were activated to bring the vehicle to a safe and
controlled stop.
24

IV. RESULTS OF PENDULUM AND DEVELOPMENTAL CRASH TESTS
4.1 PENDULUM TESTS
A total of 8 pendulum tests were conducted to study the energy absorption
characteristics of various slot lengths and the effect of the slot guard. Table 1 summarizes the
results of the pendulum tests. Results of pendulum tests conducted in the previous study to
develop the split rail end terminal are shown in table 2.
As shown in these tables, peak deceleration rates and energy dissipation from buckling
and collapsing of the slots remained little changed when the slot length was varied from 12 to
60 in (305 mm to 1.52 m). It was decided not to test slot lengths shorter than 12 in (305 mm)
since it was evident from the pendulum test results that the peak deceleration and energy
dissipation level would increase significantly if the slot length is further reduced. Also, it is
desirable to buckle the slots individually and sequentially in order to separate the impulses
from buckling of each set of slots. The separation of the impulses is provided by the
collapsing of the slots after the initial buckling. Slot lengths that are too short would not
provide the desired separation between the impulses. On the other hand, slot lengths that are
too long would increase the fabrication cost and the potential for the bumper or other parts of
the impacting vehicle to intrude into the slots. After some consideration, a slot length of 12
in (305 mm) was selected for use with the slotted rail end terminal design. Note that the slot
length was later modified based on results of the developmental crash tests. More detailed
discussions on the modification of the slot length are presented under the descriptions of the
individual crash tests.
The slot guard was found to have minimal effect on the buckling and collapsing
behavior of the slots or on the peak deceleration and the energy dissipation capacity of the
slotted rail element. In comparison, the cover plate used with the previous design affected the
buckling and collapsing behavior of the slots, resulting in a significant increase in the energy
dissipation level, i.e., higher buckling force. The use of slot guards is therefore preferred over
the use of cover plates from an impact performance standpoint as well as for aesthetic and
maintenance considerations.
25

Table 1. Summary of Pendulum Test Results
Test Slot Slot Peak Energy DissiQation (kiQ-ft) No. Length (in) Guard Deceleration (g's) Initial @ Dis12lacement = 4 ft
1 24 No 32.5 8.3 12.6
2 18 No 30.7 9.7 18.5
3 12 No 27.8 8.5 18.5
4 15 No 25.1 8.7 14.3
5 12 No 29.9 10.0 18.9
6 18 Yes 31.5 9.5 20.8
7 15 Yes 30.7 8.3 NIA
8 12 Yes 26.7 8.7 23.2
Table 2. Summary of Previous Pendulum Test Resultsm
Slot Cover Energy DissiQation (kiQ-ft) Length (in) Plate Initial @ Dis12lacement = 4 ft
60 No 7.9 13.8
48 No 8.6 19.4
36 No 6.6 15.8
20/24 No 6.6 17.3
27 Yes 8.8 24.5
26

4.2 DEVELOPMENTAL CRASH TESTS
A total of seven full-scale crash tests were conducted during the course of developing
this slotted rail end terminal. Three of the crash tests were successful compliance tests and are
presented in Chapter 5. The other four crash tests were termed developmental tests since they
involved either tests that failed to perform satisfactorily or tests of terminal designs that were
subsequently modified significantly. The results of these four developmental crash tests and
subsequent modifications to the end terminal resulting from these tests are presented in the
following sections.
To avoid redundancy in the reporting of the individual developmental and compliance
crash tests, data items that are common to the crash tests are summarized below and will not
be repeated in the individual test descriptions:
• For the 1,800-lb (817-kg) test vehicle, the empty weight was 1,800 lb (817 kg) and its
test weight was 1,970 lb (894 kg), including an unrestrained Alderson Research
Laboratories Hybrid II, 50th percentile male anthropomorphic dummy placed in the
driver's position.
A dummy was not used with the 4,500-lb (2,043-kg) test vehicle and both the empty
weight and the test weight of the vehicle were 4,500 lb (2,043 kg).
• The test vehicle was dir_ected into the end terminal using the cable reverse tow and
guidance system, and was released to be free-wheeling and. unrestrained just prior to
impact.
• Occupant risk· factors computed from digitized data from the accelerometer located at
the center of gravity of the test vehicle, i.e., occupant impact velocity, the highest
0.010-second average ridedown acceleration, and the maximum 0.050-second average
acceleration, are reported both in the "Summary of Results" figures and the
"Performance Summary Evaluation" tables and are not repeated in the text of the test
descriptions.
Furthermore, some of the data and information from the individual crash tests are presented
in the appendices to keep the main body of the report concise and easier to read. The
appendices include:
27

Appendix
A
B
c D
Description
Dimensions and Information of the Test Vehicles
Sequential Photographs of the Impacts
Vehicular Acceleration Versus Time Traces, and
Vehicular Angular Displacement Versus Time Plots.
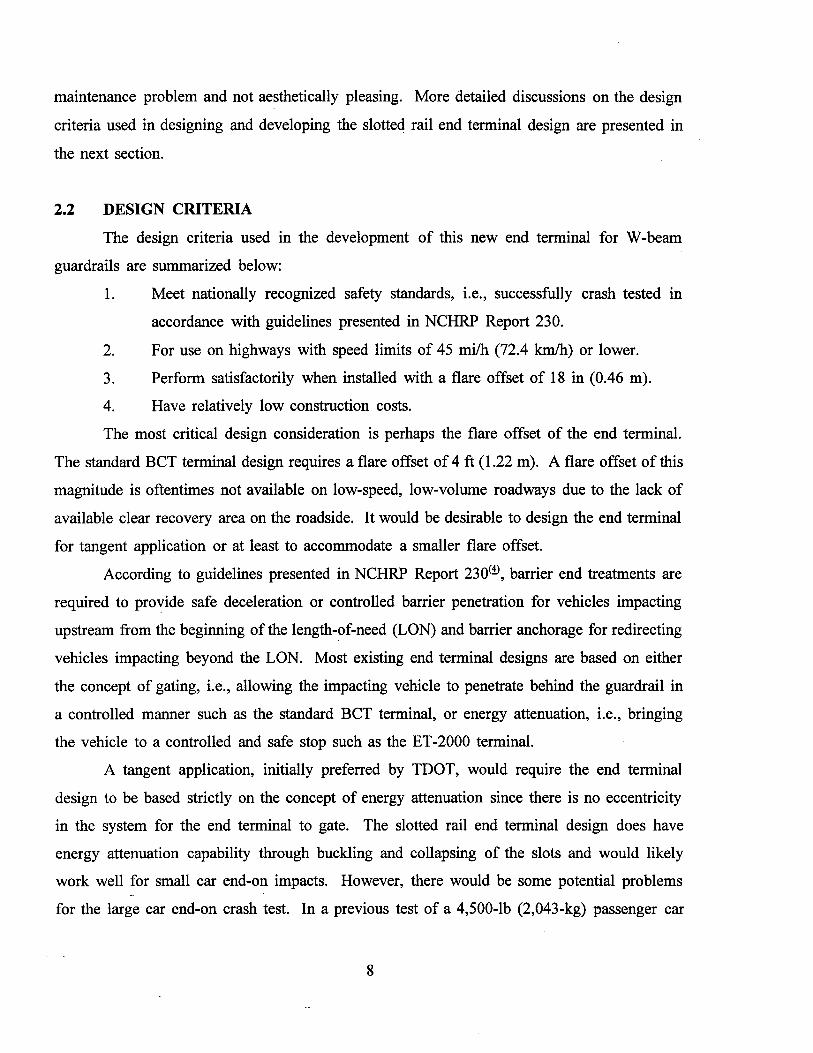
4.2.1 Test Number 7199-8
This crash test involved an 1,800-lb (817-kg) passenger car impacting the end terminal
head-on at a nominal speed of 45 mi/h (72.4 km/h) with an offset of 15 in (0.38 m) to the
center of the vehicle, i.e., the center of the vehicle was offset 15 in (0.38 m) from the center
of the end terminal. The purpose of this test is to evaluate vehicle stability, occupant risk, and
after-impact trajectory of the end terminal design. This is typically the most difficult test
condition for any end terminal design. Note that the existing breakaway cable terminal (BCT)
design has never passed this test requirement.
The end terminal constructed for this crash test differed from the final design in the
following aspects:
1. A ground strut was used to connect the foundation tubes of the first two posts
(posts 1 and 2).
2. Four sets of 12-in (305-mm) long slots, one each mid-span of the first four
spans, were used with the W-beam rail element.
3. The slotted rail element was bolted to post 2.
Photographs of the test installation are shown in figure 5. A 1987 Chevrolet Sprint
(figures 6 and 7) was used in this crash test. The vehicle impacted the terminal end-on at a
speed of 44.9 mi/h (72.2 km/h) and an angle of 0 degrees. Upon impact, the buffered end
section began to collapse and post 1 began to move. At 0.056 sec, the W-beam rail element
began to buckle at the first set of slots mid-span between posts 1 and 2 (i.e., span 1). At 0.071
sec, the vehicle began to yaw in a clockwise rotation and, at 0.079 sec, post 1 broke off at
ground level. The yaw rate of the vehicle increased substantially by 0.145 sec, and shortly
thereafter, the W-beam rail element began to buckle at the second set of slots mid-span
between post 2 and 3 (i.e., span 2), and post 2 broke off at ground level. The rail element at
28

Figure 5 . Slotted rail end treatment before test 7199-8.
29

/
-~- --- -
~~~~,~~--~·~:!!!l:=iiiiilii!!!:;;::~
Figure 6 . Vehicle prior to test 7199-8.
30

...,_:,-~~--·
:E~~-·"'\ . .,._ !~t .,.,._
.. ·;:~.~- ~:Zi'~~- .>~~
;.-·
Figure 7 . Vehicle/slotted rail geometrics for test 7199-8.
31

the post 3 location began to move laterally to the left at 0.203 sec, and then at 0.289 sec, began
to move to the right. The buckled end of the rail element at the second set of slots (i.e., mid
span· of span 2) formed an elbow and the driver side door impacted the elbow at 0.463 sec.
The window at the driver side door broke at 0.507 sec as the rail deformed the door and
intruded into the occupant compartment. The vehicle continued to yaw in a clockwise rotation
and slide into the buckled rail element and subsequently came to rest against the elbow or
buckled end of the rail element, as shown in figure 8.
The end terminal received moderate damage, as shown in figure 9. There was buckling
of the rail element at the first two set of slots mid-span in spans 1 and 2. Posts 1 and 2 were
sheared off at ground level and post 3 was leaning slightly. The bolt at post 1 was pulled
through the post and the bolts at post 2 and 3 were pulled out of the rail element.
The vehicle sustained severe damage to the front and sides, as shown in figures 10 and
11. There was a maximum crush of 11.0 in (279 mm) to the front center of the vehicle at
bumper height. This crush was directed toward the passenger side of the vehicle, with the
motor pushed into the firewall and deforming the floorpan into the occupant compartment on
the passenger side by 4.0 in (102 mm). Also on the passenger side, the A-pillar was bent, the
door was bent out 2.0 in (51 mm), and there was a 1.0 in (25 mm) dent in the roof at the B
post. The door on the driver side was deformed into the occupant compartment 9.0 in (229
mm) where the elbow formed by the buckled rail element impacted the door. The upper edge
of the door was bent out 2.0 in (51 mm). The steering wheel and instrument panel were
damaged and the windshield was shattered. The right front strut was bent and damage was
done to the front bumper, hood, grill, radiator and fan, right and left front quarter panels and
the right and left doors.
A summary of the test results is presented in figure 12. This test was considered to be
unsuccessful with the vehicle sliding sideways and impacting an elbow formed by the buckled
W-beam rail element at the door on the driver side. Even though the vehicle had very little
velocity left at that point, there was still significant intrusion into the occupant compartment
which was considered unacceptable according to evaluation criteria outlined in NCHRP Report
230. Otherwise, the test met the other evaluation criteria. A summary of the evaluation
criteria and results is shown in table 3.
32

;';' 1 Wilr ~~-c- -l'.:-.--'*..+/._..,.., . ...,_..,,·c . . -'-~·.c-1.-zSllll!®1!1!!.t5J
iiiJiiiiiiiiiiii!iiiiiiili I
Figure 8 . Vehide/slotted rail after test 7199-8.
33

Figure 9 . Slotted rail end treatment after test 7199-8.
34

Figure 10 . Vehicle after 7199-8.
35

"""<,;
\~> Figure 11 . Damage to door of vehicle after 7199-8.
36

0.000 s
•
i~~ .. " :~
Test No ..... . Date . . . . . . . Test Installation
Installation Length Test Vehicle . Vehicle Weight
Test Inertia Gross Static
Vehicle Damage Classification TAD ....... . CDC ....... .
Maximum Vehicle Crush
···;i~>f,',4~Mil,i.!::, , ·.~::c; ' '"i·.· ~.'.- .... ,~./~';':: "'.~r. ~ . .. ,, . ..;··~ . :'t_·.,.)·;~~!··.· .• ;_./f<; ,~· :!
' ' , I ·· .... · ... '
' ~.·
7199-8 09/04/92 Slotted Rail End Treatment 50.0 ft (15.2 m} 1987 Chevrolet Sprint
1,800 lb (817 kg} 1,970 lb (894 kg)
12FR6 & 09LP4 12FZEW3 & 09LPEW3 11.0 in (27.9 cm)
0.451 s
Impact Speed. . 44.9 mi/h (72.2 km/h) Impact Angle. . 0 deg - end-on Exit Speed N/A Exit Trajectory .. N/A Vehicle Accelerations
(Max. 0.050-sec Avg} Longitudinal ... -12.5 g Lateral ..... -5.0 g
Occupant Impact Velocity Longitudinal. . 28.3 ft/s (8.6 m/s) Lateral . . . 6.4 ft/s (2.0 m/s)
Occupant Ridedown Accelerations Longitudinal ... -13.6 g Lateral ..... -6.4 g
Figure 12. Summary of results for test 7199-8.

w 00
c.
D.
E.
F.
H.
J.
Table 3. Performance Evaluation Summary - Test 7199-8.
Evaluation Criteria Test Results
Acceptable test article performance may be by redirection, The vehicle was brought to a controlled stop. controlled penetration, or controlled stopping of the vehicle.
Detached elements, fragments of other debris from the test There were no detached elements or debris from the end terminal article shall not penetrate or show potential for penetrating that showed any potential for penetrating the passenger the passenger compartment or present undue hazard to other compartment or present undue hazard to other traffic. traffic.
The vehicle shall remain upright during and after the The vehicle remained upright and stable throughout the test collision. Integrity of the passenger compartment must be sequence. There was significant deformation and intrusion of the maintained with essentially no deformation or intrusion. occupant compartment on the floorpan and the driver side door.
Impact severity shall be less than: The Impact severity for the test were:
OccueJ:!nt lmeact Velocit~ · fes Occueant lmeact Velocit~ - fes Longitudinal Lateral Longitudinal Lateral
Limit/Design 40/15 30/20 28.3 --""6.4 Occueant Ridedown Acceleration - g's Occueant Ridedown Acceleration - g's
Longitudinal Lateral Longitudinal Lateral Limit/Design 20/15 20/15 -13.6 -=6.4
After collision, the vehicle trajectory and final stopping The vehicle came to rest against the test installation. The position shall intrude a minimum distance, if at all, into vehicle trajectory and final rest position did not indicate any adjacent traffic lanes. potential of intrusion into adjacent traffic lanes.
Vehicle trajectory behind the test article is acceptable. The vehicle came to rest against the test installation.
Pass/ Fail
Pass
Pass
Fail
Pass
Pass
Pass
Pass

The test results were then analyzed in detail to identify the problems and to devise the
appropriate design modifications. The initial impulse, caused by a combination of fracturing
the wooden end post and buckling the first set of slots (i.e., the mid-span slots between posts
1 and 2), was found to be too high. This caused the vehicle to yaw or rotate prematurely and
excessively, which eventually resulted in the vehicle sliding sideways into the elbow formed
by the buckled W-beam rail element at the second set of slots (i.e., the mid-span slots between
posts 2 and 3). To reduce this initial impulse, the first set of slots, i.e., the mid-span slots
between posts 1 and 2, were lengthened from 12 to 24 in (305 to 610 mm). This modification
would effectively separate the impulse of breaking the wooden end post from that of buckling
and collapsing the first set of slots. The longer slots also have a slightly lower buckling force,
which would help to soften the initial impulse.
It appeared that the post bolt at post 2 did not disengage properly, generating high
deceleration forces before the W-beam rail element was separated from the post. A new set
of 12-in (305-mm) slots were added at post 2 to minimize this potential problem. This design
modification served two purposes. The first purpose was to facilitate the disengagement of the
post bolt at post 2. The second purpose was to reduce (actually halt) the length of the column
between the mid-span slots in spans 1 and 2. Note that there was a 5.4-ft (1.65-m) long
unbuckled section of W-beam rail between the first two mid-span sets of slots, which appeared
to have accentuated the yawing of the vehicle.
In addition, the length of the second set of mid-span slots, i.e., between posts 2 and 3,
was also increased from 12 to 24 in (305 to 610 mm) and another new set of 12-in (305-mm)
slots was added at post 3. These additional modifications were precautionary measures which
could further enhance the performance of the end-terminal design.
In summary, the design modifications consisted of: lengthening the first two sets of
mid-span slots in spans 1 and 2 from 12 to 24 in (305 to 610 mm), and adding two new sets
of 12-in (305-mm) slots at posts 2 and 3.
4.2.2 Test Number 7199-SA
After incorporating the design modifications described above in the previous test (test
no. 7199-8), the small car end-on test was repeated. Again, the test involved an 1,800-lb (817-
39

kg) passenger car impacting the end terminal end-on at a nominal speed of 45 mi/h (72.4 km/h)
with an offset of 15 in (0.38 m) to the center of the vehicle. Photographs of the test
installation are shown as figure 13.
A 1986 Chevrolet Sprint (figures 14 and 15) was used in this crash test. The vehicle
impacted the terminal end-on at a speed of.46.6 mi/h (75.0 km/h) and an angle of 0 degree.
Shortly after the vehicle impacted the end terminal, post 1 began to move and the vehicle
contacted post 1 at 0.034 sec. The first set of slots located mid-span between posts 1 and 2
began to buckle at 0.043 sec after impact and, at 0.065 sec, the vehicle began to yaw in a
clockwise rotation. At 0.108 sec, the second set of slots at post 2 began to buckle. At 0.171
sec, the vehicle contacted post 2. The yaw rate of the vehicle remained little changed as the
vehicle continued forward. The rail element began to buckle at the third set of slots mid-span
between posts 2 and 3 at 0.198 sec. The rail element began to buckle at the fourth set of slots
at post 3 and separated from post 3 at 0.224 sec. At 0.350 sec, the vehicle contacted post 3.
Forward motion- of the vehicle stopped at 0.511 sec; however, the vehicle continued to yaw
clockwise. The vehicle rolled backwards and subsequently came to a complete stop at 1.133
sec over the post 3 location with the front of the vehicle still in contact with the guardrail, as
shown in figure 16.
The end terminal received moderate damage, as shown in figures 17 and 18. There was
buckling of the rail element at the first four sets of slots between posts 1 through 3. The fifth
and sixth set of slots located mid-span in spans 3 and 4 were deformed but not buckled. Posts
1 and 2 sheared off at ground level and post 3 broke off just below ground level. Post 4 was
not broken, but leaning slightly.
The vehicle sustained severe damage to the front as shown in figure 19. There was a
maximum crush of 11.0 in (279 mm) slightly to the right of the center front of the vehicle at
bumper height. This crush was directed toward the passenger side of the vehicle, with the
motor pushed into the firewall deforming the floorpan into the occupant compartment on the
passenger side by 3.0 in (76 mm). Also on the passenger side, there was a 0.5 in (13 mm)
dent in the roof at the B-post, and there was a slight indentation in the roof near the rear on
the driver side. The wheelbase was shortened by 4.0 in (102 mm) on the right side and by 2.5
in (64 mm) on the left side. The instrument panel was damaged and the windshield was
40

Figure 13 . End treatment before test 7199-SA.
41

~CJL . .. - -· - : . . - - ---·.c.-~~~
Figure 14 . Vehicle before test 7199-8A.
42

Figure 15. Vehicle/end treatment geometrics for test 7199-8A.
43

Figure 16 . Vehicle/end treatment after test 7199-8A.
44

Figure 17 . End treatment after test 7199-8A.
45

:.;. . __
·~t;, ~~:·.; ~.; •r ·;-
; ,::.__. ~ . .:.::.t.::.C·.: .• ~ -----
Figure 18 . Damage at post 3.
46

.v.-,, 11!11 rn 1-! _____ ; .. ---= k·· ~ -
- -~-···...,...----~-
---.--:
Figure 19 . Vehicle after test 7199-SA.
47

shattered. The right and left front strut towers, the motor mounts and the master cylinder were
damaged. Also damaged were the front bumper, hood, grill, radiator and fan, right and left
front quarter panels and the right and left doors.
A summary of the test results is presented in figure 20. The test was judged to have
met the evaluation criteria set forth in NCHRP Report 230, a summary of which is shown in
table 4. The end terminal successfully brought the impacting vehicle to a safe and controlled
stop. The test vehicle remained upright and stable during the entire impact sequence. There
was no debris from the vehicle or barrier that might present undue hazard to other traffic.
Damage to the test installation was moderate. Damage to the impacting vehicle was severe and
there was some deformation in the floorpan area of the occupant compartment, but it was
judged to be minor in nature and of little consequence.
It was noted that the buffered end section did not collapse as designed to distribute the
loading over a wider area of the vehicle. This was caused by the overlapping of the slot for
the bolt attaching one end of the nose section to the W-beam rail element with the first set of
24-in (610-mm) slots mid-span between posts 1 and 2. When the· first set of slots buckled, the
bolt attaching one end of the nose section to the W-beam rail element was disengaged, thus
resulting in the nose section not collapsing as intended. It is unclear what effect this might
have on the impact performance of the end terminal. There was some over-riding of the W
beam rail element over the engine block and the structural members of the vehicle, which
might have rendered the damage to the vehicle to appear more severe. In any event, it was
decided that the middle slot of the first set of slots mid-span between posts 1 and 2 would be
shortened from 24 to 18 in (610 to 457 mm) so that the slot will not overlap with the bolt slot
for attachment of the buffered end section and affect the behavior of the buffered end section.
4.2.3 Test Number 7199-11
The end terminal design that successfully passed the small car end-on test (test no.
7199-8A) was then tested with a 4,500-lb (2,041-kg) passenger car impacting the end terminal
head-on at the center of the nose at the nominal speed of 45 mi/h (72.5 km/h). The objective
of this test was to evaluate the energy-absorbing/dissipation properties of the end terminal. As
mentioned above, the only change in the design of the end terminal for this test was the
48

.. . .:.JI!
0.000 s
,i .. ~~. ' i '!·; '. i"'
Test No ..... . Date ...... . Test Installation
Installation Length Test Vehicle . Vehicle Weight
Test Inertia Gross Static
Vehicle Damage Classification TAD ....... . CDC ....... .
Maximum Vehicle Crush
7199-8A 10/20/92 Slotted Rail End Treatment 50.0 ft (15.2 m) 1986 Chevrolet Sprint
1,800 lb (817 kg) 1,967 lb (893 kg)
12FD5 12FDEW3 11.0 in (27.9 cm)
. .
.d ~ .. ,.:~:fj-· .
Impact Speed. . 46.6 mi/h (75.0 km/h} Impact Angle. . . 0 deg - end-on Exit Speed N/A Exit Trajectory N/A Vehicle Accelerations
(Max. 0.050-sec Avg) Longitudinal ... -10.7 g Lateral ..... -2.4 g
Occupant Impact Velocity Longitudinal ... 23.9 ft/s (7.3 m/s) Lateral . . . . . 9.6 ft/s (2.9 m/s)
Occupant Ridedown Accelerations Longitudinal ... -12.3 g Lateral ..... -3.l g
Figure 20. Summary of results for test 7199-8A.

Vl 0
c.
D.
E.
F.
H.
J.
Table 4. Performance Evaluation Summary - Test 7199-8A.
Evaluation Criteria Test Results
Acceptable test article performance may be by redirection, The vehicle was brought to a controlled stop. controlled penetration, or controlled stopping of the vehicle.
Detached elements, fragments of other debris from the test There were no detached elements or debris from the end terminal article shall not penetrate or show potential for penetrating that showed any potential for penetrating the passenger the passenger compartment or present undue hazard to other compartment or present undue hazard to other traffic. traffic.
The vehicle shall remain upright during and after the The vehicle remained upright and stable throughout the test collision. Integrity of the passenger compartment must be sequence. There was no deformation or intrusion of the occupant maintained with essentially no deformation or intrusion. compartment.
Impact severity shall be Less than: The Impact severity for the test were:
Occu~nt I!!JE!act Velocit~ - fe§ Occueant I!!JE!act Velocit~ - fes Longitudinal Lateral Longitudinal Lateral
Limit/Design 40/15 30/20 23.9 9T Occueant Ridedown Acceleration · g's Occueant Ridedown Acceleration - g's
Longitudinal Lateral Longitudinal Lateral Limit/Design 20/15 20/15 -12.3 -=3.1
After collision, the vehicle trajectory and final stopping The vehicle came to rest against the test installation. The position shall intrude a minimum distance, if at al L, into vehicle trajectory and final rest position did not indicate any adjacent traffic Lanes. potential of intrusion into adjacent traffic Lanes.
Vehicle trajectory behind the test article is acceptable. The vehicle came to rest against the test installation.
Pass/ Fail
Pass
Pass
Pass
Pass
Pass
Pass
Pass

shortening of the middle slot of the first set of slots mid-span between posts 1 and 2 from 24
to 18 in (610 to 457 mm), as shown in figure 21. Photographs of the test installation are
shown as figure 22.
A 1981 Cadillac Fleetwood (figures 23 and 24) was used in this crash test. The vehicle
impacted the terminal end-on at a speed of 46.1 mi/h (74.2 km/h) and an angle of 0 degrees.
The vehicle contacted post 1 at 0.029 sec after impact and the slots located between posts 2
and 3 began to buckle at 0.086 sec. As the vehicle contacted post 2 at 0.126 sec, the rail
element separated from post 3. At 0.171 sec, the span between post 3 and 4 began to buckle.
By this time, the vehicle was travelling behind the guardrail but continued forward in a
relatively straightforward and stable manner. The vehicle contacted post 3 at 0.267 sec, and
the guardrail folded and slapped the left side of the vehicle at 0.360 sec. At 0.398 sec, the
vehicle contacted post 4 and shortly thereafter at 0.437 sec, a severe steer input occurred which
caused the vehicle to yaw in a counterclockwise rotation at 0.460 sec. At 0.514 sec, the
vehicle lost contact with the guardrail and had slowed to 21.7 mi/h (34.9 km/h). The vehicle
then contacted post 5 at 0.586 sec and continued to yaw counterclockwise. As this rotation
continued, the vehicle also began to roll onto its right side. The vehicle subsequently came to
rest on its roof behind the rail approximately 42 ft (13 m) from the point of impact, as shown
in figure 25.
The end terminal received substantial damage, as shown in figure 26. There was
buckling of the rail element at the slots between posts 2 and 3, and between 3 and 4. The slots
located on between post 4 and 5 were deformed but not completely buckled. Posts 1 and 2
sheared off at ground level and posts 3 and 4 broke off just below ground level. Post 5 was
bent and leaning approximately 7 in (180 mm).
The vehicle sustained severe damage to the front as shown in figures 27 and 28. There
was a maximum crush of 8.0 in (203 mm) slightly to the right of the center front of the vehicle
at bumper height. There was damage to the left front frame and some peculiar damage to the
undercarriage as shown in figure 29. Also damaged were the front bumper, hood, grill,
radiator and fan, right and left front· quarter panels and the right and left doors. Most of the
remaining damage was due to rollover of the vehicle at the end of the impact sequence.
51

Figure 21 . Front and rear view of slots.
52

Figure 22 . End treatment before test 7199-11.
53

Figure 23. Vehicle prior to test 7199-11.
54

Figure 24. Vehicle/end treatment geometrics for test 7199-11.
55

Figure 25 . Test site after test 7199-11.
56

Figure 26 . Damage to end treatment after test 7199-11.
57

Figure 26 . Damage to end treatment after test 7199-11 (continued).
58

Figure 27 Vehicle after test 7199-11.
59

Figure 28 . Vehicle after being uprighted (after test 7199-11).
60

Figure 29 . Undercarriage of vehicle after test 7199-11.
61

Figure 29 . Undercarriage of vehicle after test 7199-11 (continued).
62

A summary of the test results is presented in figure 30. this test was considered to be
unsuccessful with the vehicle rolling over. Even though the vehicle had very little velocity left
at the point of rollover, it was still considered unacceptable according to evaluation criteria
outlined in NCHRP Report 230. Otherwise, the test met the other evaluation criteria. A
summary of the evaluation criteria and results is shown in table 5.
The vehicle rollover was totally unexpected. The end terminal functioned as designed
in the early. stages of the impact sequence. The rail element buckled and collapsed as the
vehicle was gradually slowed down and allowed to gate behind the rail in a controlled manner.
The vehicle had almost cleared the rail past post 3 when the vehicle suddenly started to yaw
counterclockwise and roll to its right, coming to rest on its top. A detailed analysis of the test
data was conducted to determine the cause of the rollover, including examination of the
damage to the end terminal and the vehicle, and review of the electronic data and high-speed
films.
It appeared that the loose end of the breakaway cable attachment was caught by the
front cross member of the vehicle (as evidenced by the hole punched in the cross member
shown in figure 29) while the bearing plate for the breakaway cable attachment was digging
into the ground. This in effect fixed the loose end of the breakaway cable attachment in
relation to the vehicle. In the mean time, the rail element formed an elbow at the slots between
posts 2 and 3 and the rail was bent 180 degrees at the elbow. Since the breakaway cable
attachment was attached to the rail, this in effect fixed the other end of the breakaway cable
attachment. As the vehicle proceeded forward, the cable was tensioned and caught on a lip on
the left front A-frame of the vehicle that was only approximately 1/2-in (12.7 mm) wide. The
tensioned cable bent back the A-frame 90 degrees and in the process sheared off the bumper
shock absorber attachment and broke the bumper.
This combination of events resulted in the left front of the vehicle being held in place,
causing the vehicle to yaw violently in a counterclockwise rotation. In the meantime, the
suspension on the left front of the vehicle was first compressed and then released to provide
a impetus of rolling to the right. The right fro.nt tire turned to the left sharply and dug into the
ground as the vehicle yawed counterclockwise and rolled to the right. This combination of
kinematics resulted in the rollover of the vehicle.
63

0.000 s
~ .. -:~ ..... - .. ~ ............. '~·· !; ' ,_,....__,~:;.
~r..~:J:.s.:~.;:..~-~~ .. ··~·, ~: .:-:.: .;<,~-
Test No ..... . Date ...... . Test Installation
Installation Length Test Vehicle . Vehicle Weight
Test Inertia Gross Static
Vehicle Damage Classification TAD ... , .... . CDC ....... .
Maximum Vehicle Crush
0.131 s 0.392 s 0.623 s
. . . ' .... ., .... ' - ~. :.. ~ . -
- .. ~ ~ - ,., ~~··:: .. _ _:.,· - - - . ..
't .... • . . , .. - . f.; ·-:~· :.;~· "!":-; ·~~ .. ,".: -:.:--;::-~ .. :· -~·'. ~ ~~ •. · ,.
7199-11 01/26/93 Slotted Ra i1 End Treatment 50.0 ft (15.2 m) 1981 Cadillac
Fleetwood 4,500 lb (2,043 kg) 4,500 lb (2,043 kg)
12FL5 & 3R&T4 12FYEK3 & OOTPD04 8.0 in (20.3 cm)
Impact Speed. . 46.l mi/h (74.2 km/h) Impact Angle. . 0 deg - end-on Exit Speed . 21.7 mi/h (34.9 km/h) Exit Trajectory .. N/A - Vehicle rollover Vehicle Accelerations
(Max. 0.050-sec Avg) Longitudinal ... -6.4 g Lateral . . . 2.2 g
Occupant Impact Velocity Longitudinal ... 17.3 ft/s (5.3 m/s) Lateral ..... N/A
Occupant Ridedown Accelerations Longitudinal. . -5.8 g Lateral ..... N/A
Figu_re 30. Summary of results for test 7199-11.

Table 5. Performance Evaluation Summary - Test 7199-11.
Evaluation Criteria Test Results Pass/ Fail
c. Acceptable test article performance may be by redirection, The vehicle was brought to a controlled stop. Pass controlled penetration, or vehicle.
controlled stopping, of the
D. Detached elements, fragments of other debris from the test There were no detached elements or debris from the end terminal Pass article sh~ll not penetrate or show potential for penetrating that showed any potential for penetrating the passenger the passenger compartment or present undue hazard to other compartment or present undue hazard to other traffic. traffic.
E. The vehicle shall remain upright during and after the The vehicle rolled over. Fail coll is ion. Integrity of the passenger compartment must be maintained with essentially no deformation or intrusion.
F. Impact severity shall be less than: The Impact severity for the test were:
Occueant lmeact Velocit~ - fps Occupant Impact Velocit~ - fe§ Longitudinal Lateral Longitudinal Lateral
Limit/Design 40/15 30/20 17.3 N/A N/A Occueant Ridedown Acceleration - g's Occupant Ridedown Acceleration - g's
Longitudinal Lateral Longitudinal Lateral Limit/Design 20/15 20/15 - 5.8 N/A N/A
H. After collision, the vehicle trajectory and final stopping The vehicle came to rest against the test installation. The Pass position shall intrude a minimum distance, if at all, into vehicle trajectory and final rest position did not indicate any adjacent traffic lanes. potential of intrusion into adjacent traffic lanes.
J. Vehicle trajectory behind the test article is acceptable. The vehicle rolled over and came too rest behind the test Pass installation.

The initial concern with this large vehicle end-on test was that the vehicle would
proceed through the first four wood posts without gating, i.e., going behind the barrier, and the
vehicle would then ramp on the first steel post (post 5) and get on top of the barrier. This did
not happen and the vehicle almost cleared the barrier at post 3 and would have completed the
gating process had the sequence of events described above not occurred. It is believed that
what happened was an occurrence of extremely low probability and unrelated to the slotted rail
end terminal design.
However, even though the rollover was not caused by the slotted rail design and the
rollover was considered a freakish occurrence, there remained the fact that the vehicle did roll
over and the design did not pass the test. The end terminal design would have to be modified
and tested again. It was therefore decided to use the opportunity to optimize the design and
to cut down on the cost of the installation.
The key change in the design was to increase the post spacing of the terminal from 6
ft-3 in (1.91 m) to 12 ft-6 in (3.81 m). The rationale for this change was twofold. First, there
was a study underway with the Washington Department of Transportation to crash test and
evaluate a 12 ft-6 in (3.81 m) post spacing W-beam guardrail system intended for use on
roadways with speed limit of 45 mi/h (72.4 km/h) or lower. The advantage of increasing the
post spacing was of course lower cost since the number of posts and blockouts would be
halved. If the guardrail system with the increased post spacing was shown to perform
satisfactorily, that could become the new standard for guardrails on roadways with speed limit
of 45 mi/h (72.4 km/h) or lower. It seemed logical that the slotted rail end terminal should
also be designed for the 12 ft-6 in (3.81 m) post spacing instead of the 6 ft-3 in (1.91 m) post
spacmg.
Second, the use of the 12 ft-6 in (3. 81 m) post spacing for the slotted rail end terminal
could greatly reduce the cost of the end terminal by eliminating the following details from the
design: (1) one foundation tube and post at post 2, (2) the ground strut, (3) the post and
blockout at post 4, and (4) two set of slots at posts 2 and 3.
With the change to the 12 ft-6 in (3.81 m) post spacing for the end terminal, there were
only two posts and two spans in the end terminal section: an end post (post 1) which was a
breakaway wooden post placed in a foundation tube and a CRT post for post 2. The beginning
66

of the standard guardrail now began with post 3. The offset remained at 18 in (0.46 m) with
a straight flare, i.e., the offsets at posts 1, 2 and 3 were 18, 9 and 0 in (457, 229 and 0 mm),
respectively.
There were two sets of slots in each span. The length of the two sets of slots in span
l (i.e., between posts 1 and 2) was reduced from 24 to 18 in (610 to 457 mm). This resolved
the problem of unequal lengths for the first set of slots. The length of the second set of slots
was similarly shortened to minimize the potential for the second set of slots to buckle prior to
the first set of slots, which might adversely affect the performance of the end terminal.
4.2.4 Test Number 7199-13
The modified end terminal design with the 12 ft-6 in (3.81 m) post spacing, as
described above, was again crash tested and evaluated with the small car end-on test, similar
to test nos. 7199-8 and 7199-8A. The crash test involved an end-on impact by an 1,800-lb
(817-kg) passenger car at a nominal speed of 45 mi/h (72.4 km/h) with an offset of 15 in (381
mm) to the center of the vehicle. Photographs of the test installation are shown as figure 31.
A 1988 Yugo (figures 32 and 33) was used in this crash test. The vehicle impacted the
terminal end-on at a speed of 44.6 mi/h (71.8 km/h) and an angle of 0 degrees. Upon impact,
the rail began to buckle at the point where the buffered end section bolts to the back of the W
beam rail element. The vehicle contacted post 1 at 0.032 sec after impact. The first two sets
of slots located between posts 1 and 2 began to buckle at 0.049 sec and the rail section rotated
downward at the first set of slots. Shortly thereafter, the vehicle began to yaw clockwise when
maximum engagement with post 1 occurred. As the vehicle continued forward, the guardrail
separated from post 2 at 0.103 sec. At 0.241 sec, the left front tire struck the rail as the
vehicle passed over the rail section and began to climb atop the rail. Meanwhile, the vehicle
continued to yaw clockwise. The left front tire struck the post 2 blockout at 0.374 sec and by
0.645 sec, the vehicle was airborne.
At 0.859 sec, the vehicle was traveling atop the rail oriented approximately
perpendicular to the installation when post 3 (first post of the standard guardrail section) was
struck. The top of post 3 impacted the vehicle at the floor pan near the longitudinal center of
gravity of the vehicle. At this point, only the right front tire of the vehicle was in contact with
67

Figure 31 . End treatment before test 7199-13.
68

Figure 32. Vehicle before test 7199-13.
69

Figure 33 . Vehicle/end treatment geometrics for test 7199-13.
70

the ground. At 1.053 sec, the vehicle rolled to the left and the left front tire made contact with
the ground while the other tires were airborne. Shortly thereafter, the vehicle impacted post
4 in the rear left quarter panel of the vehicle in front of the rear wheel at rocker panel level.
The left side of the vehicle snagged on post 4 and came to rest atop the installation with the
front tires in contact with the ground and the rear tires elevated, as shown in figure 34. The
vehicle at final rest was oriented at an angle of approximately 135 degrees from the initial
direction of travel.
As can be seen in figure 35, the end terminal received a moderate amount of damage.
The first two sets of slots between posts 1 and 2 were buckled and bent. Posts 1 and 2 were
sheared off at ground level. The foundation tube for post 1 was bent in the rear and displaced
1.5 in (38 mm). Post 3 and 4 in the standard section of the guardrail were bent and displaced
to a small degree.
The vehicle sustained severe damage to the front as shown in figure 36. There was a
maximum crush of 12.6 in (320 mm) at the right front quarter point of the vehicle. There was
extensive damage to the uni-body of the vehicle. The floorpan had numerous dents and tears.
The roof, dashboard, right side A and B-pillar, and the entire front of the vehicle was bent.
A summary of the test results is presented in figure 3 7. This test was considered to be
unsuccessful with the vehicle ramping and mounting the guardrail, resulting in a near rollover
prior to coming to rest on top of the guardrail. Even though the vehicle did not roll over and
technically the test results met all evaluation criteria outlined in NCHRP Report 230, the
behavior of the vehicle was considered unacceptable, as indicated in the performance
evaluation summary shown in table 6.
Again, the test data were analyzed in detail to determine the causes for the ramping and
to devise appropriate design modifications. It appeared from review of the high speed films
that the first two sets of slots buckled nicely and the end post broke off cleanly upon impact.
However, once the slots buckled, they essentially acted like hinges and allowed the rail to
rotate downward at the first set of slots. The right front tire of the vehicle caught on the
buckled rail, causing the vehicle to yaw clockwise at a high yaw rate. The vehicle then
mounted the ramp formed by the rail while continuing to yaw at a high rate, causing the
71

Figure 34. Test site after test 7199-13.
72

Figure 35 . End treatment after removal of vehicle for test 7199-13.
73

Figure 36. Vehicle after test 7199-13.
74

0.000 s
Test No ..... . Date ...... . Test Installation
Installation Length Test Vehicle . Vehicle Weight
Test Inertia . . . Gross Static .
Vehicle Damage Classification TAD ....... . CDC ....... .
Maximum Vehicle Crush
0.184 s
7199-13 04/13/93 Slotted Rail End Treatment 50.0 ft {15.2 m) 1988 Yugo
1,800 lb (816 kg) 1,966 lb (892 kg)
12FC3 12FCEK3 & OOUYDW2 12.6 in (32.0 cm)
0.369 s 0.738 s
I mp act Speed. . . 44. 6 mi /h (71. 8 km/h) Impact Angle. . 0 deg - end-on Exit Speed Came to rest on rail Exit Trajectory .. N/A Vehicle Accelerations
(Max. 0.050-sec Avg) Longitudinal ... -13.7 g Lateral . . . 2.0 g
Occupant Impact Velocity Longitudinal ... 25.0 ft/s (7.6 m/s) Lateral ..... 3.5 ft/s (1.1 m/s)
Occupant Ridedown Accelerations Longitudinal. . -5.1 g Lateral ..... -5.5 g
Figure 37. Summary of results for test 7199-13.

Table 6. Performance Evaluation Summary - Test 7199-13.
Evaluation Criteria Test Results Pass/ Fail
c. Acceptable test article performance may be by redirection, The vehicle was brought to a controlled stop. Pass controlled penetration, or controlled stopping of the , vehicle.
D. Detached elements, fragments of other debris from the test There were no detached elements or debris from the end terminal Pass article shall not penetrate or show potential for penetrating that showed any potential for penetrating the passenger the passenger compartment or present undue hazard to other compartment or present undue hazard to other traffic. traffic.
E. The vehicle shall remain upright during and after the The vehicle ramped and mounted the guardrail and came to rest on Fail collision. Integrity of the passenger compartment must be top of the test installation. There was no deformation or maintained with essentially no deformation or intrusion. intrusion of the occupant compartment.
F. Impact severity shall be less than: The Impact severity for the test were: :
Occueant lmeact Velocit~ - f!2§ Occueant lmeact Velocit~ - fes Longitudinal Lateral Longitudinal Lateral
Limit/Design 40/15 30/20 25.0 3.5 Pass Occul2!!nt Ridedown Acceleration - g's Occueant Ridedown Acceleration - g's
Longitudinal Lateral Longitudinal Lateral Limit/Design 20/15 20/15 -5.1 -5.5 Pass
H. After collision, the vehicle trajectory and final stopping The vehicle came to rest on top of the test installation. The Pass position shall intrude a minimum distance, if at all, into vehicle trajectory and final rest position did not indicate any adjacent traffic lanes. potential of intrusion into adjacent traffic lanes.
J. Vehicle trajectory behind the test article is acceptable. The vehicle came to rest on top of the test installation. Pass

vehicle to roll to the left side. The vehicle attained a high roll angle, but did not roll over, and
eventually came to rest on top of the guardrail.
Part of the problem could be attributed to the 12 ft-6 in (3.81 m) post spacing, which
eliminated the intermediate post between the first two sets of slots. With the 6 ft-3 in (1.91
m) post spacing design previously tested, the post bolt at the intermediate post (i.e., post 2)
held the rail element up long enough before disengaging to prevent the downward rotation.
The end terminal design was again modified to resolve this problem of the W-beam rail
buckling downward.· The resulting design was the final design which was subsequently crash
tested with satisfactory results. Details of the final design are previously described in Section
3.3, "Final Design Details," and will not be repeated herein. Brief discussions on the more
significant modifications are presented as follows:
1. The post spacing was changed back to 6 ft-3 in (1.91 m). The first two posts
(posts 1 and 2) were breakaway posts placed in foundation tubes and posts 3
and 4 were CRT posts to ensure proper breakaway characteristics.
2. The ground strut between the two foundation tubes at posts 1 and 2 was
eliminated. The standard BCT design without the ground strut had been shown
to perform satisfactorily in redirectional impacts at impact speeds of 60 mi/h
(96.6 km/h). Since the slotted rail end terminal was designed for impacts of
only 45 mi/h (72.4 km/h), there should be adequate anchorage capacity without
the ground strut.
3. The offset remained at 18 in (457 mm) with a straight flare starting at post 4,
i.e., the offsets at posts 1, 2, 3 and 4 were 18, 12, 6, and 0 in (457, 305, 152,
and 0 mm), respectively.
4. The two sets of slots at posts 2 and 3 were eliminated. These two sets of slots
were incorporated into the design after the first small car end-on test failed to
perform satisfactorily. The key reason for the set of slots at post 2 was to
facilitate the disengagement of the post bolt at post 2. The concern over proper
disengagement of the post bolt was alleviated by removing the post bolt at post
2. The slots at post 3 was purely a precautionary move and should not have any
significant effect on the performance of the end terminal.
77

5. A shelf angle was added to post 2 to provide support for the rail element and
to minimize the potential of any downward buckling.
78

V. RESULTS OF COMPLIANCE CRASH TESTS
As mentioned previously, the following three compliance crash tests were considered
necessary to evaluate the performance of this end terminal design according to requirements
set forth in NCHRP Report 230:
1. Test designation 40. A 4,500-lb (2,041 kg) passenger car impacting the
installation at the beginning of length-of-need at the nominal speed and angle
of 45 · mi/h (72.4 km/h) and 25 degrees.
2. Test designation 45. An 1,800-lb (817-kg) passenger car impacting the end
terminal head-on with an offset of 15 in (0.38 m) from the center of the nose at
a nominal impact speed of 45 mi/h (72.4 km/h).
3. Test designation 41. A 4,500-lb (2,041-kg) passenger car impacting the end
terminal head-on at the center of the nose at the nominal speed of 45 mi/h (72.4
km/h).
The final design, as presented previously under Section 3.3, "Final Design Details",
successfully met all the evaluation criteria. This chapter presents the results of the compliance
crash tests.
5.1 TEST NUMBER 7199-7
The first compliance crash test involved a 4,500-lb (2,041-kg) passenger car impacting
the test installation at the beginning of length-of-need, which was selected to be at post 3 or
12.5 ft (3.81 m) from the end of the end terminal, at the nominal speed and angle of 45 mi/h
(72.4 km/h) and 25 degrees. The usual objective of this test is to evaluate the adequacy of the
terminal anchorage, which was not an area of concern for the slotted rail end terminal. The
anchorage capacity of the slotted rail end terminal was similar to that of the BCT, which has
been shown to be adequate for impacts of 60 mi/h (96.6 km/h). Since the design speed for this
slotted rail end terminal was only 45 mi/h (72.4 km/h), there was really no question about the
adequacy of the anchorage capacity. Instead, the key objective of this test is to evaluate the
effectiveness of the slot guard to keep the slots from being tom or ripped apart.
79

Note that this crash test was the first to be conducted and the end terminal design as
tested in this crash test was slightly different from the final design as follows:
1. A ground strut was used to connect the foundation tubes between posts 1 and
2.
2. Four sets of 12-in (305-mm) long slots, one each mid-span of the first spans,
were used with the W-beam rail element.
3. The slotted rail element was bolted to post 2.
However, these variations from the final design should not have any effect on the
performance of the end terminal for redirectional impacts. As mentioned previously, the
anchorage capacity of the slotted rail end terminal without the ground strut is similar to that
of a standard BCT, which has been shown to be adequate for impacts of 60 mi/h (96.6 km/h).
Also, since the point of impact (beginning of length-of-need) was at post 3 for this test,
changes in the design upstream of post 3, such as the longer slots in spans 1 and 2 and the
removal of the post bolt at post 2, should not have any effect on the outcome of this test.
Thus, even though there were some minor differences between the end terminal in this crash
test and the final design, there was no reason to repeat this test for the final design.
Photographs of the test installation are shown in figure 38. A 1982 Cadillac Sedan
(figures 39 and 40) was used for this crash test. The vehicle impacted the end terminal at post
3 (the beginning of length-of-need) at a speed of 47.9 mi/h (77.1 km/h) and an angle of 23.9
degrees. At 0.035 sec after impact, the rail began to buckle at the location of the slots between
posts 3 and 4. The vehicle began to redirect at 0.048 sec after impact. At 0.101 sec, the
vehicle contacted post 4 and post 4 broke off near ground level at 0.111 sec. The rail then
began to buckle at the location of the slots between posts 4 and 5 at 0.128 sec. The guardrail
reached a maximum dynamic deflection of 2.0 ft (0.6 m) at 0.202 sec. The vehicle contacted
post 5 at 0.219 sec and, at 0.293 sec, the right front tire aired out as it contacted post 5. By
0.303 sec, the vehicle was travelling parallel to the guardrail at a speed of 28.9 mi/h ( 46.5
km/h). The rear of the vehicle impacted the guardrail at 0.574 sec. The vehicle lost contact
with the guardrail at 0.738 sec, travelling at a speed of 22.4 mi/h (36.0 km/h) with an exit
angle of 15.3 degrees. As the vehicle exited the rail, the vehicle yawed clockwise due to
damage to the right front wheel. At 2.498 sec, the vehicle impacted the guardrail again
80

Figure 3 8 . Slotted rail end treatment before test 7199-7.
81

Figure 3 9 . Vehicle before test 7199-7.
82

Figure 40 . Vehicle/ slotted rail geometrics for test 7199-7.
83

between posts 14 and 15 and subsequently crune to rest against the guardrail. Drunage to the
guardrail and vehicle due to this secondary impact was very minor -in comparison to that from
the initial impact.
As can be seen in figure 41, the end terminal received moderate drunage from the
impact. Post 4 broke off and posts 3, 5 and 6 were pushed back and to the side. Post 5 had
tire marks on the face, the blockout was bent and the bolt was pulled out of the rail.
Maximum dynrunic deflection of the guardrail was 2.0 ft (0.6 m) and the maximum permanent
deformation was 1.7 ft (0.5 m). The vehicle was in contact with the rail for a total distance
of 18.0 ft (5.5 m).
The vehicle sustained drunage to the front and right side as shown in figure 42.
Maximum crush at the left front comer at bumper height was 10.25 in (260 mm). The right
tie rod and lower right A-arm were drunaged. Also drunage was done to the front bumper,
hood, grill, right front quarter panel, right door, right rear quarter panel, rear bumper, and the
right front and rear tires and rims.
A summary of the test results is presented in figure 43. The test was judged to have
met the evaluation criteria set forth in NCHRP Report 230, a summary of which is shown in
table 7. The installation successfully contained and redirected the impacting vehicle. All
occupant risk factors were well within the recommended limits set forth in NCHRP Report
230. The test vehicle remained upright and stable during the impact-period and after leaving
the test installation. There was no debris from the vehicle or barrier that might present undue
hazard to other traffic. Drunage to the guardrail was moderate. Drunage to the impacting
vehicle was also moderate and there was no deformation or intrusion into the occupant
compartment.
The change in velocity of the vehicle was 25.5 mi/h (41.0 km/h) and the exit angle 15.3
degrees, which are higher than the recommended limit of 15 mi/h (24.1 km/h) and 60 percent
of the impact angle (14.3 degrees). However, vehicle trajectory after loss of contact with the
guardrail indicated that the vehicle would not have posed a hazard to adjacent traffic since the
vehicle returned to the roadside and impacted the guardrail again in a secondary impact.
The major concern with this test was the potential of the vehicle bumper or other parts
of the vehicle intruding into the slots and tearing or ripping the rail apart along the slots. The
84

Figure 41 . Slotted rail end treatment after test 7199-7.
85

Figure 42 Vehicle after test 7199-7.
86

00 --l
0.000 s
Test No ..... . Date ...... . Test Installation
Installation Length Test Vehicle . Vehicle Weight
Test Inertia ... Gross Static . . . .
Vehicle Damage Classification TAD ......... . CDC .......... .
Maximum Vehicle Crush Max. Dyn. Rail Deflection Max. Perm. Rail Deformation
0 .143 s
7199-7 08/27/92 Slotted Rail End Treatment 50.0 ft (15.2 m) 1982 Cadillac Sedan
4,500 lb (2,043 kg) 4,500 lb (2,043 kg)
OlRFQ5 & OlRD3 OlFREK2 &.01RFES3 10.25 in (16.0 cm) 2.0 ft (0.6 m) I. 7 ft (0. 5 m)
0.287 s 0.501 s
Impact Speed. . 47. 9 mi/h ( 77 .1 km/h) Impact Angle. . . 23. 9 deg Exit Speed . 22.4 mi/h (36.0 km/h) Exit Trajectory .. 15.3 deg Vehicle Accelerations
(Max. 0.050-sec Avg) Longitudinal ... -3.8 g Lateral . . . 3.9 g
Occupant Impact Velocity Longitudinal ... 19.2 ft/s (5.9 m/s) Lateral ..... -12.0 ft/s (3.7 m/s)
Occupant Ridedown Accelerations Longitudinal. . -5.5 g Lateral . . . . 5. 9 g
Figure 43. Summary of results for test 7199-7.
'. '+' ~ •

00 00
A.
D.
E.
F.
H.
Table 7. Performance Evaluation Summary - Test 7199-7.
Evaluation Criteria Test Results Pass/ Fail
Test article shall smoothly redirect the vehicle; the vehicle The test article contained and smoothly redirected the vehicle. Pass shall not penetrate or go over the installation although con-trolled lateral deflection of the test article is acceptable.
Detached elements, fragments of other debris from the test There were no detached elements or debris from the end terminal Pass article shall not penetrate or show potential for penetrating that showed any potential for penetrating the passenger the passenger compartment or present undue hazard to other compartment or present undue hazard to other traffic. traffic.
The vehicle shall remain upright during and after the The vehicle remained upright and stable during the entire impact Pass collision. Integrity of the passenger compartment must be sequence. There was no deformation or intrusion of the occupant maintained with essentially no deformation or intrusion. compartment.
Impact severity shall be less than: The Impact severity for the test were:
occueant Imeact Velocity - fes Occueant Imeact Velocity - fes Longitudinal Lateral Longitudinal Lateral
Li mi t/Des i gn 40/15 30/20 19.2 12.0 Pass Occu129nt Ridedown Acceleration - g's Occueant Ridedown Acceleration - g's
Longitudinal Lateral Longitudinal Lateral Limit/Design 20/15 20/15 -5.5 5.9 Pass
After collision, the vehicle trajectory and final stopping The vehicle exited the test installation with a speed of 22.4 Pass position shall intrude a minimum distance, if at all, into mi/h (36.0 km/h) and an exit angle of 15.3 degrees which were adjacent traffic lanes. higher than the recommended limits. However, the vehicle
trajectory and final rest position did not indicate any potential of intrusion into adjacent traffic lanes.

slot guard was specifically designed to prevent this from occurring. Results of this crash test
demonstrated that the slot guards perform as designed in preventing the slots from being tom
or ripped apart.
5.2 TEST NUMBER 7199-14
The second compliance test involved an end-on impact by an 1,800-lb (817-kg)
passenger car at a nominal speed of 45 mi/h (72.4 km/h) with an offset of 15 in (0.38 m) to
the center of the vehicle. The objective of this test is to evaluate the impact performance of
the terminal for small-car end-on impacts.
Photographs of the test installation are shown in figure 44. A 1988 Yugo (figures 45
and 46) was used in this crash test. The vehicle impacted the terminal end-on at a speed of
45.7 mi/h (73.6 km/h) and an angle of 0 degrees. The vehicle contacted post 1 at 0.031 sec
after impact, thereafter the vehicle began to yaw clockwise. The first set of slots located
between posts 1 and 2 began to buckle at 0.039 sec. At 0.065 sec, the rail began to separate
from post 2. Shortly thereafter, at 0.119 sec, the rail began to buckle at the second set of slots
located between posts 2 and 3 and displaced the rail away from post 3. By 0.160 sec, the rail
began to buckle at the third set of slots located between posts 3 and 4. As the vehicle
contacted post 2 at 0.179 sec, the rail element formed an elbow between post 2 and 3. At
approximately 0.369 sec, the vehicle contacted the third post. Shortly thereafter, the driver side
door of the vehicle sideswiped the elbow formed by the rail section. The vehicle continued
to travel forward with the left side of the vehicle sideswiping the elbow formed by the rail
section until it came to rest against post 4, oriented approximately 57 degrees to the length of
need section of the guardrail. Photographs of the test installation and vehicle after impact are
shown in figure 4 7.
As can be seen in figure 48, the end terminal received substantial damage. The first
three sets of slots mid-span between posts 1 and 2, posts 2 and 3, and posts 3 and 4 were
buckled. Posts 1, 2 and 3 were sheared off at ground level.
The vehicle sustained severe damage to the front as shown in figure 49. There was a
maximum crush of 14.0 in (356 mm) offset to the right of the center front of the vehicle. In
addition, the outside of the driver side door was crushed inward 4.0 in (102 mm) and there was
89

Figure 44. End treatment before test 7199-14.
90

Figure 45 . Vehicle prior to test 7199-14.
91

Figure 46 . Vehicle/end treatment for test 7199-14.
92

Figure 47. Test site after test 7199-14.
93

Figure 48 . Damage to end treatment after test 7199-14.
94

Figure 49. Vehicle after test 7199-14.
95

1.0 in (25.4 mm) of intrusion into the passenger compartment near the-bottom of the driver
side door. Also damaged were the front bumper, hood, grill, radiator and fan, right and left
front fenders, roof and floor pan.
A summary of the test results is presented in figure 50. The test was judged to have
met the evaluation criteria set forth in NCHRP Report 230, a summary of which is shown in
table 8. The end terminal successfully brought the vehicle to a controlled and safe stop. All
occupant risk factors were well within the recommended limits set forth in NCHRP Report
230. The test vehicle remained upright and stable during the impact sequence. There was no
debris from the vehicle or end terminal that might present undue hazard to other traffic.
Damage to the end terminal was substantial. Damage to the impacting vehicle was severe and
there was approximately 1.0 in (25.4 mm) of intrusion into the occupant compartment near the
bottom of the driver side door. However, the extent of intrusion into the occupant
compartment was considered minor and did not pose any significant hazard to the occupant.
The vehicle came to rest against the test installation and did not pose any hazard to adjacent
traffic.
5.3 TEST NUMBER 7199-15
This third compliance cr~h test involved a 4,500-lb (2,043-kg) passenger car impacting
the end terminal head-on at the center of the nose at the nominal speed and angle of 45 mi/h
(72.5 km/h) and 0 degree. The objective of this test is to evaluate the energy
absorbing/dissipation- properties of the end terminal.
Photographs of the test installation are shown in figures 51 and 52. A 1981 Cadillac
(figures 53 and 54) was used in this crash test. The vehicle impacted the end terminal end-on
at a speed of 46.8 mi/h (75.3 km/h) and an angle of 0 degrees. The vehicle contacted post 1
at 0.032 sec after impact and the first set of slots between posts 1 and 2 began to buckle
shortly thereafter. Also, the rail began to twist or rotate counterclockwise- about the
longitudinal rail axis. The second set of slots located between posts 2 and 3 began to buckle
at 0.092 sec. At 0.144 sec after impact, the vehicle contacted post 2. As the vehicle continued
moving forward, the third set of slots between posts 3 and 4 began to deform at 0.207 sec.
At 0.224 sec, the rail pulled away from posts 3 and 4. By 0.268 sec, the fourth set of slots
96

0.000 s
Test No. . Date Test Installation
Installation Length Test Vehicle . Vehicle Weight
Test Inertia Gross Static . . . .
Vehicle Damage Classification TAD ....... . CDC ....... .
Maximum Vehicle Crush
0 .151 s
7199-14 04/27/93 Slotted Rail End Treatment 50.0 ft (15.2 m) 1988 Yugo
1,800 lb (816 kg) 1,967 lb (892 kg)
12FR2 12FREK4 & 11LPEW2 14.0 in (35.6 cm)
0.301 s 0.452 s
Impact Speed. 45.7 mi/h (73.6 km/h) Impact Angle. 0 deg/15" offset to traffic face Exit Speed . . N/A Exit Trajectory .. N/A Vehicle Accelerations
(Max. 0.050-sec Avg) Longitudinal ... -9.9 g Lateral ..... -3.8 g
Occupant Impact Velocity Longitudinal ... 28.9 ft/s (8.8 m/s) Lateral ..... -7.2 ft/s (2.2 m/s)
Occupant Ridedown Accelerations Longitudinal ... -6.5 g Lateral ..... -3.6 g
Figure 50. Summary of results for test 7199-14.

Table 8. Performance Evaluation Summary - Test 7199-14.
Evaluation Criteria Test Results Pass/ Fail
c. Acceptable test article performance may be by redirection, The vehicle was' brought to a controlled stop. Pass controlled penetration, or controlled stopping of the vehicle.
D. Detached elements, fragments of other debris from the test There were no detached elements or debris from the end terminal Pass article shal L not penetrate or show potential for penetrating that showed any potential for penetrating the passenger the passenger compartment or present undue hazard to other compartment or present undue hazard to other traffic. traffic.
E. The vehicle shall remain upright during and after the The vehicle remained upright and stable throughout the test Pass col Lisi on. Integrity of the passenger compartment must be sequence. There was minor intrusion of 1 in (2.54 cm) into the maintained with essentially no deformation or intrusion. occupant compartment near the bottom of the driver side door.
F. Impact severity shall be Less than: The Impact severity for the test were:
Occueant I!!!12act Velocit~ - fes Occueant Imeact Velocit~ - fes Longitudinal Lateral Longitudinal Lateral
Limit/Design 40/15 30/20 28.9 -7.2 Pass Occueant Ridedown Acceleration - g's Occu~nt Ridedown Acceleration - g's
Longitudinal Lateral Longitudinal Lateral L i1mi t/Des i gn 20/15 20/15 -6.5 -:u;- Pass
H. After collision, the vehicle trajectory and final stopping The vehicle came to rest against the test installation. The Pass position shall intrude a minimum distance, if at all, into vehicle trajectory and final rest position did not indicate any adjacent traffic Lanes. potential of intrusion into adjacent traffic Lanes.
J. Vehicle trajectory behind the test article is acceptable. The vehicle came to rest against the test installation. Pass

Figure 51 . Slotted rail end treatment before test 7199~15.
99

Figure 52. Slotted rail, posts 1 and 2, before test 7199-15.
100

Figure 53 . Vehicle before test 7199-15.
101

Figure 54 . Vehicle/end treatment geometrics for test 7199-15.
102

located between posts 4 and 5 began to buckle. Hinges were formed at the buckled second,
third and fourth sets of slots and the rail began to move laterally outward from the installation.
As the vehicle continued forward, an elbow was formed at the buckled fourth set of slots.
Upon contact with post 4 at 0.448 sec, the vehicle began to yaw counterclockwise. The vehicle
then impacted post 5 and the elbow formed at the buckled fourth set of slots at 0.611 sec. The
vehicle yawed counterclockwise and came to rest near post 5, oriented approximately 75
degrees to the length-of-need section of the guardrail. Photographs of the test installation and
vehicle at final rest are shown in figure 55.
As can be seen in figure 56, the end terminal received substantial damage. All four sets
of slots were buckled and posts 1 through 4 were all sheared off at ground level. Also, post
5 was bent and twisted.
The vehicle sustained severe damage to the front as shown in figure 57. There was a
maximum crush of 13.0 in (330 mm) at the center front of the vehicle. The left front wheel
was pushed rearward 9.5 in (241 mm) and the front subframe severely bent from impact with
post 5 and the elbow formed at the buckled fourth set of slots. Other notable damage sustained
were to the front bumper, hood, grill, radiator and fan, and right and left front fenders.
A summary of the test results is presented in figure 58. The test was judged to have
met the evaluation criteria set forth in NCHRP Report 230, a summary of which is shown in
table 9. The end terminal successfully brought the vehicle to a controlled and safe stop. The
vehicle did not gate, which was somewhat unexpected based on the results of the
developmental test (test no. 7199-11), but not surprising given the offset of only 18 in (457
mm). The vehicle impacted post 5, which was the beginning of the standard guardrail section,
resulting in a counterclockwise yaw. However, the highest 0.010-sec average ridedown
acceleration in the longitudinal direction was only -4.7 g, well below the 20 g limit set forth
in NCHRP report 230. The other occupant risk factors were also well within the limits set
forth in NCHRP Report 230. The vehicle remained upright and stable during the impact
sequence. There was no debris from the vehicle or the end terminal that might present undue
hazard to other traffic. Damage to the end terminal was substantial. Damage to the impacting
vehicle was severe, but there was no or intrusion into the occupant compartment. The vehicle
came to rest against the test installation and did not pose any hazard to adjacent traffic.
103

Figure 55 . Test site after test 7199-15.
104

Figure 56 . Slotted rail end treatment after test 7199-15.
105

Figure 57. Vehicle after test 7199-15.
106

0.000 s
Test No ..... . Date ...... . Test Installation
Installation Length Test Vehicle . Vehicle Weight
Test Inertia . . . Gross Static .
Vehicle Damage Classification TAD • • • • • • 1 • •
CDC ...... I," •
Maximum Vehicle Crush
0.100 s
7199-15 05/14/93 Slotted Rail End Treatment 50.0 ft (15.2 m) 1981 Cadillac
4,500 lb (2,041 kg) N.A.
12FC5 12FCEW2 13.0 in (33.0 cm)
0.251 s
~~~~~,~
Impact Speed. 46.8 mi/h (75.3 km/h) Impact Angle. 0 deg Exit Speed . N/A Exit Trajectory .. N/A Vehicle Accelerations
(Max. 0.050-sec Avg) Longitudinal ... -4. 7· g Lateral ..... -2.0 g
Occupant Impact Velocity Longitudinal ... 19.8 ft/s (6.0 m/s) Lateral . . . . . 5.3 ft/s (1.6 m/s)
Occupant Ridedown Accelerations Longitudinal. . -5.7 g Lateral . . . . -0.9 g
.·'.·¥·
Figure 58. Summary of results for test 7199-15.

Table 9. Performance Evaluation Summary - Test 7199-15.
Evaluation Criteria Test Results Pass/ Fail
c. Acceptable test article performance may be by redirection, The vehicle was brought to a controlled stop. Pass controlled penetration, or controlled stopping of the vehicle.
D. Detached elements, fragments of other debris from the test There were no detached elements or debris from the end terminal Pass article shal L not penetrate or show potential for penetrating that showed any potential for penetrating the passenger the passenger compartment or present undue hazard to other compartment or present undue hazard to other traffic. traffic.
E. The vehicle shall remain upright during and after the The vehicle remained upright and stable throughout the test Pass collision. Integrity of the passenger compartment must be sequence. There was no deformation or intrusion of the occupant maintained with essentially no deformation or intrusion. compartment.
-0 F. Impact severity shall be Less than: The Impact severity for the test were: 00
OCCUQant l!!!QaCt Velocit~ - fQS OccuQant lmQact Velocit~ - fQS Longitudinal Lateral Longitudinal Lateral
Limit/Design 40/15 30/20 19.8 S":"3 Pass OccuQant Ridedown Acceleration - g's OccuQant Ridedown Acceleration - g's
Longitudinal Lateral Longitudinal lateral Limit/Design 20/15 20/15 -5.7 -0.9 Pass
H. After coll is ion, the vehicle trajectory and final stopping The vehicle came to rest against the test installation. The Pass position shall intrude a minimum distance, if at all, into vehicle trajectory and final rest position did not indicate any adjacent traffic Lanes. potential of intrusion into adjacent traffic Lanes.
J. Vehicle trajectory behind the test article is acceptable. The vehicle came to rest against the test installation. Pass

VI. SUMMARY OF FINDINGS AND RECOMMENDATIONS
6.1 SUMMARY OF FINDINGS
• A slotted rail end terminal for W-bearn guardrails, designed for use on highways with
speed limits of 45 mi/h (72.4 km/h} or lower and with a flare offset of as little as 18
in (0.46 m), was successfully developed and crash tested under this study. The slotted
rail end terminal design is suitable for both new construction and retrofit of existing W
bearn guardrail installations.
• The slotted rail end terminal design was based on a concept developed under a previous
study, which was further refined and developed in this study. The design concept is
based on the use of three longitudinal 112-in (12.7 mm) slots cut into the W-bearn rail
element, one at each peak and valley in the cross section, to reduce the buckling
strength of the W-bearn rail element while maintaining the tensile capacity of the rail
element. - A slot guard is attached to the downstream end of each set of slots to prevent
extension of the slots and rupture of the rail. The slot guard both reinforces the W
bearn rail element and provides a 45-degree deflector plate to push the rail element
away from any vehicle component that intruded into the slots. The modified design
alleviates the perceived problems with aesthetics, installation and maintenance
associated with the original split rail end terminal.
• Other than the slotted W-bearn rail element and the slot guards, the slotted rail terminal
utilizes standard components used with the BCT terminal.
• The design was subjected to the required compliance crash tests and succe-ssfully met
with guidelines and evaluation criteria set forth in NCHRP Report 230 for impact speed
of 45 mi/h (72.5 km/h).
• The estimated cost for the end terminal assembly is expected to be slightly higher than
the standard BCT terminal, but substantially lower than other end terminals currently
available. A more exact cost estimate for the slotted rail end terminal is not possible
at this time since the costs for the slotted rail element and the slot guards are a function
of the manufacturing process.
109

6.2 RECOMMENDATIONS AND DISCUSSIONS
• In one of the large car head-on tests in this study (test no. 7199-11) and in another
crash test on a box-beam median barrier end terminal<ll, it was observed that the cable
anchor bearing plate, after releasing from the wooden end post, was thrown up
underneath the vehicle and caught on the undercarriage of the vehicle. This restrained
the forward movement of the vehicle, resulting in the vehicle yawing rapidly and
coming to an abrupt stop.
To eliminate this potential of the cable anchor bearing plate being caught or snagged
on some part of the undercarriage of the vehicle, a slotted bearing plate, as shown in
figure 59, has been designed so that the bearing plate would separate from the cable
anchor upon breaking of the wooden end post. A 4 in. x 3 in. x 3/8 in (102 mm x 76
mm x 9.5 mm) plate washer is used with the slotted bearing plate. Also, to avoid the
cable anchor bearing plate being displaced from the proper position when the cable is
loosened, two 1/4-in (6.4-mm) diameter lag screws are used to attach the bearing plate
to the wooden end post.
While the slotted bearing plate was not tested under this study, it has been successfully
tested in two length-of-need strength tests involving a 4,500-lb (2,043-kg) passenger
cars impacting a box-beam median barrier end terminal at the nominal speed and angle
of 60 mi/h (96.6 km/h) and 25 degrees<8>. The incorporation pf the slotted bearing plate
into the slotted rail terminal design is therefore recommended.
• While the slotted rail end terminal design has been successfully crash tested and shown
to meet all evaluation criteria set forth in NCHRP Report 230, there may be unforeseen
problems encountered in actual field applications. It is therefore recommended that the
impact performance of this slotted rail end terminal be monitored for a period of time
to identify any problems that may show up in actual field installations. This would
allow for timely correction of any identified problems, including minor design
modifications, if necessary.
110

~-- 3/16" (j) x 2" Lag Screw (Typ.)
,, ,, ,, 11 ,, 11 11 11 11 ,, 11 ,, ,, 11 11 ,, 11 ,, 11 11 11 11
_.l..._i --t-___._li.__
r2~-i-2f-i-2~1 I I 5/8" --1 10" 10· _l
--~
~
Slotted Bearing Plate
II II II II II II II
II II I
Plate Washer (See Detail)
Slotted Bearing Plate (See Detail)
+ Groundline 3"
II II
~:: __ t--.W....
II"' 1/4" r- 4" --j -j t-3/8"
-, .-,/-2 .. ~f ~ _l_ 3"
'----.--+---------' i (J) Hole
Plate
Plate Washer
Figure 59. Slotted bearing plate detail
111

REFERENCES
1. Hirsch, T. J. and Mak, K. K., "Analytical Evaluation of Tennessee Bridge Rail Designs," Research Report 7166-1, Tennessee Department of Transportation Project 97101-0605-04, Texas Transportation Institute, College Station, Texas, February 1992.
2. Bligh, R. P. and Mak, K. K., "Analytical Evaluation of Tennessee Guardrail, Transition, and End Treatment Designs," Research Report 7166-2, Tennessee Department of Transportation Project 97101-0605-04, Texas Transportation Institute, College Station, Texas, February 1992.
3. Memorandum by Thomas 0. Willett dated September 7, 1990 entitled, "Guidelines of Applications of the AASHTO Roadside Design Guide on Federal-Aid Highway Projects."
4. Michie, J. D., "Recommended Procedure for the Safety Performance Evaluation of Highway Appurtenances," National Cooperative Highway Research Program Report 230, Transportation Research Board, Washington, D.C., March 1981.
5. Sicking, D. L., et al., "Development of New Guardrail End Treatment," Research Report 404-lF, Texas Transportation Institute, Texas A&M University System, College Station, Texas, October 1988.
6. Letter from Mr. Lawrence A. Staron, Chief, Federal-Aid and Design Division, to King K. Mak, dated March 26, 1993.
7. Test no. 7202-6, conducted under TTI project no. RF 7202, "Development of End Terminal for Box-Beam Guardrail, Phase II - Crash Testing and Evaluation".
8. Test nos. 7202-8 and 7202-9, conducted under TTI project no. RF 7202, "Development of End Terminal for Box-Beam Guardrail, Phase II - Crash Testing and Evaluation".
112

APPENDIX A
DIMENSIONS AND INFORMATION OF THE TEST VEHICLES
A-1

LIST OF FIGURES
Figure
A-1 Vehicle properties for test 7199-8 . . . . . . . . . . . . . . . . . . . . . . . . . . . A-3
A-2
A-3
A-4
A-5
A-6
A-7
Vehicle properties for test 7199-8A
Vehicle properties for test 7199-11
Vehicle properties for test 7199-13
Vehicle properties for test 7199-7 . . . . . . . . . . . . . . . . . . . . . . . . . . .
Vehicle properties for test 7199-14
Vehicle properties for test 7199-15
A-2
A-4
A-5
A-6
A-7
A-8
A-9

Date: 9-4-92 Test No.: 7199-8 VIN: JG1MR6153H12739327
Make: Chevro 1 et
Tire Size: 155R12
-------Mode 1 : Sprint
Ply Rating:
Year: 1987 ~.....;;:...;.. __ _ ----- Bias Ply:
Odometer: 6843 -----Belted: Radial: X
Accelerometers Tire Condition: good
r t a p
L 104 11
Height of rear. fair X accelerometer: badly worn
28.5 11
_l_ C=l 11
T Vehicle Geometry - inches
a 60.25 11 b 26.5 11
c 92.5 11 d* 53.25 11
e 2~.25 11 f 143.25 11
g h 38.7 11
Ti re di a,-----++-'--+-i Whee 1 di a -----f-.f4..l~
Accelerometers i j 28. 511
j
b c
f
4-wheel weight for e.g. det. lf 536 rf 510 lr 386 rr 368
Mass - pounds Curb Test Inertial Gross Static
Ml 981 1046 1135
Mz 597 754 835
MT 1578 1800 1970
Note any damage to vehicle prior to test:
Crack in windshield (marked)
*d = overall height of vehicle
Figure A-1 . Vehicle properties for test 7199-8.
A-3
k ] 4 5 11 l 43.5 11
m 20 11 n 6. 511
0 9.25 11 p 52. 511
r 21 11 s 13 125 11
Engine Type: 3 cyl Engine CID: 1. O I iter
Transmission Type: MU<-et:ff)tXMX~ Manual
FWD XlX'XXR~IXXXJX'XXJtW~X
Body Type: 5 Door Hatch Steering Column Collapse
Mechanism: Behind wheel units
-Convoluted tube -Cylindrical mesh units -Embedded ba 11 -NOT collapsible -Other energy absorption -Unknown
Brakes: Front: disc_X drum_ Rear: disc_ drum_x_

Date: 10-20-92
Make: Chevy
Test No.: 7199-BA VIN: JG1MR2151HK7426ZZ
Model: Sprint Year: 1986 Odometer: 81641
Tire Size: 145/80Rl2 Ply Rating: ----'--- Bias Ply:
f t a p
L_
Ti re di a---......... ,_,_~ ~~heel dia----+-f-
j
b
4-wheel weight for e.g. det. lf 553
Mass - pounds Curb
Ml 1053
Mz 542
MT 1577
Accelerometers
_j_J"Rt ..
TH=28 11
100. 511
Accelerometers
f
rf 533 lr 357 rr 357
Test Inertial Gross Static
1086 1161
714 806
1800 1967
Note any damage to vehicle prior to test:
*d = overall height of vehicle
Figure A-2 . Vehicle properties for test 7199-8A.
A-4
-----Belted: Radial: L
Tire Condition: good _ fair X
badly worn _
Vehicle Geometry - inches
a 60.25 11 b 26 11
c 88 5 11 d* 52 25 11
e 25 11 f 139.25 11
g h 35.1 11
i j 27 .5 11
k 15 11 l 37 11
m 18 511 n 6 5 11
0 11. 25 11 p 53 11
r 21.5 11 s 13.2511
Engine Type: 3 cyl gas
Engine CID: 1.0 Liter
Transmission Type:
Automatic ~*~~~~~ FWD Xi*XX~OOXXX*XXIOOX
Body Type: 3 Door Steering Column Collapse
Mechanism: Behind wheel units
-Convoluted tube -Cylindrical mesh units -Embedded ba 11 -NOT collapsible -Other energy absorption -Unknown
Brakes: Front: disc X drum Rear: disc_ drum.x_

Date: 1-26-93 Test No.: 7199-11 VIN: 1G6AB6991B9228724 -------Make: Cadi 11 ac Model: Fleetwood Year: 1981 ----Tire Size: ----- Ply Rating: ____ _ Bias Ply:
·[
4-wheel weight
Acee lerometers H=31. 7 5 11
_L
T
for e.g. det. lf 1192 rf 1173 £.r 1069 rr 1066
Mass - pounds Curb Test Inertial Gross Static
Ml 2375 2365
M2 1714 2135
MT 4089 4500
Note any damage to vehicle prior to test:
*d = overall height of vehicle
Odometer: 68882 -----Belted: Radial: L
Tire Condition: good _ fair X
badly worn _
Vehicle Geometry - inches
a 77. 5 11
c 121 , 5 11
57" e ___ _
g ___ _
i ----k 18. 5 11
m 20. 75 11
0 12 75 11
r 27. 5 11
Engine Type: Engine CID:
. b 40 11
q* 57 88 11
f 218. 5 11
h 57. 6 11
j 33 BB"
l 51. 511
n 3. 75 11
p 61 5 11
s 16. 211
8 cyl-Gas 6.0 Liter
Transmission Type: Automatic ~~X)WJ.~~Xl
~Xx>XX RWD rox~XJ~ Body Type: ..,.,s_e_d_a_n __ _ Steering Column Collapse
Mechanism: Behind wheel units
-Convoluted tube -Cylindrical mesh units -Embedded ba 11 -NOT collapsible -Other energy absorption -Unknown
Brakes: Front: disc_x__ drum_ Rear: disc_·drum....x._
Figure A-3 . Vehicle properties for test 7199-11.
A-5

late: 4-13-93 Test No.: 7199-13 -'-=~-=~---
VIN: VX1BB1214JK405753
lake: Yugo
·ire Size: 145R13
Mode 1 : 6VL o....------Ply Rating:
Year: ~l ...... 9 ...... 8._...8'---
B i as Ply:
Acee 1 ero111eters
r t a p
L_
Ti re di a----h---...:--+l Wheel dia----+-1-~
j m
b
-wheel weight for e.g. det. lf 580
h
J_ T
Accelerometers
c
f
rf 570 lr 330 rr 320 ---
k g
ass - pounds Curb Test Inertial Gross Static
M1 -=1=-=1=5.._7 __ _ 1150 1234
M2 _6'"""'1-=-0 __ _ 650 732
MT _1-'--76~7 __ _ 1800 1966
ate any damage to vehicle prior to test:
d = overall heiqht of vehicle
Odometer: _,5~0'""6,,,.,.01..__ __
Belted: Radial:
Tire Condition: good _· fair
badly worn _
Vehicle Geometry - inches
a 151 b 68. 5
c 215.5
e 62.5
g 20
d* 141
f 346. 5
h 85 5
j 80.8
l k ----rn 50.3 n 7. 4
0 37.2
r 56
p 128. 5
s 36.4
Engine Type: 4 Cyl Gasoline Engine CID: 1100 CC Transmission Type:
~M~~~~XX~ or Manual FWD or RWD or 4WD
Body Type:
Steering Column Collapse Mechanism:
Behind wheel units -Convoluted tube -Cylindrical mesh units -Embedded ba 11 -NOT collapsible -Other energy absorption -Unknown
Brakes: Front: disc_x_ drum_ Rear: ·disc_ drum_x_
Figure A-4 . Vehicle properties for test 7199-13.
A-6

Date: 8-28-92
Make: Ca di 11 ac
Test No. : _7_1_9_9_-_7 __ _ VIN: 1G6AD6985C9226526
Year: 1982 -:;..;:.-=.. __ Odometer: ____ _
Radial:
Model: Sedan
Ply Rating: Tire Size: ____ _ ----- Bias Ply: _ Belted:
·[ r-----1
160 11
Tire dia---.-....r-
i ., 0
Tire Condition: good _
Height of rear accelerometer:
28.75 11
fair badly worn _
j_ C=2 11
T
k g
Vehicle Geometry - inches
a 77 11
c 121. 5 11
----e 56. 5 11
g ___ _
k 15.75 11
m 21 511
0 12"
r 28.5"
Engine Type: Engine CID:
. b 39 511
c;I* 55. 5 11
f 217"
h ___ _
j 33 11
.e. 53 11
n 4 75 11
p 62 .25 11
s 16.25 11
8 cyl gas
Transmission Type: 4-wheel weight for e.g. det. £.f 1180 rf 1083 .e.r 1140 rr 1097
Automatic XWXX~~~X mx~~x RWD ™X~.¥JM
Mass - pounds Curb Test Inertial Gross Static
Ml 2160 2263 2350
M2 1878 2237 2317
MT 4038 4500 ~662
Note any damage to vehicle prior to test:
Cracked Windshield (marked)
*d = overall height of vehicle
Figure A-5 . Vehicle properties for test 7199-7.
A-7
Body Type: 4 Door Sedan Steering Column Collapse
Mechanism: Behind wheel units
-Convoluted tube -Cylindrical mesh units -Embedded ba 11
· -NOT collapsible -Other energy absorption -Unknown
Brakes: Front: disc..L drum_ Rear: disc ·drum X

late: 4-27-93
lake: Yugo
T t N 7199-14 es o.: VIN: VX1BB1219JK408566 -------
Model: GVL Year: 1988
·;re Size:. P155/80Rl3
r t a p
L_
Ti re di a1----f-'--'-->l Hheel dia----1-i~
j
m
b
wheel weight 'or e.g. det. £.f 588
SS - pounds Curb
Ml 1183
M2 642
MT 1825
------- -----
Ply Rating: Bias Ply:
h c
f
rf 543
-----Accelero111eters
Accelerometers
J_
T
£.r 335 rr 334
k g
Test Inertial Gross Static
1131 1212
669 755
1800 1967
te any damage to vehicle prior to test:
= overall heiaht of vehicle
Figure A.:.6 . Vehicle properties for test 7199-14.
A-8
Odometer: 39154 ----==:...:..=.~--
Belted: Radial :
Tire Condition: good fair
badly worn _
Vehicle Geometry - inches
a 57.5
c 85.25
e 25
g 27
k 31. 7
Ill 20.5
0 13
r 23
b
d*
f
h
j
l
n
p
s
27.5
56.5
137 75
31 5
30 5
2.25
51. 75
14.75
Engine Type: V4 Gasoline Eng i n e CID : -=-1~. 1"--'=L __ _ Transmission Type:
~OCXOOK~~X~ or Manual FWD or RWD or 4WD
Body Type:
Steering Column Collapse Mechanism:
Behind wheel units -Convoluted tube -Cyl i ndri ca 1 mesh units -Embedded ba 11 -NOT collapsible -·Other energy absorption -Unknown
Brakes: Front: disc_x_ drum Rear: disc drurn_lL

Date: -~5--=1'-'4._-..... 9 ...... 3 __ _ Test No.: 7199-15
Make: Cadillac
Tire Size: P225 R15
Mode 1 : --=C ..... ou...,p...,e.__ __ _
VIN: 1G6AD4794B9191542
Year : ___.._.19....,8=1 __ Odometer: --=16.._.6..,.6"""5 __ _
Ply Rating: ----- Bias Ply: _ Belted: X Radial:
·[ r----..J
160.25
4-wheel weight for e.g. det. lf 1263 rf 1092 lr 1013
Mass - pounds Curb Test Inertial
Ml 2375 2355
Mz 1653 2145
MT 4028 4500
Note any damage to vehicle prior to test:
*d = overall height of vehicle
_j_
T
rr 1132
Gross Static
g
Tire Condition: good _ fair _x_
badly worn _
Vehicle Geometry - inches
a 74.75 "b :.zn
c 121 <;I* 55.5
e 56.25 .c 218.25 I
g h 57.7
i j 33.75
k 17.25 l 53
m 20. 25 n 4.25
0 12 p 62
r 28 s 16.25
Engine Type: V-8 Gasoline Engine CID :6;;.... :....:· 0:-__ _ Transmission Type:
Automatic or ~~l)»@{IX
KWOl or RWD or ~ Body Type: 2 Door Steering Column Collapse
Mechanism: Behind wheel units
-Convoluted tube -Cylindrical mesh units -Embedded ba 11 -NOT collapsible -Other energy absorption -Unknown
Brakes: Front: disc drum Rear: disc ·drum
Figure A-7 . Vehicle properties for test 7199-15.
A-9

APPENDIX B
SEQUENTIAL PHOTOGRAPHS OF THE Th1PACTS
B-1

LIST OF FIGURES
Figure Page
B-1 Sequential photographs for test 7199-8 (overhead and frontal views) ............................ : . . B-3
B-2 Sequential photographs for test 7199-8 (side view) B-5
B-3 Sequential photographs for test 7199-8A (overhead and frontal views) ............................... B-6
B-4 Sequential photographs for test 7199-8A (side view) B-8
B-5 Sequential photographs for test 7199-11 (overhead and side views) . . . . . . . . . . . . . . . . . . . . . . . . . . . . . . . . B-9
B-6 Sequential photographs for test 7199-13 (overhead and frontal views) . . . . . . . . . . . . . . . . . . . . . . . . . . . . . . . B-11
B-7 Sequential photographs for test 7199-13 (behind the rail view) .......... B-13
B-8 Sequential photographs for test 7199-7 (overhead and frontal views) . . . . . . . . . . . . . . . . . . . . . . . . . . . . . . . B-14
B-9 Sequential photographs for test 7199-7 (side view) ................. B-16
B-10 Sequential photographs for test 7199-14 (overhead and frontal views) ............................... B-17
B-11 Sequential photographs for test 7199-14 (behind the rail view) .......... B-19
B-12 Sequential photographs for test 7199-15 (overhead and frontal views) ............................... B-20
B-13 Sequential photographs for test 7199-15 (side view) ................. B-22
B-2

!'!-:',
=~ ~
:'b ... ~t~"
0.113 s
·:r·~ .. ,-~: ~~-~ --~i ... ~::·~-\~
~.;;;::~~;!~ 0.225 s
·._.;;
, .~_, ~~"":--·~
c:; . ..,;f.-, ~:..::.c:_·~ -.c.
0.338 s
Figure B-1. Sequential photographs for test 7199-8. (overhead and frontal views)
B-3

Figure B-1 .
-- .. ~ f
~ .-;~;:~~~
~~.--:;~~~~~>,;_~-;_;
0.451 s
.J.j~~ .~:~~-~::;:~.~ 0.564 s
-~;~~~;i[!f~~:!(5:r:.:1:;~ .. ~ .... ~'"'!l'~ .~.... -
0.676 s ~~:~' . -~~ ...... -.:;., .-------- ,.--
,, ... -- .. -:.::!.·.~-"'~·~·-
0.789 s Sequential photographs for test 7199-8 (continued) (overhead and frontal views).
B-4

0.000 s
0.113 s 0.564 s
0.225 s 0.676 s
--·· . ..- '
c~:~~';.;;2~ 'ii
0.338 s 0.789 s
Figure B-2. Sequential photographs for test 7199-8. (side view)
B-5
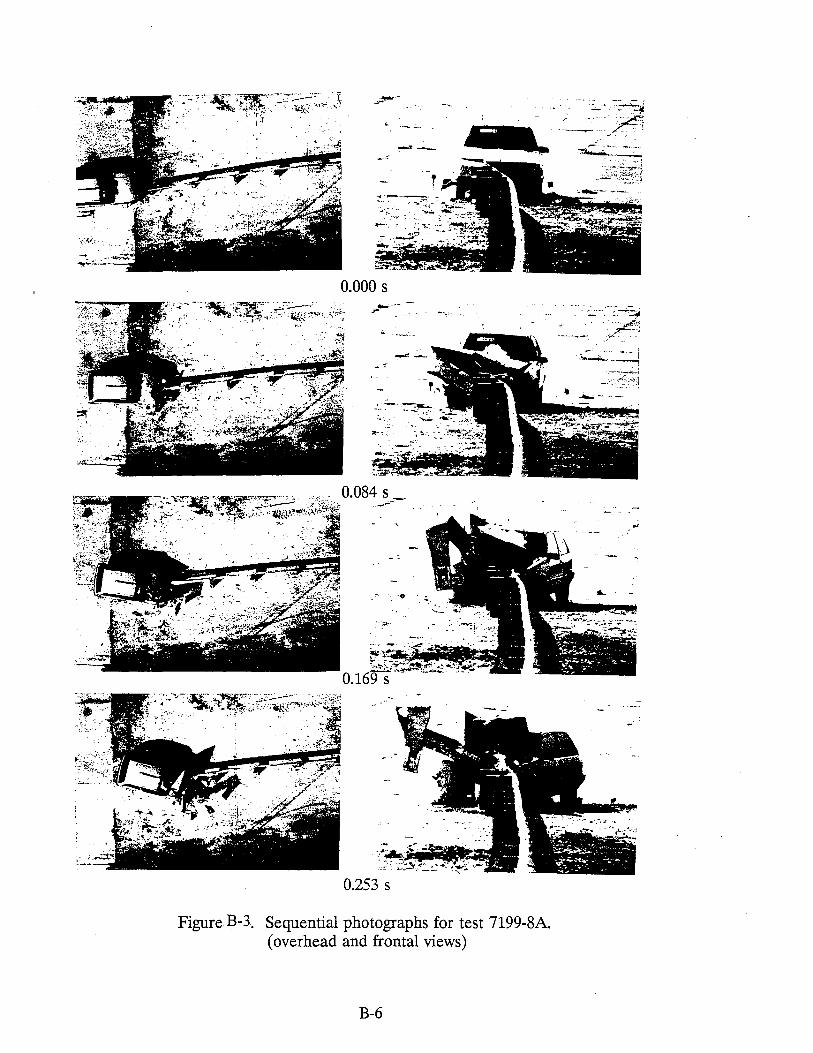
, F~ :-~ ~ ~'~·~4i'~-=~-~~"~~- .;~ . .
-~-
0.000 s
·::~faiiQ#··· :~ ~-- ~-::~_:i·::_:: • ...._. t~~· .. _ ..... ,
0.253 s
Figure B-3.. Sequential photographs for test 7199-8A. (overhead and frontal views)
B-6
·::...·-' ·· .. ·~lii
---~··A £~:~~
._.3;,_~Pi
. ::;:."··. ,_.......,_:;,;
/~~ ; ,:·~~ - -·!
_...,~~~l
-·

0.338 s
lt~~-0.506 s
0.591 s
Figure B-3 . Sequential photographs for test 7199-8A (continued) (overhead and frontal views).
B-7

.t '\
~
--- Fl---. 7--~~ 0.000 s 0.358 s
0.422 s
0.506 s
0.253 s 0.591 s
FigureB-4. Sequential photographs for test 7199-SA. (side view)
B-8

0.000 s
0.131 s
0.261 s
=··"'' "" :
-~ "' i,,, ..... -~
''· - ~
• ..:-·~· •. -......: -c__;;-_,•""1.. ~- T~-:; ' ~t~~ ~---·~· ·~ ... - ·-· •
i,~-·~~~-:):~~~:.~;;~~jh:·~~::-:~~-~;~::,~; 0.392 s
Figure B-5. Sequential photographs for test 7199-11. (overhead and side views)
B-9

=:.. ~ _:_7_;~_.-1. ._ ... :- . ---~-= ·~--- .. -- ___ ., __
=~~.~.~~~·::~~~?:,-;: .;'.~s~-~~~~~---~(; ~ 0.522 s
-......... - e-.... : __ • :_:; ::. -, ~-.: ... --::::-::-. _.. ___ , .. - -- .
~;_,~-~~,J;~~if=~=i~~--:r.~~~i~~T~_- ~;2 i-~~--0.623 s
•
t-•• - ,....:_· ~-! _ .. ;.,.~_-:.._:.. ~; ,.,..::~:. ..... ·,;:::;,. __ -~ .,.._ . - ,,. - -
~-~:i&~::~~~-;;-~-;;~:..:;~~;.;· ~;~.: ~-~~ 0.784 s
0.914 s
Figure B-5 . Sequential photographs for test 7199-11 (continued) (overhead and side views).
B-10

0.000 s
0.184 s
0.369 s
0.553 s FigureB-6. Sequential photographs for test 7199-13.
(overhead and frontal views) -
B-11

0.738 s
0.922 s
1.107 s
...:.,_-./.~
IE:.>.
1.291 s
Figure B-6 . Sequential photographs for test 7199-13 (continued) (overhead and frontal views).
B-12

0.000 s 0.738 s
0.184 s 0.922 s
0.369 s 1.107 s
0.553 s 1.291 s
Figure B-7. Sequential photographs for test 7199-13. (behind the rail view)
B-13
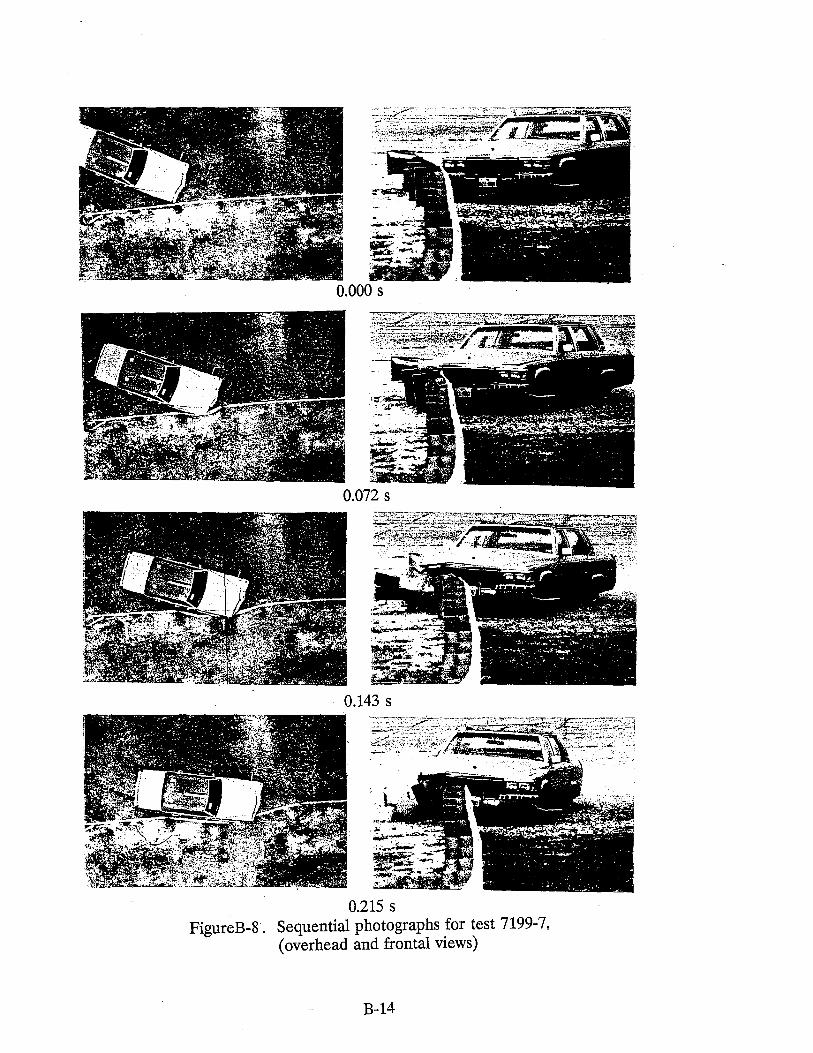
0.143 s
0.215 s FigureB-8. Sequential photographs for test 7199-7,
(overhead and frontal views)
B-14

0.287 s
0.358 s
0.430 s
0.501 s
Figure B-8 . Sequential photographs for test 7199-7 (continued) (overhead and frontal views).
B-15

0.000 s 0.287 s
0.072 s 0.358 s
0.143 s 0.430 s
0.215 s 0.501 s
FigureB-9. Sequential photographs for test 7199-7. (side view)
B-16

t?~~~ ~-. -~~ - -~-:~~t;··. ~f 0.~~~~~~ ~ .
0.000 s
0.075 s
0.151 s
~r;..=.-~,;.:-,_.
£_~.:_.:. ..:~~-- .-· ~--
0.226 s
Figure B-10. Sequential photographs for test 7199-14 (continued) (overhead and frontal views).
B-17

;~-;.;;-.,~
~~);:\.~::~!i~·- '
0.301 s
0.376 s
0.452 s
.... ~ ~
.... ;
~:~~~:...:. ~·v· --
0527 s FigureB-10. Sequential photographs for test 7199-14.
(overhead and frontal views) cont.
B-18
,· _:.-:~
'~F

0.000 s 0.301 s
0.075 s 0.376 s
0.151 s 0.452 s
0.226 s 0.527 s
FigureB-1 L Sequential photographs for test 7199-14. (behind the rail view)
B-19

0.051 s
0.100
0.151 s FigureB-12. Sequential photographs for test 7199-15.
(overhead and frontal views).
B-20

0.251 s
0.350 s
0.499 s
·~·.::-··
~~-. .it~:.' ..
~.::--.· .. ·-.. _... ..
---·~- -~~-
- -- -- ·""'" ___ _ ~.~~--::.__:::_:: ,. ___ _
m.'*· _,..,,.. •t,- c-y<-•
~.·····
~ ..... / . ./
~- .. ; - II:;· -.. - -•.-
1.000 s
Figure B-12 . Sequential photographs for test 7199-15 (continued) (overhead and frontal views).
B-21

0.051 s .0.350 s
0.100 s 0.499 s
0.151 s 1.000 s
FigureB-13. Sequential photographs for test 7199-15. (side vfew)
B-22

APPENDIX C
VEHICULAR ACCELERATION VERSUS TIME TRACES
C-1

Figure
C-1
C-2
C-3
C-4
C-5
C-6
C-7
LIST OF FIGURES
Longitudinal accelerometer trace for test 7199-8
Lateral accelerometer trace for test 7199-8 .......................
Vertical accelerometer trace for test 7199-8
C-3
C-4
C-5
Longitudinal accelerometer trace for test 7199-8A . . . . . . . . . . . . . . . . . . C-6
Lateral accelerometer trace for test 7199-8A C-7
Vertical accelerometer trace for test 7199-8A C-8
Longitudinal accelerometer trace for test 7199-11 C-9
C-8 Lateral accelerometer trace for test 7199-11 .................. : .. C-10
C-9 Vertical accelerometer trace for test 7199-11 ..................... C-11
C-10 Longitudinal accelerometer trace for test 7199-13 .................. C-12
C-11 Lateral accelerometer trace for test 7199-13 ..................... C-13
C-12 Vertical accelerometer trace for test 7199-13 ..................... C-14
C-13 Longitudinal accelerometer trace for test 7199-7 ................... C-15
C-14 Lateral accelerometer trace for test 7199-7 ...................... C-16
C-15 Vertical accelerometer trace for test 7199-7 ...................... C-17
C-16 Longitudinal accelerometer trace for test 7199-14 .................. C-18
C-17 Lateral accelerometer trace for test 7199-14 ..................... C-19
C-18 Vertical accelerometer trace for test 7199-14 ..................... C-20
C-19 Longitudinal accelerometer trace for test 7199-15 .................. C-21
C-20 Lateral accelerometer trace for test 7199-15 ..................... C-22
C-21 Vertical accelerometer trace for test 7199-15 .. ~ .................. C-23
C-2

() I w
,,-...... IZl
"'bt> .._.. i:I 0
"""" -~ (I)
] -
CRASH TEST 7199-8 Class 180 Filter
25~~~~~~~~~~~~~~~~~~~~~~~~~~~~~~~
0 ........................ i. .............. . i ·········l··· : i i i
C'd . e -5 .. . .......... r···· ········ ·····+··························t··························+·························+·························+··························t-·························+··························t···························
! -10 .......... .. . ... 1....... .. .. . ..... ..l ........................... 1. ........................ ..1 .......................... .1. .......................... 1. ......................... .l ......................... ..l ........................... l. ......................... . j= I I I I I I I I I
15 : : : : : : : : : - ············ ................................... : .......•..........•........ .:. .•......................... : ...........................•...........................•............•.............. .:. ........................... : ........................... .:. .......................... . ~ i i i i i i l i
i i i i l l i i l -20 .............. ••••U•~---···••HU••n••········-i---···········••n••······-i ................................. ; ............................. i ................................... ~ .................................... ~ ..................................... ; ................................... i ............................... .
I I I I I I I I I ~ ~ i ! ~ l ~ i ~ -25-+-~~-+-~~-+-~~--;-~~-t-~~-+-~~-+-~~--+~~--+~~---if--~---i
0 0.1 0.2 0.3 0.4 0.5 0.6 0.7 0.8 0.9 1 Time (seconds)
j- 50 msec. avg. I Figure C-1 . Longitudinal accelerometer trace for test 7199-8.

CRASH TEST 7199-8 Class 180 Filter
25.....-~~--.--~~-,--~~--,-~~---,-~~---,-~~----:-~~-.,.-~~----,.~~----,,--~---,
...... ... . . ··n··· ............................................. 1 ............ .................. : .. ··:·j·w···l·;···-~ .. o~--~----~-----~---·~-~~Wf~~--.'f .. ;:.;.;;·····;;;;o .. ··-..,· _, I ~,
-5 ............. ..... ---~ .. i ..... .. . .. ...... , .. : ........................... : .. i ............................. 1-············----·--·······1 ... · . .. .......... j"" ......................... t ........................... t"" ......................... t .......................... . i ! i i
-25-+-~~---~~-+-~~---~~---~~---~~---~~--r~~--t-~~----;i--~--t
0 0.1 0.2 0.3 0.4 0.5 0.6 0.7 0.8 0.9 1 Time (seconds)
j- 50 msec. avg. I Figure C-2 . Lateral accelerometer trace for test 7199-8.

(') I Vl
CRASH TEST 7199-8 Class 180 Filter
25--.-~~--.--~~--.----.--~--.--~~--.--~~--.--~~...,..--~~...,..--~~...,..--~--.--...,..--~------.
i
5 ........... .
0 : :
-5 ······· - ..... ! ...... ······ . ,, . . . . . . r ·····················r·························l·························-r ························r·························r·························l··························r·······--·················
-25 0 0.1 0.2 0.3 0.4 0.5 0.6 0.7 0.8 0.9 1
Time (seconds)
j- 50 msec. avg. I
Figure C-3 . Vertical accelerometer trace for test 7199-8.

(') I 0\
CRASH TEST 7199-SA Class 180 Filter
1- 50 msec. avg. I Figure C-4 . Longitudinal accelerometer trace for test 7199-8A.

CRASH TEST 7199-SA Class 180 Filter
30i-.--------~--~-~---,---~---,----------.
- l
. ····························1······-p· ~-lliO;;···-~--·;;····:.:;·····;.iliii····;;;;·····;.;w·····~--""""""""""!' ......... -.....,
-30----r----t--------t----t--------t----t-----t----t----t---'1 0 0.1 0.2 0.3 0.4 0.5 0.6 0.7 0.8 0.9 1
Time (seconds)
j- 50 msec. avg. I Figure C-5 . Lateral accelerometer trace for test 7199-8A.

-.. .... vi b.O --= 0 ...... ..... e ~
(") -I ! 00
-C'd (.) ...... ..... ~
> -10 - - --,
CRASH TEST 7199-8A Class 180 Filter
-301-1-~~_._~~-+-~~---+-~~-+-~~-+-~~-+-~~-+-~~---i-~~---i-~~-<
0 0.1 0.2 0.3 0.4 0.5 0.6 0.7 0.8 0.9 1 Time (seconds)
1- 50 msec. avg. I Figure C-6 . Vertical accelerometer trace for test 7199-SA.

40
30
20 -en "e> -c::
10 0 ~ co .... Q)
Qi (.)
0 (") (.)
I <( l.O (ii
c:: :.c :e -10 C> c:: 0
.....J
-20
-30
-40
0 0.1 0.2 0.3
CRASH TEST 7199-11 Accelerometer at center-of-gravity
1· I I I
I I I I I I I
-~--------~--------~--------~---------r--------1 I I I I I I I I I I I I I I I I I I I I I I I I
0.4 0.5 0.6 0.7 0.8 0.9 1 Time After Impact (seconds)
-- Class 180 filter -- 50-msec Average
Figure C-7 . Longitudinal accelerometer trace for test 7199-11.

40
30
20
- 10 (/) -Cl -c: 0
:;::::; 0 ro ..... Q)
n Qi I u - ~ -10 0
-ro ..... Q) -_'.'.l-20
-30
-40
-50
0 0.1
CRASH TEST 7199-11 Accelerometer at center-of-gravity
0.2 0.3 0.4 0.5 0.6 Time After Impact (seconds)
-- Class 180 filter --- 50-msec Average
I I I I
I I --------4--------~--------
1 I I I I I I I
0.7 0.8 0.9
Figure C-8 . Lateral accelerometer trace for test 7199-11.
1

() I --
40
30
20 ----- -
Ui" 10 ~ c: 0
~ 0 <I> al (.) (.)
<( -10 (i'i (.)
t ~ -20
-30
-40
-50
0 0.1
CRASH TEST 7199-11 Accelerometer at center-of-gravity
0.2 0.3 0.4 0.5 0.6 0.7 0.8 0.9 Time After Impact (seconds)
-- Class 180 filter - 50-msec Average
Figure C-9 . Vertical accelerometer trace for test 7199-11.

(') I .......
N
40
30
20 'in' ~ c: 10 0
+:l co ... (I)
Ci) (,) 0 (,) <(
(ij c: '6
::::s -10 :t: Cl c: _g
-20
-30
-40
0
I I I I
I I
CRASH TEST 7199-13 Accelerometer at center-of-gravity
I I I I I I I ------------1-----------1------------r-----------1------------r-----------4------------T------------1 I I I I I I I I I I I I I I I I I I I I I I I I I I I I I I I I I I
------------~-----------1------------r-----------~------------r-----------~------------+------------I I I I I I I I I I I I I I I I I I I I I I I I I I I I I I I I I I I
------------L-----------4------------L-----------~------------L-----------~------------~------------I I I I I I I I I I I I I I I I I I I I I I I I I I I I
I I I I I
I I I I I --r-----------,------------r-----------,------------r-----------,------------T------------1 I I I I I I I I I I I I I I I I I I I I I I I I I I I I I I I I I I
---~-----------1------------r-----------~------------r-----------~------------+------------I I I I I I I I I I I I I I I I I I I I I I I I I I I I I I I I I I I
----L-----------4------------L-----------~------------L-----------~------------~------------I I I I I I I I I I I I I I I I I I I I I I I I I I I I I I I I I I I I I I I I I I
0.1 0.2 0.3 0.4 0.5 0.6 0.7 0.8 Time After Impact (seconds)
-- Class 180 filter -- 50-msec Average
Figure C-10 . Longitudinal accelerometer trace for test 7199-13.

40
30
20
'Yi' .9 10 c: 0 ~ ca .... Cl>
0 () Ci) (.)
I (.) ~ <( '->)
(ij Q) -10 -ca
...J
-20
-30
-40 0
I I I
CRASH TEST 7199-13 Accelerometer at center-of-gravity
I I I I I I I I I I I I ------------L ___________ i ____________ L-----------~------------L-----------~------------~------------1 I I I I I I I I I I I I I I I I I I I I I I I I I I I I I I I I I I I I I I I I I
------------r-----------~------------r-----------1------------~-----------~------------+------------1 I I I I I I I I I I I I I I I I I I I I I I I I I I I I I I I I I I I I ---r-----------,------------1----------- -----------,-----------,------------T------------1 I I I I I I I I I I I I I I I I I
I I I I I I I I I I
I I I I I
I I I I I I I --------- --r-----------~------------r-----------1------------~-----------~------------+------------1 I I I I I I I I I I I I I I I I I I I I I I I I I I I I I I I I I I I I I I I I I ------------r-----------1------------1-----------,------------,-----------1------------T------------I I I I I I I I I I I I I I I I I I I I I I I I I I I I I I I I I I I
-~----------~-----------i------------r-----------i------------r-----------~------------t------------1 I I I I I I I I I I I I I I I I I I I I I I I I I I I I I I I I I I
0.1 0.2 0.3 0.4 0.5 0.6 0.7 0.8 Time After Impact (seconds)
-- Class 180 filter - 50-msec Average
Figure C-11 . Lateral accelerometer trace for test 7199-13.

(") I -+:.
0 0.1 0.2
CRASH TEST 7199-13 Accelerometer at center-of-gravity
0.3 0.4 0.5 Time After Impact (seconds)
-- Class 180 filter -- 50-msec Average
0.6
Figure C-12 . Vertical accelerometer trace for test 7199-13.
0.7 0.8

,,-.... flJ
"'b.O -= 0 •""4 -~ ~ -n ~
I < ......... Vo -(o;I
= •""4
"'O E "Q = 3
CRASH TEST 7199-7 Class 180 Filter
20-.--~~-,.-~~-,-~~~~~----,-~~~~~-.,-~~-.,..~~--,.~~---,.--~---,
: ..
:
~ ............................. j. ..................................... t .................................. t ............................. ..;. ................................... t .............................................................. .
-20-4---~-+-~~---~--T~~---~--~~--~--~~----~~t--~-t
0 0.1 0.2 0.3 0.4 0.5 0.6 0.7 0.8 0.9 1 Time (seconds)
1- 50 msec. avg. I Figure C-13 . Longitudinal accelerometer trace for test 7199-7.

-tl.l "'bO '-"
s:= 0 ..... .....
(') f::! I
~ ...... 0\ -! -f::!
I~ j
CRASH TEST 7199-7 Class 180 Filter
201-r-~~~~~---,-~~-.-~~-,--~~--.-~~-.-~~~~~--.~~~~~----.
I ,
5 ·············-··········· ···············
0 .... ····----- r······ ..... --
i -5 ............................... .;. ........................................................ ···+···························i···························i··························t··························--t·-·····················--··•··························-+·-·························
-20 0 0.1 0.2 0.3 0.4 0.5 0.6 0.7 0.8 0.9 1
Time (seconds)
j- 50 msec. avg. I Figure C-14 . Lateral accelerometer trace for test 7199-7.

(") I ,_.
-....l
CRASH TEST 7199-7 Class 180 Filter
2Q1-.-~-----,-~~~~~,--~~~~-,--~-,-~~--.--~---.~~--.-~--.
i,,· .
'!
.......... ·.,,./l"f'·f'!l.~ui...J~?~~~~AA~~~~
. . . . 5
: : - ••••••••••••••••n••••••n; •• •••••• """"""""""" t••••••••••n••••• "" ........................................................... t .............................. t ............................. ~ .............................................................. .f. .............................. . . . . . . . . . . . . . . . . . . . . . . . . . . .
-20---~---~~---~~--~--~~---~--r~~-t-~--~~--~---i
0 0.1 0.2 0.3 0.4 0.5 0.6 0.7 0.8 0.9 1 Time (seconds)
1- 50 msec. avg. .. J
Figure C-15 . Vertical accelerometer trace for test 7199-7.

(') I ,.......
00
40
30
20 'Ci) ~ c:
10 0 :;:I co ... Q)
Qi (,) 0 :t.
ca c: :c :::::s -10 :t: C> c: 0
..J
-20
-30
CRASH TEST 7199-14 Accelerometer at center-of-gravity
I I I I
I I I I I I I I I
------------r-----------~------------r-----------~------------r-----------~------------T------------1 I I I I I I I I I I I I I I I I I I I I I I I I I I I I I I I I I I
------------r-----------1------------r-----------1------------r-----------~------------+------------I I I I I I I I I I I I I I I I I I I I I I I I I I I I I I I I I I I
------------r-----------~------------r-----------~------------r-----------~------------+------------1 I I I I I I I I I I I I I I I I I I I I I I I I I I I I I I I I I I I I I I I
I I I I I
I I I I I I . ------~------------~-----------~------------~-----------~------------~------------! I I I I I
I I I I I I I I I I I I I I I I I I
I I I I I I I I I I I I I I
-----r---------~-~------------r-----------~------------r-----------~------------T------------1 I I I I I I I I I I I I I I I I I I I I I I I I I I I I I I I I I I
_____ L ___________ i ____________ L-----------~------------L-----------~------------~------------1 I I I I I I I I I I I I I I I I I I I I I I I I I I I I I I I I I I I I I I I I I -40 -1----~--+--~~--l-~~-~--+~-~~--l----~--+~~~~--+-~-~~--1--~-~~
0 0.1 0.2 0.3 0.4 0.5 0.6 0.7 0.8 Time After Impact (seconds)
-- Class 180 filter - 50-msec Average
Figure C-16 . Longitudinal accelerometer trace for test 7199-14.

40
30
20
'ii)' :s c: 10 0
:;:3 as ... Q)
Ci> 0 (j 0
0 I <( .......
"° (ii li>-10 -as ..J
-20
-30
-40
0
t I I
CRASH TEST 7199-14 Accelerometer at center-of-gravity
I I I I I I I I I
------------L-----------i------------L-----------~------------L-----------~------------~------------1 I I I I I I I I I I I I I I I I I I I I I I I I I I I I I I I I I I I I I I I I I
------r-----------~------------r-----------~------------r-----------~------------+------------1 I I I I I I I I I I I I I I I I I I I I I I I I I I I I I I I I I I I I I I I I I -----r---- ------1------------,-----------,------------,-----------,------------T------------1 I I I I I I I I I I I I I
I I I I I I I I I I I
11~l'rrT'l"""-1.J.Li I I I I
I I I I I I I I I I I I
I I I I I I --------- --------~------------r------ ---~------------r-----------~------------+------------
1 I I I I I ' I I I I I I I I I I I I I I I I I I I I I I I I
I I I I I I I ------------r-----------1------------1-----------1------------1-----------,------------T------------I I I I I I I I I I I I I I I I I I I I I I I I I I I I I I I I I I I ____________ L ___________ i ____________ L-----------~------------L-----------~------------~------------1 I I I I I I I I I I I I I I I I I I I I I I I I I I I I I I I I I I I I I I I I I
0.1 0.2 0.3 0.4 0.5 0.6 0.7 0.8 Time After Impact (seconds)
-- Class 180 filter - 50-msec Average
Figure C-17. Lateral accelerometer trace for test 7199-14.

I I I
CRASH TEST 7199-14 Accelerometer at center-of-gravity
I I I I I I I I I I I _____ L ___________ i ____________ L----~------~------------L-----------~------------~------------1 I I I I I I I I I I I I I I I I I I I I I I I I I I I I I I I I I I I I I I I I I ----r ----------~------------r-----------~------------r-----------~------------+------------1 I I I I I I I I I I I I I I I I I I I I I I I I I I I I I I I I I I
--t -- -- --- !------------~----------- -----------}-----------~------------+------------! I I I I I I I I I I I I I I I I I I I I I I
I I I I I I I I
I I I I I I I I I I
-r -----~------------r-------- -~------------r-----------~------------+------------1 I I I I I I I I I I I I I I I I I I I I I I I I I I I I I I I I I I I I I I I I I -----r-----------,------------r-----------1------------,-----------,------------T------------1 I I I I I I I I I I I I I I I I I I I I I I I I I I I I I I I I I I ______ L ___________ i ____________ L-----------~------------L-----------~------------~------------1 I I I I I I I I I I I I I I I I I I I I I I I I I I I I I I I I I I I I I I I I I
0.1 0.2 0.3 0.4 0.5 0.6 0.7 0.8 Time After Impact (seconds)
-- Class 180 filter - 50-msec Average
Figure C-18 . Vertical accelerometer trace for test 7199-14.

40
30
20 'ii)
~ c:
10 0 +:I ca ,_ Q)
a; (") 0 0 0 I <( N - (ij
c: :e :E -10 Cl c: 0 _..
-20
-30
-40 0
I I I
CRASH TEST 7199-15 Accelerometer at center-of-gravity
I I I I I I I I I
------------L-----------i------------L-----------~------------L-----------~------------l------------1 I I I I I I I I I I I I I I I I I I I I I I I I I I I I I I I I I I I I I I I I I
------------r-----------~------------r-----------~------------r-----------~------------+------------1 I I I I I I I I I I I I I I I I I I I I I I I I I I I I I I I I I I I I I I I I I --------- --r-----------,------------r-----------,------------r-----------,------------T------------1 I I I I I I I I I I I I I I I I I I I I I I I I I I I I I I I I
I •U I I
I I I I I I I I I r-----------~------------r-----------~------------r-----------~------------+------------1 I I I I I I I I I I I I I I I I I I I I I I I I I I I I I I I I I I I I I I I I I ------------r-----------,------------r-----------,------------r-----------,------------T------------1 I I I I I I I I I I I I I I I I I I I I I I I I I I I I I I I I I I
------------L-----------i------------L-----------~------------L-----------~------------l------------1 I I I I I I I I I I I I I I I I I I I I I I I I I I I I I I I I I I I I I I I I I
0.1 0.2 0.3 0.4 0.5 0.6 0.7 0.8 Time After Impact (seconds)
-- Class 180filter - 50-msecAverage
Figure C-19 . Longitudinal accelerometer trace for test 7199-15.

40
30
20
'iii' -C>
10 -c: 0
+:I co .... n Q)
0 Q) I 0 N 0 N <(
(ij Ci> -10 -co _J
-20
-30
-40
0
I I I I
CRASH TEST 7199-15 Accelerometer at center-of-gravity
I I I I I I I ------------L-__________ i ____________ L-----------~------------L-----------~------------~------------1 I I I I I I I I I I I I I I I I I I I I I I I I I I I I I I I I I I I I I I I I I
------------r-----------~------------b-----------~------------r-----------~------------+------------1 I I I I I I I I I I I I I I I I I I I I I I I I I I I I I I I I I I I I I I I I I --------- --r-----------,------------r-----------,------------r-----------1------------T------------1 I I I I I I I I I I I I I I I~ I I I I I I I I I I I I I I! I I
I I I I I
I I I I I I I -------- ---r-----------~------------r-----------~------------r-----------~------------+------------1 I I I I I I ' I I I I I I I I I I I I I I I I I I I I I I I I I I I I I I I I I I I ------------r-----------,------------r-----------,------------r-----------,------------T------------1 I I I I I I I I I I I I I I I I I I I I I I I I I I I I I I I I I I ____________ L ___________ i ____________ L-----------~------------L-----------~------------~------------1 I I I I I I I I I I I I I I I I I I I I I I I I I I I I I I I I I I I I I I I I I
0.1 0.2 0.3 0.4 0.5 0.6 0.7 0.8 Time After Impact (seconds)
-- Class 180 filter -- 50-msec Average
Figure C-20 . Lateral accelerometer trace for test 7199-15.

40
30
20
(i)
9 10 c: 0
+:I (ti ..... Q)
(") Ci> 0 I 0
N ~ w (ij
~ -10
~
-20
-30
-40
CRASH TEST 7199-15 Accelerometer at center-of-gravity
I I I I
I I I I I I I ____________ L ___________ i ____________ L-----------~------------L-----------~------------l------------1 I I I I I I I I I I I I I I I I I I I I I I I I I I I I I I I I I I I I I I I I I
------------r-----------~------------r-----------4------------r-----------4------------+------------1 I I I I I I I I I I I I I I I I I I I I I I I I I I I I I I I I I I I I I I I I I ------ - --r-----------,------------r--- -------,----------- r-----------,- ---------T------------1 I I I I I I I I I I I I
I I I
~\fi:~~~fli!;li~~~ftWl!~~~~~~~iJ,4.tt1~~~~~~~I~~~~~~~~ I I I I I I I I I I I I I I
I I I I I I I ---- -- - --r-----------~------------r-- --------4------------r-----------4--- --------+------------! I I I I I I I I I I I I I I I I I I I I I I I I I I I I I I I I I I I I I I I I I --------- --r-----------,------------r-----------,------------,-----------,------------T------------1 I I I I I I I I I I I I I I I I I I I I I I I I I I I I I I I I I I ____________ L ___________ i ____________ L-----------~------------L-----------~------------l------------1 I I I I I I I I I I I I I I I I I I I I I I I I I I I I I I I I I I I I I I I I I
0 0.1 0.2 0.3 0.4 0.5 0.6 0.7 0.8 Time After Impact (seconds)
-- Class 180 filter -- 50-msec Average
Figure C-21 . Vertical accelerometer trace for test 7199-15.

APPENDIX D
VEHICULAR ANGULAR DISPLACEMENTS VERSUS TIME PLOTS
D-1

LIST OF FIGURES
Figure Page
D-1 Vehicle angular displacements for test 7199-8 ..................... D-3
D-2 Vehicle angular displacements for test 7199-8A .................... D-4
D-3 Vehicle angular displacements for test 7199-11 .................... D-5
D-4 Vehicle angular displacements for test 7199-13 ..................... D-6
D-5 Vehicle angular displacements for test 7199-7 ••••••••••••••• 0 •••• D-7
D-6 Vehicle angular displacements for test 7199-14 •••••••••••••• 0 ••••• D-8
D-7 Vehicle angular displacements for test 7199-15 . " .... " ............. D-9
D-2

12.0
0.0
-12.0 Cf) Q)
-24.0 Q)
L Ol
-36.0 0 Q) I 0 w
-48.0 .µ c Q) -60.0 E Q)
u -72.0 ro r-1
0. -84.0 Cf) ·r-1
0 -96.0
-108.0
-120.0 0.0
7199-8
1-----Yaw )( Pitch 8 Ro1J
0.2 0.4 0.6 0.8
Time (Seconds)
Figure D-1 . Vehicle angular displacements for test 7199-8.
1. 0
PA3.08
Axes are vehicle fixed. Sequence for determining orientation is:
1. Yaw 2. Pitch 3. Roll

7199-8A 1 ·Z
+1''1Clt A •Vf\W
Rolf ~~~ Yaw * Pitch 8 ~ ·"o'' 7.0 ----- I ~ 0.0
-7.0 Axes are vehicle fixed. Ul Sequence for determining Q)
orientation is: Q) -14.0 L
Yaw t:l Ol 1. I Q) 2. Pitch ~ 0 -21.0
3 . Roll .µ -28.0 c Q) I
E Q) -35.0 u ro rl -42.0 0. Ul
·r-t 0 -49.0
-56.0
-63.0 0.0 0.2 0.4 0.6 0.8 1.0
Time (Seconds) PA3.08
Figure D-2 . Vehicle angular displacements for test 7199-8A.

40.0
35.0
(/) 30.0 Q)
0 Q)
I c... 25.0 Ul OI Q)
0
20.0 .µ c Q) 15.0 E Q)
u co 10.0 ,....... 0. (/)
·rl 5.0 0
0.0
-5.0 0.0 0.2
Figure D-3 .
7199-11
Yaw * Pitch 8 Roli
0.4 0.6 0.8
Time (Seconds) PA3.08
Vehicle angular displacements for test 7199-11.
Axes are vehicle fixed. Sequence for determining orientation is:
1. Yaw 2. Pitch 3. Roll
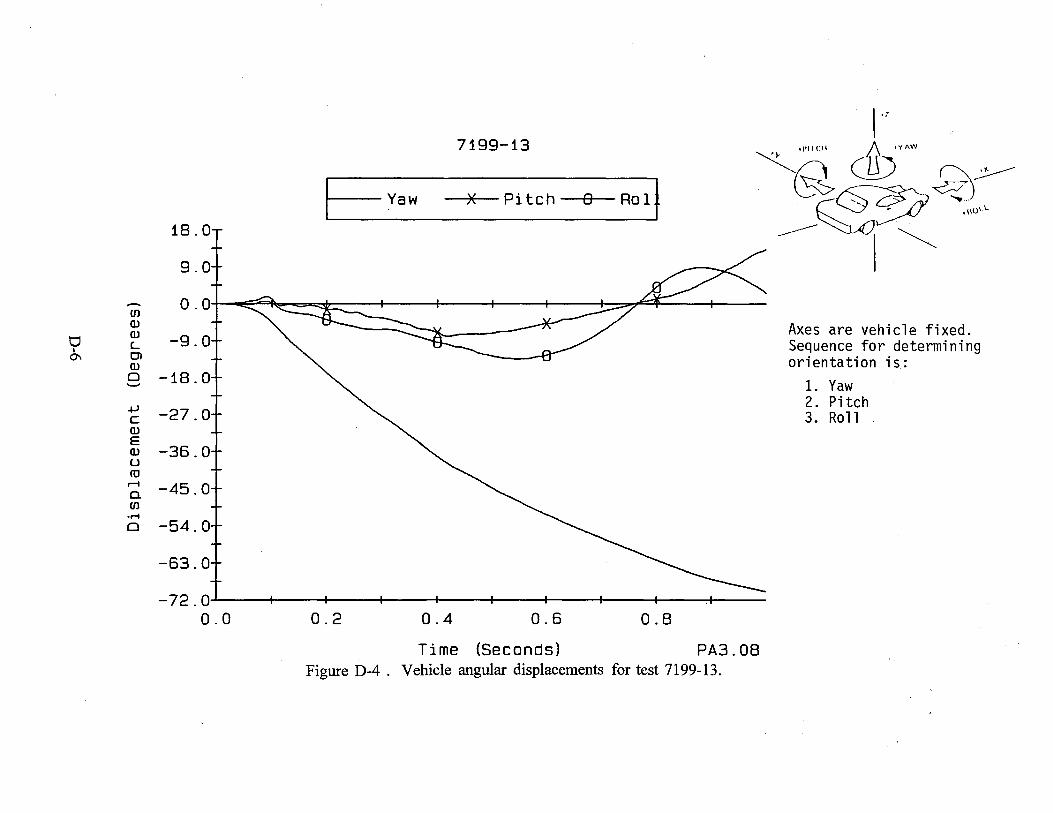
18.0
9.0
en 0.0 Q)
tJ Q) -9.0
I L
°' Ol Q)
0 -18.0
.µ -27.0 c Q)
E Q) -36.0 u ro
...-1 -45.0 0. en ...... 0 -54.0
-63.0
-72.0 0.0
7199-13
i----Yaw x Pitch O Rolt
0.2 0.4 0.6 0.8
Time (Seconds) PA3.08 Figure D-4 . Vehicle angular displacements for test 7199-13.
Axes are vehicle fixed. Sequence for determining orientation is:
1. Yaw 2. Pitch 3. Roll

7199-7 \ ,7
Yaw ~E Pitch 8 'Rol ! ,, ·•"'" ®"" ~ 40.0 ~ <,J
~ ,•occ
35.0
Ul 30.0
~. \ ~ ID ID 25.0 Axes are vehicle fixed. (._
Dl Sequence for determining ID
tJ 0 20.0 orientation is: I
.....;i
+' 15.0 1. Yaw c 2. Pitch ID 3. Roll E ID 10.0 u co ,.....
5.0 0. Ul ..... 0 0.0
-5.0
-10.0 0.0 0.2 0.4 0.6 0.8 1. 0
Time (Seconds) PA3.08
Figure D-5 . Vehicle angular displacements for test 7199-7.

6.0
0.0
-6.0 Ul Q)
-12.0 Q)
'-tJ OI -18.0 I Q) 00
0
-24.0 .µ c Q) -30.0 E Q)
u -36.0 IU
..-1
0. -42.0 Ul ·f"1
0 -48.0
-54.0
-60.0 0.0
7199-14
Yaw * Pitch 8 Rolf
0.2 0.4 0.6 0.8 1. 0
Time (Seconds) PA3.08 Figure D-6 . Vehicle angular displacements for test 7199-14.
Axes are vehicle fixed. Sequence for determining orientation is:
l. Yaw 2. Pitch 3. Roll

60.0
54.0
48.0 Ul Q.)
42.0 Q.)
c... tJ Cl
36.0 I Q.)
'° 0
30.0 +-' c Q.) 24.0 E Q.)
u 18.0 ro ~
0. 12.0 Ul ·rl
0 6.0
0.0
-6.0 0.0 0.2
Figure D-7 .
7199-15
Yaw ~E Pitch 8 Rolf
0.4 0.6 0.8
Time (Seconds) PA3.08 Vehicle angular displacements for test 7199-15.
Axes are vehicle fixed. Sequence for determining orientation is:
1. Yaw 2. Pitch 3. Roll