development of uplc methods for the determination...
TRANSCRIPT

Development of UPLC methods for the determination of drug products.
Patil A.T. and Shaikh K.A. 170
CHAPTER – V
DEVELOPMENT OF UPLC METHODS
FOR THE DETERMINATION OF DRUG
PRODUCTS.

Development of UPLC methods for the determination of drug products.
Patil A.T. and Shaikh K.A. 171
5.1 INTRODUCTION:
High efficiency and shorter run time are the basic requirements of high-speed
chromatographic separations. To fulfill these requirements, a new separation technique i.e. ultra-
performance liquid chromatography (UPLC), has been developed. The objective of the current
study is to develop and validated reversed-phase UPLC method for the quantitative
determination of drug product. First UPLC method is developed for the determination of
mesalamine in the presence of degradation products and its process-related impurities in tablet
dosage form and second UPLC method is developed to conduct in vitro dissolution studies of
two different Antihypertensive formulations in tablet dosage form such as Dronedarone tablet
and Telmisartan and Hydrochlorothiazide tablet.
Mesalamine (5-aminosalicylic acid, 5-ASA), the therapeutically active lead of sulfasalazine1-
3, which is used as a gastrointestinal anti-inflammatory drug for the treatment of inflammatory
bowel diseases4 and active ulcerative proctitis
5,6. It is a tan to pink `crystalline powder,
relatively insoluble in chloroform, ether, n hexane and ethyl acetate and freely soluble in dil.
HCl and alkali hydroxides7-8
. Mesalamine is available in tablet dosage forms (400 mg)
and is an official drug of USP. Mesalamine protects against colorectal cancer in inflammatory
bowel disease9. For safety and quality of drug product, related substances should be known. The
new approach emphasizes on good amount of resolution between all related substances in the
drug product analytical method. Hence there is need to develop stability indicating UPLC
method for the determination of related substances of Mesalamine in tablet dosage form.
Dronedarone HCl mainly used for cardiac arrhythmias, it was recommended as an
alternative to amiodarone for the treatment of atrial fibrillation and atrial flutter. Its chemical
designation is N-(2-Butyl-3-(p-(3-(dibutylamino)propoxy)benzoyl)-5-benzofuranyl) methane
sulfonamide. Dronedarone tablets were obtained from India market. Each tablet was labeled
contain 400 mg of Dronedarone. Telmisartan is an angiotensin II receptor antagonist used in the
management of hypertension. Its chemical design 4’-[(1, 4’- Dimethyl-2’-propyl-[2, 6’-bi-1H-
benzimidazol]-1’-yl) methyl]-[1, 1’-biphenyl]-2-carboxylic acid. Hydrochlorothiazide is a
thiazide type diuretic which reduces reabsorption of electrolytes from the renal tubules. Its
chemical designation is 6-Chloro-3, 4-dihydro-2H-1, 2, 4-benzothiazidin-7-sulfonamide-1,1-

Development of UPLC methods for the determination of drug products.
Patil A.T. and Shaikh K.A. 172
dioxide. Telmisartan and Hydrochlorothiazide are indicated for the treatment of hypertension.
Telmisartan and Hydrochlorothiazide tablets were obtained from India market. Each tablet was
labeled as Telmisartan 40 mg and Hydrochlorothiazide 12.5 mg, or Telmisartan 80 mg and
hydrochlorothiazide 12.5 mg.
5. 2. LITERATURE SURVEY:
In this section summarized some of the important analytical methods for the
determination of mesalamine, Dronedarone HCl, Telmisartan and Hydrochlorothiazide as a
individual component or in combination with another drug substance.
Haney P.W., et. al. (1997)10
Haney P.W., et. al. reported liquid chromatographic method for the analysis of 5-
aminosalicyclic acid and its degradation product. The chromatographic separation was achieved
on a reversed-phase, C8 column with UV detection at 290 nm. This isocratic system was
operated at ambient temperature and required 8 min of chromatographic time. The mobile phase
consisted of methanol-phosphate buffer pH 7.4 (20:80, v/v). The flow-rate was maintained at 1.0
ml/min.
Gotti R., et. al. (2001)11
Gotti R., reported electrokinetic chromatography with an ion-pair reagent for the
determination of 5-aminosalicylic acid related impurities. The optimization of the experimental
conditions was carried out considering some important requirements: resolution, reproducibility,
detection limits of 0.1% (m/m) or less, short total analysis time. Preliminary investigations
employing sodium dodecyl sulfate (SDS) as surfactant did not lead to the necessary resolution of
the studied compounds; the addition of tetrabutyl ammonium bromide (TBAB) to the SDS
micellar system resulted in the complete separation of all the compounds. The effects on the
separation by several parameters such as TBAB concentration, SDS concentration, background
electrolyte pH and concentration, were evaluated. Using a fused-silica capillary (8.5 cm effective
length) complete analysis was obtained in a very short time. Under the optimised final conditions
[120 mM 3-(cyclohexylamino)-2-hydroxy-1-propanesulfonic acid buffer, pH 10.20, 65 mM SDS
in the presence of 55 mM TBAB and 5% methanol] the method was validated for specificity,

Development of UPLC methods for the determination of drug products.
Patil A.T. and Shaikh K.A. 173
precision, linearity, limits of detection and quantitation, and robustness: the 5-ASA related
impurities can be quantified at least at the 0.1% (m/m) level.
Lee J., et. al. (2004)12
Lee J., reported micellar electrokinetic capillary chromatography for the determination of
impurities in the drug 5-aminosalicylic acid. Process impurities found in the drug substance 5-
aminosalicylic acid were determined by micellar electrokinetic capillary chromatography
(MECC). In order to enhance the detection of trace impurities, the parent drug was dissolved to
an unusually high concentration of 5 mg/ml. To reduce the dispersive processes of
electromigration dispersion and anti-stacking, both of which occur at high solute concentration,
the electrolyte pH was adjusted to be close to the apparent isoelectric point (pI) of the
zwitterionic drug. In this fashion, the net charge on the solute should approach zero thereby
minimizing the aforementioned sources of band-broadening. Two additional developments are
reported. Short sodium hydroxide washes were used to optimize the MECC reproducibility. The
elimination of anti-stacking permitted the use of peak heights to quantities low level impurities
with improved precision.
Nobilis M., et. al. (2006)13
Nobilis M., et. al. reported High-performance liquid-chromatographic determination of
5-aminosalicylic acid and its metabolites in blood plasma. Chromatographic analysis were
performed on a 250-4 mm column containing Purospher RP-18 e, 5 microm (Merck, Darmstadt,
Germany) with a precolumn (4-4 mm). The column effluent was monitored using both UV
photodiode-array (lambda = 313 nm) and fluorescence detectors (lambda (exc.) = 300
nm/lambda (emiss.) = 406 nm) in tandem. The identity of individual N-acyl-ASAs in the extracts
from biomatrices was verified by characteristic UV-spectra and by HPLC/MS experiments.
Aparecida J.R., et. al. (2007)14
Aparecida J.R., et. al. reported HPLC, DPPH and Nitrosation methods for Mesalamine
determination in pharmaceutical dosage forms. HPLC with ultraviolet detection at 254 nm was
carried out with a C18 column and a mobile phase constituted of 30 mmol/L monobasic

Development of UPLC methods for the determination of drug products.
Patil A.T. and Shaikh K.A. 174
phosphate buffer (pH 7.0) and methanol (70:30; v/v), with 25% tetrabutylammonium hydrogen
sulphate. The DPPH• method was performed at 517 nm and using 100 mmol/L acetate buffer, pH
5.5, ethanol and 250 µmol/L ethanolic solution of DPPH•. The nitrosation method was
accomplished by using a platinum electrode and standard 0.1 mol/L sodium nitrite as titrant
solution.
Pastorini E., et. al. (2008)15
Pastorini E., et. al. reported HPLC-ESI-MS/MS method for the determination of 5-
aminosalicylic acid and its major metabolite N-acetyl-5-aminosalicylic acid in human
plasma. Plasma samples were analyzed after protein precipitation with methanol and the two
analytes were separated using a C18 column with a mobile phase composed of 17.5 mmol/L
acetic acid (pH 3.3):acetonitrile=85:15 (v/v) at 0.2 mL/min flow rate. 4-ASA and N-Ac-4-ASA
were used as internal standards. Selective detection was performed by tandem mass spectrometry
with electrospray source, operating in negative ionization mode and in multiple reaction
monitoring acquisition (m/z 152-->108 for 5-ASA; m/z 194-->150 and 194-->107 for N-Ac-5-
ASA).
Patel K.M., et. al. (2010)16
Patel K.M., reported spectrophotometric method for the estimation of Mesalamine in
Tablet Dosage Forms. It is based on Diazotization of Mesalamine with nitrous acid, to form
diazotized Mesalamine, followed by its coupling with N-(1-naphthyl) ethylene-diamine
dihydrochloride [Bratton-Marshall reagent] to form a violet colored chromogen with maximum
absorption at 552 nm; it obeyed the Beer’s law in the concentration range of 2 – 30 μg/ml. It is
based on the condensation of Mesalamine with p-dimethylaminobenzaldeyde to form the
Schiff’s base that is a yellow colored chromogen and shows maximum absorbance at 440 nm;
The Beer’s law is obeyed in the concentration range of 50 – 500μg/ml. Mesalamine has a
phenolic group when made to react with Gibb’s reagent , in alkaline pH it forms a colored
chromogen, exhibiting absorption maximum at 494 nm, and Beer’s law is obeyed in the
concentration range of 5 – 60 μg/ml.

Development of UPLC methods for the determination of drug products.
Patil A.T. and Shaikh K.A. 175
Moharana A. K., et. al. (2011)17
Moharana A. K., reported visible spectroscopic method for the determination of
Mesalamine in bulk and pharmaceutical formulation.When the drug reacts with 0.5N HCl and
freshly prepared 0.4% w/v Ferric Nitrate solution the colour changes to brown. It shows
absorption maximum at 432.6 nm and obeys Beer's law in the concentration range 50–150μg
mL−1
. The colouring reagent is stable when checked for its stability test; it is stable for 4 hours.
The absorbance was found to increase linearly with increasing concentration of MSZ, which is
corroborated by the calculated correlation coefficient value of 0.9995 (n=6).
Kanchana M. K., et. al. (2013)18
Kanchana M. K. et. al. reported An open-label, randomized, crossover bioequivalence
study of mesalamine 400 mg tablets in Indian healthy volunteers under fasting conditionsA
validated liquid chromatography/tandem mass spectrometry (LC/MS/MS) method was used for
determination of mesalamine/N-Acetyl mesalamine concentration in human plasma. Equipment
used was a HPLC (1200 Series Agilent Technologies, Germany). MS/MS (ABI-SCIEX,Toronto,
Canada) system. Column type used was a Thermo, HyPURITY C18, 150 x 4.6 mm, 5 µ, and the
mobile phase used was 10mM Ammonium acetate:methanol (85:15 v/v) delivered at the flow
rate of 0.6 mL/min, Injection volume was 10µL, Column temperature was 40°c with a isocretic
elution system.
Gatkal S. H., et. al. (2013)19
Gatkal S. H., et. al. reported a stability indicating assay method of Mesalamine by using
different stress degradation conditions. Solution of mesalamine in distilled water shows
maximum absorbance at 330 nm. Beer’s law was obeyed in the concentration range of 2-16
μg/ml with the slope, intercept, correlation coefficient, detection and quantitation limits were
also calculated.
One more method reported for the spectrophotometric determination of Mesalamine in
pharmaceutical formulation20
. Literatures survey revealed that the mesalamine drug substance is
official in US Pharmacopoeia21
as well as in British Pharmacopoeia22
. Mesalamine extended
Development of UPLC methods for the determination of drug products.
Patil A.T. and Shaikh K.A. 176
release capsules23
and mesalamine delayed-release tablets24
, formulation is also official in US
Pharmacopoeia.
Momani F.A., et. al., (2001)25
Momani F.A., et. al., reported HPLC method for the Determination of
Hydrochlorothiazide and Enalapril Maleate in Tablet Formulations. The mobile phase consists of
3.0 mM Tetrabutyl ammonium hydrogen sulfate in Acetonitrile : water : Triethyl amine
(14:85.6:0.4 V/V) solution, and the pH was adjusted to 4.1 by glacial acetic acid. The mobile
phase was always filtered using 0.45 µ membrane filters and was degassed by vacuum prior to
use. The sample solutions were also filtered using 0.45 µm membrane filters. The flow rate was 2
mL/min. The wavelength was 220nm.
Hertzog D.L., et. al., (2002)26
Hertzog D.L., et. al. reported HPLC method for the simultaneous determination of
losartan potassium, hydrochlorothiazide, and their degradation products, The analytical columns
used to achieve chromatographic separation were Symmetry C8 columns (150×3.9 mm I.D., 5
μm particle size) . The mobile phase for both the Losartan tablets and the Losartan/HCTZ tablets
methods was made by first preparing a phosphate buffer solution of KH2PO4 and Na2HPO4 (pH
7.0, 0.02 M). This buffer solution was then mixed with acetonitrile in ratios of 85:15 (v/v) and
93:7 (v/v) buffer–acetonitrile to yield Mobile Phase A for Losartan tablets and Losartan/HCTZ
tablets, respectively. Mobile Phase B is 100% acetonitrile for both methods. Mobile phases for
pH robustness studies involved pH adjustment of the 0.02 M phosphate buffer with NaOH or
H3PO4 prior to mixing with acetonitrile.
Torrealday N., et. al., (2003)27
Torrealday N., et. al., reported a HPLC-fluorimetric method for the quantitation of the
angiotensin II receptor antagonist telmisartan in urine, A
high performance liquid chromatographic method with fluorimetric detection has been developed
for the quantitation of the angiotensin II receptor antagonist (ARA II) 4-((2-n-propyl-4-methyl-6-
(1-methylbenzimidazol-2-yl)-benzimidazol-1-yl)methyl)biphenyl-2-carboxylic acid (telmisartan)

Development of UPLC methods for the determination of drug products.
Patil A.T. and Shaikh K.A. 177
in urine, using a Novapak C18 column 3.9 x 150 mm, 4 microm. The mobile phase consisted of a
mixture acetonitrile-phosphate buffer (pH 6.0, 5 mM) (45:55, v/v) pumped at a flow rate of 0.5
ml/. Effluent was monitored at excitation and emission wavelengths of 305 and 365 nm,
respectively. Separation was carried out at room temperature.
Patel L. J., et. al. (2006)28
Patel L. J., et. al. reported HPLC method for the Simultaneous estimation of Bisoprolol
fumarate and Hydrochlorothiazide in tablet dosage form. A Chromatographic conditions
consists of Lichrospher 100 C-18, 5 µm column 20 cm × 4.6 mm in isocratic mode, with mobile
phase containing water, acetonitrile and tetrahydrofuran in proportion of 80:20:5 v/v/v were
used. The flow rate was 1 ml/min, and effluent was monitored at 225 nm. The retention time of
Bisoprolol fumarate and Hydrochlorothiazide were 1.48 ± 0.02 and 4.72 ± 0.03 min respectively,
and the resolution factor was 9.0.
Wankhede S.B., et. al. (2007)29
Wankhede S.B., et. al. reported HPLC method for simultaneous estimation of
Telmisartan and Hydrochlorothiazide in tablet dosage form. Chromatography was performed on
a ODS Hypersil C18 (25 cm×4.6 mm I.D) column from thermo in isocratic mode with mobile
phase containing acetonitrile:0.05 M KH2PO4 pH 3.0 (60:40). The flow rate was 1.0 ml/min and
the eluent was monitored at 271 nm. The selected chromatographic conditions were found to
effectively separate telmisartan (RT- 5.19 min) and hydrochlorothiazide (RT- 2.97 min).
Yan T., et. al. (2008)30
Yan T., et. al. reported Liquid chromatographic-tandem mass spectrometric method for the
simultaneous quantitation of Telmisartan and Hydrochlorothiazide in human plasma. Sample
preparation involved liquid-liquid extraction with diethyl ether-dichloromethane (60:40, v/v).
The analytes and internal standard, probenecid, were separated on a Venusil XBP-C(8) column
using gradient elution with acetonitrile-10 mM ammonium acetate-formic acid at a flow rate of
1.2 mL/min. Detection was by electrospray negative ionization mass spectrometry using multiple

Development of UPLC methods for the determination of drug products.
Patil A.T. and Shaikh K.A. 178
reaction monitoring of the transitions at m/z 513.0-->469.4 for telmisartan, m/z 295.9-->268.9
for hydrochlorothiazide and m/z 283.9-->239.9 for probenecid.
Kurade V.P., et. al., (2009)31
Kurade V.P., et. al., reported RP-HPLC method for estimation of Ramipril and
Telmisartan in tablets, A Genesis C18 column having dimensions of 4.6×250 mm and particle
size of 5 µm in isocratic mode, with mobile phase containing a mixture of 0.01 M potassium
dihydrogen phosphate buffer (adjusted to pH 3.4 using orthophosphoric acid): methanol :
acetonitrile (15:15:70 v/v/v) was used. The mobile phase was pumped at a flow rate of 1.0
ml/min and the eluents were monitored at 210 nm. The selected chromatographic conditions
were found to effectively separate Ramipril (R t : 3.68 min) and Telmisartan (R t : 4.98 min)
having a resolution of 3.84.
Vijayamirtharaj R., et.al. (2010)32
Vijayamirtharaj R., et. al. reported RP-HPLC method for the simultaneous estimation of
Telmisartan and Atorvastatin calcium in tablet dosage forms. Chromatographic conditions
consisted of mobile phase Acetonitrile: Buffer (0.01M Potassium dihydrogen phosphate) 65:35
PH 4.00 (adjusted with Orthophosphoric acid) and the wavelength selected was 250nm. The flow
rate was kept at 2.0 ml/min, and the injection volume was 10μl. The sepration was performed at
ambient temperature. Retention time of Telmisartan and Atorvastatin calcium was found to be
3.72 and 6.14 minutes respectively.
Gangola R., et. al. (2011)33
Gangola R., reported Spectrophotometric method for the Simultaneous Determination of
Hydrochlorothiazide and Telmisartan in Combined Dosage Form. This method is based on the
principle that absorbance difference between two points on mixture spectra is directly
proportional to concentration of component of interest and independent of interfering
component. Set of two wavelengths λ1 (258nm) and λ2 (299nm) for estimation of
Hydrochlorothiazide and λ3 (316nm) and λ4 (326nm) for estimation of Telmisartan were
selected on above principle and overline spectra. Determined absorbance difference (A1-A2) and
Development of UPLC methods for the determination of drug products.
Patil A.T. and Shaikh K.A. 179
(A3-A4) values and plotted calibration curves between absorbance difference values and
concentration of drug.
Patel A., et. al. (2012)34
Patel A., et. al. reported RP-HPLC method development and validation of Dronedarone
HCl in its Pure form and tablet dosage form. The method was carried out using Hypersil ODS
3V 250×4.6 mm, 5µm column with mobile phase comprised of Buffer: Acetonitrile (42:58%v/v).
Buffer use is Potassium dihydrogen phosphate buffer with pH 3.0. The flow rate was set at 1.1
ml/min and effluent was detected at 220nm. The retention time of Dronedarone was found to be
4 minute.
Landge S. B., et. al., (2013)35
Landge S. B., reported Stability Indicating RP-HPLC Method for the Determination of
Dronedarone Hydrochloride and Its Potential Process-Related Impurities in Bulk Drug and
Pharmaceutical Dosage form. A Waters HPLC (Milford, MA, USA) equipped with Al- liance
2695 separations module and 2996 photodiode ar- ray detector was used for method
development, forced degradation studies, and method validation. The column Ascentis® Express
C18, 10 cm × 4.6 mm, 2.7 μm (SUP- ELCO Analytical, USA), thermostated at 35°C was used
for the analysis/study. The mobile phase-A consisting a mixture of buffer (0.05M Ammonium
dihydrogen ortho- phosphate) and methanol in the ratio of 80:20 v/v and mobile phase-B
consisting a mixture of acetonitrile, me- thanol and water in the ratio of 45:45:10 v/v. The flow
rate and injection volumes were 1.2 mL·min–1 and 10 μl respectively. The analysis was carried
out under gradient conditions as follows, time (min)/A (v/v): B (v/v); T0.01/ 65:35, T7.0/45:55,
T17.0/45:55, T24.0/30:70, T28.0/30:70, T29.0/65:35, T35.0/65:35. The photodiode array detector
was used in the scan mode from 200 nm to 400 nm.
Other than above mentioned methods few more methods are also reported for the
quantification of Dronedarone in pharmaceutical formulation by HPLC36-37
and HPTLC38
.
Spectrophotometric methods39-40
and HPLC methods41-44
are reported for the quantification of
Telmisartan and Hydrochlorothiazide in tablet dosage form. HPLC methods45-47
for Simultaneous
estimation of Telmisartan in combination with another drug substance are also reported. Few

Development of UPLC methods for the determination of drug products.
Patil A.T. and Shaikh K.A. 180
HPLC methods 48-50
are reported for the simultaneous estimation of Hydrochlorothiazide in
combination with another drug substance. Quantification of related substances of Telmisartan
and Hydrochlorthizide in tablet dosage form by HPLC method51
is reported.
5.3 STABILITY-INDICATING UPLC METHOD FOR THE DETERMINATION OF
MESALAMINE RELATED IMPURITIES IN TABLET DOSAGE FORM.
The aim of the present work was to develop and validate a simple, precise, accurate,
short runtime and specific method for the quantification and separation of process related
impurities/degradation product by reversed-phase UPLC method, in mesalamine tablet
formulation. Chromatographic separation has been achieved on an UPLC CSH C18 150 mm x
2.1 mm, 1.7 µm column. Mobile phase consisting solvent A 0.05 molar (M) dipotassium
hydrogen phosphate and 0.5% octane sulphonic acid (pH 2.0 buffer). Solvent B 0.05 molar (M)
dipotassium hydrogen phosphate and 0.5% octane sulphonic acid (pH 5.5 buffer) : methanol :
acetonitrile in the ratio of 900:80:20 v/v. delivered at flow rate of 0.15 mL min−1
and the
detection wavelength 230 nm. Forced degradation studies carried for mesalamine drug product to
demonstrate the stability-indicating power of the UPLC method. The drug product was subjected
oxidative, acid, base hydrolysis, thermal and photolytic stress conditions. Mesalamine was found
to degrade significantly in base hydrolysis and Peroxide stress conditions compare to acid
hydrolysis, thermal and photolytic degradation conditions. The degradation products were well
resolved from main peak and its impurities, mass balance is more than 99%, thus proved the
stability indicating power of the method. The developed method was validated as per ICH
guidelines with respect to specificity, linearity, limit of detection, limit of quantification,
accuracy, precision and robustness.
5.3.1 DRUG PROFILE:
5.3.1.1 Mesalamine
1. Chemical Name: 5-amino-2-hydroxybenzoic acid
2. Chemical Structure:

Development of UPLC methods for the determination of drug products.
Patil A.T. and Shaikh K.A. 181
3. Molecular Formula: C7H7NO3
4. Molecular Weight: 153.14
5. Description: White colored powder
6. Solubility: Mesalamine is listed as soluble in HCl, slightlysoluble in cold water and alcohol,
and more soluble in hot water.
7. Melting Point: 283°C
8. Category: Anti inflammatory agent
5.3.1.2 Mesalamine related impurities:
Impurity A :- Sulfanilic acid Impurity B:- 3-Amino benzoic acid
Impruity C:- 3-Amino salicylic acid Impruity D: - 2,5-dihydroxy benzoic acid

Development of UPLC methods for the determination of drug products.
Patil A.T. and Shaikh K.A. 182
Impruity E: - 3-Amino phenol Impurity F: - Salicylic acid
5.3.2 EXPERIMENTAL:
5.3.2.1 Working standards:
The working standard was procured from India market having following batch number
and potency.
Working Standard Batch Number Potency (on as is basis)
Mesalamine ME004321 99.4 % w/w
5.3.2.2 Sample:
The Samples was procured from Indian Market. The test sample bears following details,
Manufacturer Sun Pharmaceuticals Ltd
Product Name Mesacol
Label Claim 800 mg and 400 mg
5.3.2.3 Instrument / Apparatus Used:
i) All the glassware used for the experiment were certified ‘A’ grade manufactured by
SCHOTT Glass India Pvt. Ltd. Mumbai, India
ii) A calibrated UPLC Waters ACQUITY UPLC series comprised of degasser, quaternary
pump, auto injector, column compartment, PDA detector.
iii) Sanyo, Leicestershire, UK, Photo stability chamber.
iv) dry air oven Cintex, Mumbai, India.
v) A calibrated digital pH meter, manufactured by Mettler-Toledo Inc, Columbus, OH.
Private Limited Mumbai, India.
vi) A calibrated analytical balance, manufactured by Sartorius, Germany.
vii) A sonicator, manufactured by Amrut Enterprises, Pune, India.

Development of UPLC methods for the determination of drug products.
Patil A.T. and Shaikh K.A. 183
5.3.2.4 Reagents and chemicals:
All reagents and chemicals were used from Merck chemicals. Octane sulphonic acid,
Hydrochloric acid and Dipotassium hydrogen phosphate were used as GR grade. Acetonitrile
and Water were used as HPLC grade. 0.1N Hydrochloric acid were used as diluent.
5.3.2.5 Preparation of standard solutions
A stock solution of mesalamine (500 μg mL−1
) was prepared by dissolving an appropriate
amount in diluent. Standard solutions containing 5 μg mL−1
were prepared from this stock
solution.
5.3.2.6 Preparation of sample solution
Tablet powder equivalent to 50 mg drug was dissolved in diluent with rotary shaking for
10 min and sonication for 10 min to give a solution containing 500 μg mL−1
. This solution was
filtered through a 0.45 μm pore size Nylon 66 membrane filter. Typical chromatogram of sample
solution spiked with impurities is as shown in figure 5.1.
Fig.5.1: Typical chromatogram of sample solution spiked with impurities.

Development of UPLC methods for the determination of drug products.
Patil A.T. and Shaikh K.A. 184
5.3.2.7 Chromatographic conditions:
mobile phase A: 0.05 molar (M) dipotassium hydrogen phosphate and 0.5% octane
sulphonic acid (pH 2.0 buffer).
mobile phase B: 0.05 molar (M) dipotassium hydrogen phosphate and 0.5% octane
sulphonic acid (pH 5.5 buffer) : methanol : acetonitrile in the ratio
of 900:80:20 v/v.
Column: UPLC CSH C18 150 mm x 2.1 mm, 1.7 µm.
Column oven temperature: 30°C
Flow: 0.15 mL min−1
Wavelength: 230 nm
Injection volume: 2 µL
Runtime: 36 minutes.
Mobile phase gradient: Table 1.
Mobile phase gradient program :
Time (min) Flow (mL min-1
) Mobile phase A (%) Mobile phase B (%)
0 1.2 100 0
9 1.2 100 0
15 1.2 85 15
27 1.2 80 20
30 1.2 25 75
31 1.2 100 0
36 1.2 100 0
5.3.2.8 Procedure:
HPLC system was set up as described under chromatographic conditions. Standard and
sample solution was prepared according to 4.3.5 and made single injection of each of solvent
mixture as a blank, standard solution (six injections), placebo solution and sample solution in to
the chromatographic system. Recorded the chromatograms at 230 nm and measure the peak area
counts for all eluting peaks. Examined the blank and placebo chromatogram for any extraneous
peaks and disregard corresponding peaks observed in the chromatogram of the sample solution.
Development of UPLC methods for the determination of drug products.
Patil A.T. and Shaikh K.A. 185
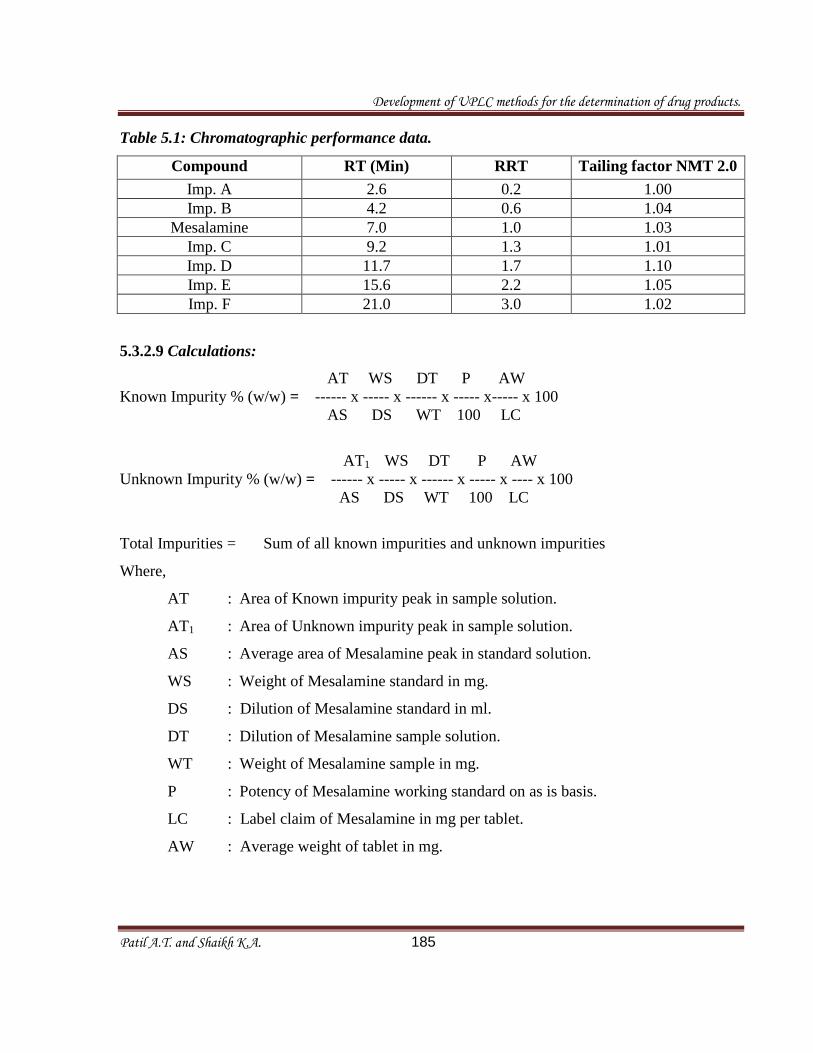
Table 5.1: Chromatographic performance data.
Compound RT (Min) RRT
Tailing factor NMT 2.0
Imp. A 2.6 0.2 1.00
Imp. B 4.2 0.6 1.04
Mesalamine 7.0 1.0 1.03
Imp. C 9.2 1.3 1.01
Imp. D 11.7 1.7 1.10
Imp. E 15.6 2.2 1.05
Imp. F 21.0 3.0 1.02
5.3.2.9 Calculations:
AT WS DT P AW
Known Impurity % (w/w) = ------ x ----- x ------ x ----- x----- x 100
AS DS WT 100 LC
AT1 WS DT P AW
Unknown Impurity % (w/w) = ------ x ----- x ------ x ----- x ---- x 100
AS DS WT 100 LC
Total Impurities = Sum of all known impurities and unknown impurities
Where,
AT : Area of Known impurity peak in sample solution.
AT1 : Area of Unknown impurity peak in sample solution.
AS : Average area of Mesalamine peak in standard solution.
WS : Weight of Mesalamine standard in mg.
DS : Dilution of Mesalamine standard in ml.
DT : Dilution of Mesalamine sample solution.
WT : Weight of Mesalamine sample in mg.
P : Potency of Mesalamine working standard on as is basis.
LC : Label claim of Mesalamine in mg per tablet.
AW : Average weight of tablet in mg.

Development of UPLC methods for the determination of drug products.
Patil A.T. and Shaikh K.A. 186
5.3.3 RESULTS AND DISCUSSION:
The main objective of development of RP-UPLC method was separation of Mesalamine
related impurities in tablet dosage form. As the method should be able to determine all
impurities of the drug product in single run with the good amount of resolution. Method should
be accurate, reproducible, robust, stability indicating, free from interference (blank/placebo/
other unknown degradation product) and straight forward enough for routine use in quality
control laboratory52-55
. Initial method development was started with Isocratic mobile
phase. Different combination of buffer : acetonitrile in the range of 90:10 to 10: 90 v/v has been
tried, it has been observed that Sulfanlic acid impurity is most polar in nature. Increase in organic
concentration more than 5% in the buffer (95:5 buffer:acetonitrile) leads elution of sulfanlic acid
impurity in the void volume. So Switch to gradient mobile phase where Solvent A contains 0.05
molar (M) dipotassium hydrogen phosphate and 0.5% octane sulphonic acid (pH 2.0 buffer) and
Solvent B 0.05 molar (M) dipotassium hydrogen phosphate and 0.5% octane sulphonic acid (pH
5.5 buffer) : methanol : acetonitrile in the ratio of 900:80:20 v/v. Different gradient programs has
been tried to improves the run time less than 60 minutes with good retention of Sulfanlic acid on
the column. During the optimization of chromatographic condition, Solvent A contains 0.05
molar (M) dipotassium hydrogen phosphate and 0.5% octane sulphonic acid (pH 2.0 buffer).
Solvent B 0.05 molar (M) dipotassium hydrogen phosphate and 0.5% octane sulphonic acid (pH
5.5 buffer) : methanol : acetonitrile in the ratio of 900:80:20 v/v. UPLC gradient program was set
as time (min) / % solvent B: 0/0, 9/0, 15/15, 27/20, 30/75, 31/0 and 36/0. The column
temperature was maintained at 30 ºC and the detection was monitored at a wavelength 230 nm.
Flow rate of mobile phase was 0.15 mL min−1
.
5.3.3.1 Validation of method:
The optimized chromatographic conditions was validated by evaluating specificity,
linearity, precision, accuracy, limit of detection (LOD), limit of quantification (LOQ),
robustness and system suitability, in accordance with ICH guidelines Q2 (R1)56-58.
Development of UPLC methods for the determination of drug products.
Patil A.T. and Shaikh K.A. 187
5.3.3.1.1 Specificity:
The specificity of a method is its suitability for analysis of a substance in the presence of
potential impurities. Stress testing of a drug substance can help to identify likely degradation
products, which can helps to establish degradation pathways and the intrinsic stability of the
molecule. It can also be used to validate the stability-indicating power of the analytical
procedures used. The specificity of the LC method for Mesalamine has been determined in the
presence of six impurities.
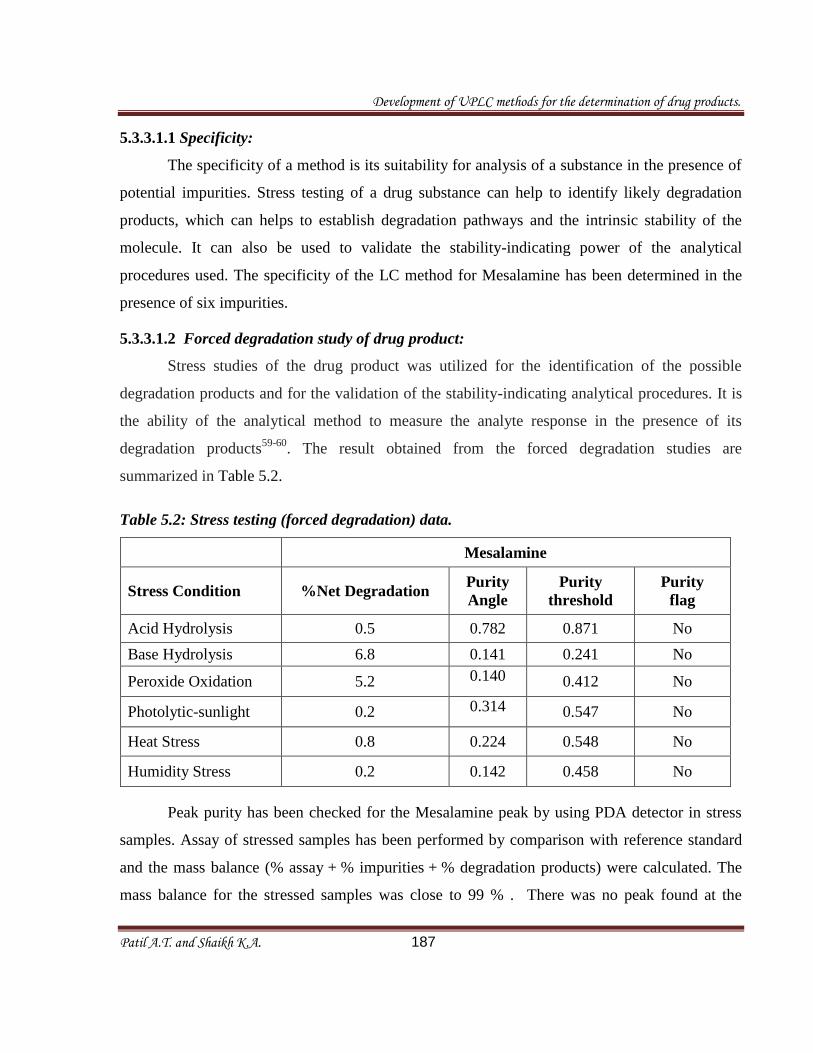
5.3.3.1.2 Forced degradation study of drug product:
Stress studies of the drug product was utilized for the identification of the possible
degradation products and for the validation of the stability-indicating analytical procedures. It is
the ability of the analytical method to measure the analyte response in the presence of its
degradation products59-60
. The result obtained from the forced degradation studies are
summarized in Table 5.2.
Table 5.2: Stress testing (forced degradation) data.
Mesalamine
Stress Condition %Net Degradation Purity
Angle
Purity
threshold
Purity
flag
Acid Hydrolysis 0.5 0.782 0.871 No
Base Hydrolysis 6.8 0.141 0.241 No
Peroxide Oxidation 5.2 0.140
0.412 No
Photolytic-sunlight 0.2 0.314
0.547 No
Heat Stress 0.8 0.224 0.548 No
Humidity Stress 0.2 0.142 0.458 No
Peak purity has been checked for the Mesalamine peak by using PDA detector in stress
samples. Assay of stressed samples has been performed by comparison with reference standard
and the mass balance (% assay + % impurities + % degradation products) were calculated. The
mass balance for the stressed samples was close to 99 % . There was no peak found at the

Development of UPLC methods for the determination of drug products.
Patil A.T. and Shaikh K.A. 188
retention time of mesalamine and its all six impurities in blank and placebo blend
chromatograms proves no interference from blank and placebo. During the forced degradation
study, the peak of mesalamine and all known impurities was found to be pure and no
considerable degradation of drug product was observed in acidic, thermal, and photolytic
conditions and considerable degradation observed in basic and oxidative stress conditions. The
chromatograms were checked for the appearance of any extra or overlapping peaks. The purity
of the principle and other chromatographic peaks was found to be satisfactory. This study
confirmed the stability indicating power of the UPLC method. (Figure: 5.2, 5.3, 5.4).
Fig. 5.2: Typical chromatogram of acid stressed sample solution.

Development of UPLC methods for the determination of drug products.
Patil A.T. and Shaikh K.A. 189
Fig. 5.3: Typical chromatogram of base stressed sample solution.
Fig. 5.4. Typical chromatogram of peroxide stressed sample solution.
5.3.3.1.3 Limits of detection and quantification:
The LOD and LOQ was determined at a signal to noise ratio of 3:1 and 10:1 respectively,
by injecting a series of dilute test solutions of known concentrations. Precision study was also
carried out at the LOQ level by injecting six preparations and calculating the percentage of
R.S.D of the area as shown in Table 5.3.
5.3.3.1.4 Linearity:
Solutions for testing the linearity of the related substances were prepared by diluting the
impurity stock solution to six different concentrations from the LOQ to 150% of the permitted
maximum level of the impurity (i.e. the LOQ to 0.6% for Mesalamine and all impurities for an

Development of UPLC methods for the determination of drug products.
Patil A.T. and Shaikh K.A. 190
analyte concentration of 500 μg mL−1). The correlation coefficients, slopes, and y-intercepts of
the calibration plots are reported. Calibration plots for the six related substances were linear over
the ranges tested. The correlation coefficients was >0.999 for all of the components (Table 3).
These results show that there was an excellent correlation between the peak area and
concentration for the six impurities.
5.3.3.1.5 Precision:
The precision of the method was verified by repeatability and intermediate precision.
Repeatability was checked by injecting six individual preparations of the real sample of
Mesalamine spiked with 0.30% of its six impurities. The intermediate precision of the method
was also evaluated using a different analyst and a different instrument, and performing the
analysis on different day. %RSD of area for each impurity was calculated for both precision as
well as intermediate precision, and was found to be within 2%. These results confirmed the
precision and ruggedness of the method as shown in Table 5.3.
Table 5.3: Regression and precision data.
Compound LOQ
µg/ml
LOD
µg/ml
Regression equation
(y) Correlation
coefficient
Precision
(% RSD) Precision
LOQ
(% RSD) Slope (b) Intercept
(a) Intra
day
Inter
day
Mesalamine 0.20 0.07 24781 +1471 0.9998 0.54 0.32 0.42
Imp. A 0.23 0.08 21456 +1025 0.9997 0.25 0.35 0.32
Imp. B 0.17 0.05 39124 +1054 0.9999 0.36 0.78 0.59
Imp. C 0.19 0.06 32154 -953 0.9996 0.41 0.46 0.34
Imp. D 0.15 0.05 50124 +1247 0.9997 0.41 0.35 0.26
Imp. E 0.17 0.08 41021 -597 0.9998 0.45 0.39 0.65
Imp. F 0.21 0.07 21756 +998 0.9996 0.23 0.52 0.34

Development of UPLC methods for the determination of drug products.
Patil A.T. and Shaikh K.A. 191
5.3.3.1.6 Accuracy:
For the impurities, recovery was determined in triplicate for LOQ, 0.15, 0.30, and 0.45%
of the analyte concentration (500 μg mL−1) for Mesalamine, and then recovery of the impurities
was also calculated as shown in Table 5.4.
Table 5.4. Evaluation of accuracy.
Amount spiked LOQ 50% 100% 150%
Mesalamine 98.1 ± 0.52 100.1 ± 0.41 99.9 ± 0.58 100.1 ± 0.14
Imp. A 99.1 ± 0.45 99.2 ± 0.52 97.5 ± 0.64 98.9 ± 0.28
Imp. B 99.5 ± 0.74 99.6 ± 0.71 98.8 ± 0.28 98.9 ± 0.14
Imp. C 97.5 ± 0.46 99.0 ± 0.84 100.1 ± 0.45 98.1 ± 0.58
Imp. D 97.9 ± 0.85 99.7 ± 0.54 99.9 ± 0.12 99.5 ± 0.18
Imp. E 98.9 ± 0.74 100.5 ± 0.54 98.2 ± 0.58 98.8 ± 0.38
Imp. F 99.9 ± 0.63 99.4 ± 0.68 98.6 ± 0.88 98.7 ± 0.28
5.3.3.1.7 Robustness:
The purpose of robustness test is to check whether the chromatographic performance is
affected by small delibrate changes in operating conditions. In order to study the effect of flow
rate on resolution, it was changed to 0.12 and 0.17 mL min−1. The effect of pH was studied at
pH 1.8 and 2.2 for solvent A and pH 5.8 and 6.2 for solvent B. The effect of column temperature
was studied at 25 and 35 °C. In all of these experiments the mobile phase components were not
changed. The effect of the percent organic strength on resolution was studied by varying
acetonitrile by −10% to +10%, while other mobile phase components were held constant. In all
of the deliberately varied chromatographic conditions, the selectivity as well as the performance
of the method were unchanged, which proves the robustness of the method.
5.3.3.1.8 Stability in solution and in the mobile phase:
The solution stability of Mesalamine test preparation and standard preparation was
carried out upto 48 hrs at room temperature. The chromatograms of these solutions were

Development of UPLC methods for the determination of drug products.
Patil A.T. and Shaikh K.A. 192
recorded separately with an interval of 1 h up to 24 h and the peak responses was compared. It
has been observed that the standard and test solution of mesalamine is stable upto 24 hrs at room
temperature. The mobile phase stability was carried out by analyzing the freshly prepared test
sample and standard preparation. The same mobile phase was used throughout the experiment. A
system suitability parameters for all results were compared and it has been observed that the
mobile phase is stable upto 48 hrs.
5.3.4. CONCLUSION:
A gradient RP-UPLC method was successfully developed for the estimation of
mesalamine related impurities in pharmaceutical dosage form. Method is precise, accurate,
linear, robust, rugged, and specific. A satisfactory result was obtained from validation of the
method. Exposure of mesalamine drug product to stress conditions indicates that the drug is
susceptible to acid, base hydrolysis; oxidation, photolysis and heat degradation with maximum
degradation observed in base and oxidative conditions. A stability-indicating method was
developed, which separates all the degradation products formed under variety of conditions.
5.4. VALIDATED UPLC METHODS FOR IN VITRO DISSOLUTION STUDIES OF
TWO DIFFERENT ANTIHYPERTENSIVE FORMULATIONS IN TABLET DOSAGE
FORM.
For in vitro dissolution study of any drug product, numbers of analyzed samples are large
in number, So there is need of lesser run time method for the analysis of these samples. To the
best of our knowledge reported analytical methods in the literature survey are having run time
more than five minutes. So to overcome this problem UPLC method is best choice for reducing
the run time and increase the output of analysis. Literature survey also reveals that there is no
one UPLC method is reported for in vitro dissolution study of these two formulations. The
present work describes analytical parameters aimed to achieve an alternative for the
quantification of Dronedarone HCl tablet formulation and Telmisartan and hydrochlorothiazide
tablet formulation by UPLC method with shorter run time i.e. 1 minutes and 3 minutes
respectively for in vitro dissolution study in tablet dosage form.

Development of UPLC methods for the determination of drug products.
Patil A.T. and Shaikh K.A. 193
A simple, rapid, and robust RP-UPLC methods has been developed and validated for
Dronedarone HCl tablet and Telmisartan and Hydrochlorothiazide tablet as two different
formulations at 290nm and 265nm wavelength respectively, in order to assess in vitro drug
release profile of drug product. Acquity UPLC BEH C18 50 x 2.1mm, 1.7µm column is used for
both the formulation. Purified water adjusted pH 2.5 with orthophospheric acid is used as
solution A and acetonitrile is used as solution B. For Dronedarone HCl tablets 45:55 v/v
solution A and solution B is used as mobile phase, where as for Telmisartan and
Hydrochlorothiazide tablets mobile phase gradient program was set as time (min) / % solution B:
0/10, 1/10, 2.0/90, 2.5/10 and 3.0/10. The flow rate was 0.5 mL min−1
, The column temperature
was maintained at 40 ºC. The UPLC method and dissolution test condition were validated to
meet requirement of ICH guideline and this validation inferred from specificity, precision,
accuracy, linearity and robustness. In addition filter suitability, standard and sample solution
stability was demonstrated. All results were acceptable and this confirmed that the method is
suitable for its intended use in routine in vitro dissolution study of drug products.
5.4.1. DRUG PROFILE:
5.4.1.1 Dronedarone HCl:
1. Chemical Name:
N-{2-butyl-3-[4-(3-dibutylaminopropoxy)benzoyl]benzofuran-5-yl}methanesulfonamide,
hydrochloride
2. Chemical Structure:

Development of UPLC methods for the determination of drug products.
Patil A.T. and Shaikh K.A. 194
3. Molecular formula: C31H44N2O5S
4. Molecular Weight: 556.76
5. Description : white fine powder
6. Solubility: Practically insoluble in water and freely soluble in methylene chloride and
methanol.
7. Melting Point: 141.2 °C
8. Category : Cardiac arrhythmias
5.4.1.2 Telmisartan:
1. Chemical Name : 4’-[(1, 4’- Dimethyl-2’-propyl-[2, 6’-bi-1H-benzimidazol]-1’-yl) methyl]-
[1, 1’-biphenyl]-2-carboxylic acid
2. Chemical Structure:
3. Molecular Formula: C33H30N4O2
4. Molecular Weight: 514.63
5. Description: Fine , white powder
6. Solubility: Freely soluble in methylene chloride and methanol, insoluble in water.
7. Melting Point: 261.263 °C
8. Category: Hypertension

Development of UPLC methods for the determination of drug products.
Patil A.T. and Shaikh K.A. 195
5.4.1.3 Hydrochlorothiazide:
1. Chemical Name: 6-Chloro-3, 4-dihydro-2H-1, 2, 4-benzothiazidin-7-sulfonamide-1,1-dioxide
2. Chemical Structure:
3. Molecular Formula: C7H8ClN3O4S2
4. Molecular Weight: 297.74
5. Description: White crystalline powder
6. Solubility: Slightly soluble in water, freely soluble in sodium hydroxide solution,
in n-butylamine and in dimethylformamide.
7. Melting Point: 274 °C
8. Category: Hypertension
5.4.2. EXPERIMENTAL:
5.4.2.1 Working standards:
The working standard was procured from India market having following batch number
and potency.
Working Standard Batch Number % Potency (on as is basis)
Dronedarone HCl DR00258 99.2
Telmisartan HCl TL00132 99.5
Hydrochlorothiazide HZ00132 99.1

Development of UPLC methods for the determination of drug products.
Patil A.T. and Shaikh K.A. 196
5.4.2.2 Sample:
The sample was procured from India market. The test sample bears following details.
Sample details Dronedarone HCl tablet
Manufacturer Emcure pharmaceuticals Ltd.
Product Name Dilsave
Label Claim 400 mg
Sample details Telmisartan and Hydrochlorothiazide tablet
Manufacturer Dr. Reddys Ltd.
Product Name Telsartan H
Label Claim 40mg/12.5 mg, 80 mg /12.5 mg,
5.4.2.3 Instrument / Apparatus Used:
I) All the glassware used for the experiment were certified ‘A’ grade manufactured by
SCHOTT Glass India Pvt. Ltd. Mumbai, India
II) waters Acquity series comprised of degasser, quaternary pump, auto injector, column
compartment,
III) A calibrated digital pH meter, manufactured by Mettler-Toledo Inc, Columbus, OH.
Private Limited Mumbai, India.
IV) A calibrated analytical balance, manufactured by Sartorius, Germany.
V) A sonicator, manufactured by Amrut Enterprises, Pune, India.
VI) A vacuum oven manufactured by Quality instruments and equipments, Mumbai, India.
5.4.2.4 Reagents and Chemicals:
All reagents and chemicals were used from Merck chemicals. Orthophospheric acid were
used as GR grade. Acetonitrile and Water were used as HPLC grade.
5.4.2.5 Solution.preparation:
A stock solution of Dronedarone HCl (1000 μg mL−1
) was prepared by dissolving an
appropriate amount of working standard in solvent mixture. Standard solutions containing
400 μg mL−1
were prepared from this stock solution in dissolution medium. Two different stock

Development of UPLC methods for the determination of drug products.
Patil A.T. and Shaikh K.A. 197
solution of Telmisartan (880 μg mL−1
) and Hydrochlorothiazide (250 μg mL−1
) was prepared by
dissolving an appropriate amount of working standard in methanol. One Standard solution
containing Telmisartan (44 μg mL−1
) and Hydrochlorothiazide (12.5 μg mL−1
) as prepared from
the stock solution in dissolution medium. Another Standard solutions containing Telmisartan
(88 μg mL−1
) and Hydrochlorothiazide (12.5 μg mL−1
was prepared from stock solution in
dissolution medium. UPLC chromatogram of Dronedardone tablet is as shown in figure 5.5,
where as Telmisartan and Hydrochlorothiazide tablet is as shown in figure 5.6.
Fig. 5.5: Typical UPLC chromatogram of Dronedarone sample solution.
Fig.5.6: Chromatogram of Telmisartan and Hydrochlorothiazide sample solution.

Development of UPLC methods for the determination of drug products.
Patil A.T. and Shaikh K.A. 198
5.4.2.6 Chromatographic conditions for UPLC method:
Chromatographic parameters for in vitro dissolution study of Dronedarone tablets was
chromatographic column used was an Acquity UPLC BEH C18 50 x 2.1mm, 1.7µm. The flow
rate was 0.5 mL min−1
and column temperature was maintained at 40 ºC. Mobile phase consists
of Solution A as purified water adjusted pH 2.5 with Orthophospheric acid and Solution B is
Acetonitrile. The detection was monitored at a wavelength of 290 nm. The injection volume was
0.50 µL. A mixture of water and acetonitrile in the proportion of 50:50 (v/v) used as a solvent or
diluent. Similary Chromatographic parameters for in vitro dissolution study of Telmisartan and
Hydrochlorothiazide tablets was chromatographic column Acquity UPLC BEH C18 50 x 2.1mm,
1.7µm. The flow rate was 0.5 mL min−1
and column temperature was maintained at 40 ºC.
Mobile phase consists of Solution A as purified water adjusted pH 2.5 with Orthophospheric acid
and Solution B is acetonitrile the detection was monitored at a wavelength 265 nm. The
injection volume was 0.50 µL.
5.4.2.7 Procedure:
UPLC system was set up as described under chromatographic conditions. Standard and
sample solution was prepared according to 4.3.5 and made single injection of each of solvent
mixture as a blank, standard solution (six injections), placebo solution and sample solution in to
the chromatographic system.
- Recorded the chromatograms at 265 nm and measure the peak area counts for all eluting
peaks.
- Examined the blank and placebo chromatogram for any extraneous peaks and disregard
corresponding peaks observed in the chromatogram of the sample solution.
5.4.2.8 Calculations:
A) Calculation for Dronedarone HCl:
AT WS DT P 100
% Drug Release of Dronedarone HCl = ------ x ----- x ------ x ----- x -----
AS DS 1 100 LC

Development of UPLC methods for the determination of drug products.
Patil A.T. and Shaikh K.A. 199
Where,
AT : Area of Dronedarone peak in sample solution.
AS : Average area of Dronedarone peak in standard solution.
WS : Weight Dronedarone standard in mg.
DS : Dilution of Dronedarone standard in ml.
DT : Dilution of Dronedarone sample solution.
P : Potency of Dronedarone HCl working standard on as is basis.
LC : Label claim of Dronedarone in mg per tablet.
B) Calculation for Telmisartan :
ATT WST DTT PT 100
% Drug Release of Telmisartan = ------ x ----- x ------ x ----- x------
AST DST 1 100 LCT
Where,
ATT : Area of Telmisartan peak in sample solution.
AST : Average area of Telmisartan peak in standard solution.
WST : Weight Telmisartan standard in mg.
DST : Dilution of Telmisartan standard in ml.
DTT : Dilution of Telmisartan sample solution.
PT : Potency of Telmisartan HCl working standard on as is basis.
LCT : Label claim of Telmisartan in mg per tablet.
C) Calculation for Hydrochlorthiazide:
ATH WSH DTH PH 100
% Drug Release of Hydrochlorthiazide = ------ x ----- x ------ x ----- x-------
ASH DSH 1 100 LCH
Where,
ATH : Area of Hydrochlorthiazide peak in sample solution.
ASH : Average area of Hydrochlorthiazide peak in standard solution.

Development of UPLC methods for the determination of drug products.
Patil A.T. and Shaikh K.A. 200
WSH : Weight Hydrochlorthiazide standard in mg.
DSH : Dilution of Hydrochlorthiazide standard in ml.
DTH : Dilution of Hydrochlorthiazide sample solution.
PH : Potency of Hydrochlorthiazide working standard on as is basis.
LCH : Label claim of Hydrochlorthiazide in mg per tablet.
5.4.3. RESULT AND DISCUSSION:
5.4.3.1 Method development and optimization:
As number of test samples in dissolution study are large in number, so the main objective
of the present study is shorter run time UPLC method for determination of Dronedarone HCl
with run time less than 2 minutes and for Telmisartan and Hydrochlorothiazide less than 4
minutes. To work on the cost effectiveness of the method it has been tried to use same column
and mobile phase for the analysis of these two formulations. So different columns with different
particle size has been tried i.e. 2.5µm, 2.0µm and 1.7 µm. It has been observed that 2.5µm,
2.0µm particle size column are unable to provide the shorter run time compare to 1.7 µm particle
size column. Different type of stationary phases such as C8 and C18 has been tried. On C8 type
of stationary phase Dronedarone is elutes in void volume where as in C18 type of stationary
phase retention of Dronedarone has been observed. Buffer pH 2.0 to 4.5 has been tried it has
observed that higher pH provides the more retention of Telmisartan compare to lower pH, so
finally 2.5 pH gives expected result. Different mobile phase combination of buffer (pH 2.5) :
acetonitrile in the range of 90:10 to 10: 90 v/v has been tried. Mobile phase ratio buffer :
acetonitrile 45:55 v/v provides the expected retention time for Dronedarone. Whereas gradient
mobile phase in the ratio of time (min) / % solution B: 0/10, 1/10, 2.0/90, 2.5/10 and 3.0/10 the
expected retention time for Telmisartan and Hydrochlorothiazide.
During the optimization of the method the chromatographic column used was an Acquity
UPLC BEH C18 50 x 2.1mm, 1.7µm. with Mobile phase used as purified water adjusted pH 2.5
with Orthophospheric acid (solution A )and Acetonitrile(solution B) in the ratio 45:55 (v/v) for
dronedarone whereas gradient mobile phase in the ratio of time (min) / % solution B: 0/10, 1/10,
2.0/90, 2.5/10 and 3.0/10 for Telmisartan and Hydrochlorothiazide. The flow rate was
Development of UPLC methods for the determination of drug products.
Patil A.T. and Shaikh K.A. 201
0.5 mL min−1
. The column temperature was maintained at 40 ºC and the detection was monitored
at a wavelength 290 nm for Dronedarone wehereas 265 nm for Telmisartan and
Hydrochlorothiazide.
5.4.3.2 Validation of method:
The optimized chromatographic conditions were validated by evaluating specificity,
linearity, precision, accuracy, limit of detection (LOD), limit of quantification (LOQ),
robustness and system suitability, in accordance with ICH guidelines Q2 (R1)56-58
.
5.4.3.2.1 Specificity:
Specificity is the ability to assess unequivocally the analyte in the presence of
components which may be expected to be present. Peak purity of analytes in the presence of
blank and Placebo is checked where purity angle is less than the purity threshold is observed for
all anlytes.
5.4.3.2.2 Limits of detection and quantification:
LOD and LOQ determination for Dronedarone, Telmisartan and Hydrochlorothiazide
was estimated by there respective methods, as the amounts for which the signal-to-noise ratio
was 3:1 and 10:1 respectively, by injecting a series of dilute solutions of known concentrations.
The results of LOD and LOQ determination is reported in table 5.5.
5.4.3.2.3 Linearity:
Linearity was established by analyzing six concentrations of Dronedarone HCl ranging
between 10% to 150% of test concentration. By plotting the peak area ratio against the
corresponding concentration. The correlation coefficients, slopes, and y-intercepts of the
calibration plots are reported. The correlation coefficients were >0.999 (Table II). These results
show there was an excellent correlation between the peak area and concentration for the
Dronedarone HCl.

Development of UPLC methods for the determination of drug products.
Patil A.T. and Shaikh K.A. 202
5.4.3.2.4 Precision:
Precision of the method was determined in relation to repeatability (intraday) and
intermediate precision (interday). In order to evaluate the repeatability of the methods, six
samples were determined during the same day. The intermediate precision of the method was
evaluated using different analyst and different instrument, and performing the analysis on
different day. % RSD of area was calculated for both precision as well as intermediate precision
and was found within 2%. These results confirmed the precision and ruggedness of the method
(Table 5.5).
Table 5.5: Regression and precision data
Compound
Precision
%RSD
Linearity
range
µg/mL
Slope LOD
µg/mL
LOQ
µg/mL
Intercept
Correlation
Coefficient
Dronedaron
e 0.21 40-600 441451 0.04 0.1 -215.15 0.9997
Telmisartan 0.15 8.8-133.2 514321 0.007 0.018 +315.56 0.9994
Hydrochlor-
othiazide
0.31 1.38-20.88 321457 0.002 0.006 -784.23 0.9996
5.4.3.2.5 Robustness:
The effect of pH was studied at pH 2.3 and 2.7. The effect of column temperature was
studied at 35 and 45 °C. Effect of flow rate at 0.4 mL min−1 and 0.6 mL min−1 was studied. In
all these experiments the mobile phase components were not changed. The effect change in
organic strength on retention time of analyte was studied by varying concentration of acetonitrile
by −10 to +10% while other mobile phase components were held constant. In all the deliberate
varied chromatographic conditions the selectivity as well as the performance of the method were
unchanged proves the robustness of the method.
5.4.3.2.6 Accuracy:
Recovery was determined in triplicate analysis of spiked sample for 50%, 100% and
150% of the analyte concentration (400 μg mL−1
) Dronedarone HCl , Telmisartan (88 μg mL−1
)
and Hydrochlorothiazide (12.5 μg mL−1
), This recovery study is performed Respective
dissolution media of analytes. recovery was calculated. (Table 5.6).

Development of UPLC methods for the determination of drug products.
Patil A.T. and Shaikh K.A. 203
Table 5.6: Results of recovery study
Compound Wt. Spiked(mg) Wt. Recovered (mg) % Recovery %RSD
Dronedarone
200.52 200.20 99.8
0.1 400.21 400.30 100.0
600.33 600.12 100.0
Telmisartan
20.24 20.12 99.4
0.3 80.16 80.20 100.0
120.4 120.31 99.9
Hydrochlorothiazide
6.32 6.29
99.5
0.2 12.51 12.45
99.5
18.82 18.78 99.8
5.4.3.2.7 Stability in solution and in the mobile phase:
No significant change in the amounts of the analytes was observed during solution
stability.The results from solution stability and mobile phase stability experiments confirmed that
standard solutions and sample was stable for up to 24 h during determination of dissolution. The
mobile phase was stable up to 48h.
5.4.4. CONCLUSION:
The RP-UPLC method developed for quantitative analysis of Dronedarone HCl in tablet
dosage form, Telmisartan and Hydrochlorothiazide tablet dosage form is precise, accurate,
linear, robust, rugged and specific. Satisfactory results were obtained from validation of the
method.
5.5. REFERENCES:
[1] Role of 5-aminosalicylic acid in treatment inflammatory bowel disease, Gisbert J.P.,
Gomollon F., Mate J., Pajares J.M., et al, Dig. Dis. Sc. (2002)47, 471-488.
[2] The role of aminosalicylates at the beginning of The new millennium in the treatment of
chronic inflammatory bowel disease, Klotz U., Maier K., Fisher C., Heinke K., Eur. J.
lin. Pharmacol. (2000)56, 353-362.

Development of UPLC methods for the determination of drug products.
Patil A.T. and Shaikh K.A. 204
[3] Clinical pharmacokinetics of slow release mesalazine, Vos M., Clin. Pharmacokinet.
(2000) 39, 85-97.
[4] Systemic levels of free 5-aminosalicylic acid depend on the nature of the 5-amino
salicyclic acid derivative and not on disease activity or extent in patients with
inflammatory bowel disease, Mahmud N., Weir D.G., Kelleher D., Ir. J. Med. Sci.
(1999)168, 228–232.
[5] Inflamm. Measurement of colonic mucosal concentrations of 5-aminosalicylic acid is
useful for estimating its therapeutic efficacy in distal ulcerative colitis: comparison of
orally administered mesalamine and sulfasalazine, Naganuma M., Iwao Y., Ogata H.,
Inoue N., Funakoshi S., Yamamoto S., et al, Bowe. Dis. (2001)7, 221–225.
[6] Crohn's disease and secondary amyloidosis: early complication? A case report and
review of the literature, Basturk T., Ozagari A., Ozturk T., Kusaslan R., Unsal A.,
J. Ren. Care. (2009)35, 147–150.
[7] Analytical Profiles Of Drug Substances And Excipients, Dash A.K., Brittain
H.G., Florey K., Academic Press, New Jersey, (1998)25, 210-242.
[8] Drugs For Constipation and Diarrhoea, Essentials of Medical Pharmacology, Tripathi
K.D., Jaypee Brothers Medical Publishers (p) ltd., (2003)1-957.
[9] Mesalamine protects against colorectal cancer in inflammatory bowel disease, Tang J.,
harif O., Pai C., Silverman A.L., Dig. Dis. Sci., (2010) 55-6, 1696-1703.
[10] Simple liquid chromatographic method for the analysis of 5-aminosalicyclic acid and its
degradation product, Haney P.W., Dash A. K., J. Chrom. A (1997)765-2, 233- 239.
[11] Determination of 5-aminosalicylic acid related impurities by micellar electrokinetic
chromatography with an ion-pair reagent, Gotti R., Pomponio R., Bertucci C., Cavrini V.,
J. Chrom. A (2001) 916, 175-183.
[12] Determination of impurities in the drug 5-aminosalicylic acid by micellar electrokinetic
capillary chromatography using an electrolyte pH that approaches the isoelectric point of
the parent compound, Lee J., Weinberger R., Weinberger J., J. Chrom. A (2004)1053,
217- 226.
[13] High-performance liquid-chromatographic determination of 5-aminosalicylic acid and its

Development of UPLC methods for the determination of drug products.
Patil A.T. and Shaikh K.A. 205
metabolites in blood plasma, Nobilis M., Vybíralova Z., Sládkova K., Lísa M., Holcapek
M., Kvetina J., J Chromatogr A. (2006)1119(1-2), 299-308.
[14] Validation of HPLC, DPPH and Nitrosation methods for Mesalamine determination in
pharmaceutical dosage forms, Aparecida J.R., Jose R., Jabor C., Rubia R., et al, Brazilian
J Pharma Sci .(2007) 43, 97-103.
[15] Development and validation of a HPLC-ESI-MS/MS method for the determination of 5-
aminosalicylic acid and its major metabolite N-acetyl-5-aminosalicylic acid in human
plasma, Pastorini E., Locatelli M., Simoni P., Roda G., Roda E., Roda A., J Chromatogr
B Analyt Technol Biomed Life Sc ( 2008 )1;872, 99-106.
[16] Development and Validation of Spectrophotometric Methods for the Estimation of
Mesalamine in Tablet Dosage Forms, Patel K.M., Patel C.N., Panigrahi B., Parikh
A.S., and Patel H.N., J Young Pharm. (2010) 2, 284–288.
[17] Development and validation of visible spectroscopic method for the determination of
Mesalamine in bulk and pharmaceutical formulation, Moharana A. K., Banerjee M.,
Sahoo N. K., asi. j. res .chem.(2011)4-4,647-649.
[18] An open-label, randomized, crossover bioequivalence study of mesalamine 400 mg
tablets in Indian healthy volunteers under fasting conditions, Kanchana M. K.,, Nagiat T.
H., Babu R. C., Mukkanti. K., Prakash. K., Der Pharmacia Lettre (2013)5, 465-471.
[19] Development and validation of a stability indicating assay method of Msalamine by using
different stress degradation conditions,. Gatkal S. H., Mhatre P. R., Chopade V. V.,
Chaudhari P. D., int j Pharma sci Res. (2013) 4, 401-406.
[20] High performance liquid chromatographic and ultraviolet spectroscopic determination of
Mesalamine in pharmaceutical formulations, S. Majji., S. K. Rao., M. E. Rao., Anal.
Chem. Ind. Jour. (2008) 7, 546-550.
[21] United States Pharmacopeia, USP32-NF27, 2895.
[22] United States Pharmacopeia, USP32-NF27, 2897.
[23] United States Pharmacopeia, USP32-NF27, 2894.
[24] British Pharmacopoeia, BP- 2010, 1368.

Development of UPLC methods for the determination of drug products.
Patil A.T. and Shaikh K.A. 206
[25] Determination of Hydrochlorothiazide and Enalapril Maleate in Tablet Formulations
by Reversed-Phase HPLC, Momani F.A., Turk J Chem (2001)25, 49-54.
[26] Development and validation of a stability-indicating HPLC method for the simultaneous
determination of losartan potassium, hydrochlorothiazide, and their degradation products.
Hertzog D.L., McCafferty J.F., Fang X., Tyrrell R.J., Reed R.A., J Pharm Biomed
Anal. (2002)15, 747-760.
[27] Experimental design approach for the optimisation of a HPLC-fluorimetric method for
the quantitation of the angiotensin II receptor antagonist telmisartan in urine, Torrealday
N., González L., Alonso R. M., Jiménez R. M., Ortiz L. E., J Pharm Biomed
Anal. (2003)32, 847-857.
[28] Simultaneous estimation of Bisoprolol fumarate and Hydrochlorothiazide in tablet dosage
form by RP-HPLC method, Patel L. J., Suhagia B. N., Shah P. B., Shah R. R.,
(2006)68-5, 635-638.
[29] RP HPLC method for simultaneous estimation of Telmisartan and Hydrochlorothiazide in
tablet dosage form, Wankhede S.B., Tajne M.R., Gupta K.R., Wadodkar S.G., Indian J.
Pharm. Sci. (2007) 69-2, 298-300.
[30] Liquid chromatographic-tandem mass spectrometric method for the simultaneous
quantitation of telmisartan and hydrochlorothiazide in human plasma, Yan T., Li.
H., Deng L., GuoY., Yu W., Fawcett J.P., Zhang D., Cui Y., Gu J., J Pharm Biomed
Anal. (2008) 48, 1225-1229.
[31] RP-HPLC estimation of ramipril and telmisartan in tablets, Kurade V.P., Pai M.G.,
Gude R., Ind j Pharma sci (2009)71-2,148-151.
[32] Development and validation of RP-HPLC method for the simultaneous estimation of
Telmisartan and Atorvastatin calcium in tablet dosage forms, Vijayamirtharaj R.,
Ramesh J., Jayalakshmi B., Pharmacie Globale (2010)4,1-4.
[33] Spectrophotometric Simultaneous Determination of Hydrochlorothiazide and
Telmisartan in Combined Dosage Form, Gangola R., Kaushik S., Sharma P., J App.
Pharma. Sci. (2011) 1, 46-49.

Development of UPLC methods for the determination of drug products.
Patil A.T. and Shaikh K.A. 207
[34] RP-HPLC method development and validation of Dronedarone HCl in its Pure form
and tablet dosage form, Patel A., Jawed A., J Chem Pharma Res. (2012) 4(4), 2173-
2179.
[35] Stability Indicating RP-HPLC Method for the Determination of Dronedarone
Hydrochloride and Its Potential Process-Related Impurities in Bulk Drug and
Pharmaceutical Dosage form, Landge S. B., Jadhav S. A., Kapil P., Nimbalkara A C.,
Mathad V. T., Ame J Anal Chem (2013) 4, 323-335.
[36] Development of a Validated Stability-Indicating RP-HPLC Method for Dronedarone
Hydrochloride in Pharmaceutical Formulation, Bhatt K., Patelia E.M., Ishani A., J Anal.
Bio. Techni. (2013) 4-1, 1-6.
[37] Stress degradation studies of Dronedarone in pharmaceutical dosage form by a validated
stability-indicating LC method, Ahirrao V.K., Patil V.K., Bembalkar S.R., Katariya
M.V., Sonnekar V.S., J. Chil. Chem. Soc. (2012) 3, 1272-1276.
[38] HPTLC method for estimation of Dronedarone hydrochloride in both bulk drug and
Pharmaceutical dosag form, Dabhi B., Hetal J.H., Patel M., Jadeja Y., Karia D., Shah A.,
Int. J. Pharm. Sci. Rev. Res. (2012) 17, 48-51.
[39] Spectrophotometric Methods for Simultaneous Determination of Telmisartan and
Hydrochlorothiazide in Tablet Dosage Form, Ilang K., Kumar P.S., Res J Pharma Bio
Chem Sci. (2012) 3, 1438-1445.
[40] Spectrophotometric simultaneous determination of Hydrochlorothiazide and Telmisartan
in combined dosage form by dual wavelength method, Gangola R., Singh N., Gaurav
A., Maithani M., Singh R., Pharmaci. Globale. (2011) 2, 1-3.
[41] RP-HPLC Method for the Simultaneous Estimation of Telmisartan and
Hydrochlorothiazide in Pharmaceutical Dosage Form, Swamy T.G., Nagaraju K., Rao
A.L., Int. J. Drug Dev. & Res. (2011) 3-4, 362-368.
[42] Analytical method development and validation of Telmisartan and Hydrochlorothiazide
in dissolution by RP-HPLC, Dhanalakshmi K., Tatineni V., Reddy N., Jotheiswari D.,
Int. J Bio. Pharma. Res. (2013) 4-3, 200-211.

Development of UPLC methods for the determination of drug products.
Patil A.T. and Shaikh K.A. 208
[43] Quantitative estimation of Telmisartan and Hydrochlorothiazide by RP-HPLC method,
Nakum R., Seth A.K., Sen D.B., Sen A.K., Int. j Drug Dis. Res. (2012)2, 45-48.
[44] Stability indicating RP-HPLC method for simultaneous determination of Telmisartan
and Hydrochlorothiazide in pharmaceutical dosage form, Varma P., Lakshmana R.A.,
Dinda S.C., Int. j Pharma. chem. bio. sci. (2012) 2-3, 382-391.
[45] Method development and validation for the simultaneous determination of Amlodipine
Besylate and Telmisartan in tablet dosage form by RP- HPLC, Kayal S.D., Khan F.A.,
Tated A.G., Bakal R.L., Chandewa A.V., Int. J Pharm. Res. Dev. (2011) 3,144–153.
[46] Simultaneous estimation of Telmisartan and Amlodipine Besylate in pharmaceutical
dosage form by RP-HPLC,. Richards P. M., Kumar B.D., Mohammad Y., Reddy K.,
Siddhartha B., Int. J Pharma. (2011) 1, 105-109.
[47] Rapid Simultaneous Determination of Telmisartan, Amlodipine Besylate and
Hydrochlorothiazide in a Combined Poly Pill Dosage Form by Stability-Indicating Ultra
Performance Liquid Chromatography, Nalawade S., Reddy V.R., Rao D.D., Rao I.K.,
Sci Pharm. (2011) 79, 69–84.
[48] A Rapid Stability-Indicating RP-HPLC Method for the Simultaneous estimation of
Enalapril Maleate and Hydrochlorothiazide in Solid Dosage Forms, Jami V., Vasanth P.
M., Anitha Y.R., Malothu R., Inte J of Chem. Life sci. (2013)2-1, 1060-1063.
[49] Validated chromatographical methods for the simultaneous estimation of
antihypertensive drugs in multicomponent formulations, Delhiraj N., Anbazhagan S., Der
Pharma. Chem. (2012) 4-6, 2416-2421.
[50] Simultaneous Determination of Ramipril, Hydrochlorothiazide and Telmisartan in tablet
dosage form using High-Performance liquid chromatography method, Varghese S.J.,
Ravi T.K., Der Pharma. Lett. (2011) 3, 83-90.
[51] Stability-indicating HPLC method for simultaneous estimation of low level impurities of
Telmisartan and Hydrochlorothiazide in tablet dosage forms, Reddy R.M., Kumar P.,
Reddy V. K., Haque W., Int J Pharm Pharm Sci. (2012) 4, 497-504.
[52] On the Reproducibility of Column Performance in Liquid Chromatography and the Role

Development of UPLC methods for the determination of drug products.
Patil A.T. and Shaikh K.A. 209
of the Packing Density, Stanley B.J., Foster C.R., Guiochon G., J. Chrom. A. (1997)
761, 41-51.
[53] Regulatory Aspects in Development of Stability-Indicating Methods: A Review,
Sehrawat R., Maithani M., Singh R., Nikalje A.P., Chromatographia (2010)72, 1-2, 1-6.
[54] Implementation of a rapid and automated high performance liquid chromatography
method development strategy for pharmaceutical drug candidates, Elizabeth F.H.,
Patrick L., Sergey G., J. Chrom. A (2006)1107, 79-87.
[55] Simultaneous variation of temperature and gradient steepness for reversed-phase high-
performance liquid chromatography method development, Dolan J.W., Snyder L.R.,
Saunders D.L., Heukelem L.V., J. Chrom. A (1998) 803, 33–50.
[56] ICH, Q2 (R1) validation of analytical procedures: text and methodology. International
conference on harmonization,1996.
[57] Analytical Method Validation, Pedro L.G., Ernesto B., Luis V.Q., et al., W. Spe. Quty.
Conl.. (2011)1, 3-20.
[58] Understanding and Implementing Efficient Analytical Methods Development and
Validation, Jay B., Kevin J., Pierre B., Anal.Chem.Test. (2003)1, 6-13.
[59] Forced degradation and impurity profiling: Recent trends in analytical perspectives, Jain
D., Basniwal P.K., J. Pharm. Biomed. Anal. (2013)86, 11-35.
[60] Development of validated stability-indicating assay methods—critical review,
Bakshi M., Singh S., J. Pharm. Biomed. Anal. (2002) 28, 1011-1040.