development of the robert wood johnson foundation ... rand report development of the robert wood...
TRANSCRIPT

HEALTH
RAND Report
Development of the Robert Wood Johnson Foundation National Survey of Health Attitudes
Description and Top-Line Summary Data
Katherine Grace Carman, Anita Chandra, Carolyn Miller,* Matthew D. Trujillo,* Douglas Yeung, Sarah Weilant, Christine DeMartini, Maria Orlando Edelen, Wenjing Huang, Joie D. Acosta
* with the Robert Wood Johnson Foundation

Limited Print and Electronic Distribution Rights
This document and trademark(s) contained herein are protected by law. This representation of RAND intellectual property is provided for noncommercial use only. Unauthorized posting of this publication online is prohibited. Permission is given to duplicate this document for personal use only, as long as it is unaltered and complete. Permission is required from RAND to reproduce, or reuse in another form, any of its research documents for commercial use. For information on reprint and linking permissions, please visit www.rand.org/pubs/permissions.html.
The RAND Corporation is a research organization that develops solutions to public policy challenges to help make communities throughout the world safer and more secure, healthier and more prosperous. RAND is nonprofit, nonpartisan, and committed to the public interest.
RAND’s publications do not necessarily reflect the opinions of its research clients and sponsors.
Support RANDMake a tax-deductible charitable contribution at
www.rand.org/giving/contribute
www.rand.org
For more information on this publication, visit www.rand.org/t/rr1391
Published by the RAND Corporation, Santa Monica, Calif.
© Copyright 2016 RAND Corporation
R® is a registered trademark.

iii
Preface
Since 2013, the Robert Wood Johnson Foundation (RWJF) has embarked on a pioneering effort to advance its Culture of Health (CoH) strategy. The CoH action framework is founded on a vision in which “everyone in our diverse society leads healthier lives now and for generations to come.” As part of this effort, RAND Corporation researchers and RWJF fielded a national survey of health attitudes to provide perspective on a CoH. This report provides a brief overview of the survey development and content, and then a top-line summary of descriptive statistics. The report complements the RWJF publication From Vision to Action: Measures to Mobilize a Culture of Health (Plough et al., 2015) and the RAND report Stakeholder Perspectives on a Culture of Health: Key Findings (Acosta et al., 2016). Other information about Culture of Health, including action framework and measure detail, can be found at www.cultureofhealth.org (RWJF, undated [a]).
Researchers from RAND and RWJF jointly conducted the research reported here; the report is intended for individuals and organizations interested in advancing the CoH action framework and learning more about public attitudes about a CoH. Given that RWJF is focused on using the action framework and measures to catalyze a national dialogue about approaches and investments to improve population health and well-being, the report should be beneficial to a range of national, state, and local leaders across a variety of sectors that contribute to health.
This research was sponsored by the Robert Wood Johnson Foundation and conducted within RAND Health. A profile of RAND Health, abstracts of its publications, and ordering information can be found at www.rand.org/health. Anita Chandra led this research study with a large, diverse team of RAND researchers. Questions about the report can be directed to [email protected].


v
Contents
Preface ............................................................................................................................................ iii Summary ........................................................................................................................................ xi Acknowledgments ........................................................................................................................ xiii Abbreviations ................................................................................................................................ xv Chapter One. Introduction to Culture of Health ............................................................................. 1
Brief Overview of the Action Areas ......................................................................................................... 2 From Action Areas to Drivers .............................................................................................................. 4 Road Map for This Report .................................................................................................................... 4
Chapter Two. Survey Overview ..................................................................................................... 7 Survey Design Process ............................................................................................................................. 7
Literature Review ................................................................................................................................. 8 Research Team Meetings ................................................................................................................... 10 Other Relevant Stakeholder Engagement ........................................................................................... 11 Pilot Test ............................................................................................................................................. 11 Survey Content ................................................................................................................................... 12 Survey Length .................................................................................................................................... 14 Randomization .................................................................................................................................... 14
Survey Sample ........................................................................................................................................ 14 RAND American Life Panel .............................................................................................................. 14 KnowledgePanel ................................................................................................................................. 15
Combining Sample Data ......................................................................................................................... 15 Weighting ............................................................................................................................................... 15 Sample Description ................................................................................................................................. 16 Margin of Error ....................................................................................................................................... 17 Limitations .............................................................................................................................................. 17 Access to the Data .................................................................................................................................. 18 Culture of Health–Specific Measures ..................................................................................................... 18
Action Area 1 ..................................................................................................................................... 19 Outcome Area: Caregiving Burden—Average Amount of Out-of-Pocket Financial and Emotional
Investment in Caregiving, as Reported by Adults, 18 Years and Older ...................................... 21 Chapter Three. Top-Line Summary Data ..................................................................................... 23
Survey Results ........................................................................................................................................ 23 1. Health Interdependence .................................................................................................................... 23
Q1. Here is a list of some things that may affect people’s health and well-being. Please rate each on a scale from 1 to 5 where 1 means it has no effect on health and 5 means it has a very strong effect. ........................................................................................................................................... 23

vi
Q2. Sometimes different people in your life affect your decisions or behaviors. For each of the items below, rate how much the behavior of each type of individual would influence or affect the decisions you make about your health. ........................................................................................ 27
Q3. How much would you say that the place where you live affects your own personal health? ..... 32 Q4. Overall, would you say that you live in a healthy community, an unhealthy one, or one that is
somewhere in between? ............................................................................................................... 32 2. U.S. and Community Resource Investment ..................................................................................... 32
Q5. When it comes to U.S. government spending on health and health care, if you had to balance that spending between helping people get and stay healthy and taking care of people when they get sick, how would you do it? .................................................................................................... 32
Q5a. How much do you think increased spending in helping people get and stay healthy (i.e., prevention) would save the U.S. in the long run in health care costs? ........................................ 33
Q6_1. For the pair of statements below, indicate whether the FIRST statement or the SECOND statement comes closer to your own views—even if neither is exactly right. ............................. 33
Q6_2. For the pair of statements below, indicate whether the FIRST statement or the SECOND statement comes closer to your own views—even if neither is exactly right. ............................. 33
3. Goals and Priority Rankings ............................................................................................................ 34 Q7. Making sure that the disadvantaged have an equal opportunity to be healthy ............................ 34 Q8. Making sure that healthy foods are for sale at affordable prices in communities where they are
not ................................................................................................................................................ 34 Q9. Making sure that there are safe, outdoor places to walk and be physically active in communities
where there aren’t any .................................................................................................................. 34 Q10. Making sure that there is decent housing available for everyone who needs it ........................ 35 Q11. Making sure that there are bike lanes, sidewalks for walking and public transportation
available so that people do not have to always rely on cars ........................................................ 35 Q12. Here are some more statements. Please indicate how much you agree or disagree with each
statement. ..................................................................................................................................... 35 4. Social Support .................................................................................................................................. 37
Q13. The following statements about community refer to your neighborhood. How well do each of the following statements represent how you feel about this community?—not at all, somewhat, mostly, or completely. .................................................................................................................. 37
Q23. Which of these statements do you agree with most? (Note that the question number was out of order for this question; it came after Q13 and before Q14.) ........................................................ 41
Q14. How often do you get the social and emotional support you need? .......................................... 41 Q14a. How often do you get the social and emotional support you need from ................................. 41
5. Caregiving Burden ........................................................................................................................... 42 Q15. In a typical month, how often, if ever, do you help others who are ailing or who have health
needs, with their daily activities? ................................................................................................. 42 Q16. In a typical month, how much do you spend of your own money, if any, helping others who
are ailing or who have health needs, with their daily activities? ................................................. 43 Q17. What impact, if any, has being a caregiver had on you financially? ......................................... 43 Q18. What impact, if any, has being a caregiver had on you emotionally? ....................................... 43

vii
6. Personal Assessment ........................................................................................................................ 44 Q19. For each of the following statements, please indicate how much you agree or disagree with
each statement. ............................................................................................................................. 44 7. Behaviors Around Health and Well-Being and Related Civic Engagement ................................... 46
Q20. Please indicate how much you agree or disagree with each statement. .................................... 46 Q20_1. Please indicate how much you agree or disagree with the following statement: I think even
if I get involved, I really can’t make a difference on behalf of health in my community. .......... 49 Q21. There are many activities that a person could do to influence government decisions about
health issues. During the past year have you . . . ......................................................................... 50 8. Survey Respondent Demographics ..................................................................................................... 51
Respondents by Age Group, in Years ................................................................................................ 51 Respondents by Race and Ethnicity ................................................................................................... 52 Respondents by Gender ...................................................................................................................... 52 Respondents by U.S. Region .............................................................................................................. 52 Respondents by Education Level ....................................................................................................... 52 Respondents by Marital Status ........................................................................................................... 53 Respondents by Number of Household Members .............................................................................. 53 Respondents by Level of Family Income, in Dollars ......................................................................... 53 Respondents’ Work Status ................................................................................................................. 53
References ..................................................................................................................................... 55


ix
Figure and Tables
Figure
Figure 1.1. Culture of Health Action Framework ........................................................................... 2
Tables Table 1.1. Action Areas and Drivers in the Culture of Health Action Framework ........................ 4 Table 2.1. Surveys Reviewed During Survey Development .......................................................... 9 Table 2.2. Key Survey Concepts and Constructs .......................................................................... 10 Table 2.3. Mapping Survey Questions to Key Survey Concepts .................................................. 12 Table 2.4. Comparison of the Survey Sample and the Current Population Survey ...................... 16 Table 2.5. Survey Questions Used for Each Culture of Health Measure ..................................... 18


xi
Summary
Since 2013, the Robert Wood Johnson Foundation (RWJF) has led the development of a pioneering national action framework to advance a “culture that enables all in our diverse society to lead healthier lives now and for generations to come” (Plough et al., 2015). Accomplishing these principles requires a national paradigm shift from a traditionally disease- and health care–centric view of health toward one that focuses on well-being. Recognizing that paradigm shifts require intentional actions, RWJF worked with RAND researchers to design an actionable path to fulfill the Culture of Health (CoH) vision. A central piece of this work is the development of measures to assess constructs underlying a CoH. This report describes the RWJF National Survey of Health Attitudes, a survey that RWJF and RAND analysts developed and conducted as part of the foundation’s CoH strategy. The foundation undertook this survey to measure key constructs that could not be measured in other data sources. Thus, the survey was not meant to capture the full action framework that informs CoH, but rather just selected measure areas.
The questions in this survey primarily addressed the action area making health a shared value (one of the action areas delineated in the CoH framework). The survey covers a variety of topics, including views regarding what factors influence health, such as the notion of health interdependence (peer, family, neighborhood, and workplace drivers of health); values related to national and community investment for health and well-being; behaviors around health and well-being, including civic engagement on behalf of health; and the role of community engagement and sense of community in relation to health attitudes and values.
We designed this survey to measure constructs that could not be assessed using existing data. In some cases, existing data were out of date or collected only in small samples that were not nationally representative. Existing literature informed our survey design. Where possible, we used questions drawn from available survey instruments. However, in some cases, we had to modify existing questions or develop new questions.
We collected data via the RAND American Life Panel (ALP) and the KnowledgePanel from GfK Custom Research. Both panels are nationally representative Internet panels recruited via probability-based sampling methods. Both provide computers and Internet connections for respondents who do not already have them. Both compensate respondents for their participation. Both panels collect demographic information about respondents separately and provide this information with each data set. The content of the survey conducted in each panel was identical. The two survey efforts combined resulted in a final total sample of 11,555 completed surveys: 3,407 from the ALP and 8,148 from the KnowledgePanel. Each survey brings unique benefits. With the ALP, we can link responses to a very rich set of background variables collected through other surveys. The KnowledgePanel provides a significantly larger sample size. We used a raking algorithm to create weights to match the distribution of characteristics in our sample as

xii
closely as possible to the distribution of characteristics of the population from the 2014 Current Population Survey (U.S. Census Bureau, 2015). We calculated the margin of error based on the 95-percent confidence interval. Because the overall sample of our survey is large, 11,555 respondents, the margin of error for the full sample ranges from 0.2 percent to 1.0 percent, for proportions near 1 percent and 50 percent, respectively.
This report discusses five measures created from these survey data for the overall 41 national CoH measures (described in more detail at www.cultureofhealth.org [RWJF, undated (a)]). These measures are the value on health interdependence, value on well-being, sense of community, social support, and caregiving burden. We identified these five for this survey for one of two reasons. First, no data existed to capture this construct or measure area to align with the purpose of the CoH action framework (relevant for value on well-being, value on health interdependence, and caregiving burden). Second, the lack of strong, national estimates (relevant for sense of community and social support) required the team to field the items in a national survey for purposes of the launch of the CoH framework.
The document concludes with detailed top-line results for each of the questions included in the survey and sociodemographic characteristics of the sample.

xiii
Acknowledgments
We appreciate the reviews of Scott Keeter from the Pew Research Center and Brian D. Stucky from RAND. We thank Larry L. Bye and Alyssa Ghirardelli from NORC at the University of Chicago for their contributions to the survey design process. We also thank the survey participants, who offered their perspectives on health and well-being issues in the United States.


xv
Abbreviations
ALP RAND American Life Panel ANES American National Election Studies BRFSS Behavioral Risk Factor Surveillance System CDC Centers for Disease Control and Prevention CoH Culture of Health CPS Current Population Survey ERIC European Research Infrastructure Consortium ESS European Social Survey MOE margin of error RWJF Robert Wood Johnson Foundation SCI Sense of Community Index


1
Chapter One. Introduction to Culture of Health
Since 2013, the Robert Wood Johnson Foundation (RWJF) has led the development of a pioneering national action framework to advance a “culture that enables all in our diverse society to lead healthier lives now and for generations to come” (Plough et al., 2015). Ten underlying principles support this framework, called the Culture of Health (CoH) (RWJF, 2014; Plough, 2015; RWJF, undated [b]):
• Good health flourishes across geographic, demographic, and social sectors. • Attaining the best health possible is valued by our entire society. • Individuals and families have the means and the opportunity to make choices that lead to
the healthiest lives possible. • Business, government, individuals, and organizations work together to build healthy
communities and lifestyles. • Everyone has access to affordable, quality health care because it is essential to maintain,
or reclaim, health. • No one is excluded. • Health care is efficient and equitable. • The economy is less burdened by excessive and unwarranted health care spending. • Keeping everyone as healthy as possible guides public and private decisionmaking. • Americans understand that we are all in this together.
Fulfilling these principles requires a national paradigm shift from a traditionally disease- and health care–centric view of health toward one that focuses on well-being. Recognizing that paradigm shifts require intentional actions, RWJF worked with RAND researchers to design an actionable path to fulfill the CoH vision. The result was a framework consisting of four action areas, drivers within action areas, and a measurement strategy. RWJF published the framework in 2015 (RWJF, undated [a]). Figure 1.1 illustrates the action framework.

2
Figure 1.1. Culture of Health Action Framework
This report describes one aspect of this effort—the development of a national survey to
assess particular constructs underlying primarily the first action area: making health a shared value. We included the questions in this survey for one of two reasons—either no satisfactory data existed on a particular measure area, requiring the team to develop new measures, or there were no robust and recent national estimates for a measure area, thus requiring collection of new data.
In this section, we provide an introduction to the framework to set the context for the survey described in Chapter Two.
Brief Overview of the Action Areas
The first action area involves building on shared values of society to forge a common cause around a CoH. It focuses on American values and expectations about health, emphasizing the importance of achieving, maintaining, and reclaiming health as a shared priority. Furthermore,
1
4
ACTION AREA
ACTION AREA
MAKINGHEALTH A
SHARED VALUE
STRENGTHENINGINTEGRATION OFHEALTH SERVICES
AND SYSTEMS
2ACTION AREA
FOSTERING CROSS-SECTORCOLLABORATION TO
IMPROVE WELL-BEING
3ACTION AREA
CREATING HEALTHIER,MORE EQUITABLE
COMMUNITIES
OUTCOME
IMPROVED POPULATION HEALTH,
WELL-BEING,AND EQUITY
CULTURE OF HEALTH ACTION FRAMEWORK
EQUITY EQUITY

3
different people and communities might define these in different ways. Achievements in this action area will fuel a greater sense of community, an increased demand for healthy places and practices, and a stronger belief that individual actions can make a difference in the well-being of others. This action area is seen as foundational to the framework; it is the one for which the most evidence is needed.
The second action area concerns working across sectors to improve health. It seeks true collaboration and integration of assets to promote health across traditional health, social, business, economic, and environmental infrastructures. This action area also involves understanding how the systems that support individual and population health operate and how they could be improved and coordinated to operate more effectively. Of course, collaboration and partnerships alone might not be sufficient to effect change in some of the systems that perpetuate poor health; for example, employment might not increase despite all our partnership efforts. Nevertheless, a community can change the relative portion of its spending on social services, which ultimately can address or mitigate the challenges of economic conditions.
The third action area involves ensuring the presence of equitable opportunities for health and well-being in a wide range of communities and organizational environments. It aims to support residents of all communities to reach their best possible health potential by leveraging the resources of the social and physical environments in which they live, learn, work, and play. By drawing on the value placed on health (action area 1, making health a shared value) and on cross-sector partnerships for well-being (action area 2, fostering cross-sector collaboration to improve well-being), strategies in this action area will capitalize on people’s opportunities for healthy choices, which can reinforce their expectations for what health can be and what well-being is and ultimately produce greater demand for health (as distinct from illness care).
The fourth action area focuses on strengthening integration of health services and systems. This action area encompasses a commitment to equity that ensures individuals’ access to high-quality, efficient, and integrated systems of public health, health care, and social services that can meet the health needs of a diverse U.S. population across the life span and across the “health span” (i.e., from sick to well). This action area emphasizes general access to and equal opportunity for health care, public health, and social services as essential cocontributors to health and well-being. Further, it addresses the system-level integration and changes that must occur in public health and health care to create an efficient, interdependent system of health and social services.
At the intersection of these four action areas in Figure 1.1 is the outcome of CoH, improved population health, well-being, and equity. We expect to see improvements in access to care and population health outcomes, economic benefits, and indicators that well-being and productivity are flourishing within all demographic, social, and geographic populations. As a result, we also expect that changes in these outcomes will reinforce the value of health and health care, increasing the value people place on health for all Americans, and the importance of multisector

4
partnerships and changes to achieve the value proposition. In this sense, the action and outcome areas of the CoH action framework are fully interactive.
From Action Areas to Drivers
Each action area contains a set of three drivers indicating where the nation needs to accelerate change. We identified the drivers through literature review and stakeholder analysis (described in both Plough et al., 2015, and Chandra et al., forthcoming) and provide a set of priorities for investment. The drivers provide scaffolding to identify illustrative measures described in Chandra et al., forthcoming. Although more detail on driver development and rationale is provided elsewhere (see RWJF, undated [a], and Chandra et al., forthcoming), Table 1.1 provides the drivers in each action area. Within the outcome domain, we refer to these groupings as outcome areas.
Table 1.1. Action Areas and Drivers in the Culture of Health Action Framework
Action Area Driver
Making health a shared value Mindsets and expectations Civic engagement Sense of community
Fostering cross-sector collaboration to improve well-being Quality of partnerships Investment in cross-sector collaboration Policies that support collaboration
Creating healthier, more equitable communities Built environment and physical conditions Social and economic environment Policy and governance
Strengthening integration of health services and systems Access Balance and integration Consumer experience
Outcome Outcome Areas
Improved population health, well-being, and equity Enhanced individual and community well-being Managed chronic disease and reduced toxic stress Reduced health care costs
Road Map for This Report
This report describes one aspect of this effort: the development of a national survey called the RWJF National Survey of Health Attitudes, primarily to assess particular constructs underlying the first action area: making health a shared value.
As noted in Table 1.1, three drivers are identified for this action area: mindsets and expectations (i.e., how the American public views health and well-being, and investments in this area); sense of community (i.e., whether and how people feel connected to their communities, which relates to the ability to have shared health values); and civic engagement (i.e., interest in promoting or advocating for health and well-being topics). Although some data are already

5
available (e.g., voting or volunteering) to capture these drivers, there are large gaps in our understanding of Americans’ perspectives regarding current expectations and views on health and well-being. Whenever possible, we drew from existing data, but, in many cases, we found that previous research has either not considered these concepts or nationally representative data have not been collected. As such, we developed this survey to address the gaps in those perspectives with an eye toward informing the action framework and related measures (for more detail, see Plough et al., 2015). This survey included questions drawn from previous work, as well as new questions developed to measure concepts not previously considered in the literature.
In addition to describing the survey development, this report also provides the survey top-line data but does not provide additional analyses. Those findings will be presented elsewhere, including in peer-reviewed journal articles in development.


7
Chapter Two. Survey Overview
As described above, we developed this survey to understand national perspectives related to the CoH, with a primary focus on the action area making health a shared value. To understand whether health is a shared value, data about attitudes and values would be needed. In many cases, these data were not available. Thus, primary data collection was needed. For other action areas, data from other sources were available. Furthermore, by focusing primarily on one action area, the survey would be more cohesive. Although four of five of the target measures (described in more detail in next sections: value on health interdependence, value on well-being, sense of community, and social support) informed the action area making health a shared value, we did use the survey to capture one measure area of caregiving burden that is included in our outcome of improved population health, well-being, and equity. We could not locate a satisfactory measure of caregiving burden with robust national estimates, so we used the survey to add these items. The survey also included other items related to the outcome of well-being, primarily to test items and to explore correlates of mindsets and expectations.
The survey covers a variety of topics, including views regarding what factors influence health, such as the notion of health interdependence (peer, family, neighborhood, and workplace drivers of health); values related to national and community investment for health and well-being; behaviors around health and well-being, including civic engagement on behalf of health; and the role of community engagement and sense of community in relation to health attitudes and values.
Survey Design Process
The survey design process included four steps. First, we reviewed relevant literature and surveys to identify potential measures and survey questions and items and to understand the underlying concepts related to these drivers.
Second, we conducted a series of meetings as a collective team with RAND staff, RWJF, and NORC at the University of Chicago to discuss survey content. NORC was developing a complementary study, the American Health Values Segmentation Study, that had a different purpose—to create a typology related to CoH values. The RWJF National Survey of Health Attitudes focused on capturing individual values about health and well-being and how they relate to personal behaviors. Although the surveys had different purposes, some questions were developed together to allow for future comparisons across the two data sets. Thus, we used the meetings to find items that we could both field while avoiding unnecessary redundancies that might lengthen our surveys.

8
Third, we drew on findings from broader stakeholder-engagement efforts undertaken as part of the larger CoH development (see Acosta et al., 2016). Finally, we conducted cognitive testing and a brief pilot test of the survey before fielding the survey.
Literature Review
We reviewed literature to identify any current nationally representative data related to the three drivers for the action area for making health a shared value or, if such data were not available, to identify survey instruments addressing these concepts.
Topics included health interdependence (e.g., peer, family, neighborhood, and workplace drivers of health); values related to national and community investment for health and well-being; behaviors around health and well-being, including civic engagement on behalf of health; and the role of community engagement and sense of community in relation to health attitudes and values. We also considered research and perspectives on relationships between the concepts, such as political sentiment and health interdependence or well-being and a sense of community. For the literature review, we scanned several databases, including PubMed, Google Scholar, JSTOR, EBSCO Academic Search Premier, the New York Academy of Medicine’s Grey Literature Report, and SAGE Publications. Key search terms included the following:
• value and well-being • value and health interdependence • value and community metrics • opinions of government spending on health • opinions on government spending priorities • personal political sentiment on government spending priorities • U.S. opinions on health policy • equal opportunity sentiment • opinions on equal health opportunity • willingness to pay for health, health investment, or well-being • well-being and government spending • society and empathy • government influence on health. To inform this survey design, we abstracted data, surveys, and concepts from the review. In
addition, we reviewed surveys, concept scales, or model questionnaires previously known to the team. Table 2.1 lists surveys that we identified through this process that contributed to the design of this survey. We reviewed each survey for items that would align with the making health a shared value action area, with a particular but not exclusive focus on the mindsets and expectations driver.

9
Table 2.1. Surveys Reviewed During Survey Development
Survey Developer Last Year of
Survey
America’s Health Agenda: Priorities and Performance Rating Survey
Harvard School of Public Health 2011
ESS ERIC ESS 2014
BRFSS CDC 2014
National Social Life, Health, and Aging Project wave 2 survey
NORC 2014
ANES Time Series Study ANES 2012
General Social Survey NORC 2014
CPS U.S. Census Bureau 2013
SCI Community Science Not applicable
American Time Use Survey U.S. Bureau of Labor Statistics 2014
Health Tracking Survey Pew Research Center 2012
The Evercare Survey of the Economic Downturn and Its Impact on Family Caregiving
National Alliance for Caregiving 2009
Better Life Index Organisation for Economic Co-operation and Development
2015
What’s Fair In Health Care? Julia Lynch 2007
Personal Health Assessment Wellness Forum Health Not applicable
Measuring Community Engagement International City/County Management Association
Not applicable
NOTE: ESS = European Social Survey. ERIC = European Research Infrastructure Consortium. BRFSS = Behavioral Risk Factor Surveillance System. CDC = Centers for Disease Control and Prevention. ANES = American National Election Studies. CPS = Current Population Survey. SCI = Sense of Community Index. Items shown as not applicable either were not collected in nationally representative surveys or were in a concept phase.
When specific measures were not available, we identified core concepts that we wanted to
capture based on literature underlying the three drivers. We then organized these findings in a measurement list to identify where we had robust measures and where gaps existed in the action-area framework. The list included a measure description, the scales associated with that particular measure, whether data were currently available for that measure, the unit of analysis, and the source of the data for the measure.
Some of the surveys reviewed did not provide data that would fit the selection criteria of the CoH measures. As described in RWJF, undated (a) (see measure compendium) and Chandra et al., forthcoming, criteria for the selection of CoH measures across all action areas included that recent data be available and that the data be nationally representative. Some surveys were fielded many years ago, and up-to-date data were not available. In one case, BRFSS contained questions on social support, but those questions were not included in recent data collection. Other measures were not collected in nationally representative surveys, or survey instruments were only in the concept phase (listed in Table 2.1 as not applicable). When data meeting these criteria were not

10
available, we included or adapted measures for the RWJF National Survey of Health Attitudes to obtain more-recent data. For concepts for which no previous data or survey instruments were available related to making health a shared value, we developed new items in this survey. This literature and survey and measure review yielded 27 measures that had some relevance to the driver mindsets and expectations, nine related to sense of community, 12 related to civic engagement, and 20 measures related to more than one driver.
Ultimately, our review identified the concepts listed in Table 2.2 related to making health a shared value, which required collecting new data. We grouped these concepts and related questions into short modules, which are reflected in the organization of the top-line tables in the latter part of this report.
Table 2.2. Key Survey Concepts and Constructs
Driver Concept or Construct
Mindsets and expectations Perspective on health Expectations on health Perceived susceptibility Health interdependence Perspectives on well-being Investment and trade-offs for health and well-being
Sense of community Social support Collectivism Emotional connection to community Membership in community
Civic engagement Civic participation (in government or nonprofits) Volunteering Voting behaviors and attitudes
Concurrently with the development of this survey, we also identified measures for other
aspects of CoH, for which we were concerned about data gaps. Our primary gap was in the measure area of caregiving burden. We reviewed surveys to identify useful items that would address this area.
Research Team Meetings
We held weekly meetings as a team and with NORC partners to review the survey content, examining whether and how measures identified or newly developed mapped to the action area overall and drivers of interest. We rated measures on their relative face and content validity. In some cases, we discussed modifications or adaptations to the item to better align with our CoH action framework and drivers. If we could use existing measures, we looked at available psychometric properties, including reliability and construct validity, though the latter was often not available for these survey items. If we created items de novo, we tried to adhere as closely as possible to the source information where available. When it was not, we discussed different wording options over several weeks, asking individual team members to offer wording options

11
for team review and comment. We also reviewed the measures with the RWJF team members, who were not part of the core team, as well as experts from our expert review process (described in Chandra et al., forthcoming). The NORC team was particularly useful in this regard, given its extensive survey-development process.
Other Relevant Stakeholder Engagement
The research team sought stakeholder input in the course of developing the CoH action framework and measures for two purposes: (1) to support the conceptual development of the action framework and (2) to support the development and use of measures. To gather stakeholder input, the team conducted 74 semistructured interviews and eight small focus-group sessions within the United States and internationally. We also partnered with Concept Systems to conduct a series of concept-mapping activities related to the action framework in four U.S. cities. For more information, see Acosta et al., 2016. The information and insight gained over the course of stakeholder interviews and small focus-group sessions helped shape the framework. In the context of this survey, we also drew on this information to identify relevant drivers and measure areas related to making health a shared value and to guide measure development. For example, as part of these early stakeholder-engagement activities, we probed on aspects of health values and interdependence as part of interviews to understand how people describe these issues. For example, we wanted to test whether stakeholders could identify the diverse factors influencing health, which became the basis for the value on health interdependence items.
Pilot Test
There were two aspects of pilot testing. First, we conducted ten cognitive interviews to examine how people interpreted the questions. The purposes of the cognitive interviews were to (1) explore whether the items were comprehensible, (2) understand how respondents interpreted the items, and (3) ensure that the item content and wording were appropriate. We primarily used a sample of convenience for the cognitive interviews, but we included respondents across the age distribution, people who had no background in health research, and people from both majority and minority racial and ethnic backgrounds. The interviews suggested that particular questions about health interdependence and value on well-being were unclear. We rewrote items and returned to those people to check understanding.
We conducted the other phase of the pilot with a sample of 40 KnowledgePanel respondents. The team then discussed with the KnowledgePanel whether there were any questions about clarity or concerns about timing. Because the American Life Panel (ALP) and KnowledgePanel survey content was identical and the sample of respondents from each was similar, we conducted the final phase of pilot testing only with the KnowledgePanel. We identified no concerns.
As an additional step before fielding, we compared the survey screen by screen in both the ALP format and the KnowledgePanel format.

12
Survey Content
Chapter Three provides the text for each question included in the survey. Table 2.3 maps the drivers and concepts shown in Table 2.2 to survey questions and sources. As noted in the table, the survey ultimately did not include some concepts. Where available, we include information about psychometric properties or testing of items. We also include items on general societal views and well-being. We did not use these items in the final 41 CoH illustrative measures but included them to be used as correlates for other survey items, particularly in future research.
Table 2.3. Mapping Survey Questions to Key Survey Concepts
Driver Measure or Concept Question Source
If Available, Relevant Psychometric or Testing of
Items
Mindsets and expectations
Perspective on health Q4 Developed by NORC
Q23 NORC, American Health Values Segmentation Study
Q20_1 Newly developed by the RAND team
Expectations on health Q7–Q11 NORC, American Health Values Segmentation Study
Perceived susceptibility We explored possible options in this area, but we did not feel that it was as high a priority as other measure areas for the final instrument.
Health interdependence
Q1 Robert and Booske, 2011; revised by NORC
Initial testing of the measure does not provide psychometrics, but we did use it successfully in capturing opinions about social determinants.
Q2 Newly developed by NORC and the RAND team
Q3 Developed by NORC
Perspectives on well-being
Q7–Q11 NORC, American Health Values Segmentation Study
Investment and trade-offs for health and well-being
Q5 and Q5a
Harvard School of Public Health, 2011; revised by NORC and the RAND team
The report did not provide psychometric values, but the survey’s MOE at fielding was ±2.8%.
Q6_1 and Q6_2
Pew 2012 Health Tracking Survey, which the RAND team revised to reflect health

13
Driver Measure or Concept Question Source
If Available, Relevant Psychometric or Testing of
Items
Sense of community
Social support Q14 BRFSS Emotional Support and Life Satisfaction Module
Alphas have generally been close to 0.70.
A14a–d NORC, 2014, which the RAND team revised to map to other health interdependence items
Collectivism Items were not well constructed, so we dropped them in favor of other sense-of-community items.
Emotional connection to community and membership in community
Q13A–L Chavis, Lee, and Acosta, 2008
For subscales, the alphas range from 0.79 to 0.86. The overall score was 0.94.
Sense of community and health
Q13 M–P Newly developed by the RAND team
Civic engagement
Civic participation (in government or nonprofit)
Q21 Harvard School of Public Health, 2011; revised by NORC and the RAND team
Volunteering We obtained data for this measure from the CPS.
Voting behaviors and attitudes
We obtained data for this measure from Leip, 2012.
General societal views
Q12a ANES, 2009, 2013; Feldman, 1988
Q12b–d Developed by NORC
Caregiving Q15 U.S. Bureau of Labor Statistics, 2014, which the RAND team adapted
Q16 Newly developed by the RAND team
Q17 National Alliance for Caregiving and United Healthcare, 2009, which the RAND team modified
Q18 National Alliance for Caregiving and United Healthcare, 2009, which the RAND team modified
Well-being Q19 ESS, 2014; Huppert et al., 2009
Q20 Bishop and Yardley, 2010; Lee et al., 2008; Gould, 1988, 1990; Snell et al., 1991; with the RAND team’s revisions
Alphas for these items range from 0.76 to 0.92.
NOTE: MOE = margin of error.

14
Survey Length
The resulting survey contained 22 questions, some with subquestions or multiple parts. The median time to complete the survey was 16 minutes.
Randomization
To avoid potential order effects, we randomized the order of some questions within modules. We randomized the order of subquestions for questions 1, 13, 19, and 20. For question 2, we randomized the order of sections on different relationships. For questions 6_1 and 6_2, we randomized the order of statements. We randomized the order of questions 7 through 11.
Survey Sample We collected data via the ALP and the KnowledgePanel from GfK. Both panels are
nationally representative Internet panels recruited via probability-based sampling methods. Both provide computers and Internet connections for respondents who do not already have them. Both compensate respondents for their participation. Both panels collect demographic information about respondents separately and provide this information with each data set. The content of the survey conducted in each panel was identical. Although there were small differences in the formatting used on the screen across the two panels (for example, the standard background colors used for the panels differs), the presentation was very similar. The two survey efforts combined resulted in a final total sample of 11,495 completed surveys. We fielded the survey in the ALP because of the rich historical data collected through that panel that can be linked to new data collection. However, to boost sample size, we also conducted the survey in the KnowledgePanel.
RAND American Life Panel
The ALP began in 2003. All data from the ALP are made publicly available and can be linked, allowing researchers to make use of data collected in other surveys fielded in the ALP. Panel members have been recruited via address-based sampling and random digit dialing and include an oversample of vulnerable populations. The vulnerable-population oversample draws from geographic areas with lower income and larger proportions of native Spanish speakers. All panel members update demographic data from the ALP quarterly. Additional information about the panel is available at ALP, undated.
We fielded this survey from March 13 through April 14, 2015. We will make the data available on the ALP website, as survey 425, with the title “Culture of Health,” in the late spring of 2016. We invited a sample of 4,326 panel members to participate in this survey, and 3,407 (78.8 percent) completed the survey.

15
KnowledgePanel
GfK administers KnowledgePanel. It was formerly known as the Knowledge Networks Panel and was administered by Knowledge Networks. Panel members have been recruited via address-based sampling and random digit dialing. Additional information is available at GfK, undated.
We fielded this survey from March 19 through April 14, 2015. We invited a sample of 12,177 panel members to participate in this survey, and 8,148 (66.9 percent) completed the survey.
Combining Sample Data We combined data from the ALP and KnowledgePanel. To assess the appropriateness of
combining these data, we took several steps. First, we took care to ensure that the implementation of the survey in the two panels was the same. Both panels displayed the questions in the same order, implemented randomization in the same way, and kept the general format of each screen similar to ensure comparability. Second, we compared responses across the two surveys. The demographic characteristics of the survey respondents differ, primarily because the ALP’s oversample of vulnerable populations, so the overall responses in the two panels differ. To test the feasibility of combining the two samples, we investigated whether there were systematic differences between responses to the two surveys, after controlling for demographic characteristics, and found no meaningful differences. Furthermore, we investigated differences in mode. Although both panels are conducted over the Internet, a respondent might use a computer, tablet, or smartphone to respond to surveys. We did not identify any systematic biases across the two surveys by mode. As a result, we pooled the two panels for final analyses. This report presents the responses from each panel separately, as well as the combined responses.
Weighting
To make the sample representative of the overall population, we used weighting, a statistical adjustment. To create weights to match the distribution of characteristics in our sample as closely as possible to that of the population from the 2014 CPS, we used a raking algorithm, following Deming, 1943, and Deville, Särndal, and Sautory, 1993. We aimed to match population proportions on interactions of gender and race and ethnicity, gender and education, gender and age and household income interacted with household size, as well as an indicator for metropolitan or nonmetropolitan areas. To calculate the weights, we combined the two samples and matched the distribution of characteristics of the pooled sample to the distribution of the CPS. In other words, our weighting procedure treated observations from the two panels as equivalent. In the top-line tables in Chapter Three, we also present the results from each survey with the weights calculated separately for each subsample. For example, the ALP results present

16
the results if the data from the ALP alone were weighted to match the CPS. We have not adjusted these weights to reflect design effects.
Sample Description Our total sample includes 11,555 respondents. The weighted sample is representative of the
noninstitutionalized adult population across all 50 states and the District of Columbia. Table 2.4 compares the weighted and unweighted characteristics of our sample with the characteristics of the CPS.
Table 2.4. Comparison of the Survey Sample and the Current Population Survey
Characteristic
ALP and KnowledgePanel
CPS Weighted Unweighted Weighted
Gender
Male 47.6 48.1 48.1
Female 52.4 51.9 51.9
Race or ethnicity
Non-Hispanic white 70.7 65.5 65.5
Non-Hispanic black 8.9 9.5 11.5
Hispanic 14.2 17.9 15.2
Non-Hispanic Asian 2.9 3.3 5.7
Non-Hispanic, all other races 3.3 3.9 2.0
Education
Less than high school 10.1 12.7 12.4
High school 24.1 29.2 29.5
Some college 31 28.7 28.7
College graduate 34.8 29.4 29.4
Age, in years
18–24 5.6 9.9 12.5
25–44 28.6 37.2 34.4
45–64 42.0 35.8 34.6
65+ 23.8 17.2 18.5
Income, in dollars
Less than 10,000 6.5 7.1 6.1
10,000 to 24,999 14.5 14.2 16.0
25,000 to 49,999 23.6 24.5 25.6
50,000 to 74,999 19.4 19.1 18.7
75,000 to 99,999 12.9 12.5 12.3
100,000 or more 23.2 22.6 21.4

17
Characteristic
ALP and KnowledgePanel
CPS Weighted Unweighted Weighted
Household size, in number of residents
1 20.5 15.0 14.4
2 39.2 34.4 34.2
3 16.6 20.0 19.2
4 13.2 16.8 17.1
5 6.1 7.8 8.8
6 2.8 3.7 3.6
7 0.9 1.2 1.6
8 0.3 0.4 0.5
9 0.2 0.4 0.3
10 0.2 0.2 0.1
11 0.04 0.1 0.1
12 0.02 0.03 0.02
Metropolitan/nonmetropolitan
Metropolitan 85.1 85.0 84.3
Nonmetropolitan 14.9 15.0 14.9
Not identified — — 0.8
NOTE: We present all results as percentages.
Margin of Error
We calculated the MOE based on the 95-percent confidence interval. If a study were repeated 100 times, the 95-percent confidence interval would contain the true value 95 percent of the time. The MOE is a function of the sample size and the measured proportion, with the smallest MOE for proportions near 0 percent or 100 percent and the largest MOE for proportions near 50 percent. Because the overall sample size of our survey is large, 11,495 respondents, the MOE for the full sample ranges from 0.2 percent to 1.0 percent, for proportions near 1 percent and 50 percent, respectively. For the ALP subsample, the MOE ranges from 0.5 percent to 1.8 percent. For the KnowledgePanel subsample, the MOE ranges from 0.2 percent to 1.2 percent. We have not adjusted the MOEs to reflect design effects.
Limitations This research has several limitations. First, we drew our sample from two panels. Although
we identified no significant differences in responses across the two panels when controlling for demographic differences, we might not be able to discern from the social and demographic profiles of the sample every underlying difference regarding attitudes and perspectives. Second,

18
many respondents used smartphones to respond to the survey. Although both the ALP and KnowledgePanel have optimized their formatting for smartphones, our survey contained several large tables—for example, for question 1, which asked the respondent to rate many different things on one screen. These tables can be difficult for respondents using smartphones, and we cannot be sure of the mode’s impact or influence on those questions specifically. Third, we cannot weight based on design effects. We do not have sufficient information about the recruitment of panel members to conduct this weighting. We believe that the weighting adequately accounts for important demographic impacts but does not fully account for all possible design effects. For this, the research team would need more detail on geographic clustering and secondary recruitment details that are not available systematically.
Access to the Data In the early summer of 2016, the combined data set with weights will be made available
through RWJF’s Health and Medical Care Archive at the Inter-University Consortium for Political and Social Research at the University of Michigan as the RWJF National Survey of Health Attitudes.
Culture of Health–Specific Measures
As described earlier, the initial motivation to develop and field the RWJF National Survey of Health Attitudes was to capture aspects of the action area making health a shared value. Then, we specifically used the survey to collect data for five of the 41 national CoH measures: four measures associated with action area 1, making health a shared value, and one measure associated with the outcome improving population health, well-being, and equity.
Although the survey offers more than these five measures to capture national health attitudes and perspectives that will be key to CoH in future analyses, we highlight the construction of those five measures here as they align with our initial set of 41 illustrative, national CoH measures. More information about each measure is available at www.cultureofhealth.org (RWJF, undated [a]). Table 2.5 summarizes which questions we used for each measure.
Table 2.5. Survey Questions Used for Each Culture of Health Measure
Measure Relevant Question
Value on health interdependence Q1: E, H, J, M, P, S
Value on well-being Q7–Q11
Sense of community Q13 A–F and G–L
Social support Q14
Caregiving burden Primary measure: Q15; supporting data: Q16–Q18

19
Action Area 1
Value on Health Interdependence: Percentage of Adults, 18 Years and Older, in Strong Agreement That Their Health Is Influenced by Peers, Neighborhood, and the Broader Community
Understanding community members’ health attitudes and expectations will inform where community engagement and information processes should start in order to catalyze community health action. We calculated the measure using six of the items from question 1, which read, “Here is a list of some things that may affect people’s health and well-being. Please rate each on a scale from 1 to 5 where 1 means it has no effect on health and 5 means it has a very strong effect.” The six items included are
• E: neighborhood options for healthy food and exercise • H: amount of social support • J: physical environment such as clean air or water • M: community safety • P: where a person lives • S: examples set by people around you. A person’s overall score is the average across the six items. We then grouped respondents
into three categories based on their average summative score on value of health interdependence: very weak or weak agreement (average score 1 to 2.9); moderate agreement (average score 3 to 3.9); or strong or very strong agreement (average score 4 to 5). We then calculated the proportion of respondents who fall into each category. Our top-line measure indicated that 33.9 percent reported strong or very strong value on health interdependence. Nearly half (49.5 percent) were in the moderate category, and 16.6 percent in the weak category.
Value on Well-Being: Percentage of Adults, 18 Years and Older, Interested in How Their Communities Invest in Well-Being Signaling a Broader Expectation for Well-Being
This measure provides insight on the current landscape of public opinion and attitudes regarding community investment in well-being. We calculated this measure using questions 7 through 11, which asked respondents whether they thought that various policy measures to improve health and well-being should be a top priority, important but not a top priority, or not a priority at all for communities. The policy measures were
• Q7: making sure that the disadvantaged have an equal opportunity to be healthy • Q8: making sure that healthy foods are for sale at affordable prices in communities where
they are not • Q9: making sure that there are safe, outdoor places to walk and be physically active in
communities where there are not any • Q10: making sure that there is decent housing available for everyone who needs it • Q11: making sure that there are bike lanes, sidewalks for walking, and public
transportation available so that people do not have to always rely on cars.

20
We then counted how many of these possible policies each respondent rated a top priority. The measure reports the percentage of the respondents who considered each value of these to be a top priority. Thirty-one percent said that none of these was a top priority; 17.3 percent thought that one was a top priority; 16.7 percent considered two to be top priorities; 16.3 percent considered three top priorities; 10.2 percent considered four top priorities; and 8.6 percent indicated that all policies were top priorities.
Sense of Community: Aggregate Score on Two Subscales of the Sense of Community Index—Emotional Connection to Community and Sense of Belonging to Community (Membership)
We developed this measure using an existing battery of questions designed to measure emotional connection to one’s community and sense of membership in the community. Question 13 of the survey asked this. Additional information about the existing index is available in Chavis, Lee, and Acosta, 2008. The SCI reveals how community members feel about their communities—whether they feel they belong and whether they can count on people in their communities. Previous research has found that the SCI is linked to whether people get involved, whether they have better satisfaction with their health care, and whether they engage in healthy behaviors, such as exercise and good diet (Chavis, Lee, and Acosta, 2008).
For our measure, we separately calculated a score for each of the two subscales. Each scale contains six questions. We measured the emotional-connection subscale with items A through F of question 13. The membership subscale consists of items G through L of question 13. For each item, the item asks respondents to indicate how well the statement represents how they feel about their communities on a scale from 0 to 3, where 0 is not at all well, 1 is somewhat, 2 is mostly, and 3 is completely. We averaged the score for each subscale and grouped respondents into three categories of sense of community: weak (score between 0 and 0.9), moderate (score between 1 and 1.9), or strong (score between 2 and 3). We found that 51 percent reported a weak sense of membership, 41 percent a moderate sense of membership, and 8 percent a strong sense of membership. Thirty-six percent reported a weak emotional connection, 49 percent a moderate emotional connection, and 15 percent a strong emotional connection.
Social Support: Percentage of Adults, 18 Years and Older, Noting That They Have Adequate Social Support from Partners, Families, and Friends
Having high levels of social support has been linked to a variety of improved health and well-being outcomes (Umberson and Montez, 2010). For example, there is a strong link between the level of social support and exercise adherence in older populations (McAuley et al., 2003). Research has also demonstrated a link between social support and chronic-disease outcomes, such as high blood pressure and diabetes (Gallant, 2003).
The item asked respondents whether they get the social and emotional support they need (always, usually, sometimes, rarely, or never). Originally, CDC’s state-based BRFSS captured

21
results for this measure. However, the last survey data were captured in 2010. Therefore, we fielded this question in this survey.
We asked this in question 14, and, using the results, we calculated the percentage of respondents who reported always or usually receiving the support they need. Just more than half (50.5 percent) reported that they always or usually receive the support they need.
Outcome Area: Caregiving Burden—Average Amount of Out-of-Pocket Financial and Emotional Investment in Caregiving, as Reported by Adults, 18 Years and Older
We included a measure in this survey related to caregiving burden because this was a measure identified in the CoH outcome area of enhanced individual and community well-being, for which national data were unavailable. We know that caregiving for seniors or others can create economic burdens and indirect health effects on families and caregivers. When a caregiver is burdened, that caregiver might provide lower-quality care for the person in need. We developed these survey questions to measure the prevalence of caregiving and to what extent it does or does not impose an emotional burden.
The survey asked respondents whether they provided care (question 15) or financial support (question 16) to those who are ailing or have health care needs. It then asked anyone who reported providing any care or financial support what impact, if any, being a caregiver had on them financially (question 17) and emotionally (question 18), where response categories were mostly positive, somewhat positive, equally positive and negative, somewhat negative, mostly negative, or no impact.
From question 15, we calculated the percentage of respondents who were frequent, occasional, or never caregivers. We also calculated the percentage of respondents providing any amount of care or financial support (questions 15 and 16) who reported a mostly positive or somewhat positive effect both emotionally and financially (questions 17 and 18). Fifty-seven percent reported providing occasional or frequent caregiving, and 52 percent reported that their caregiving experiences were positive.


23
Chapter Three. Top-Line Summary Data
Survey Results
This final chapter presents the top-line survey results from the ALP and KnowledgePanel samples, as well as the combined sample. For each question in the survey, we present the text as it was presented to survey respondents. We have weighted each separately according to the algorithm described above to make them representative of the U.S. population. For example, the ALP results present the results if we weighted the data from the ALP alone to match the CPS. We also weighted the combined results to match the CPS. Section 8 presents the survey respondents’ unweighted demographic characteristics. We selected presentation of unweighted demographic characteristics so that readers can see the original survey sample composition before we applied weighting procedures. This can aid other users of the survey data, who might apply other weighting approaches in their analyses.
We report the percentage of respondents who chose not to answer each question and label this as missing. With the exception of questions 17 and 18, we asked all questions of all respondents. For questions 17 and 18, we report the percentage who were not asked each question and label that “skip question.” None of the questions included a “don’t know” option.
In the interest of parsimony, the following tables do not present the MOE for each question. As described above, the MOE for the full sample ranges from 0.2 percent to 1.0 percent, for proportions near 1 percent and 50 percent, respectively. For the ALP subsample, the MOE ranges from 0.5 percent to 1.8 percent. For the KnowledgePanel subsample, the MOE ranges from 0.2 percent to 1.2 percent.
1. Health Interdependence
Q1. Here is a list of some things that may affect people’s health and well-being. Please rate each on a scale from 1 to 5 where 1 means it has no effect on health and 5 means it has a very strong effect.
A. Access to Affordable Healthcare
Sample 1 (No Effect) 2 3 4
5 (Very Strong Effect) Missing
ALP (n = 3,407) 3.0 4.8 16.2 28.2 46.0 1.8
KnowledgePanel (n = 8,148)
3.9 5.5 21.3 29.5 39.2 0.5
Total 3.7 5.4 20.1 28.9 41.2 0.8
NOTE: We present all results as percentages.

24
B. Having a Job
Sample 1 2 3 4 5 Missing
ALP (n = 3,407) 5.7 7.0 22.2 31.2 32.3 1.7
KnowledgePanel (n = 8,148)
5.4 7.0 29.6 30.9 26.6 0.5
Total 5.4 7.2 27.7 30.9 28.1 0.7
NOTE: We present all results as percentages.
C. Stress
Sample 1 2 3 4 5 Missing
ALP (n = 3,407) 1.9 2.3 9.1 26.8 58.1 1.7
KnowledgePanel (n = 8,148)
1.9 2.3 13.0 32.2 50.1 0.5
Total 1.9 2.3 12.2 30.9 52 0.7
NOTE: We present all results as percentages.
D. Knowledge About Health
Sample 1 2 3 4 5 Missing
ALP (n = 3,407) 2.9 3.9 18.0 37.0 36.4 1.8
KnowledgePanel (n = 8,148)
2.6 4.4 24.3 35.6 32.5 0.5
Total 2.6 4.4 22.8 36.0 33.5 0.8
NOTE: We present all results as percentages.
E. Neighborhood Options for Healthy Food and Exercise
Sample 1 2 3 4 5 Missing
ALP (n = 3,407) 5.3 9.6 25.3 34.2 23.6 1.9
KnowledgePanel (n = 8,148)
5.0 9.8 31.3 29.6 23.8 0.5
Total 5.1 9.7 29.9 30.5 24.0 0.8
NOTE: We present all results as percentages.
F. Having Health Insurance
Sample 1 2 3 4 5 Missing
ALP (n = 3,407) 4.2 5.5 17.9 25.4 44.9 2.0
KnowledgePanel (n = 8,148)
5.4 6.1 22.0 28.6 37.4 0.5
Total 5.2 5.9 20.9 27.7 39.4 0.8
NOTE: We present all results as percentages.

25
G. Smoking
Sample 1 2 3 4 5 Missing
ALP (n = 3,407) 3.2 2.2 5.7 11.9 75.4 1.7
KnowledgePanel (n = 8,148)
3.9 1.8 9.0 15.9 68.9 0.5
Total 3.8 2.0 8.5 14.9 70.1 0.7
NOTE: We present all results as percentages.
H. Amount of Social Support
Sample 1 2 3 4 5 Missing
ALP (n = 3,407) 6.6 10.9 29.7 33.1 17.9 1.8
KnowledgePanel (n = 8,148)
6.4 13.9 35.7 28.4 15.1 0.5
Total 6.4 13.1 34.3 29.5 16.0 0.8
NOTE: We present all results as percentages.
I. Personal Health Practices (Other Than Smoking)
Sample 1 2 3 4 5 Missing
ALP (n = 3,407) 2.2 1.9 11.6 28.6 53.9 1.7
KnowledgePanel (n = 8,148)
2.7 1.6 13.5 30.8 50.9 0.5
Total 2.6 1.7 13.0 30.1 51.8 0.7
NOTE: We present all results as percentages.
J. Physical Environment Such as Clean Air or Water
Sample 1 2 3 4 5 Missing
ALP (n = 3,407) 2.5 3.3 12.0 30.5 50.0 1.8
KnowledgePanel (n = 8,148)
2.2 3.1 17.4 33.4 43.3 0.5
Total 2.2 3.1 16.3 32.7 44.9 0.8
NOTE: We present all results as percentages.
K. Genetic Makeup Inherited from Parents
Sample 1 2 3 4 5 Missing
ALP (n = 3,407) 4.5 4.2 21.5 33.3 34.8 1.7
KnowledgePanel (n = 8,148)
3.2 4.3 23.9 33.9 34.1 0.5
Total 3.5 4.4 23.2 34.0 34.2 0.7
NOTE: We present all results as percentages.

26
L. Income
Sample 1 2 3 4 5 Missing
ALP (n = 3,407) 3.9 7.4 24.0 30.9 31.7 2.0
KnowledgePanel (n = 8,148)
4.3 8.4 30.2 30.5 26.2 0.5
Total 4.1 8.1 28.6 30.6 27.8 0.8
NOTE: We present all results as percentages.
M. Community Safety
Sample 1 2 3 4 5 Missing
ALP (n = 3,407) 6.0 11.3 28.7 30.2 22.1 1.8
KnowledgePanel (n = 8,148)
5.6 12.6 35.0 28.4 17.8 0.5
Total 5.6 12.2 33.6 28.9 19.0 0.8
NOTE: We present all results as percentages.
N. Housing Quality
Sample 1 2 3 4 5 Missing
ALP (n = 3,407) 4.2 9.9 30.8 34.2 19.0 1.9
KnowledgePanel (n = 8,148)
4.4 10.4 34.8 31.5 18.4 0.5
Total 4.3 10.3 33.6 32.1 19.0 0.8
NOTE: We present all results as percentages.
O. Education
Sample 1 2 3 4 5 Missing
ALP (n = 3,407) 7.3 6.9 26.8 33.9 23.4 1.7
KnowledgePanel (n = 8,148)
5.8 9.9 29.9 31.8 22.2 0.5
Total 5.9 9.4 29.1 32.2 22.6 0.7
NOTE: We present all results as percentages.
P. Where a Person Lives
Sample 1 2 3 4 5 Missing
ALP (n = 3,407) 5.1 9.3 33.3 32.7 17.8 1.8
KnowledgePanel (n = 8,148)
4.5 10.2 35.5 32.0 17.4 0.5
Total 4.6 10.0 34.6 32.3 17.7 0.7
NOTE: We present all results as percentages.

27
Q. Personal Religion/Spirituality
Sample 1 2 3 4 5 Missing
ALP (n = 3,407) 16.3 16.8 26.8 21.2 16.9 1.9
KnowledgePanel (n = 8,148)
16.6 19.0 29.9 18.5 15.4 0.5
Total 16.3 18.5 29.5 19.0 15.9 0.8
NOTE: We present all results as percentages.
R. Race/Ethnicity
Sample 1 2 3 4 5 Missing
ALP (n = 3,407) 19.9 17.8 30.2 19.2 11.3 1.7
KnowledgePanel (n = 8,148)
16.1 18.7 36.6 18.8 9.4 0.5
Total 16.6 18.5 35.3 19 9.8 0.7
NOTE: We present all results as percentages.
S. Examples Set by People Around You
Sample 1 2 3 4 5 Missing
ALP (n = 3,407) 8.1 11.7 29.6 29.0 19.8 1.8
KnowledgePanel (n = 8,148)
6.9 11.6 33.1 29.7 18.2 0.5
Total 7.2 11.7 32.3 29.6 18.4 0.8
SOURCE: Robert and Booske, 2011; revised by NORC. NOTE: We present all results as percentages.
Q2. Sometimes different people in your life affect your decisions or behaviors. For each of the items below, rate how much the behavior of each type of individual would influence or affect the decisions you make about your health.
A. A Close Friend Who Engages in Physical Activity Regularly
Sample Not at All A Little Some A Lot Missing
ALP (n = 3,407) 13.3 20.4 42.5 22.0 1.7
KnowledgePanel (n = 8,148)
16.3 24.4 40.5 18.4 0.4
Total 15.4 23.7 40.8 19.3 0.7
NOTE: We present all results as percentages.

28
B. A Close Friend Who Eats Fast Food Weekly
Sample Not at All A Little Some A Lot Missing
ALP (n = 3,407) 34.5 27.8 25.1 10.8 1.8
KnowledgePanel (n = 8,148)
37.0 30.4 23.3 8.8 0.5
Total 36.5 30.0 23.6 9.2 0.7
NOTE: We present all results as percentages.
C. A Close Friend Who Smokes
Sample Not at All A Little Some A Lot Missing
ALP (n = 3,407) 43.7 16.8 17.0 20.7 1.8
KnowledgePanel (n = 8,148)
44.3 18.9 19.2 17.1 0.5
Total 44.1 18.5 19.0 17.7 0.7
NOTE: We present all results as percentages.
D. A Close Friend Who Manages Stress Well
Sample Not at All A Little Some A Lot Missing
ALP (n = 3,407) 15.9 24.0 36.8 21.5 1.8
KnowledgePanel (n = 8,148)
19.6 25.8 38.0 16.1 0.5
Total 18.6 25.3 38.0 17.3 0.7
NOTE: We present all results as percentages.
E. A Close Friend Who Only Sees Doctor When Sick
Sample Not at All A Little Some A Lot Missing
ALP (n = 3,407) 39.7 25.6 22.9 10.1 1.8
KnowledgePanel (n = 8,148)
37.1 30.0 24.4 8.1 0.5
Total 37.7 29.2 23.9 8.5 0.7
NOTE: We present all results as percentages.
F. A Family Member Who Engages in Physical Activity Regularly
Sample Not at All A Little Some A Lot Missing
ALP (n = 3,407) 12.3 16.8 39.7 29.2 1.9
KnowledgePanel (n = 8,148)
12.8 20.8 41.3 24.5 0.5
Total 12.5 19.9 41.0 25.8 0.8
NOTE: We present all results as percentages.
29
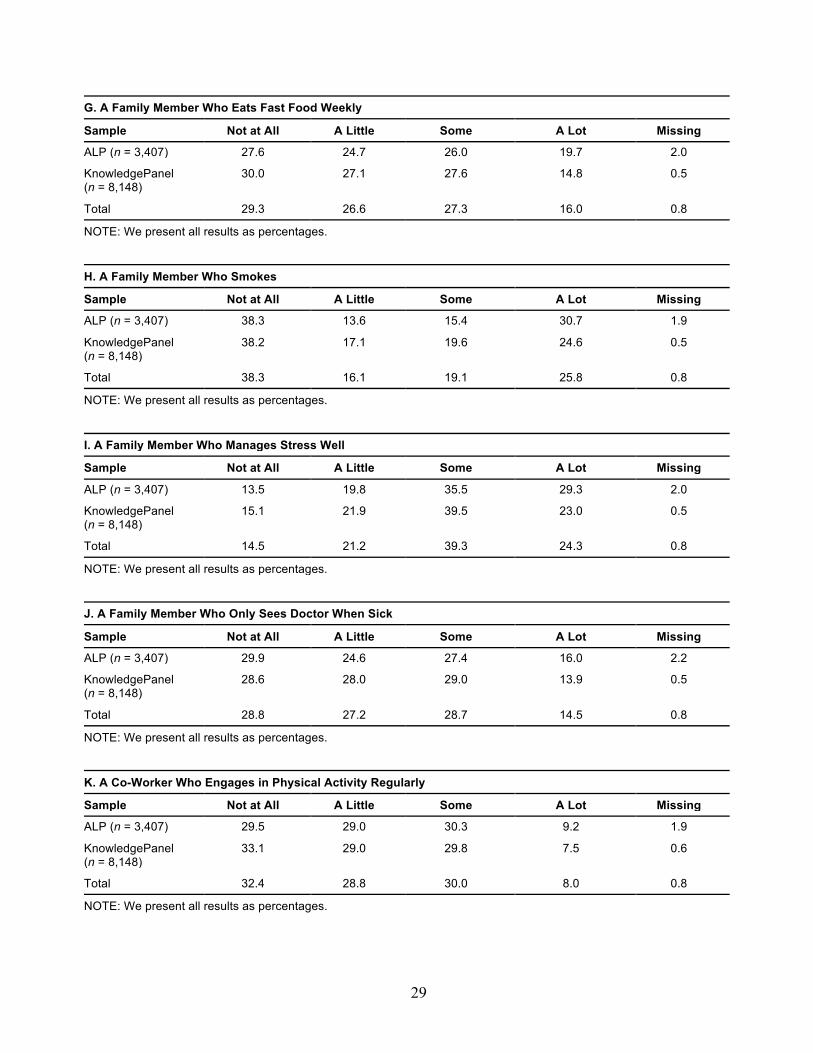
G. A Family Member Who Eats Fast Food Weekly
Sample Not at All A Little Some A Lot Missing
ALP (n = 3,407) 27.6 24.7 26.0 19.7 2.0
KnowledgePanel (n = 8,148)
30.0 27.1 27.6 14.8 0.5
Total 29.3 26.6 27.3 16.0 0.8
NOTE: We present all results as percentages.
H. A Family Member Who Smokes
Sample Not at All A Little Some A Lot Missing
ALP (n = 3,407) 38.3 13.6 15.4 30.7 1.9
KnowledgePanel (n = 8,148)
38.2 17.1 19.6 24.6 0.5
Total 38.3 16.1 19.1 25.8 0.8
NOTE: We present all results as percentages.
I. A Family Member Who Manages Stress Well
Sample Not at All A Little Some A Lot Missing
ALP (n = 3,407) 13.5 19.8 35.5 29.3 2.0
KnowledgePanel (n = 8,148)
15.1 21.9 39.5 23.0 0.5
Total 14.5 21.2 39.3 24.3 0.8
NOTE: We present all results as percentages.
J. A Family Member Who Only Sees Doctor When Sick
Sample Not at All A Little Some A Lot Missing
ALP (n = 3,407) 29.9 24.6 27.4 16.0 2.2
KnowledgePanel (n = 8,148)
28.6 28.0 29.0 13.9 0.5
Total 28.8 27.2 28.7 14.5 0.8
NOTE: We present all results as percentages.
K. A Co-Worker Who Engages in Physical Activity Regularly
Sample Not at All A Little Some A Lot Missing
ALP (n = 3,407) 29.5 29.0 30.3 9.2 1.9
KnowledgePanel (n = 8,148)
33.1 29.0 29.8 7.5 0.6
Total 32.4 28.8 30.0 8.0 0.8
NOTE: We present all results as percentages.

30
L. A Co-Worker Who Eats Fast Food Weekly
Sample Not at All A Little Some A Lot Missing
ALP (n = 3,407) 49.4 26.2 16.9 5.5 2.0
KnowledgePanel (n = 8,148)
50.6 26.7 17.1 5.1 0.6
Total 50.7 26.2 17.2 5.2 0.8
NOTE: We present all results as percentages.
M. A Co-Worker Who Smokes
Sample Not at All A Little Some A Lot Missing
ALP (n = 3,407) 54.1 15.5 13.9 14.2 2.2
KnowledgePanel (n = 8,148)
53.9 17.7 15.2 12.6 0.5
Total 54.0 17.1 15.0 13.0 0.8
NOTE: We present all results as percentages.
N. A Co-Worker Who Manages Stress Well
Sample Not at All A Little Some A Lot Missing
ALP (n = 3,407) 28.1 24.0 32.4 13.6 2.0
KnowledgePanel (n = 8,148)
32.3 26.2 30.5 10.4 0.6
Total 31.4 25.7 30.9 11.2 0.8
NOTE: We present all results as percentages.
O. A Co-Worker Who Only Sees Doctor When Sick
Sample Not at All A Little Some A Lot Missing
ALP (n = 3,407) 52.3 24.5 15.3 5.5 2.3
KnowledgePanel (n = 8,148)
51.5 25.5 17.0 5.5 0.6
Total 51.8 25.1 16.8 5.5 0.8
NOTE: We present all results as percentages.
P. A Neighbor Who Engages in Physical Activity Regularly
Sample Not at All A Little Some A Lot Missing
ALP (n = 3,407) 40.4 27.9 22.6 7.3 1.9
KnowledgePanel (n = 8,148)
43.1 27.8 22.2 6.5 0.5
Total 42.4 27.6 22.5 6.7 0.8
NOTE: We present all results as percentages.

31
Q. A Neighbor Who Eats Fast Food Weekly
Sample Not at All A Little Some A Lot Missing
ALP (n = 3,407) 68.6 17.3 9.0 3.2 1.9
KnowledgePanel (n = 8,148)
66.3 18.8 10.7 3.7 0.5
Total 66.6 18.5 10.5 3.7 0.8
NOTE: We present all results as percentages.
R. A Neighbor Who Smokes
Sample Not at All A Little Some A Lot Missing
ALP (n = 3,407) 61.8 16.5 10.2 9.5 2.0
KnowledgePanel (n = 8,148)
61.5 16.4 12.0 9.6 0.5
Total 61.4 16.3 11.8 9.7 0.8
NOTE: We present all results as percentages.
S. A Neighbor Who Manages Stress Well
Sample Not at All A Little Some A Lot Missing
ALP (n = 3,407) 46.5 23.9 18.5 9.1 2.0
KnowledgePanel (n = 8,148)
48.2 23.8 19.9 7.5 0.5
Total 47.4 24.0 20.0 7.9 0.8
NOTE: We present all results as percentages.
T. A Neighbor Who Only Sees Doctor When Sick
Sample Not at All A Little Some A Lot Missing
ALP (n = 3,407) 64.0 19.7 10.1 4.3 1.9
KnowledgePanel (n = 8,148)
61.7 20.0 13.1 4.6 0.5
Total 62.0 20.0 12.7 4.6 0.8
SOURCE: Newly developed by NORC and the RAND team. NOTE: We present all results as percentages.

32
Q3. How much would you say that the place where you live affects your own personal health?
Sample A Lot Some Not Much Not at All Missing
ALP (n = 3,407) 23.6 45.1 21.0 8.4 1.9
KnowledgePanel (n = 8,148)
18.8 45.7 22.8 12.1 0.7
Total 20.2 45.6 22.1 11.3 0.9
SOURCE: Developed by NORC. NOTE: We present all results as percentages.
Q4. Overall, would you say that you live in a healthy community, an unhealthy one, or one that is somewhere in between?
Sample Healthy Unhealthy In-Between Missing
ALP (n = 3,407) 42.8 8.9 46.5 1.9
KnowledgePanel (n = 8,148)
47.2 6.2 45.7 0.9
Total 45.8 7.0 46.1 1.0
SOURCE: Developed by NORC. NOTE: We present all results as percentages.
2. U.S. and Community Resource Investment
Q5. When it comes to U.S. government spending on health and health care, if you had to balance that spending between helping people get and stay healthy and taking care of people when they get sick, how would you do it?
Sample
More on Getting and Keeping People
Healthy
More on Taking Care of People When They Get
Sick Equal Between
the Two Missing
ALP (n = 3,407) 37.7 10.2 50.1 1.9
KnowledgePanel (n = 8,148)
34.2 11.1 53.2 1.5
Total 35.0 10.9 52.6 1.5
SOURCE: Harvard School of Public Health, 2011; revised by NORC and the RAND team. NOTE: We present all results as percentages.

33
Q5a. How much do you think increased spending in helping people get and stay healthy (i.e., prevention) would save the U.S. in the long run in health care costs?
Sample Not Much Savings A Little Savings
Some or Modest Savings
Significant Savings Missing
ALP (n = 3,407) 6.8 14.3 29.2 47.7 2.0
KnowledgePanel (n = 8,148)
9.0 16.9 33.4 39.3 1.4
Total 8.7 16.4 32.3 41.1 1.5
SOURCE: Harvard School of Public Health, 2011; revised by NORC and the RAND team. NOTE: We present all results as percentages.
Q6_1. For the pair of statements below, indicate whether the FIRST statement or the SECOND statement comes closer to your own views—even if neither is exactly right.
Sample
The Biggest Reason People in America Become Unhealthy Is
Because They Make Poor Choices That Affect Their Health
The Biggest Reason People in America Become Unhealthy Is
Because Things Outside of Their Control Affect Their Health Missing
ALP (n = 3,407) 80.3 17.6 2.1
KnowledgePanel (n = 8,148)
80.0 18.0 2.0
Total 79.9 18.2 1.9
SOURCE: Pew Research Center, 2012; revised by the RAND team to reflect health. NOTE: We present all results as percentages.
Q6_2. For the pair of statements below, indicate whether the FIRST statement or the SECOND statement comes closer to your own views—even if neither is exactly right.
Sample
The Government Should Do More to Make Sure That Americans Are Healthier, Even If It Means Going
Deeper into Debt
The Government Today Can’t Afford to Do Much More to Help
Americans Be Healthier Missing
ALP (n = 3,407) 47.7 50.3 2.0
KnowledgePanel (n = 8,148)
42.8 54.7 2.5
Total 44.1 53.6 2.3
SOURCE: Pew Research Center, 2012; revised by the RAND team. NOTE: We present all results as percentages.

34
3. Goals and Priority Rankings In the following section, we list goals that some people think are important for communities
in the U.S. For each, indicate whether you think it should be a top priority, important but not a top priority, or not a priority at all for communities. In these statements, when we refer to “communities,” we mean all communities not just your own.
Should the following be a top priority, important but not a top priority, or not a priority at all for communities?
Q7. Making sure that the disadvantaged have an equal opportunity to be healthy
Sample Top Priority Important but
Not Top Not a Priority at
All Missing
ALP (n = 3,407) 46.6 46.0 5.4 2.0
KnowledgePanel (n = 8,148)
38.3 52.7 7.6 1.4
Total 40.8 50.8 7.0 1.5
SOURCE: NORC, 2015. NOTE: We present all results as percentages.
Q8. Making sure that healthy foods are for sale at affordable prices in communities where they are not
Sample Top Priority Important but
Not Top Not a Priority at
All Missing
ALP (n = 3,407) 54.0 37.8 6.1 2.1
KnowledgePanel (n = 8,148)
43.4 45.4 9.7 1.5
Total 45.8 43.8 8.9 1.5
SOURCE: NORC, 2015. NOTE: We present all results as percentages.
Q9. Making sure that there are safe, outdoor places to walk and be physically active in communities where there aren’t any
Sample Top Priority Important but
Not Top Not a Priority at
All Missing
ALP (n = 3,407) 35.1 57.1 5.8 2.0
KnowledgePanel (n = 8,148)
29.9 60.0 8.7 1.4
Total 31.5 58.9 8.1 1.5
SOURCE: NORC. NOTE: We present all results as percentages.

35
Q10. Making sure that there is decent housing available for everyone who needs it
Sample Top Priority Important but
Not Top Not a Priority at
All Missing
ALP (n = 3,407) 45.9 45.5 6.6 2.0
KnowledgePanel (n = 8,148)
37.4 50.6 10.7 1.3
Total 40.0 48.8 9.8 1.4
SOURCE: NORC, 2015. NOTE: We present all results as percentages.
Q11. Making sure that there are bike lanes, sidewalks for walking and public transportation available so that people do not have to always rely on cars
Sample Top Priority Important but
Not Top Not a Priority at
All Missing
ALP (n = 3,407) 24.4 59.6 13.9 2.1
KnowledgePanel (n = 8,148)
21.4 60.8 16.6 1.3
Total 22.3 60.5 15.9 1.4
SOURCE: Newly developed by the RAND team. NOTE: We present all results as percentages.
Q12. Here are some more statements. Please indicate how much you agree or disagree with each statement.
A. Our Society Should Do Whatever Is Necessary to Make Sure That Everyone Has an Equal Opportunity to Succeed
Sample Strongly Disagree
Somewhat Disagree
Neither Agree Nor Disagree Somewhat Agree Strongly Agree Missing
ALP (n = 3,407) 7.8 8.0 16.4 30.7 35.0 2.1
KnowledgePanel (n = 8,148)
6.6 9.9 26.0 31.2 25.2 1.1
Total 6.8 9.5 23.9 30.9 27.7 1.3
SOURCE: Feldman, 1988, is the source for the survey instrument that was last fielded in ANES, 2009, 2013. NOTE: We present all results as percentages.

36
B. Our Society Should Do Whatever Is Necessary to Make Sure That Everyone Has an Equal Opportunity to Be Healthy
Sample Strongly Disagree
Somewhat Disagree
Neither Agree Nor Disagree Somewhat Agree Strongly Agree Missing
ALP (n = 3,407) 4.4 7.0 13.9 31.7 40.7 2.2
KnowledgePanel (n = 8,148)
5.0 6.8 22.4 33.7 31.0 1.1
Total 5.0 6.8 20.5 33.2 33.4 1.2
SOURCE: Developed by NORC. NOTE: We present all results as percentages.
C. It Is Best for Society If People Are as Concerned About the Needs of Others as They Are About Their Own Needs
Sample Strongly Disagree
Somewhat Disagree
Neither Agree Nor Disagree Somewhat Agree Strongly Agree Missing
ALP (n = 3,407) 4.8 8.1 17.4 32.6 35.0 2.1
KnowledgePanel (n = 8,148)
3.8 6.4 26.0 35.0 27.5 1.1
Total 4.0 6.6 24.3 34.5 29.3 1.3
SOURCE: Developed by NORC. NOTE: We present all results as percentages.
D. It Would Be Unjust If Some People Had More of an Opportunity to Be Healthy Than Other People
Sample Strongly Disagree
Somewhat Disagree
Neither Agree Nor Disagree Somewhat Agree Strongly Agree Missing
ALP (n = 3,407) 8.7 10.6 21.5 24.3 32.8 2.1
KnowledgePanel (n = 8,148)
8.3 11.1 29.9 24.6 25.0 1.1
Total 8.2 11.0 28.0 24.5 27.1 1.3
SOURCE: Developed by NORC. NOTE: We present all results as percentages.

37
4. Social Support
Q13. The following statements about community refer to your neighborhood. How well do each of the following statements represent how you feel about this community?—not at all, somewhat, mostly, or completely.
A. I Can Trust People in This Community
Sample Not at All Somewhat Mostly Completely Missing
ALP (n = 3,407) 15.9 42.4 33.3 6.1 2.3
KnowledgePanel (n = 8,148)
15.0 46.8 31.6 5.8 0.9
Total 15.3 45.8 31.8 5.9 1.2
SOURCE: Chavis, Lee, and Acosta, 2008. NOTE: We present all results as percentages.
B. I Can Recognize Most of the Members of This Community
Sample Not at All Somewhat Mostly Completely Missing
ALP (n = 3,407) 28.5 40.5 22.4 6.3 2.3
KnowledgePanel (n = 8,148)
33.7 40.4 20.2 4.9 0.9
Total 32.2 40.5 20.9 5.3 1.1
SOURCE: Chavis, Lee, and Acosta, 2008. NOTE: We present all results as percentages.
C. Most Community Members Know Me
Sample Not at All Somewhat Mostly Completely Missing
ALP (n = 3,407) 32.6 39.2 20.4 5.3 2.4
KnowledgePanel (n = 8,148)
38.6 39.4 16.5 4.6 0.9
Total 37.1 39.5 17.4 4.8 1.2
SOURCE: Chavis, Lee, and Acosta, 2008. NOTE: We present all results as percentages.
D. This Community Has Symbols and Expressions of Membership Such as Clothes, Signs, Art, Architecture, Logos, Landmarks, and Flags That People Can Recognize
Sample Not at All Somewhat Mostly Completely Missing
ALP (n = 3,407) 40.7 31.9 17.2 7.7 2.4
KnowledgePanel (n = 8,148)
45.5 33.0 15.4 5.3 0.8
Total 44.1 32.5 16.2 6.1 1.1
SOURCE: Chavis, Lee, and Acosta, 2008. NOTE: We present all results as percentages.

38
E. I Put a Lot of Time and Effort into Being Part of This Community
Sample Not at All Somewhat Mostly Completely Missing
ALP (n = 3,407) 36.9 40.6 14.2 5.8 2.5
KnowledgePanel (n = 8,148)
41.2 40.4 13.6 3.9 0.8
Total 40.0 40.5 13.9 4.5 1.1
SOURCE: Chavis, Lee, and Acosta, 2008. NOTE: We present all results as percentages.
F. Being a Member of This Community Is Part of My Identity
Sample Not at All Somewhat Mostly Completely Missing
ALP (n = 3,407) 40.9 33.8 14.3 8.2 2.7
KnowledgePanel (n = 8,148)
41.4 36.2 15.6 6.0 0.8
Total 41.0 35.8 15.5 6.6 1.1
SOURCE: Chavis, Lee, and Acosta, 2008. NOTE: We present all results as percentages.
G. It Is Very Important to Me to Be a Part of This Community
Sample Not at All Somewhat Mostly Completely Missing
ALP (n = 3,407) 24.8 39.0 23.8 9.8 2.5
KnowledgePanel (n = 8,148)
26.8 42.2 22.3 7.9 0.8
Total 26.3 41.2 22.8 8.6 1.1
SOURCE: Chavis, Lee, and Acosta, 2008. NOTE: We present all results as percentages.
H. I Am with Other Community Members a Lot and Enjoy Being with Them
Sample Not at All Somewhat Mostly Completely Missing
ALP (n = 3,407) 39.3 38.9 13.9 5.6 2.4
KnowledgePanel (n = 8,148)
43.2 38.5 13.5 4.0 0.9
Total 42.2 38.4 13.7 4.6 1.1
SOURCE: Chavis, Lee, and Acosta, 2008. NOTE: We present all results as percentages.

39
I. I Expect to Be a Part of This Community for a Long Time
Sample Not at All Somewhat Mostly Completely Missing
ALP (n = 3,407) 20.2 28.2 29.8 19.5 2.3
KnowledgePanel (n = 8,148)
19.1 34.2 29.2 16.7 0.8
Total 19.2 32.6 29.6 17.4 1.1
SOURCE: Chavis, Lee, and Acosta, 2008. NOTE: We present all results as percentages.
J. Members of This Community Have Shared Important Events Together, Such as Holidays, Celebrations, or Disasters
Sample Not at All Somewhat Mostly Completely Missing
ALP (n = 3,407) 31.3 37.8 21.1 7.3 2.5
KnowledgePanel (n = 8,148)
32.0 40.0 21.0 6.2 0.8
Total 31.6 39.5 21.1 6.7 1.2
SOURCE: Chavis, Lee, and Acosta, 2008. NOTE: We present all results as percentages.
K. I Feel Hopeful About the Future of This Community
Sample Not at All Somewhat Mostly Completely Missing
ALP (n = 3,407) 14.4 36.8 35.1 11.3 2.4
KnowledgePanel (n = 8,148)
15.2 40.6 33.5 9.8 0.9
Total 15.0 39.8 33.8 10.2 1.2
SOURCE: Chavis, Lee, and Acosta, 2008. NOTE: We present all results as percentages.
L. Members of This Community Care About Each Other
Sample Not at All Somewhat Mostly Completely Missing
ALP (n = 3,407) 15.3 49.9 26.6 5.7 2.4
KnowledgePanel (n = 8,148)
16.8 50.3 26.8 5.2 0.9
Total 16.5 49.9 27.0 5.4 1.2
SOURCE: Chavis, Lee, and Acosta, 2008. NOTE: We present all results as percentages.

40
M. My Community Can Work Together to Improve Its Health
Sample Not at All Somewhat Mostly Completely Missing
ALP (n = 3,407) 19.7 45.7 23.7 8.5 2.4
KnowledgePanel (n = 8,148)
21.0 47.0 24.7 6.5 0.9
Total 20.7 46.6 24.6 7.0 1.2
SOURCE: Newly developed by the RAND team. NOTE: We present all results as percentages.
N. My Community Has the Resources to Improve Its Health
Sample Not at All Somewhat Mostly Completely Missing
ALP (n = 3,407) 19.0 40.9 28.0 9.8 2.4
KnowledgePanel (n = 8,148)
19.9 42.4 28.7 8.0 0.9
Total 20.2 42.0 28.3 8.3 1.2
SOURCE: Newly developed by the RAND team. NOTE: We present all results as percentages.
O. My Community Works Together to Make Positive Change for Health
Sample Not at All Somewhat Mostly Completely Missing
ALP (n = 3,407) 35.5 40.8 17.9 3.3 2.5
KnowledgePanel (n = 8,148)
35.2 43.2 17.1 3.4 1.0
Total 35.1 42.9 17.3 3.5 1.3
SOURCE: Newly developed by the RAND team. NOTE: We present all results as percentages.
P. I Know My Neighbors Will Help Me Stay Healthy
Sample Not at All Somewhat Mostly Completely Missing
ALP (n = 3,407) 55.2 29.1 9.4 3.8 2.5
KnowledgePanel (n = 8,148)
53.7 31.7 11.1 2.6 0.9
Total 54.1 31.0 10.9 2.8 1.2
SOURCE: Newly developed by the RAND team. NOTE: We present all results as percentages.

41
Q23. Which of these statements do you agree with most? (Note that the question number was out of order for this question; it came after Q13 and before Q14.)
Sample
If People in the Community Worked
Together It Would Be Easy to Make It a
Healthier Place to Live
If People in the Community Worked Together It Would
Not Be Easy, but It Would Be Possible to Make It a
Healthier Place to Live
Even If People in the Community Worked
Together, It Would Be Impossible to Make It a Healthier Place to Live Missing
ALP (n = 3,407) 30.6 56.3 10.5 2.6
KnowledgePanel (n = 8,148)
29.9 57.6 10.1 2.4
Total 30.2 57.5 10.0 2.3
SOURCE: NORC, 2015. NOTE: We present all results as percentages.
Q14. How often do you get the social and emotional support you need?
Sample Always Usually Sometimes Rarely Never Missing
ALP (n = 3,407) 13.4 37.2 28.9 14 4.1 2.4
KnowledgePanel (n = 8,148)
14.7 35.1 30.7 12.9 5.3 1.3
Total 14.3 35.8 30.4 12.9 5.1 1.5
SOURCE: BRFSS, 2009, Section 22. NOTE: We present all results as percentages.
Q14a. How often do you get the social and emotional support you need from
A. Close Friends
Sample Always Usually Sometimes Rarely Never Missing
ALP (n = 3,407) 29.9 36.1 20.8 7.1 3.5 2.6
KnowledgePanel (n = 8,148)
26.6 36.4 23.9 7.4 4.3 1.4
Total 27.4 36.2 23.2 7.4 4.2 1.6
NOTE: We present all results as percentages.
B. Family Members
Sample Always Usually Sometimes Rarely Never Missing
ALP (n = 3,407) 44.3 29.3 15.0 6.2 2.5 2.6
KnowledgePanel (n = 8,148)
43.7 29.5 17.2 5.6 2.7 1.3
Total 43.9 29.4 16.8 5.7 2.7 1.5
NOTE: We present all results as percentages.

42
C. Co-Workers
Sample Always Usually Sometimes Rarely Never Missing
ALP (n = 3,407) 6.7 22.0 29.9 17.1 21.5 2.8
KnowledgePanel (n = 8,148)
5.8 18.8 32.6 15.7 23.7 3.4
Total 6.0 19.8 31.9 16.0 23.3 3.0
NOTE: We present all results as percentages.
D. Neighbors
Sample Always Usually Sometimes Rarely Never Missing
ALP (n = 3,407) 4.5 13.2 25.1 26.1 28.6 2.4
KnowledgePanel (n = 8,148)
4.7 14.1 28.8 24.3 26.3 1.9
Total 4.5 13.9 28.2 24.5 26.9 1.9
SOURCE: NORC, 2014, which the RAND team revised to map to other health-interdependence items. NOTE: We present all results as percentages.
5. Caregiving Burden Sometimes people take care of others who are ailing or who have health needs. For example,
these may include elderly relatives, family members with disabilities or chronic disease, friends, or neighbors. In this section, we ask a few questions about that experience. (Please don’t include those who you take care of for pay.)
Q15. In a typical month, how often, if ever, do you help others who are ailing or who have health needs, with their daily activities?
Sample Daily
Several Times a
Week About Once
a Week 2–3 Times a Month
Once a Month Never Missing
ALP (n = 3,407) 9.7 12.3 12.0 15.6 20.0 28.0 2.4
KnowledgePanel (n = 8,148)
7.1 7.8 8.2 10.6 17.0 47.7 1.6
Total 7.6 9.0 9.3 11.7 17.9 42.8 1.7
SOURCE: U.S. Bureau of Labor Statistics, 2014, which the RAND team adapted. NOTE: We present all results as percentages.

43
Q16. In a typical month, how much do you spend of your own money, if any, helping others who are ailing or who have health needs, with their daily activities?
Sample None $1–
$250 $251–$500
$501–$1,000
$1,001–$2,000
$2,001–$3,000
$3,001–$5,000
$5,001–$10,000
More than $10,000a Missing
ALP (n = 3,407) 40.5 49.6 4.6 1.6 0.7 0.3 0.3 0.0 — 2.4
KnowledgePanel (n = 8,148)
55.9 35.3 3.5 1.7 0.7 0.3 0.1 0.1 0.1 2.1
Total 52.1 38.9 3.9 1.6 0.7 0.3 0.2 0.1 0.1 2.0
SOURCE: Newly developed by the RAND team. NOTE: We present all results as percentages. a None of the respondents in the ALP selected this bracket.
We asked those who reported providing any care or financial support in either question 15 or
16 the following two questions. The question is labeled as missing if the respondent chose not to answer and skipped if the survey did not ask that respondent the question.
Q17. What impact, if any, has being a caregiver had on you financially?
Sample Mostly
Positive Somewhat
Positive
Equally Positive
and Negative
Somewhat Negative
Mostly Negative
No Impact Missing
Skip Question
ALP (n = 3,407) 8.4 6.6 15.6 7.0 3.4 33.6 2.5 23.0
KnowledgePanel (n = 8,148)
5.6 5.9 10.9 5.1 2.4 26.9 — 43.2
Total 6.5 6.3 12.1 5.6 2.7 28.3 0.5 38.1
SOURCE: National Alliance for Caregiving and United Healthcare, 2009, which the RAND team modified. NOTE: We present all results as percentages.
Q18. What impact, if any, has being a caregiver had on you emotionally?
Sample Mostly
Positive Somewhat
Positive
Equally Positive
and Negative
Somewhat Negative
Mostly Negative
No Impact Missing
Skip Question
ALP (n = 3,407) 16.6 17.0 18.1 4.9 2.6 15.5 2.5 23.0
KnowledgePanel (n = 8,148)
10.7 10.9 14.4 4.8 2.1 13.8 — 43.3
Total 12.3 12.3 15.5 4.9 2.2 14 0.5 38.2
SOURCE: National Alliance for Caregiving and United Healthcare, 2009, which the RAND team modified. NOTE: We present all results as percentages.

44
6. Personal Assessment
Q19. For each of the following statements, please indicate how much you agree or disagree with each statement.
A. Most Days I Feel a Sense of Accomplishment from What I Do
Sample Strongly Disagree
Somewhat Disagree
Neither Agree Nor Disagree
Somewhat Agree Strongly Agree Missing
ALP (n = 3,407) 4.8 8.1 19.4 41 24 2.6
KnowledgePanel (n = 8,148)
3.6 8.3 24.2 41.4 21.6 0.8
Total 3.8 8.4 22.8 41.5 22.3 1.2
NOTE: We present all results as percentages.
B. In the Past Week I Felt Calm and Peaceful
Sample Strongly Disagree
Somewhat Disagree
Neither Agree Nor Disagree
Somewhat Agree Strongly Agree Missing
ALP (n = 3,407) 7.4 12.8 18.0 37.6 21.6 2.6
KnowledgePanel (n = 8,148)
5.1 12.9 22.6 37.6 21.1 0.8
Total 5.5 12.8 21.6 37.8 21.2 1.1
NOTE: We present all results as percentages.
C. I Love Learning New Things
Sample Strongly Disagree
Somewhat Disagree
Neither Agree Nor Disagree
Somewhat Agree Strongly Agree Missing
ALP (n = 3,407) 2.1 2.0 9.7 31.2 52.4 2.6
KnowledgePanel (n = 8,148)
1.5 3.2 16.8 36.9 40.8 0.8
Total 1.6 2.9 15.2 35.4 43.7 1.2
NOTE: We present all results as percentages.
D. I Generally Feel That What I Do in My Life Is Valuable and Worthwhile
Sample Strongly Disagree
Somewhat Disagree
Neither Agree Nor Disagree
Somewhat Agree Strongly Agree Missing
ALP (n = 3,407) 4.0 6.8 14.3 39.4 32.8 2.6
KnowledgePanel (n = 8,148)
2.9 6.2 21.0 39.4 29.7 0.8
Total 3.1 6.3 19.5 39.2 30.9 1.2
NOTE: We present all results as percentages.

45
E. I Am Always Optimistic About My Future
Sample Strongly Disagree
Somewhat Disagree
Neither Agree Nor Disagree
Somewhat Agree Strongly Agree Missing
ALP (n = 3,407) 4.2 9.9 17.7 39.1 26.3 2.8
KnowledgePanel (n = 8,148)
3.6 9.9 24.0 38.5 23.2 0.8
Total 3.6 10.0 22.6 38.7 24.0 1.2
NOTE: We present all results as percentages.
F. Taking All Things Together, I Am Generally Happy
Sample Strongly Disagree
Somewhat Disagree
Neither Agree Nor Disagree
Somewhat Agree Strongly Agree Missing
ALP (n = 3,407) 3.6 6.2 12.0 39.5 36.1 2.6
KnowledgePanel (n = 8,148)
2.6 6.0 16.4 40.8 33.4 0.8
Total 2.8 6.0 15.7 40.2 34.2 1.1
NOTE: We present all results as percentages.
G. There Are People in My Life Who Really Care About Me
Sample Strongly Disagree
Somewhat Disagree
Neither Agree Nor Disagree
Somewhat Agree Strongly Agree Missing
ALP (n = 3,407) 2.3 2.8 5.6 22.5 64.2 2.6
KnowledgePanel (n = 8,148)
2.2 2.6 11.0 25.2 58.2 0.8
Total 2.2 2.6 9.9 24.2 59.8 1.2
NOTE: We present all results as percentages.
H. When Things Go Wrong in My Life It Generally Takes Me a Long Time to Get Back to Normal
Sample Strongly Disagree
Somewhat Disagree
Neither Agree Nor Disagree
Somewhat Agree Strongly Agree Missing
ALP (n = 3,407) 21.1 30.7 21.7 16.7 7.2 2.6
KnowledgePanel (n = 8,148)
16.6 32.1 27.4 17.6 5.5 0.8
Total 17.8 31.6 26.2 17.6 5.6 1.1
NOTE: We present all results as percentages.

46
I. In General, I Feel Very Positive About Myself
Sample Strongly Disagree
Somewhat Disagree
Neither Agree Nor Disagree
Somewhat Agree Strongly Agree Missing
ALP (n = 3,407) 3.9 7.9 12.3 40.1 33.3 2.6
KnowledgePanel (n = 8,148)
3.2 7.5 19.2 39.8 29.5 0.8
Total 3.3 7.7 17.8 39.5 30.6 1.2
NOTE: We present all results as percentages.
J. In the Past Week I Had a Lot of Energy
Sample Strongly Disagree
Somewhat Disagree
Neither Agree Nor Disagree
Somewhat Agree Strongly Agree Missing
ALP (n = 3,407) 9.2 17.8 23.9 31.9 14.6 2.6
KnowledgePanel (n = 8,148)
7.6 17.4 29.3 31.0 14.0 0.8
Total 7.9 17.4 28.0 31.4 14.1 1.2
SOURCES: ESS, 2014; Huppert et al., 2009. NOTE: We present all results as percentages.
7. Behaviors Around Health and Well-Being and Related Civic Engagement
Q20. Please indicate how much you agree or disagree with each statement.
A. I Can Keep Up My Daily Routine
Sample Strongly Disagree
Somewhat Disagree
Neither Agree Nor Disagree
Somewhat Agree Strongly Agree Missing
ALP (n = 3,407) 4.0 7.4 14.8 37.3 33.9 2.6
KnowledgePanel (n = 8,148)
2.7 7.4 18.6 39.8 30.7 0.8
Total 2.9 7.6 17.7 39.2 31.6 1.1
NOTE: We present all results as percentages.
B. Health Problems Stop Me Carrying Out My Usual Tasks
Sample Strongly Disagree
Somewhat Disagree
Neither Agree Nor Disagree
Somewhat Agree Strongly Agree Missing
ALP (n = 3,407) 39.7 18.3 15.0 15.9 8.2 2.9
KnowledgePanel (n = 8,148)
34.4 22.2 20.3 15.7 6.6 0.8
Total 35.5 21.2 19.2 15.9 7.1 1.2
NOTE: We present all results as percentages.

47
C. I Do Not Have Any Diagnosed Health Problems
Sample Strongly Disagree
Somewhat Disagree
Neither Agree Nor Disagree
Somewhat Agree Strongly Agree Missing
ALP (n = 3,407) 24.9 15.7 11.4 17.5 27.9 2.6
KnowledgePanel (n = 8,148)
20.7 18.0 16.7 18.9 25.0 0.8
Total 21.6 17.5 15.5 18.5 25.7 1.1
NOTE: We present all results as percentages.
D. I Feel Full of Energy
Sample Strongly Disagree
Somewhat Disagree
Neither Agree Nor Disagree
Somewhat Agree Strongly Agree Missing
ALP (n = 3,407) 10.6 20.0 25.6 30.3 10.9 2.6
KnowledgePanel (n = 8,148)
8.2 19.0 31.1 29.5 11.4 0.8
Total 8.8 19.1 29.9 29.7 11.3 1.1
NOTE: We present all results as percentages.
E. My Life Is in Balance
Sample Strongly Disagree
Somewhat Disagree
Neither Agree Nor Disagree
Somewhat Agree Strongly Agree Missing
ALP (n = 3,407) 6.9 14.2 27.8 34.5 14.1 2.6
KnowledgePanel (n = 8,148)
4.3 14.1 30.6 35.6 14.5 0.8
Total 4.9 14.2 29.9 35.6 14.2 1.2
NOTE: We present all results as percentages.
F. I Have a Lot of Get Up and Go
Sample Strongly Disagree
Somewhat Disagree
Neither Agree Nor Disagree
Somewhat Agree Strongly Agree Missing
ALP (n = 3,407) 8.9 16.1 26.4 32.1 13.7 2.6
KnowledgePanel (n = 8,148)
7.3 16.4 31.0 31.0 13.5 0.8
Total 7.6 16.3 29.9 31.4 13.6 1.1
NOTE: We present all results as percentages.

48
G. I Feel Physically and Emotionally Strong
Sample Strongly Disagree
Somewhat Disagree
Neither Agree Nor Disagree
Somewhat Agree Strongly Agree Missing
ALP (n = 3,407) 5.8 12.4 20.8 38.9 19.2 2.9
KnowledgePanel (n = 8,148)
4.5 12.9 25.1 38.4 18.3 0.7
Total 4.8 13.0 24.2 38.3 18.6 1.1
NOTE: We present all results as percentages.
H. I Am Confident I Can Have a Positive Effect on My Health
Sample Strongly Disagree
Somewhat Disagree
Neither Agree Nor Disagree
Somewhat Agree Strongly Agree Missing
ALP (n = 3,407) 3.0 5.9 14.1 37.7 36.8 2.6
KnowledgePanel (n = 8,148)
2.0 4.6 20.4 40.8 31.5 0.8
Total 2.1 4.9 19.1 39.9 32.9 1.1
NOTE: We present all results as percentages.
I. I Have Not Been Able to Meet the Goals I Set for Myself to Improve My Health
Sample Strongly Disagree
Somewhat Disagree
Neither Agree Nor Disagree
Somewhat Agree Strongly Agree Missing
ALP (n = 3,407) 13.7 22.0 26.2 27.6 7.9 2.6
KnowledgePanel (n = 8,148)
11.9 21.1 31.8 27.0 7.4 0.8
Total 12.1 20.9 30.6 27.4 7.8 1.1
NOTE: We present all results as percentages.
J. I Am Actively Working to Improve My Health
Sample Strongly Disagree
Somewhat Disagree
Neither Agree Nor Disagree
Somewhat Agree Strongly Agree Missing
ALP (n = 3,407) 2.8 7.4 21.7 38.9 26.6 2.6
KnowledgePanel (n = 8,148)
2.6 7.4 26.2 41.3 21.8 0.8
Total 2.5 7.6 25.1 40.6 23.1 1.1
NOTE: We present all results as percentages.

49
K. I Reflect About My Health a Lot
Sample Strongly Disagree
Somewhat Disagree
Neither Agree Nor Disagree
Somewhat Agree Strongly Agree Missing
ALP (n = 3,407) 6.5 13.6 25.2 35.0 17.1 2.6
KnowledgePanel (n = 8,148)
5.3 14.7 31.9 33.4 13.9 0.8
Total 5.6 14.4 30.5 33.7 14.7 1.1
NOTE: We present all results as percentages.
L. I’m Not Very Self-Conscious About My Health
Sample Strongly Disagree
Somewhat Disagree
Neither Agree Nor Disagree
Somewhat Agree Strongly Agree Missing
ALP (n = 3,407) 19.2 25.6 21.6 22.8 7.9 2.9
KnowledgePanel (n = 8,148)
15.8 26.0 29.2 20.8 7.5 0.7
Total 16.5 25.7 27.7 21.1 7.8 1.1
NOTE: We present all results as percentages.
M. A Strong Sense of Spirituality Has Nothing to Do with My Health
Sample Strongly Disagree
Somewhat Disagree
Neither Agree Nor Disagree
Somewhat Agree Strongly Agree Missing
ALP (n = 3,407) 26.9 19.8 21.7 13.9 15.1 2.6
KnowledgePanel (n = 8,148)
21.4 21.7 29.0 14.2 13.1 0.7
Total 23.0 21.2 27.5 14.0 13.3 1.1
SOURCES: Bishop and Yardley, 2010; Lee et al., 2008; Gould, 1988, 1990; Snell et al., 1991; revised by the RAND team. NOTE: We present all results as percentages.
Q20_1. Please indicate how much you agree or disagree with the following statement: I think even if I get involved, I really can’t make a difference on behalf of health in my community.
Sample Strongly Disagree
Somewhat Disagree
Neither Agree Nor Disagree
Somewhat Agree
Strongly Agree Missing
ALP (n = 3,407) 13.1 24.8 32.0 18.5 9.0 2.6
KnowledgePanel (n = 8,148)
9.5 22.1 39.5 18.7 8.7 1.4
Total 10.5 22.8 37.7 18.8 8.6 1.6
SOURCE: Newly developed by the RAND team. NOTE: We present all results as percentages.

50
Q21. There are many activities that a person could do to influence government decisions about health issues. During the past year have you . . .
A. Voted for or Against a Candidate for Public Office Because of His/Her Position on a Health Problem or Issue
Sample Yes No Missing
ALP (n = 3,407) 32.4 65.0 2.6
KnowledgePanel (n = 8,148)
27.7 71.3 1.0
Total 28.9 69.8 1.3
NOTE: We present all results as percentages.
B. Contributed Time or Money to an Organization Working to Prevent or Cure a Specific Disease Like Cancer or HIV/AIDS
Sample Yes No Missing
ALP (n = 3,407) 39.8 57.6 2.6
KnowledgePanel (n = 8,148)
27.6 71.3 1.0
Total 30.6 68.0 1.4
NOTE: We present all results as percentages.
C. Contributed Time or Money to an Organization Working to Make the Community a Healthier Place to Live
Sample Yes No Missing
ALP (n = 3,407) 33.5 63.8 2.6
KnowledgePanel (n = 8,148)
22.5 76.5 1.1
Total 25.2 73.4 1.4
NOTE: We present all results as percentages.
D. Contributed Time or Money to an Organization Working to Pass a Government Health Law or Policy
Sample Yes No Missing
ALP (n = 3,407) 16.5 80.9 2.6
KnowledgePanel (n = 8,148)
10.4 88.5 1.1
Total 12.2 86.4 1.4
NOTE: We present all results as percentages.

51
E. Volunteered for a Group/Board/Committee/Council That Addresses Health-Related Issues and Activities for My Community
Sample Yes No Missing
ALP (n = 3,407) 16.0 81.4 2.6
KnowledgePanel (n = 8,148)
10.9 88.0 1.1
Total 12.4 86.2 1.4
NOTE: We present all results as percentages.
F. Written an Email, Letter or Signed a Petition on Some Health Problem or Issue
Sample Yes No Missing
ALP (n = 3,407) 27.8 69.6 2.6
KnowledgePanel (n = 8,148)
15.9 83.1 1.0
Total 19.0 79.6 1.4
SOURCE: Harvard School of Public Health, 2011, which the RAND team revised. NOTE: We present all results as percentages.
8. Survey Respondent Demographics Both panels collect demographic information about respondents separately and provide this
information with each data set. This section presents the survey respondents’ unweighted demographic characteristics.
Respondents by Age Group, in Years
Sample 18 to 24 25 to 44 45 to 64 65+
ALP (n = 3,407) 2.1 26.7 46.7 24.5
KnowledgePanel (n = 8,148) 7.0 29.5 40.1 23.5
Total 5.6 28.6 42.0 23.8
NOTE: We present all results as percentages.

52
Respondents by Race and Ethnicity
Sample
Non-Hispanic
White
Non-Hispanic
Black Hispanic
Non-Hispanic
Asian
Non-Hispanic All Other Races
ALP (n = 3,407) 68.5 10.8 16.0 2.6 2.1
KnowledgePanel (n = 8,148)
71.6 8.1 13.4 3.1 3.7
Total 70.7 8.9 14.2 2.9 3.3
NOTE: We present all results as percentages.
Respondents by Gender
Sample Male Female
ALP (n = 3,407) 43.4 56.6
KnowledgePanel (n = 8,148) 49.3 50.7
Total 47.6 52.4
NOTE: We present all results as percentages.
Respondents by U.S. Region
Sample Northeast Midwest South West
ALP (n = 3,407) 18.7 17.7 35.0 28.6
KnowledgePanel (n = 8,148) 17.6 24.2 34.8 23.4
Total 17.9 22.3 34.8 24.9
NOTE: We present all results as percentages.
Respondents by Education Level
Sample Less Than High School High School Some College College Graduate
ALP (n = 3,407) 3.4 13.7 36.3 46.6
KnowledgePanel (n = 8,148) 12.8 28.5 28.8 29.9
Total 10.0 24.1 31.0 34.8
NOTE: We present all results as percentages.

53
Respondents by Marital Status
Sample Married or Living with a Partner Separated Divorced Widowed Never Married
ALP (n = 3,407) 57.3 2.8 15.9 6.3 17.7
KnowledgePanel (n = 8,148) 63.6 1.7 10.3 5.1 19.3
Total 61.8 2.0 11.9 5.5 18.8
NOTE: We present all results as percentages.
Respondents by Number of Household Members
Sample 1 2 3 4 5 6 7 8 9 10 11 12
ALP (n = 3,407) 23.9 38.2 14.8 12.2 6.0 2.6 1.2 0.4 0.3 0.2 0.1 —
KnowledgePanel (n = 8,148)
19.0 39.6 17.3 13.7 6.2 2.9 0.8 0.3 0.2 0.1 — —
Total 20.5 39.2 16.6 13.2 6.1 2.8 0.9 0.3 0.2 0.1 — —
NOTE: We present all results as percentages.
Respondents by Level of Family Income, in Dollars
Sample Missing Less Than
10,000 10,000–24,999
25,000–49,999
50,000–74,999
75,000–99,999
100,000 or More
ALP (n = 3,407) 0.6 6.8 15.1 24.8 21.0 10.4 21.3
KnowledgePanel (n = 8,148)
— 6.4 14.2 23.0 18.6 14.0 23.9
Total 0.2 6.5 14.4 23.5 19.3 12.9 23.2
NOTE: We present all results as percentages.
Respondents’ Work Status
Sample
Working as a Paid
Employee
Working Self-
Employed
Not Working—on Temporary
Layoff
Not Working—Looking for
Work
Not Working—
Retired
Not Working—Disabled
Not Working—
Other
ALP (n = 3,407) 49.5 7.0 0.9 6.2 23.1 6.6 6.8
KnowledgePanel (n = 8,148)
48.1 6.7 0.7 6.3 22.2 7.4 8.5
Total 48.5 6.8 0.8 6.3 22.5 7.2 8.0
NOTE: We present all results as percentages.


55
References
Acosta, Joie D., Margaret D. Whitley, Linnea Warren May, Tamara Dubowitz, Malcolm V. Williams, and Anita Chandra, Stakeholder Perspectives on a Culture of Health: Key Findings, Santa Monica, Calif.: RAND Corporation, RR-1274-RWJ, 2016.
ALP—See RAND American Life Panel.
American National Election Studies, “2008 Time Series Study,” data set, c. 2009. As of January 4, 2016: http://www.electionstudies.org/studypages/anes_timeseries_2008/anes_timeseries_2008.htm
———, “2012 Time Series Study,” data set, c. 2013. As of January 4, 2016: http://www.electionstudies.org/studypages/anes_timeseries_2012/anes_timeseries_2012.htm
Behavioral Risk Factor Surveillance System, 2010 Behavioral Risk Factor Surveillance System Questionnaire, November 18, 2009. As of January 4, 2016: http://www.cdc.gov/brfss/questionnaires/pdf-ques/2010brfss.pdf
Bishop, Felicity, and Lucy Yardley, “The Development and Initial Validation of a New Measure of Lay Definitions of Health: The Wellness Beliefs Scale,” Psychology and Health, Vol. 25, No. 3, March 2010, pp. 271–287.
BRFSS—See Behavioral Risk Factor Surveillance System.
Chandra, Anita, Joie Acosta, Katherine Carman, Tamara Dubowitz, Laura C. Leviton, Laurie Martin, Carolyn E. Miller, Christopher Nelson, Tracy Orleans, Margaret E. Tait, Matthew D. Trujillo, Vivian Towe, Douglas Yeung, and Alonzo L. Plough, Building a National Culture of Health: Background, Action Framework, Measures and Next Steps, Santa Monica, Calif.: RAND Corporation, RR-1199-RWJ, forthcoming.
Chavis, D. M., K. S. Lee, and J. D. Acosta, Sense of Community Index 2 (SCI-2): Background, Instrument, and Scoring Instructions, paper presented at the second International Conference on Community Psychology, Lisboa, June 2008. As of December 22, 2015: http://www.communityscience.com/pdfs/Sense%20of%20Community%20Index-2%28SCI-2%29.pdf
Deming, W. Edwards, Statistical Adjustment of Data, New York: Wiley, 1943.
Deville, Jean-Claude, Carl-Erik Särndal, and Olivier Sautory, “Generalized Raking Procedures in Survey Sampling,” Journal of the American Statistical Association, Vol. 88, No. 423, September 1993, pp. 1013–1020.
ESS—See European Social Survey.

56
European Social Survey, “Variables and Questions, ESS6-2012,” in European Social Survey, European Social Survey Round 6 2012/2013, ed. 2.1, 2014. As of January 4, 2016: http://www.europeansocialsurvey.org/docs/round6/survey/ESS6_appendix_a7_e02_1.pdf
Feldman, Stanley, “Structure and Consistency in Public Opinion: The Role of Core Beliefs and Values,” American Journal of Political Science, Vol. 32, No. 2, 1988, pp. 416–440.
Gallant, Mary P., “The Influence of Social Support on Chronic Illness Self-Management: A Review and Directions for Research,” Health Education and Behavior, Vol. 30, No. 2, April 2003, pp. 170–195.
GfK, “GfK KnowledgePanel,” undated. As of December 22, 2015: http://www.gfk.com/us/solutions/consumer-panels/pages/gfk-knowledgepanel.aspx
Gould, Stephen J., “Consumer Attitudes Toward Health and Health Care: A Differential Perspective,” Journal of Consumer Affairs, Vol. 22, No. 1, Summer 1988, pp. 96–118.
———, “Health Consciousness and Health Behavior: The Application of a New Health Consciousness Scale,” American Journal of Preventive Medicine, Vol. 6, No. 4, 1990, pp. 228–237.
Harvard School of Public Health, Americans’ Health Agenda: Topline Findings Priorities and Performance Ratings—Overall Survey Results: September 19–October 2, 2011, 2011. As of December 22, 2015: http://www.rwjf.org/en/library/research/2011/09/americans--health-agenda.html
Huppert, Felicia A., Nic Marks, Andrew Clark, Johannes Siegrist, Alois Stutzer, Joar Vittersø, and Morten Wahrendorf, “Measuring Well-Being Across Europe: Description of the ESS Well-Being Module and Preliminary Findings,” Social Indicators Research, Vol. 91, No. 3, May 2009, pp. 301–315.
Lee, Sun Young, Hyunseo Hwang, Robert Hawkins, and Suzanne Pingree, “Interplay of Negative Emotion and Health Self-Efficacy on the Use of Health Information and Its Outcomes,” Communication Research, Vol. 35, No. 3, June 2008, pp. 358–381.
Leip, David, “2012 Presidential General Election Results,” Dave Leip’s Atlas of U.S. Presidential Elections, c. 2012. As of January 6, 2016: http://uselectionatlas.org/RESULTS/national.php?year=2012&f=0&off=0&elect=0
McAuley, Edward, Gerald J. Jerome, Steriani Elavsky, David X. Marquez, and Suzanne N. Ramsey, “Predicting Long-Term Maintenance of Physical Activity in Older Adults,” Preventive Medicine, Vol. 37, No. 2, August 2003, pp. 110–118.
National Alliance for Caregiving and United Healthcare, The Evercare Survey of the Economic Downturn and Its Impact on Family Caregiving, April 28, 2009. As of December 22, 2015: http://www.caregiving.org/data/EVC_Caregivers_Economy_Report%20FINAL_4-28-09.pdf

57
NORC—See NORC at the University of Chicago.
NORC at the University of Chicago, National Social Life, Health, and Aging Project wave 2 public-use file, version 1, May 19, 2014. As of January 6, 2016: http://www.norc.org/PDFs/NSHAP/NSHAP%20W2%20PUF%20User%20Memo.pdf
———, American Health Values Segmentation Study, 2015.
Pew Research Center, Health Tracking survey, September 2012.
Plough, Alonzo L., “Building a Culture of Health: A Critical Role for Public Health Services and Systems Research,” American Journal of Public Health, Vol. 105, Suppl. 2, April 2015, pp. S150–S152.
Plough, Alonzo, Anita Chandra, Penny Bolla, Laura Leviton, Carolyn Miller, C. Tracy Orleans, Tejal Shah, Margaret Tait, Matthew Trujillo, Joie Acosta, Katherine Carman, Tamara Dubowitz, Laurie Martin, Christopher Nelson, Gery Ryan, Blair Smith, Vivian Towe, Malcolm Williams, and Douglas Yeung, From Vision to Action: A Framework and Measures to Mobilize a Culture of Health, Princeton, N.J.: Robert Wood Johnson Foundation, 2015. As of December 22, 2015: http://www.rwjf.org/content/dam/files/rwjf-web-files/Research/2015/From_Vision_to_Action_RWJF2015.pdf
RAND American Life Panel, “Welcome to the ALP Data Pages,” undated. As of December 22, 2015: https://alpdata.rand.org/
Robert, Stephanie A., and Bridget C. Booske, “US Opinions on Health Determinants and Social Policy as Health Policy,” American Journal of Public Health, Vol. 101, No. 9, September 2011, pp. 1655–1663.
Robert Wood Johnson Foundation, Culture of Health home page, undated (a). As of December 22, 2015: http://www.cultureofhealth.org/
———, “A New Vision of Health in America,” undated (b). As of December 22, 2015: http://www.cultureofhealth.org/en/about.html
———, “Building a Culture of Health: A Message from Risa Lavizzo-Mourey, President and CEO,” c. 2014. As of January 4, 2016: http://www.rwjf.org/content/rwjf/en/library/annual-reports/presidents-message-2014.html
RWJF—See Robert Wood Johnson Foundation.

58
Snell, William E., Jr., Georgette Johnson, Paul J. Lloyd, and M. Wayne Hoover, “The Health Orientation Scale: A Measure of Psychological Tendencies Associated with Health,” European Journal of Personality, Vol. 5, No. 2, April 1991, pp. 169–183.
Umberson, Debra, and Jennifer Karas Montez, “Social Relationships and Health: A Flashpoint for Health Policy,” Journal of Health and Social Behavior, Vol. 51, Suppl., 2010, pp. S54–S66.
U.S. Bureau of Labor Statistics, American Time Use Survey: 2013 Results, Washington, D.C., June 18, 2014. As of January 6, 2016: http://www.bls.gov/news.release/archives/atus_06182014.htm
U.S. Census Bureau, “Current Population Survey (CPS),” last revised October 15, 2015. As of December 22, 2015: https://www.census.gov/programs-surveys/cps/data-detail.html