development of the partition coefficient (kd) test …...2 science report partition coefficient (kd)...
TRANSCRIPT

w w w.environment-agency.gov.uk
Development of the partitioncoefficient (Kd) test method for usein environmental risk assessments
Science Report SC020039/4

Science Report Partition coefficient (Kd) test method for environmental risk assessments2
The Environment Agency is the leading public body protecting andimproving the environment in England and Wales.
It’s our job to make sure that air, land and water are looked after byeveryone in today’s society, so that tomorrow’s generations inherit acleaner, healthier world.
Our work includes tackling flooding and pollution incidents, reducingindustry’s impacts on the environment, cleaning up rivers, coastalwaters and contaminated land, and improving wildlife habitats.
This report is the result of research commissioned and funded by theEnvironment Agency’s Science Programme.
Published by:Environment Agency, Rio House, Waterside Drive, Aztec West,Almondsbury, Bristol, BS32 4UDTel: 01454 624400 Fax: 01454 624409www.environment-agency.gov.uk
ISBN: 1 844 32275 0
© Environment Agency July 2005
All rights reserved. This document may be reproduced with priorpermission of the Environment Agency.
The views expressed in this document are not necessarilythose of the Environment Agency.
This report is printed on Cyclus Print, a 100% recycled stock,which is 100% post consumer waste and is totally chlorine free.Water used is treated and in most cases returned to source inbetter condition than removed.
Further copies of this report are available from:The Environment Agency’s National Customer Contact Centreby emailing [email protected] or bytelephoning 08708 506506.
Author:John AdeyNational Laboratory Service, Environment Agency,Starcross Laboratories, Exeter, Devon.
Keywords:risk assessment, partion co-efficient, Kd, hydrogeology,leachate
Statement of use:This report presents a review of an existing test method todetermine Kd for ammonium to soils and aquifer materials(R&D TR P340), and thereafter describes the developmentand validation of a Kd test method for other commoncontaminants including heavy metals, polycyclic aromatichydrocarbons (PAHs), anions and volatile organiccompounds (VOCs).
Environment Agency project manager:Jonathan Smith: Science Group (Air, Land and Water)
Environment Agency reviewer:Dr Hugh Potter
Science Project reference:SC020039/4 (P1-500/4)
Product Code:SCHO0705BJIZ-E-P

Science Report Partition coefficient (Kd) test method for environmental risk assessments 3
Science at the Environment Agency
Science underpins the work of the Environment Agency, by providing an up to dateunderstanding of the world about us, and helping us to develop monitoring toolsand techniques to manage our environment as efficiently as possible.
The work of the Science Group is a key ingredient in the partnership betweenresearch, policy and operations that enables the Environment Agency to protectand restore our environment.
The Environment Agency’s Science Group focuses on five main areas of activity:
• Setting the agenda: To identify the strategic science needs of the EnvironmentAgency to inform its advisory and regulatory roles.
• Sponsoring science: To fund people and projects in response to the needsidentified by the agenda setting.
• Managing science: To ensure that each project we fund is fit for purpose andthat it is executed according to international scientific standards.
• Carrying out science: To undertake the research itself, by those best placed todo it - either by in-house Environment Agency scientists, or by contracting it outto universities, research institutes or consultancies.
• Providing advice: To ensure that the knowledge, tools and techniquesgenerated by the science programme are taken up by relevant decision-makers,policy makers and operational staff.
Professor Mike Depledge Head of Science

Science Report Partition coefficient (Kd) test method for environmental risk assessments4
EXECUTIVE SUMMARYRecent environmental legislation, such as the Environmental Protection Act 1990,Groundwater Regulations 1998, Pollution Prevention and Control Regulations 2000, theLandfill Regulations 2002 and the Water Framework Directive, includes requirements forenvironmental risk assessment as part of the permitting process. The Government hasissued guidance on environmental risk assessment and management (DETR et al.,2000) and the Environment Agency is seeking to ensure that each of its regulatoryprocesses adhere to the tiered approach to environmental risk assessment describedtherein.
The Environment Agency has published guidance for the waste management andcontaminated land sectors on methods to assess pollution risks from their activities towater, and in particular groundwater (Environment Agency, 1999, 2001, 2003).Groundwater risk assessment requires an understanding and evaluation of the fate andtransport of substances in the subsurface, and an estimate of the probability andmagnitude of the likely impact that would result from any entry of pollutants.
The fate of pollutants in the subsurface is subject to a number of controls, but thevelocity with which they migrate relative to water is influenced by retardation processes,including a number of different sorption processes. The Environment Agency previouslydeveloped a standard test method to determine ammonium partitioning between landfillleachate and rock, which was published as R&D Technical Report P340 (EnvironmentAgency, 2000). The project reported here sought to develop the partition coefficient (Kd)test method to include a wider range of the substances commonly found oncontaminated sites.
Partition coefficients for ammonium are derived using relatively simple batch tests. Theaim of this project is to maintain this simplicity, while making the necessary refinementsto the ammonium methodology for the other contaminants under study. This shouldensure sufficient consistency between different laboratories that might carry out Kdmeasurements in the future.
The substances considered in this study are:
• Heavy metals (using arsenic, cadmium, lead and zinc as examples);• Major anions (sulphate);• Volatile organic compounds – benzene, toluene, xylene, tetrachloroethene (PCE) and
trichloroethene (TCE);• Polycyclic aromatic hydrocarbons (PAHs) – naphthalene and benzo[a]pyrene;• Pesticides (mecoprop, diazinon, isoproturon and cypermethrin).
This report presents the results of laboratory method development and validation, andrecommends modifications to the ammonium Kd test method to make it applicable to awider range of substances.
Key words: Partition coefficient, Kd, test method, retardation, groundwater pollution

Science Report Partition coefficient (Kd) test method for environmental risk assessments 5
TABLE OF CONTENTSEXECUTIVE SUMMARY...................................................................................................51. INTRODUCTION .......................................................................................................61.1 Partition Coefficients (Kd)........................................................................................6
1.2 Principle..................................................................................................................7
1.3 Project Aims ...........................................................................................................8
2. MATERIALS...............................................................................................................92.1 Instrumentation.......................................................................................................9
2.1.1 Orion pH probe ...........................................................................................................92.1.2 Polycarbonate tubes (30 ml) and glass screw-cap vials (40 ml) ........................92.1.3 Heraeus sepatech centrifuge....................................................................................92.1.4 Amicon centriprep cells (30,000 daltons membrane) ...........................................92.1.5 Rugged rotators ..........................................................................................................9
2.2 Reagents ................................................................................................................9
2.2.1 Preparation of rock sample .......................................................................................92.2.2 Preparation of synthetic groundwater ...................................................................102.2.3 Preparation of contaminant solutions ....................................................................10
3. METHODS ...............................................................................................................113.1 Ammonium review experimental procedure .........................................................113.2 Kd determination for arsenic, cadmium, lead and zinc: experimental procedure ..123.3 Kd determination for sulphate – experimental procedure......................................12
3.4 Kd determination for mecoprop (MCPP), diazinon and isoproturon – experimental procedur................................................................................................................13
3.5 Kd determination for cypermethrin and benzo[a]pyrene – experimental procedure..13
3.6 Kd determination for benzene, toluene, total xylene, trichloroethene,tetrachloroethene and naphthalene– experimental procedure.........................................14
4. RESULTS.................................................................................................................155. CONCLUSIONS.......................................................................................................176. REFERENCES ........................................................................................................20APPENDIX 1: SOLUTIONS USED .................................................................................21APPENDIX 2: ANALYTICAL RESULTS...........................................................................25
Science Report Partition coefficient (Kd) test method for environmental risk assessments6
1. INTRODUCTIONThe Environment Agency has previously published a test method to determine partitioncoefficients (Kd) for ammonium to geological materials, for use in landfill riskassessments. This work was undertaken by the British Geological Survey (BGS) and themethod is published, along with its validation, as Environment Agency R&D TechnicalReport P340 (Environment Agency, 2000). This report was commissioned to meet aspecific need within the waste function to assess the migration of ammonium as part oflandfill risk assessments, using models such as LandSim (Environment Agency, 2003).
Partition coefficients are being used increasingly in contaminated soil and/orgroundwater risk assessments as a result of guidance published by the EnvironmentAgency and others in recent years, such as the Remedial Targets Methodology/P20(Environment Agency, 1999) and RBCA [risk-based corrective action] (American Societyfor Testing Materials, 1998). However, little work has been done to validate the testmethod for contaminants other than ammonium. The objective of this project was toextend the ammonium Kd methodology to a range of other common soil contaminants, tomake suitable refinements to the analytical procedures where necessary and to validatethose methods through repeat analytical testing.
1.1 Partition Coefficients (Kd)A partition (or distribution) coefficient, Kd, describes the distribution of a species betweena solid and aqueous matrix after equilibration. In groundwater risk assessments, the Kdvalue describes the degree of sorption of a particular species in the leachate and/orgroundwater to the soil or rock that is in contact with that liquid. Partition coefficients areexpressed in units of l/kg, or ml/g (volume/mass).
Sorption mechanisms include ion exchange (in particular cation exchange) and surfacecomplexation. For organic contaminants sorption is often affected in a significant way byonly two factors: the hydrophobicity of the contaminant and the fraction of organic carbonin the solid phase.
For organic compounds considered to follow a linear sorption model, the relationship inEquation (1) is commonly assumed:
OCOCd fKK .= (1)
where: KOC = organic carbon partition coefficient, ml/gfOC = fraction of organic carbon, unitless.
The measured or calculated partition coefficient, Kd, can subsequently be used to predictthe effects of retardation on the velocity and travel times of the contaminants beinginvestigated. Substances subject to sorption processes migrate through an aquifersystem more slowly than the water or a conservative (non-reactive) substance.Understanding the likely contaminant velocity allows the assessor to locate monitoringboreholes in the most appropriate locations, predict the imminence of any risks to

Science Report Partition coefficient (Kd) test method for environmental risk assessments 7
receptors and instigate a timely response. The contaminant velocity can be predictedfrom the relationship in Equation (2):
fRvu = (2)
where Rf is given by Equation (3):
+=
e
df n
KR
ρ.1 (3)
and u = contaminant velocity, m/sv = groundwater velocity, m/sRf = retardation factor, ml/gρ = soil or aquifer bulk density, kg/m3
ne = effective porosity, unitless.
1.2 PrincipleThe Kd values for the different contaminants are derived using batch testing. To a tube isadded an amount of crushed rock sample under investigation (typically 1–10 g).Synthetic groundwater is added to the tube (typically 25–40 ml). The tubes are placed ona rotator and rotated through 360° for a period of 72 hours. This is the pre-equilibrationstage and it ensures all exchange reactions have taken place before the addition of thecontaminant under study. The contaminant is then added to the rock–solution mixture (atthe required concentration1) and rotated for a further 48 hours. This is the equilibrationstage. The equilibration time varies depending on the contaminant and, where possible,it should be determined by conducting tests with different contact times.
The purpose of this study, however, is to produce a method for Kd determination, andtherefore individual equilibration times were not investigated. This study has notinvestigated the kinetics of sorption.
The mass of contaminant added is known and, using the analytical techniques availablein the laboratory, the mass remaining in solution after equilibration can be determined.Therefore, the mass of contaminant that has sorbed onto the rock sample can becalculated. The different parameters are put into Equation (4) to derive the individual Kdvalues for the contaminant under investigation:
×
−
=MV
FFIKd (4)
where: I = initial contaminant concentration, mg/lF = final contaminant concentration, mg/lV = volume of liquid, lM = mass of solid, kg.
1 Contaminant concentrations should be representative of the conditions present within the contaminatedsoil or aquifer under assessment.

Science Report Partition coefficient (Kd) test method for environmental risk assessments8
1.3 Project AimsThe aims of this project are:
• Complete review of the BGS ammonium methodology (Environment Agency, 2000)for six reference lithologies, to ensure that this method can be replicated inEnvironment Agency laboratories.
• To validate and refine the ammonium method for sulphate, which was selected asrepresentative of anions present on contaminated sites.
• To validate and refine the ammonium method for arsenic, cadmium, lead and zinc,which were selected as representative of the heavy metals present on contaminatedsites.
• Refinement and validation of the ammonium method for a number of organiccompounds, namely benzene, toluene, total xylene, trichloroethene (TCE),tetrachloroethene (PCE), naphthalene, benzo[a]pyrene, mecoprop (MCPP), diazinon,isoproturon and cypermethrin.
Partition coefficients were determined for each substance at three different aqueoussolute concentrations, to give an estimate of the variability of Kd over the likely pollutantconcentration ranges.

Science Report Partition coefficient (Kd) test method for environmental risk assessments 9
2. MATERIALS2.1 Instrumentation
2.1.1 Orion pH probeThe pH was measured after the pre-equilibration stage to give the ‘natural pH’. For themetals and sulphate the pH was also measured after the addition of the contaminant andafter the equilibration stage. The pH was not determined further for the organiccompounds because of the volatile nature of some of these compounds (i.e., losses tothe atmosphere while measuring the pH) and the possibility of other compounds stickingto the probe and affecting the final measurements. The Orion pH probe can measure pHto an accuracy of ±0.05 units.
2.1.2 Polycarbonate tubes (30 ml) and glass screw-cap vials (40 ml)Polycarbonate tubes (supplied by Fisher Scientific) were used during the sulphate andmetals Kd batch tests, and glass tubes (supplied by Varian) were used for the Kd batchtests for organic compounds.
2.1.3 Heraeus sepatech centrifugeThe Heraeus sepatech centrifuge was used to centrifuge the rock–solution mixtureafter the equilibration stage.
2.1.4 Amicon centriprep cells (30,000 daltons membrane)Amicon centriprep cells were the centrifugal filtration devices used to remove colloidalmaterial (supplied by Fisher Scientific).
2.1.5 Rugged rotatorsThe rotators (supplied by Camlab, Figure 2.1) were used to pre-equilibrate the crushedrock sample with the synthetic groundwater, and then to equilibrate the contaminant withthe rock–solution mixture.
2.2 Reagents
2.2.1 Preparation of rock sampleFor the review of the ammonium method, the National Laboratory Service (NLS)obtained samples of the six reference lithologies used by the BGS as part of thedevelopment and validation of the ammonium Kd method (Environment Agency, 2000).These materials were received in powder form:
• Mercia Mudstone;• Lower Oxford Clay;• Lower Chalk;• Gault Clay;• Sherwood Sandstone;• Lincolnshire Limestone.

Science Report Partition coefficient (Kd) test method for environmental risk assessments10
Figure 2.1. Rugged rotators loaded with 40 ml glass vials (volatile organics batchtesting).
For the development and application of the ammonium method to other contaminants, asample of siltstone was collected and prepared. Part of the Tredorn Slate Formation, thislithology is described as a silver–green, finely laminated siltstone, showing post-diagenetic folding and striations. Bedding planes were approximately 20 mm apart, inplaces flaggy. It was collected from national grid reference SX 053 894, near Tintagel,Cornwall.
About 10 kg of this siltstone was received in a slate form, which was all crushed down toa 3-4 mm particle size using a laboratory jaw crusher. It was then further reduced using atema mill. The final particle size varied from approximately 1 mm down to <200 µm.Before use for batch testing the ground siltstone was homogenised for 24 hours on aroller.
The moisture content of the siltstone was negligible, and no dry matter adjustment wasnecessary during the studies. The organic carbon content (foc) of the siltstone wasdetermined, using an in-house ash test method, to be 1.05 percent.
2.2.2 Preparation of synthetic groundwaterTo ensure no other interference, ultra high purity water (UHP) was used to make up thesynthetic groundwater. Sodium chloride was added to the UHP to simulate the ionicpotential of groundwater – a 0.03M solution was used.
2.2.3 Preparation of contaminant solutionsAll the contaminants studied were prepared using certified reference materials and eitherUHP or pesticide and/or headspace grade solvents (see Appendix 1 for details).

Science Report Partition coefficient (Kd) test method for environmental risk assessments 11
3. METHODS3.1 Ammonium review experimental procedureTwo contaminant concentrations were studied: 10 mg/l and 40 mg/l.
Twelve polycarbonate tubes (30 ml) with screw caps were weighed and recorded.
The rock (10 g) under study was added to eight of the tubes each. The weight ofsolid added was recorded. This was followed by the addition of 24 ml of syntheticgroundwater to each of the eight tubes, the weight of which was recorded. The fourremaining tubes served as positive controls, to which only the synthetic groundwater wasadded and no solid (rock sample). All twelve tubes were placed on the rotator at 36revolutions per minute (rpm) for a period of 72 hours. This was the pre-equilibrationprocess.
All tubes were then removed and allowed to settle, and the pH of the supernatant wasmeasured and recorded.
To each of three tubes (containing solid) was added a 1 ml aliquot of ammonium (250mg/l), which is equivalent to 10 mg/l after dilution in 25 ml of groundwater. To a furtherthree tubes (containing solid) was added a 1 ml aliquot of ammonium (1000 mg/l), whichis equivalent to 40 mg/l after dilution in 25 ml groundwater. To the two remaining tubes(containing solid) a 1 ml portion of groundwater was added – these were blanks. Theweight of all the 1 ml portions added were recorded. The pH of the supernatant in eachtube was recorded.
Two of the remaining tubes (containing no solid) were spiked with a 1 ml aliquot of 250mg/l ammonium. The other two (containing no solid) were spiked with a 1 ml aliquot of1000 mg/l ammonium.
All twelve tubes were placed on the rotator for 48 hours. This was the equilibrationprocess.
The tubes were then removed and centrifuged for 5 minutes at 2500 rpm. Thesupernatant from each tube was transferred to clean tubes and the pH was measuredand recorded for each (this transfer to clean tubes is only to allow the followingacidification stage, and is not necessary for the other contaminants under study). Theglass tubes used for the organic contaminants under study were centrifuged at 1900rpm, because of possible breakage at higher speeds.
The supernatant was acidified with one drop of 8M HCl (this prevents the loss ofammonium as ammonia gas). The pH was re-measured and recorded. The acidificationstage is unique to the ammonium method and is not necessary for the othercontaminants under study.
Finally, the supernatant from each of the tubes was poured into separate Amiconcentriprep cells. The cells were then centrifuged at 2700 rpm for 15 minutes. The filtratesfrom each cell were added to clean polycarbonate tubes.

Science Report Partition coefficient (Kd) test method for environmental risk assessments12
The ammonium concentration in each tube was measured using an Aqua 800 accordingto the in-house method of analysis AQUA 001, details of which are available on request(see Appendix 2 for data).
The above was undertaken for each of the six lithologies.
Also, a chemical wash was performed on each lithology to assess the chemical contentof the groundwater after pre-equilibration. A chemical wash was also carried out for thesiltstone (see Appendix 2 for data).
3.2 Kd determination for arsenic, cadmium, lead andzinc: experimental procedureThree contaminant concentrations were studied: 10 mg/l, 50 mg/l and 100 mg/l.
Scoping tests were performed for each contaminant, so as to ascertain the most suitablesolid–solution ratio to use in the batch testing. Where possible, a solid–solution ratio waschosen that resulted in between 25 percent and 75 percent sorption from the aqueous tosolid phases. This increases the accuracy of the Kd measurement. For a givencontaminant the ratio of the mass of solid material to liquid may be different dependingon the concentration being studied.
During batch testing no adjustment to the above ammonium methodology wasnecessary.
The cadmium, lead and zinc samples were analysed according to the in-house methodPE0002, using an inductively coupled plasma optical-emission spectrometer, for whichdetails are available on request (see Appendix 2 for data).
The arsenic samples were analysed according to the in-house method PE4001, usingflow injection hydride analysis and atomic absorption spectrometry, for which details areavailable on request (see Appendix 2 for data).
3.3 Kd determination for sulphate – experimentalprocedureThree contaminant concentrations were studied: 125 mg/l, 250 mg/l and 500 mg/l.
Scoping tests were performed before batch testing. No adjustment to the ammoniummethodology was necessary.
The sulphate samples were analysed according to the in-house method SKA003, usingcontinuous flow analysis, details of which are available on request (see Appendix 2 fordata).
Science Report Partition coefficient (Kd) test method for environmental risk assessments 13
3.4 Kd determination for mecoprop (MCPP), diazinonand isoproturon – experimental procedureThree contaminant concentrations were studied: 10 µg/l, 50 µg/l and 100 µg/l.
Scoping tests were performed first. Instead of polycarbonate tubes, glass screw-cap 40ml tubes were used. This was to minimise interactions between the contaminant and thetube itself. Instead of adding 1 ml portions of the contaminant to each tube as above, 10µl was added because the spiking solution has to be made up in acetone and not UHP(this facilitates dissolving the organic contaminants in the groundwater). The 10 µlsolvent spiking volume is negligible when added to 25 ml of groundwater.
The pH was measured after the pre-equilibration stage only.
After the filtration of the samples using the centriprep cells, they were set-up for analysisusing the in-house methodology. A volume was taken from each tube and added toseparate 1 l aliquots of UHP in glass pyrex bottles. The volume added depends on theinitial concentration of the contaminant under study, and on the calibration range of thein-house method used to analyse the final contaminant concentration. Typically formecoprop, spiked initially at 100 µg/l, 2ml of the final supernatant was added to 998ml ofUHP. It was then ready for quantitative analysis.
The above are the only deviations from the ammonium method.
The mecoprop samples were analysed according to the in-house method SX020, usingGas Chromatography Mass Spectrometry (GCMS), for which details are available onrequest (see Appendix 2 for data).
The diazinon samples were analysed according to in-house method SX007, usingGCMS, for which details are available on request (see Appendix 2 for data).
The isoproturon samples were analysed according to in-house method SX009, usingLiquid Chromatography Mass Spectrometry (LCMS), for which details are available onrequest (see Appendix 2 for data).
3.5 Kd determination for cypermethrin andbenzo[a]pyrene – experimental procedureThe same experimental procedure was adopted for cypermethrin and benzo[a]pyrene,as for the above organic substances. However, insufficient quantities were left in solutionafter the centriprep stage to detect by analysis, because of the very hydrophobic natureof these two compounds. It is therefore assumed that they are not mobile and wouldnormally be strongly retarded by the soil and/or rock. Through the positive controls (norock present) it was also determined that these compounds partition strongly to the glassof the tubes and, in particular, to the centriprep cells and/or membranes. Therefore, a Kdexperimental procedure based on the simple ammonium method used here is notrecommended for cypermethrin or benzo[a]pyrene.

Science Report Partition coefficient (Kd) test method for environmental risk assessments14
3.6 Kd determination for benzene, toluene, total xylene,trichloroethene, tetrachloroethene and naphthalene–experimental procedureThree contaminant concentrations were studied: 0.1 mg/l, 1.0 mg/l and 10 mg/l.
Scoping tests were performed first, for which 40 ml screw-cap glass tubes were used.After the addition of the rock sample, it is imperative that there is no headspace volume,so enough groundwater has to be added to minimise the headspace volume sufficiently(typically, with 10 g of rock, 38 ml of groundwater is required). Owing to the volatilenature of these compounds there could be significant losses from the aqueous and/orsolid phases to air if the relative headspace volume is significant.
The pH is not measured, to avoid volatilisation of the substances during themeasurement procedure. The ‘natural’ pH could be obtained, if required, by pre-equilibrating a separate tube solely for this purpose, decanting off the supernatant andthen measuring the pH.
The spiking volume of the different contaminants is 10.86 µl, which is negligiblecompared to the 38 ml into which they are spiked.
The centriprep stage is performed immediately after the equilibration process to minimiseany losses caused by volatilisation, if for example, the samples were left to standovernight. During the centriprep stage the samples are exposed to the atmosphere,which results in losses of each contaminant through volatilisation. To correct for this,positive controls are run in duplicate at each concentration level, but are not put throughthe centriprep stage. These are compared with positive controls (run in duplicate at eachconcentration level) that are put through the centriprep stage, and a factor can then beapplied.
It is important after the centriprep stage to promptly set-up the samples for analysis withminimal headspace volume. Typically for the 1 mg/l concentration, 1.4 ml of the filtrate isadded to 40.6 ml of UHP in another 40 ml glass tube (this occupies the neck spacevolume of the tube, and keeps any headspace to an absolute minimum). This should bedone immediately after the centriprepping process. This dilution also ensures thatquantification is within the calibration range of the in-house methodology used to finallyanalyse the samples
The above are the only deviations from the ammonium method.
The samples are now ready for analysis according to the in-house method SX022 usingGCMS with a purge and trap sampling system, for which details are available on request(see Appendix 2 for data).

Science Report Partition coefficient (Kd) test method for environmental risk assessments 15
4. RESULTSAll the data from each of the batch tests is presented In Appendix 2 and the calculatedKd values are summarised in Tables 4.1 and 4.2. The variability of Kd with soluteconcentrations are shown graphically in Figure 4.1. These results demonstrate theapplicability of the method to contaminants other than ammonium.
These results are not intended to be used as a database of acceptable values for anyspecific risk assessment. Values obtained from detailed site specific or laboratoryinvestigation will always be preferred for use in groundwater risk assessments.
Table 4.1 Comparison of Kd values for ammonium reported by the BGS andEnvironment Agency NLS for reference lithologies
Average Kd (ml/g) BGS Average Kd (ml/g) NLSAmmoniumconcentration
~10 mg/l ~40 mg/l ~10 mg/l ~40 mg/l
Gault Clay 6.91 6.28 5.55 5.40Sherwood Sandstone 1.79 1.72 2.23 1.68Mercia Mudstone 7.78 5.49 6.59 5.41Lincolnshire Limestone 0.77 0.66 0.33 0.29Lower Chalk 1.63 1.20 1.67 1.36Lower Oxford Clay 1.48 2.27 1.02 2.40
Table 4.2 Summary of average Kd values determined for selected contaminants acrossexperimental concentration ranges (Cornish siltstone sample)
Initial soluteconcentration
10µg/l
50µg/l
0.1mg/l
1 mg/l 10 mg/l 50mg/l
100mg/l
125mg/l
250mg/l
500mg/l
Arsenic 17.33 5.89 2.90
Cadmium 13.60 7.26 5.48
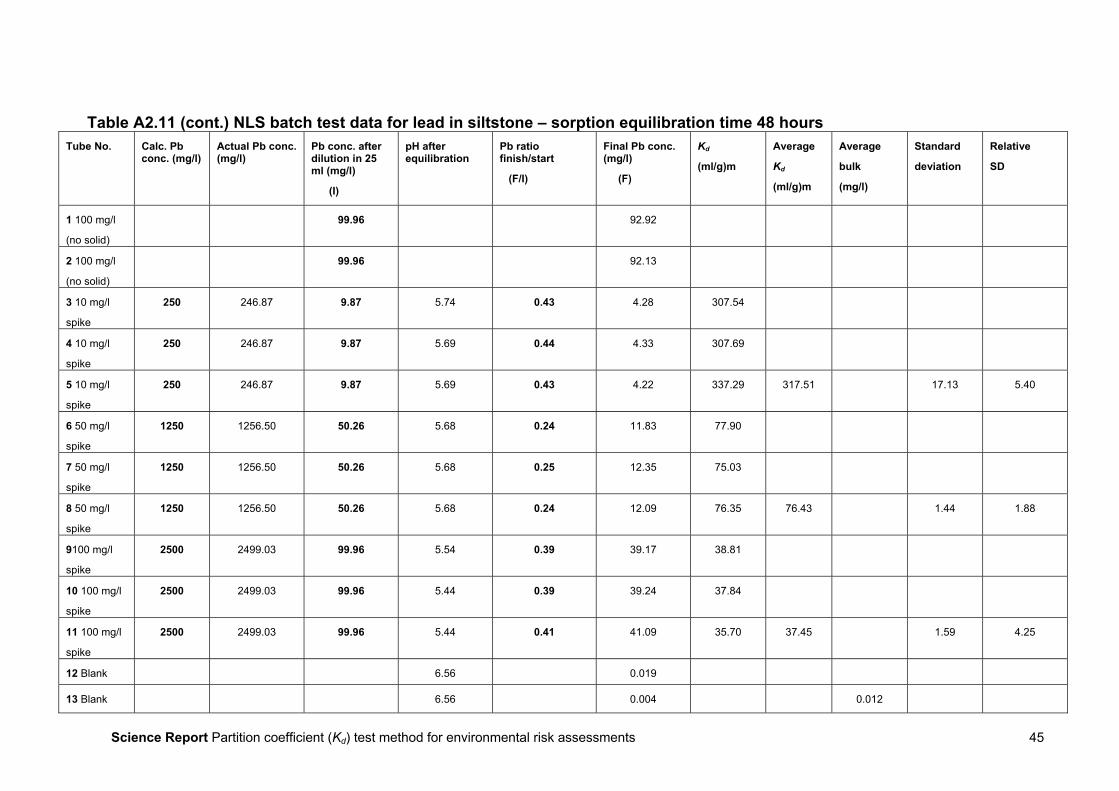
Lead 317.51 76.43 37.45
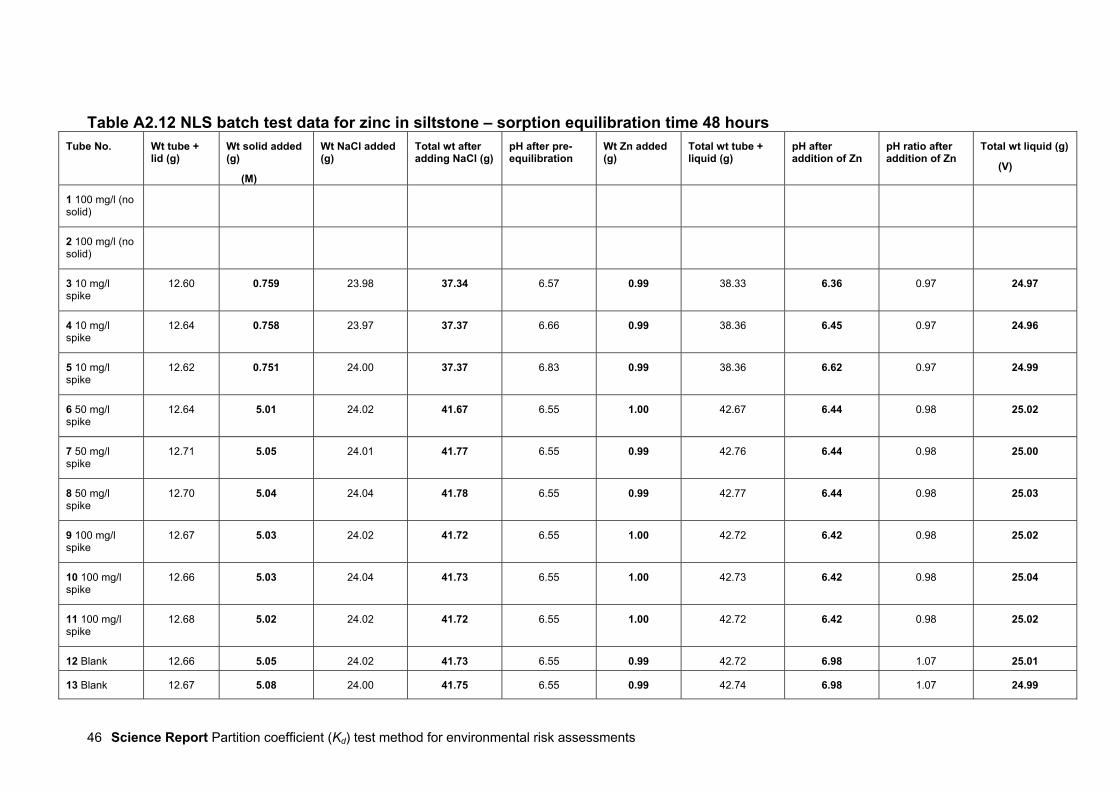
Zinc 44.63 14.23 8.01
Sulphate 0.048 0.43 0.23
Diazinon 8.79 2.62 2.16
Isoproturon ND ND 0.038
Mecoprop ND ND ND
Benzene 10.93 6.53 3.53
Naphthalene ND 0.45 0.47
Xylene (total) 12.98 6.50 2.25
Toluene 16.20 16.34 4.90
TCE 10.90 2.57 4.53
PCE 3.36 3.31 2.33ND, not determined since sorption too low to allow calculation of Kd.

Science Report Partition coefficient (Kd) test method for environmental risk assessments16
Figure 4.1. Variability of Kd with solute concentration for the Cornish siltstone. The uppergraph shows inorganic substances, the lower graph shows the organic compounds.
Inorganic compounds
0.01
0.1
1
10
100
1000
0 50 100 150
Dissolved concentration (mg/l)
Part
ition
co-
effic
ient
, Kd
(ml/g
)
arseniccadmiumleadzincsulphate
Organic compounds
02468
1012141618
0 2 4 6 8 10 12
Dissolved concentration (mg/l)
Part
ition
co-
effic
ient
, Kd
(ml/g
)
benzenenaphthalenexylenetolueneTCEPCE

Science Report Partition coefficient (Kd) test method for environmental risk assessments 17
5. CONCLUSIONSThe required amendments are summarised in Table 5.1.
When performing batch tests it is important to use the correct type of tube and/or vial.For all inorganic contaminants 30 ml screw-cap polycarbonate tubes were found to bethe most suitable. For the organic contaminants 40 ml screw-cap glass vials werepreferred. The reason for the different tubes is to minimise interactions between thecontaminant and the tube itself.
Before batch testing for each contaminant can begin, it is necessary to carry out scopingtests. These tests are used to establish the correct solid-to-solution ratio so that, wherepossible, between 25 percent and 75 percent sorption of the contaminant occurs ontothe rock (this increases the accuracy of the Kd measurement). For substances with ahigh Kd value (e.g. lead) a small solid-to-solution ratio is required, such as 1 g of rockand 25 ml of groundwater. This ensures measurable concentrations are left in solution.For the smaller Kd values a large solid-to-solution ratio is best, such as 10 g of rock and25 ml of groundwater.
For the inorganic contaminants and the non-volatile organics the batch tests operate asa three-phase system (i.e., solid, liquid and air). For the volatile organics it is imperativethat the headspace (air) is kept to an absolute minimum (ideally zero), otherwisesignificant losses of the contaminant into the vapour phase can occur.
Three contaminant concentrations were studied, so as to ascertain any variability ofsorption with solute concentration. For the four metal compounds studied there was littlelinearity between the different concentrations. For sulphate there was no sorption,because sulphate is an anionic species, and anion exchange is often not important withclay materials. Sorption of anions may be important when considering strata with ironoxyhydroxide minerals present. Also there were levels of sulphate in the groundwaterafter the pre-equilibration stage which made blank subtraction necessary.
The organic substances mecoprop and isoproturon displayed no measurable sorptiononto the siltstone. For diazinon there was some linearity of sorption. For cypermethrinand benzo[a]pyrene this experimental method was not able to produce a Kd value as aresult of the highly hydrophobic nature of these compounds. Both compounds stick to theglass tube as well as the centriprep cell. With the exception of naphthalene, the volatileorganics all showed moderate levels of sorption, with little indication of any linearity.

Science Report Partition coefficient (Kd) test method for environmental risk assessments18
Table 5.1 Summary of required amendments to published Kd test method (R&DTechnical Report P340) for groups of substances considered in this study
Substance Comment on Kd batch test methodHeavy metals Kd test method published in R&D TR P340 can be used without
modification (other than that acidification to prevent NH3production is unnecessary)
Anions Kd test method published in R&D TR P340 can be used withoutmodification (other than that acidification to prevent NH3production is unnecessary)
VOCs (BTEX) Necessary modifications to P340 method:
• use glass vials to prevent sorption to plastic test apparatus
• ensure no headspace in batch test to prevent volatilisation
VOCs (chlorinatedsolvents)
Necessary modifications to P340 method:
• use glass vials to prevent sorption to plastic test apparatus
• ensure no headspace in batch test to prevent volatilisation
SVOCs (e.g.naphthalene)
Necessary modifications to P340 method:
• use glass vials to prevent sorption to plastic test apparatus
• ensure no headspace in batch test to prevent volatilisation
Pesticides (i.e.mecoprop,isoproturon anddiazinon)
Necessary modifications to P340 method:
• use glass vials to prevent sorption to plastic test apparatus
Highly hydrophobicorganics (e.g. B[a]P,cypermethrin)
The Kd batch test method is not recommended for thesesubstances. The substances are so hydrophobic that sorption totest apparatus (e.g. membranes and glass vials) renders theanalytical results questionable.
B[a]P, benzo[a]pyrene; BTEX, benzene, toluene, ethylbenzene and xylene; SVOC, semi-volatile organiccompounds; VOC, volatile organic compounds.
Each concentration level was studied in triplicate. For some of the compounds (namelysome of the volatile organic compounds) the relative standard deviation (RSD) wasrather high (for a given concentration level). This can be attributed to analytical variabilityand the low number of replicate analyses. Also, for the organic substances the RSDs aregenerally higher than for the inorganic determinands, because of the more complexnature of organic analysis.
For the organic compounds, partition coefficient RSDs are perhaps not particularly usefulnumbers, because the concentration values themselves are mostly within the RSDtargets set for the method of analysis, which in this instance was 15 percent. Further, thistarget does not take into account the additional work involved in the production of a Kdmeasurement and that we are only evaluating a population of three Kd values. Thenature of analysis for metals and inorganic compounds results in much smaller RSDvalues.

Science Report Partition coefficient (Kd) test method for environmental risk assessments 19
Kd determinations for very high solute concentrations (e.g., volatile organics at levels inthe region of 100 mg/l, which might be present in the source area of a pollutant plumewhere non-aqueous phase liquids (NAPL) is present) would be difficult. This arises fromsolubility problems when making up what would need to be very concentrated standardsused to spike the groundwater.
The batch tests attempt to simulate the interaction of contaminated leachate orgroundwater with the soil or rock through which it is migrating. In reality, the fieldsituation is far more complex than the laboratory environment and a number of other,often competing, chemical interactions will be occurring. The laboratory set-up alsoinvolves the use of ground rock with its significantly increased surface area for sorption.However, the laboratory Kd measurements do give an indication of the level of sorptionthat can take place. This can then be used along with a number of other parameters aspart of the risk assessment process.
Future enhancements of the above methodology should include using synthetic orauthentic leachate, and studying mixtures of contaminants instead of compounds inisolation. Also, the rock sample used could be ground up to different particle sizes, and acomparison made between a coarse sample (2-4 mm) and a fine sample (<200 µm).

Science Report Partition coefficient (Kd) test method for environmental risk assessments20
6. REFERENCESAmerican Society for Testing and Materials, 1998. Standard provisional guide for riskbased corrective action. ASTM Standard PS104-98.
DETR, Environment Agency & Institute for Environment & Health, 2000. Guidelines forenvironmental risk assessment and management. The Stationery Office, London.Environment Agency (1999). Methodology for the derivation of remedial targets for soiland groundwater to protect water resources. Environment Agency R&D Publication 20.Environment Agency, Bristol.
Environment Agency (2000). CEC and Kd determination in landfill performanceevaluation. Environment Agency R&D Technical Report P340. Environment Agency,Bristol.
Environment Agency (2001). Guidance to third parties on pollution of controlled watersfor Part IIA of the EPA1990. Environment Agency Process note 07_02. EnvironmentAgency, Bristol.
Environment Agency (2003a). Hydrogeological risk assessment for landfills and thederivation of groundwater control and trigger levels. Environment Agency reportLFTGN01. Environment Agency, Bristol.
Environment Agency (2003b). LandSim release 2.5: groundwater risk assessment toolfor landfill design. National Groundwater & Contaminated Land Centre Report GW/03/09.Environment Agency, Bristol.

Science Report Partition coefficient (Kd) test method for environmental risk assessments 21
APPENDIX 1: SOLUTIONS USEDAmmonium solutions – for review experiments
1. 0.03M NaCl solution (synthetic groundwater)
To 1 l of UHP add 1.76 g of NaCl.
2. 0.1M ammonium chloride solution
To 1 l of UHP add 5.349 g of ammonium chloride.
3. 250 mg/l ammonium solution
To a 25 ml volumetric add 3.465 ml of 0.1M ammonium chloride. Make up to the markwith 0.03M NaCl solution.
4. 1000 mg/l ammonium solution
To a 25 ml volumetric add 13.859 ml of 0.1M ammonium chloride. Make up to the markwith 0.03M NaCl solution.
1 ml of solutions 3 and 4 added to 24 ml of groundwater gives ammonium concentrationsof 10 mg/l and 40 mg/l, respectively.
Arsenic, Cadmium, Lead and Zinc solutions
1. 2500 mg/l arsenic solution
To 200 ml of UHP water add 2.0823 g of sodium arsenate (Na2HAsO4.7H2O).
2. 1250 mg/l arsenic solution
To a 20 ml volumetric add 10 ml of solution 1. Make up to the mark with UHP.
3. 250 mg/l arsenic solution
To a 20 ml volumetric add 2 ml of solution 1. Make up to the mark with UHP.
4. 2500 mg/l cadmium solution
To 200 ml of UHP water add 0.8154 g of cadmium chloride (CdCl2).
5. 1250 mg/l cadmium solution
To a 20 ml volumetric add 10 ml of solution 4. Make up to the mark with UHP.
6. 250 mg/l cadmium solution

Science Report Partition coefficient (Kd) test method for environmental risk assessments22
To a 20 ml volumetric add 2 ml of solution 4. Make up to the mark with UHP.
7. 2500 mg/l lead solution
To 200 ml of UHP add 0.7993 g of lead II nitrate (Pb(NO3) 2).
8. 1250 mg/l lead solution
To a 20 ml volumetric add 10 ml of solution 7. Make up to the mark with UHP.
9. 250m g/l lead solution
To a 20 ml volumetric add 2 ml of solution 7. Make up to the mark with UHP.
10. 2500 mg/l zinc solution
To 200 ml of UHP water add 2.1990 g of zinc sulphate (ZnSO4.7H2O).
11. 1250 mg/l zinc solution
To a 20 ml volumetric add 10 ml of solution 10. Make up to the mark with UHP.
12. 250 mg/l zinc solution
To a 20 ml volumetric add 2 ml of solution 10. Make up to the mark with UHP.
1 ml of the 2500 mg/l solution added to 24 ml of groundwater gives a concentration of100 mg/l.1 ml of the 1250 mg/l solution added to 24 ml of groundwater gives a concentration of 50mg/l.1 ml of the 250 mg/l solution added to 24 ml of groundwater gives a concentration of 10mg/l.
Sulphate solutions
1. 12,500 mg/l sulphate solution
To 1 l of UHP add 22.6757 g of potassium sulphate (K2SO4).
2. 6250 mg/l sulphate solution
To a 20 ml volumetric add 10 ml of solution 1. Make up to the mark with UHP.
3. 3125 mg/l sulphate solution
To a 20 ml volumetric add 5 ml of solution 1. Make up to the mark with UHP.
1 ml of the 12,500 mg/l solution added to 24 ml of groundwater gives a concentration of500 mg/l.

Science Report Partition coefficient (Kd) test method for environmental risk assessments 23
1 ml of the 6250 mg/l solution added to 24 ml of groundwater gives a concentration of250 mg/l.1 ml of the 3125 mg/l solution added to 24 ml of groundwater gives a concentration of125 mg/l.
Mecoprop, diazinon, cypermethrin, isoproturon and benzo[a]pyrene solutions
1. 10,000 mg/l mecoprop (MCPP) solution
To 10 ml of acetone add 100 mg of Mecoprop.
2. 250 mg/l mecoprop solution
To a 20 ml volumetric add 500 µl of solution 1. Make up to the mark with acetone.
3. 125 mg/l mecoprop solution
To a 20 ml volumetric add 250 µl of solution 1. Make up to the mark with acetone.
4. 25 mg/l mecoprop solution
To a 20 ml volumetric add 50 µl of solution 1. Make up to the mark with acetone.
For compounds diazinon, cypermethrin, isoproturon and benzo[a]pyrene the exact sameformat as that for mecoprop is used. Certified reference materials were used.
10 µl of the 250 mg/l solution added to 25 ml of groundwater gives a concentration of100 µg/l.10 µl of the 125 mg/l solution added to 25 ml of groundwater gives a concentration of 50µg/l.10 µl of the 25 mg/l solution added to 25 ml of groundwater gives a concentration of 10µg/l.
Volatile organic compound solutions
1. 35,000 mg/l benzene solution
To a 10 ml volumetric add 397.73 µl of benzene. Make up to the mark with methanol.
2. 3500 mg/l benzene solution
To a 10 ml volumetric add 39.77 µl of benzene. Make up to the mark with methanol.
3. 350 mg/l benzene solution
To a 100 ml volumetric add 39.77 µl of benzene. Make up to the mark with methanol.
For the compounds toluene, total xylene, TCE and PCE the exact same format as thatfor benzene is used. However, the different densities need to be taken into account.

Science Report Partition coefficient (Kd) test method for environmental risk assessments24
Naphthalene was made up from solid material at the following levels: 17,500 mg/l (inacetone because of solubility issues), and 3500 mg/l and 350 mg/l, both in methanol.
10.86 µl of the 35,000 mg/l solution added to 38 ml of groundwater gives a concentrationof 10 mg/l.10.86 µl of the 3500 mg/l solution added to 38 ml of groundwater gives a concentrationof 1 mg/l.10.86 µl of the 350 mg/l solution added to 38 ml of groundwater gives a concentration of0.1 mg/l.

Science Report Partition coefficient (Kd) test method for environmental risk assessments 25
APPENDIX 2: ANALYTICALRESULTS

Science Report Partition coefficient (Kd) test method for environmental risk assessments26
Table A2.1 Chemical composition of 0.03M NaCl in UHP after contact with geological material for 72 hours
pH NH4mg/l
NO3mg/l
NO2mg/l
Camg/l
Mgmg/l
Namg/l
Kmg/l
HCO3mg/l
Clmg/l
SO4mg/l
Simg/l
Mnmg/l
Femg/l
Almg/l
Cdµg/l
Asµg/l
Pbmg/l
MerciaMudstone
8.03 <0.04 <0.9 <0.03 91.8 30.5 550.3 8.57 68.0 1080.0 24.7 13.2 <0.01 <0.03 0.01 <0.1 3.85 <0.002
LowerOxford Clay
7.38 3.01 <0.9 <0.03 635.6 132.1 844.6 116.4 130.0 1110.0 2468.0 15.8 0.079 <0.03 0.018 0.57 <1.0 <0.002
LowerChalk
8.09 <0.04 <0.9 0.05 90.6 16.9 636.9 16.8 51.0 1100.0 180.5 17.0 <0.01 <0.03 0.036 <0.1 <1.0 <0.002
GaultClay
7.80 0.19 2.39 0.03 180.8 41.9 507.0 51.6 64.0 1120.0 236.2 11.1 0.013 <0.03 <0.01 <0.1 1.09 <0.002
SherwoodSandstone
8.55 0.04 <0.9 <0.03 34.4 17.6 622.4 38.2 75.0 1120.0 16.8 13.6 <0.01 <0.03 0.053 <0.1 6.25 <0.002
LincolnshireLimestone 7.69 0.18 <0.9 <0.03 718.0 23.0 664.0 16.2 78.0 1100.0 1797.0 9.14 0.012 <0.03 0.037 <0.1 <1.0 <0.002
CornishSiltstone(Tredorn
SlateFormation)
6.35 1.03 0.43 <0.004 4.41 15.88 689.0 29.2 <10.0 1156.3 13.0 15.96 0.01 <0.03 0.011 0.34 2.1 <0.002

Science Report Partition coefficient (Kd) test method for environmental risk assessments 27
Table A2.2 Comparison of the Kd values for ammonium between the BGS and the NLS in various lithologies
Average Kd (ml/g) BGS Average Kd (ml/g) NLS (this study)Low spike(∼10 mg/l)
High spike(∼40 mg/l)
Low spike(∼10 mg/l)
High spike(∼40 mg/l)
Gault Clay 6.91 6.25 5.55 5.40Sherwood Sandstone 1.79 1.72 2.23 1.68Mercia Mudstone 7.78 5.49 6.59 5.41Lincolnshire Limestone 0.77 0.66 0.33 0.29Lower Chalk 1.63 1.20 1.67 1.36Lower Oxford Clay 1.48 2.27 1.02 2.40
The tables on the following pages include the raw data used to calculate the Kd values with the equation below:
×
−
=MV
FFIKd
where: I = initial contaminant concentration, mg/lF = final contaminant concentration, mg/lV = volume of liquid, lM = mass of solid, kg.
For some experiments with isoproturon (Table A2.15), mecoprop (Table A2.16), and naphthalene (Table A2.18), the final contaminantconcentration was equal to or greater than the initial contaminant concentration (F/I ≥ 1). This is due to little or no sorption and so it isnot possible to calculate a Kd value.

Science Report Partition coefficient (Kd) test method for environmental risk assessments28
Table A2.3 NLS batch test data for ammonium in Gault Clay (powder form)
Tube No. Wt tube + lid(g)
Wt solid added(g) (M)
Wt NaCl added(g)
Total wt afteradding NaCl
(g)
pH after pre-equilibrium
Wt NH4
added (g)
Total wt tube +liquid (g)
pH afteraddition of NH4
pH ratio afteraddition of NH4
Total wt liquid(g) (V)
1 +ve control
10 mg/l (no solid)
2 +ve control
10 mg/l (no solid)
3 +ve control
40mg/l (no solid)
4 +ve control
40 mg/l. (no solid)
5 Low spike
10 mg/l
12.68 10.00 24.84 47.52 7.90 0.99 48.51 7.86 0.99 25.83
6 Low spike
10 mg/l
12.65 10.02 24.85 47.52 7.88 0.99 48.51 7.86 1.00 25.84
7 Low spike
10 mg/l
12.67 10.00 24.83 47.50 7.91 0.99 48.49 7.86 0.99 25.82
8 High spike
40 mg/l
12.68 10.04 24.91 47.63 7.89 0.99 48.62 7.80 0.99 25.90
9 High spike
40 mg/l
12.71 10.02 24.86 47.59 7.88 0.99 48.58 7.80 0.99 25.85
10 High spike
40 mg/l
12.66 10.01 24.86 47.53 7.82 0.98 48.51 7.80 1.00 25.84
11 Blank 12.67 10.01 24.85 47.53 7.88 0.99 48.52 7.90 1.00 25.84
12 Blank 12.65 10.02 24.85 47.52 7.88 0.99 48.51 7.90 1.00 25.84
Science Report Partition coefficient (Kd) test method for environmental risk assessments 29
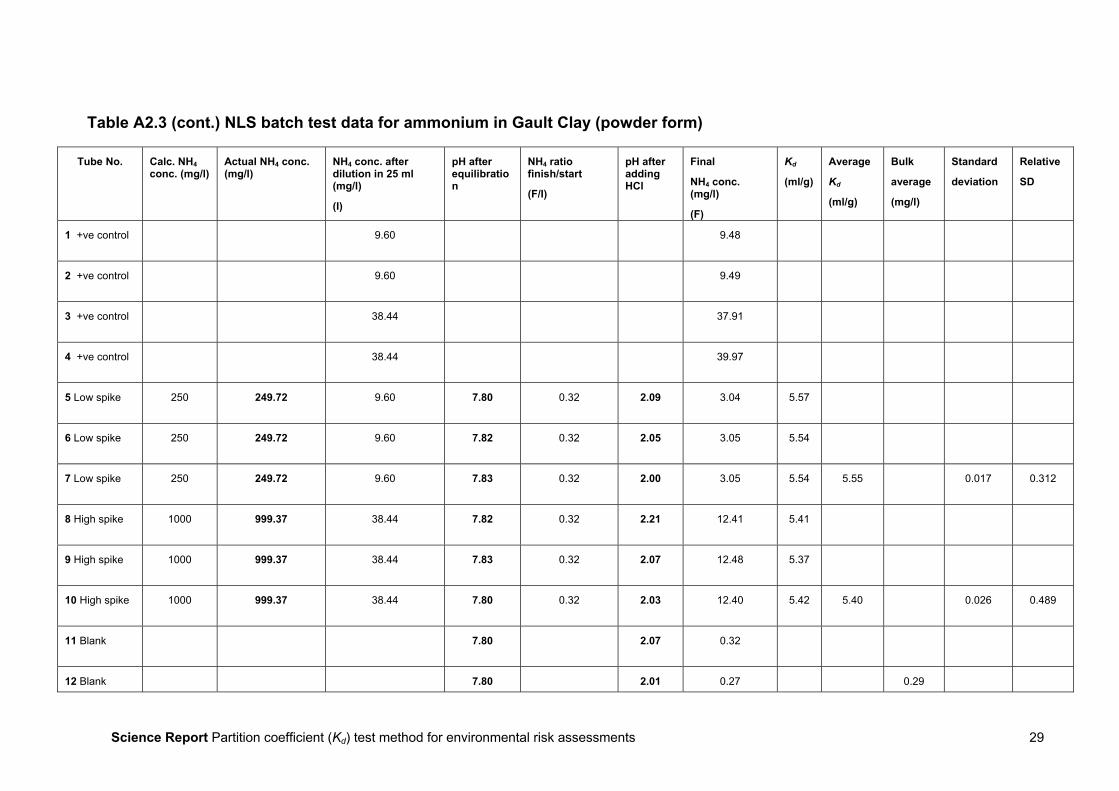
Table A2.3 (cont.) NLS batch test data for ammonium in Gault Clay (powder form)
Tube No. Calc. NH4conc. (mg/l)
Actual NH4 conc.(mg/l)
NH4 conc. afterdilution in 25 ml(mg/l)
(I)
pH afterequilibration
NH4 ratiofinish/start
(F/I)
pH afteraddingHCl
Final
NH4 conc.(mg/l)
(F)
Kd
(ml/g)
Average
Kd
(ml/g)
Bulk
average
(mg/l)
Standard
deviation
Relative
SD
1 +ve control 9.60 9.48
2 +ve control 9.60 9.49
3 +ve control 38.44 37.91
4 +ve control 38.44 39.97
5 Low spike 250 249.72 9.60 7.80 0.32 2.09 3.04 5.57
6 Low spike 250 249.72 9.60 7.82 0.32 2.05 3.05 5.54
7 Low spike 250 249.72 9.60 7.83 0.32 2.00 3.05 5.54 5.55 0.017 0.312
8 High spike 1000 999.37 38.44 7.82 0.32 2.21 12.41 5.41
9 High spike 1000 999.37 38.44 7.83 0.32 2.07 12.48 5.37
10 High spike 1000 999.37 38.44 7.80 0.32 2.03 12.40 5.42 5.40 0.026 0.489
11 Blank 7.80 2.07 0.32
12 Blank 7.80 2.01 0.27 0.29

Science Report Partition coefficient (Kd) test method for environmental risk assessments30
Table A2.4 NLS batch test data for ammonium in Lincolnshire Limestone (powder form)
Tube No. Wt tube + lid(g)
Wt solid added(g) (M)
Wt NaCl added(g)
Total wt afteradding NaCl
(g)
pH after pre-equilibration
Wt NH4
added (g)
Total wt tube &liquid (g)
pH afteraddition of NH4
pH ratio afteraddition of NH4
Total wt liquid(g) (V)
1 +ve control
10 mg/l (no solid)
2 +ve control
10 mg/l (no solid)
3 +ve control
40 mg/l (no solid)
4 +ve control 40mg/l. (no solid)
5 Low spike10 mg/l
12.67 10.08 25.06 47.81 7.58 1.00 48.81 7.58 1.00 26.06
6 Low spike
10 mg/l
12.63 10.09 25.05 47.77 7.55 0.99 48.76 7.55 1.00 26.04
7 Low spike
10 mg/l
12.67 9.96 25.02 47.65 7.58 1.00 48.65 7.58 1.00 26.02
8 High spike
40 mg/l
12.61 10.08 25.02 47.71 7.55 1.00 48.71 7.55 1.00 26.02
9 High spike
40 mg/l
12.64 10.08 25.02 47.74 7.55 1.00 48.74 7.55 1.00 26.02
10 High spike
40 mg/l
12.65 10.03 25.00 47.68 7.52 1.00 48.68 7.52 1.00 26.00
11 Blank 12.66 10.07 25.02 47.75 7.52 1.00 48.75 7.59 1.01 26.02
12 Blank 12.66 10.06 25.05 47.77 7.52 1.00 48.77 7.59 1.01 26.05

Science Report Partition coefficient (Kd) test method for environmental risk assessments 31
Table A2.4 (cont.) NLS Batch test data for ammonium in Lincolnshire Limestone (powder form)
Tube No. Calc. NH4
conc. (mg/l)
Actual NH4 conc.mg/l
NH4 conc. afterdilution in 25 ml(mg/l)
(I)
pH afterequilibration
NH4 ratiofinish/start
(F/I)
pH afteraddingHCl
Final NH4 conc.(mg/l)
(F)
Kd
(ml/g)
Average
Kd
(ml/g)
Bulk
average
(mg/l)
Standard
deviation
Relative
SD
1 +ve control 9.58 9.67
2 +ve control 9.58 9.72
3 +ve control 38.70 38.28
4 +ve control 38.70 38.31
5 Low spike 250 248.97 9.58 7.48 0.87 2.29 8.33 0.34
6 Low spike 250 248.97 9.58 7.48 0.88 2.39 8.47 0.34
7 Low spike 250 248.97 9.58 7.46 0.89 2.42 8.57 0.31 0.33 0.017 5.15
8 High spike 1000 1006.16 38.70 7.50 0.90 2.39 34.72 0.30
9 High spike 1000 1006.16 38.70 7.46 0.90 2.29 34.73 0.30
10 High spike 1000 1006.16 38.70 7.46 0.98 2.52 37.94 0.28 0.29 0.012 4.14
11 Blank 7.46 2.42 0.42
12 Blank 7.46 2.54 0.55 0.49
Science Report Partition coefficient (Kd) test method for environmental risk assessments32
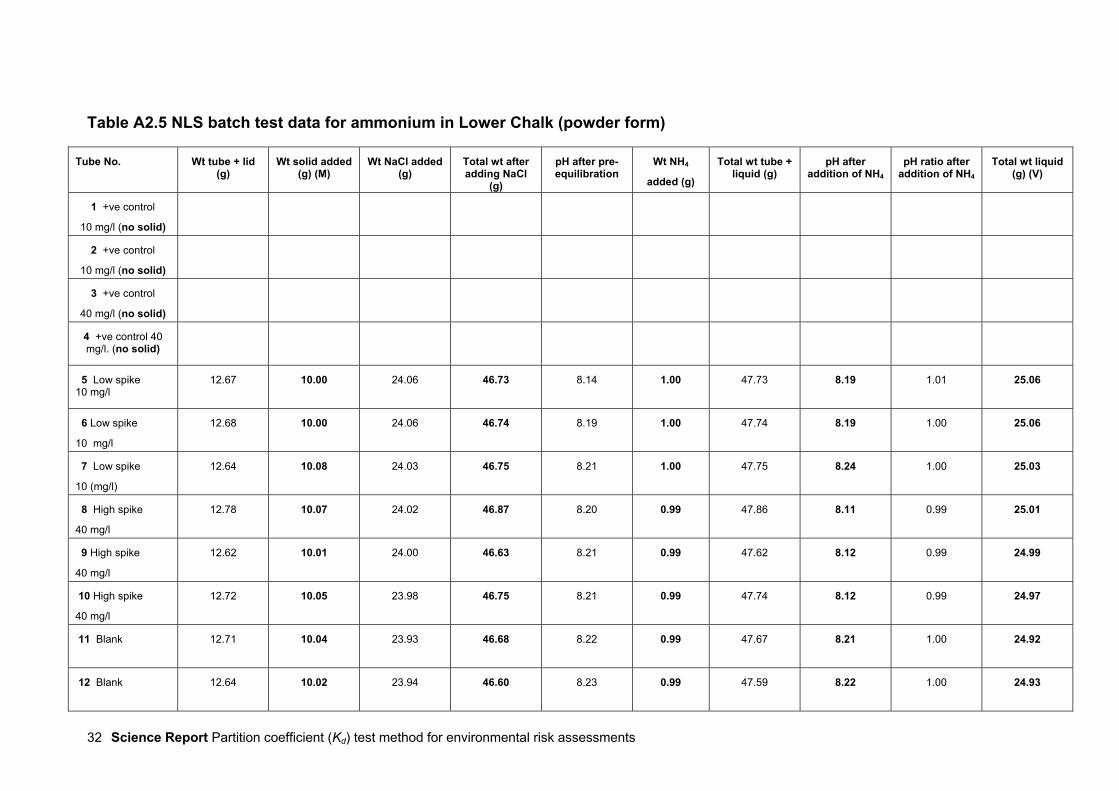
Table A2.5 NLS batch test data for ammonium in Lower Chalk (powder form)
Tube No. Wt tube + lid(g)
Wt solid added(g) (M)
Wt NaCl added(g)
Total wt afteradding NaCl
(g)
pH after pre-equilibration
Wt NH4
added (g)
Total wt tube +liquid (g)
pH afteraddition of NH4
pH ratio afteraddition of NH4
Total wt liquid(g) (V)
1 +ve control
10 mg/l (no solid)
2 +ve control
10 mg/l (no solid)
3 +ve control
40 mg/l (no solid)
4 +ve control 40mg/l. (no solid)
5 Low spike10 mg/l
12.67 10.00 24.06 46.73 8.14 1.00 47.73 8.19 1.01 25.06
6 Low spike
10 mg/l
12.68 10.00 24.06 46.74 8.19 1.00 47.74 8.19 1.00 25.06
7 Low spike
10 (mg/l)
12.64 10.08 24.03 46.75 8.21 1.00 47.75 8.24 1.00 25.03
8 High spike
40 mg/l
12.78 10.07 24.02 46.87 8.20 0.99 47.86 8.11 0.99 25.01
9 High spike
40 mg/l
12.62 10.01 24.00 46.63 8.21 0.99 47.62 8.12 0.99 24.99
10 High spike
40 mg/l
12.72 10.05 23.98 46.75 8.21 0.99 47.74 8.12 0.99 24.97
11 Blank 12.71 10.04 23.93 46.68 8.22 0.99 47.67 8.21 1.00 24.92
12 Blank 12.64 10.02 23.94 46.60 8.23 0.99 47.59 8.22 1.00 24.93

Science Report Partition coefficient (Kd) test method for environmental risk assessments 33
Table A2.5 (cont.) NLS batch test data for ammonium in Lower Chalk (powder form)
Tube No. Calc. NH4
conc. (mg/l)
Actual NH4 conc.(mg/l)
NH4 conc. afterdilution in 25 mlmg/l
(I)
pH afterequilibration
NH4 ratiofinish/start
(F/I)
pH afteraddingHCl
Final NH4 conc.(mg/l)
(F)
Kd
(ml/g)
AverageKd
(ml/g)
Bulkaverage
(mg/l)
Standard
deviation
Relative
SD
1 +ve control 9.98 9.98
2 +ve control 9.98 9.99
3 +ve control 39.82 40.35
4 +ve control 39.82 40.34
5 Low spike 250 249.38 9.98 8.11 0.62 2.26 6.21 1.52
6 Low spike 250 249.38 9.98 8.15 0.59 2.28 5.88 1.75
7 Low spike 250 249.38 9.98 8.17 0.59 2.22 5.88 1.73 1.67 0.13 7.78
8 High spike 1000 995.40 39.82 8.14 0.65 2.13 25.79 1.35
9 High spike 1000 995.40 39.82 8.15 0.64 2.47 25.53 1.40
10 High spike 1000 995.40 39.82 8.14 0.65 2.21 25.89 1.34 1.36 0.032 2.35
11 Blank 8.17 2.35 0.15
12 Blank 8.18 2.54

Science Report Partition coefficient (Kd) test method for environmental risk assessments34
Table A2.6 NLS batch test data for ammonium in Lower Oxford Clay (powder form)
Tube No. Wt tube + lid(g)
Wt solid added(g) (M)
Wt NaCl added(g)
Total wt afteradding NaCl
(g)
pH after pre-equilibration
Wt NH4
added (g)
Total wt tube +liquid (g)
pH afteraddition of NH4
pH ratio afteraddition of NH4
Total wt liquid(g) (V)
1 +ve control
10 mg/l (no solid)
2 +ve control
10 mg/l (no solid)
3 +ve control
40 mg/l (no solid)
4 +ve control
40 mg/l. (no solid)
5 Low spike
10 mg/l
12.65 10.04 24.05 46.74 7.60 1.00 47.74 7.51 0.99 25.05
6 Low spike
10 mg/l
12.74 10.00 24.08 46.82 7.61 1.00 47.82 7.52 0.99 25.08
7 Low spike
10 mg/l
12.66 10.08 24.06 46.80 7.59 1.00 47.80 7.50 0.99 25.06
8 High spike
40 mg/l
12.67 10.06 24.08 46.81 7.56 1.00 47.81 7.23 0.96 25.08
9 High spike
40 mg/l
12.67 10.00 24.06 46.73 7.58 1.00 47.73 7.25 0.96 25.06
10 High spike
40 mg/l
12.66 10.08 24.05 46.79 7.55 0.99 47.78 7.24 0.96 25.04
11 Blank 12.71 10.06 24.04 46.81 7.55 1.00 47.81 7.54 1.00 25.04
12 Blank 12.71 10.05 23.97 46.73 7.55 1.00 47.73 7.55 1.00 24.97

Science Report Partition coefficient (Kd) test method for environmental risk assessments 35
Table A2.6 (cont.) NLS Batch test data for ammonium in Lower Oxford Clay (powder form)
Tube No. Calc. NH4
conc. (mg/l)
Actual NH4 conc.(mg/l)
NH4 conc. afterdilution in 25 ml(mg/l)
(I)
pH afterequilibration
NH4 ratiofinish/start
(F/I)
pH afteraddingHCl
Final NH4 conc.(mg/l)
(F)
Kd
(ml/g)
Average
Kd
(ml/g)
Bulk
average
(mg/l)
Standard
deviation
Relative
SD
1 +ve control 9.98 9.98
2 +ve control 9.98 9.99
3 +ve control 39.82 40.35
4 +ve control 39.82 40.34
5 Low spike 250 249.38 9.98 7.30 0.77 2.44 7.73 0.73
6 Low spike 250 249.38 9.98 7.26 0.69 2.54 6.86 1.14
7 Low spike 250 249.38 9.98 7.25 0.68 2.42 6.77 1.18 1.02 0.25 24.5
8 High spike 1000 995.40 39.82 7.26 0.50 2.40 20.02 2.47
9 High spike 1000 995.40 39.82 7.23 0.50 2.52 20.09 2.46
10 High spike 1000 995.40 39.82 7.25 0.52 2.49 20.78 2.28 2.40 0.11 4.58
11 Blank 7.26 2.50 2.86
12 Blank 7.27 2.46 2.67

Science Report Partition coefficient (Kd) test method for environmental risk assessments36
Table A2.7 NLS batch test data for ammonium in Mercia Mudstone (powder form)
Tube No. Wt tube + lid(g)
Wt solid added(g) (M)
Wt NaCl added(g)
Total wt afteradding NaCl
(g)
pH after pre-equilibration
Wt NH4
added (g)
Total wt tube +liquid (g)
pH afteraddition of NH4
pH ratio afteraddition of NH4
Total wt liquid(g) (V)
1 +ve control
10 mg/l (no solid)
2 +ve control
10 mg/l (no solid)
3 +ve control
40 mg/l (no solid)
4 +ve control 40mg/l. (no solid)
5 Low spike
10 mg/l
12.65 10.01 25.02 47.68 7.96 1.00 48.68 7.86 0.99 26.02
6 Low spike
10 mg/l
12.59 9.97 25.03 47.59 7.96 1.00 48.59 7.86 0.99 26.03
7 Low spike
10 mg/l
12.67 10.07 24.98 47.72 7.98 1.00 48.72 7.88 0.99 25.98
8 High spike
40 mg/l
12.66 10.06 25.01 47.73 7.94 1.00 48.73 7.69 0.97 26.01
9 High spike
40 mg/l
12.67 10.07 24.94 47.68 7.96 1.00 48.68 7.71 0.97 25.94
10 High spike
40 mg/l
12.69 10.03 25.01 47.73 7.98 1.00 48.73 7.73 0.97 26.01
11 Blank 12.68 9.99 24.96 47.63 7.96 1.00 48.63 8.01 1.01 25.96
12 Blank 12.76 10.05 24.96 47.77 7.96 1.00 48.77 8.01 1.01 25.96

Science Report Partition coefficient (Kd) test method for environmental risk assessments 37
Table A2.7 (cont.) NLS batch test data for ammonium in Mercia Mudstone (powder form)
Tube No. Calc. NH4
conc. (mg/l)
Actual NH4 conc.(mg/l)
NH4 conc. afterdilution in 25 ml(mg/l)
(I)
pH afterequilibration
NH4 ratiofinish/start
(F/I)
pH afteraddingHCl
Final
NH4 conc.(mg/l)
(F)
Kd
(ml/g)
Average
Kd
(ml/g)
Bulk
average
(mg/l)
Standard
deviation
Relative
SD
1 +ve control 9.58 9.67
2 +ve control 9.58 9.72
3 +ve control 38.70 38.28
4 +ve control 38.70 38.31
5 Low spike 250 248.97 9.58 7.85 0.30 2.21 2.83 6.20
6 Low spike 250 248.97 9.58 7.88 0.28 2.17 2.65 6.83
7 Low spike 250 248.97 9.58 7.89 0.28 2.35 2.65 6.75 6.59 0.34 5.16
8 High spike 1000 1006.16 38.70 7.85 0.32 2.40 12.43 5.46
9 High spike 1000 1006.16 38.70 7.85 0.32 2.62 12.54 5.37
10 High spike 1000 1006.16 38.70 7.86 0.32 2.61 12.56 5.40 5.41 0.046 0.85
11 Blank 7.93 2.75 0.70
12 Blank 7.93 2.90 0.10 0.4

Science Report Partition coefficient (Kd) test method for environmental risk assessments38
Table A2.8 NLS Batch test data for Ammonium in Sherwood Sandstone (powder form)
Tube No. Wt. tube + lid(g)
Wt solid added(g) (M)
Wt NaCl added(g)
Total wt afteradding NaCl
(g)
pH after pre-equilibration
Wt NH4
added (g)
Total wt tube +liquid (g)
pH afteraddition of NH4
pH ratio afteraddition of NH4
Total wt liquid(g) (V)
1 +ve control
10 mg/l (no solid)
2 +ve control
10 mg/l (no solid)
3 +ve control
40 mg/l (no solid)
4 +ve control
40 mg/l. (no solid)
5 Low spike
10 mg/l
12.67 10.03 24.89 47.59 8.70 1.00 48.59 8.46 0.97 25.89
6 Low spike
10 mg/l
12.66 9.99 24.89 47.54 8.71 0.99 48.53 8.46 0.96 25.88
7 Low spike
10 mg/l
12.65 10.00 24.89 47.54 8.68 0.99 48.53 8.46 0.97 25.88
8 High spike
40 mg/l
12.68 10.00 24.90 47.58 8.68 0.99 48.57 8.06 0.93 25.89
9 High spike
40 mg/l
12.69 10.03 24.87 47.59 8.70 0.99 48.58 8.06 0.93 25.86
10 High spike
40 mg/l
12.65 10.06 24.89 47.60 8.70 0.99 48.59 8.06 0.92 25.88
11 Blank 12.68 10.02 24.84 47.54 8.71 0.99 48.53 8.68 1.00 25.83
12 Blank 12.65 10.04 24.92 47.61 8.71 0.99 48.60 8.68 1.00 25.91

Science Report Partition coefficient (Kd) test method for environmental risk assessments 39
Table A2.8 (cont.) NLS batch test data for ammonium in Sherwood Sandstone (powder form)
Tube No. Calc. NH4
conc. (mg/l)
Actual NH4 conc.(mg/l)
NH4 conc. afterdilution in 25 ml(mg/l)
(I)
pH afterequilibration
NH4 ratiofinish/start
(F/I)
pH afteraddingHCl
Final NH4 conc.(mg/l)
(F)
Kd
(ml/g)
Average
Kd
(ml/g)
Bulk
average
(mg/l)
Standard
deviation
Relative
SD
1 +ve control 9.60 9.48
2 +ve control 9.60 9.49
3 +ve control 38.44 37.91
4 +ve control 38.44 37.97
5 Low spike 250 249.72 9.60 8.56 0.55 2.15 5.26 2.12
6 Low spike 250 249.72 9.60 8.56 0.53 2.10 5.09 2.30
7 Low spike 250 249.72 9.60 8.56 0.53 2.09 5.11 2.27 2.23 0.096 4.32
8 High spike 1000 999.37 38.44 8.52 0.61 2.09 23.32 1.68
9 High spike 1000 999.37 38.44 8.52 0.60 2.10 23.22 1.69
10 High spike 1000 999.37 38.44 8.52 0.61 2.19 23.39 1.66 1.68 0.015 0.91
11 Blank 8.59 2.13 0.21
12 Blank 8.59 2.12 0.17 0.19

Science Report Partition coefficient (Kd) test method for environmental risk assessments40
Table A2.9 NLS batch test data for arsenic in siltstone – sorption equilibration time 48 hoursTube No. Wt tube + lid (g) Wt solid
added (g)
(M)
Wt NaCl added(g)
Total wt afteradding NaCl(g)
pH after pre-equilibration
Wt As added(g)
Total wt tube +liquid (g)
pH afteraddition of As
pH ratio afteraddition of As
Total wtliquid (g)(V)
1 100 mg/l (nosolid)
2 100 mg/l (nosolid)
3 10 mg/l spike 12.65 2.55 24.01 39.21 6.74 0.99 40.20 7.71 1.14 25.00
4 10 mg/l spike 12.72 2.51 24.04 39.27 6.73 0.99 40.26 7.72 1.15 25.03
5 10 mg/l spike 12.70 2.50 24.03 39.23 6.73 0.99 40.22 7.72 1.15 25.02
6 50 mg/l spike 12.60 7.52 24.11 44.23 6.71 0.99 45.22 7.98 1.19 25.10
7 50 mg/l spike 12.71 7.48 24.11 44.30 6.73 0.99 45.29 8.00 1.19 25.10
8 50 mg/l spike 12.60 7.54 24.05 44.19 6.72 0.99 45.18 7.99 1.19 25.04
9 100 mg/lspike
12.71 10.01 24.03 46.75 6.69 1.00 47.75 8.19 1.22 25.03
10 100 mg/lspike
12.62 10.03 24.08 46.73 6.71 1.01 47.74 8.17 1.22 25.09
11 100 mg/lspike
12.61 9.97 24.06 46.64 6.71 1.01 47.65 8.19 1.22 25.07
12 Blank 12.70 10.02 24.03 46.75 6.71 0.99 47.74 6.83 1.02 25.02
13 Blank 12.59 10.03 24.01 46.63 6.74 0.99 47.62 6.83 1.01 25.00

Science Report Partition coefficient (Kd) test method for environmental risk assessments 41
Table A2.9 (cont.) NLS batch test form for Arsenic in siltstone – sorption equilibration time 48 hoursTube No. Calc. As conc.
(mg/l)Actual As conc.(mg/l)
As conc. afterdilution in 25ml (mg/l)
(I)
pH afterequilibration
As ratiofinish/start
(F/I)
Final Asconc. (mg/l)
(F)
Kd
(ml/g)
Average
Kd
(ml/g)
Average
bulk
(mg/l)
Standard
deviation
Relative
SD
1 100 mg/l
(no solid)
100.23 94.51
2 100 mg/l
(no solid)
100.23 94.07
3 10 mg/l
spike
250 247.86 9.91 7.18 0.36 3.60 17.18
4 10 mg/l
spike
250 247.86 9.91 7.19 0.37 3.64 17.18
5 10 mg/l
spike
250 247.86 9.91 7.19 0.36 3.59 17.62 17.33 0.25 1.44
6 50 mg/l
spike
1250 1251.89 50.08 7.30 0.35 17.52 6.20
7 50 mg/l
spike
1250 1251.89 50.08 7.32 0.37 18.68 5.64
8 50 mg/l
spike
1250 1251.89 50.08 7.31 0.36 18.20 5.82 5.89 0.29 4.92
9100 mg/l
spike
2500 2505.69 100.23 7.40 0.46 46.21 2.92
10 100 mg/l
spike
2500 2505.69 100.23 7.38 0.47 46.76 2.86
11 100 mg/l
spike
2500 2505.69 100.23 7.40 0.46 46.43 2.91 2.90 0.03 1.03
12 Blank 6.84 0.0042
13 Blank 6.84 0.0028 0.0035

Science Report Partition coefficient (Kd) test method for environmental risk assessments42
Table A2.10 NLS batch test data for Cadmium in siltstone – sorption equilibration time 48 hoursTube No. Wt tube +
lid (g)Wt solid added(g)
(M)
Wt NaCladded (g)
Total wt afteradding NaCl (g)
pH after pre-equilibration
Wt Cd added(g)
Total wt tube +liquid (g)
pH afteraddition ofCd
pH ratioafteraddition ofCd
Total wt liquid (g)
(V)
1 100 mg/l (nosolid)
2 100 mg/l (nosolid)
3 10 mg/l spike 12.66 5.04 23.98 41.68 6.57 0.99 42.67 6.59 1.00 24.97
4 10 mg/l spike 12.68 5.06 24.00 41.74 6.53 0.99 42.73 6.55 1.00 24.99
5 10 mg/l spike 12.67 5.05 23.97 41.69 6.53 0.99 42.68 6.55 1.00 24.96
6 50 mg/l spike 12.72 5.04 23.98 41.74 6.53 0.99 42.73 6.56 1.00 24.97
7 50 mg/l spike 12.69 5.01 23.98 41.68 6.53 0.99 42.67 6.56 1.00 24.97
8 50 mg/l spike 12.66 5.00 23.98 41.64 6.53 0.99 42.63 6.56 1.00 24.97
9 100 mg/l spike 12.60 5.03 23.98 41.61 6.52 1.00 42.61 6.53 1.00 24.98
10 100 mg/lspike
12.60 5.00 23.96 41.56 6.52 1.00 42.56 6.53 1.00 24.96
11 100 mg/lspike
12.66 5.03 23.94 41.63 6.53 1.00 42.63 6.54 1.00 24.94
12 Blank 12.64 5.03 23.95 41.62 6.53 0.99 42.61 6.75 1.03 24.94
13 Blank 12.67 5.03 23.96 41.66 6.53 0.99 42.65 6.75 1.03 24.95

Science Report Partition coefficient (Kd) test method for environmental risk assessments 43
Table A2.10 (cont.) NLS batch test data for cadmium in siltstone – sorption equilibration time 48 hoursTube No. Calc. Cd
conc. (mg/l)Actual Cdconc. (mg/l)
Cd conc. afterdilution in 25 ml
(mg/l)
(I)
pH afterequilibration
Cd ratiofinish/start
(F/I)
Final Cd conc.(mg/l)
(F)
Kd
(ml/g)m
Average
Kd
(ml/g)m
Average
bulk
(mg/l)
Standard
deviation
Relative
SD
1 100 mg/l
(no solid)
99.56 95.77
2 100 mg/l
(no solid)
99.56 93.07
3 10 mg/l
spike
250 246.59 9.86 6.59 0.27 2.67 13.34
4 10 mg/l
spike
250 246.59 9.86 6.55 0.26 2.59 13.86
5 10 mg/l
spike
250 246.59 9.86 6.55 0.27 2.63 13.59 13.60 0.26 1.91
6 50 mg/l
spike
1250 1243.71 49.75 6.48 0.41 20.15 7.28
7 50 mg/l
spike
1250 1243.71 49.75 6.48 0.41 20.23 7.27
8 50 mg/l
spike
1250 1243.71 49.75 6.48 0.41 20.33 7.23 7.26 0.026 0.36
9100 mg/l
spike
2500 2488.9 99.56 6.41 0.48 47.93 5.35
10 100 mg/l
spike
2500 2488.9 99.56 6.41 0.49 48.87 5.18
11 100 mg/l
spike
2500 2488.9 99.56 6.42 0.46 45.43 5.91 5.48 0.38 6.93
12 Blank 6.62 0.007
13 Blank 6.62 0.02 0.014

Science Report Partition coefficient (Kd) test method for environmental risk assessments44
Table A2.11 NLS batch test data for lead in siltstone – sorption equilibration time 48 hoursTube No. Wt tube + lid
(g)Wt solidadded (g)
(M)
Wt NaCladded (g)
Total wt afteradding NaCl (g)
pH after pre-equilibration
Wt Pbadded (g)
Total wt tube +liquid (g)
pH afteraddition ofPb
pH ratio afteraddition of Pb
Total wt liquid (g)
(V)
1 100 mg/l (nosolid)
2 100 mg/l (nosolid)
3 10 mg/lspike
12.70 0.106 23.98 36.79 6.32 0.99 37.78 5.86 0.93 24.97
4 10 mg/lspike
12.66 0.104 24.01 36.77 6.27 0.99 37.76 5.81 0.93 25.00
5 10 mg/lspike
12.66 0.099 23.95 36.71 6.27 0.99 37.70 5.81 0.93 24.94
6 50 mg/lspike
12.70 1.04 23.95 37.69 6.41 0.99 38.68 6.09 0.95 24.94
7 50 mg/lspike
12.72 1.02 23.94 37.68 6.41 0.99 38.67 6.09 0.95 24.93
8 50 mg/lspike
12.74 1.03 23.92 37.69 6.41 0.99 38.68 6.09 0.95 24.91
9 100 mg/lspike
12.66 1.00 24.02 37.68 6.54 0.99 38.67 5.94 0.91 25.01
10 100 mg/lspike
12.65 1.02 23.95 37.62 6.44 0.99 38.61 5.84 0.91 24.94
11 100 mg/lspike
12.69 1.00 23.93 37.62 6.44 0.99 38.61 5.84 0.91 24.92
12 Blank 12.65 1.00 23.97 37.62 6.46 1.00 38.62 6.96 1.08 24.97
13 Blank 12.65 1.00 23.92 37.57 6.46 0.99 38.56 6.96 1.08 24.91
Science Report Partition coefficient (Kd) test method for environmental risk assessments 45
Table A2.11 (cont.) NLS batch test data for lead in siltstone – sorption equilibration time 48 hoursTube No. Calc. Pb
conc. (mg/l)Actual Pb conc.(mg/l)
Pb conc. afterdilution in 25ml (mg/l)
(I)
pH afterequilibration
Pb ratiofinish/start
(F/I)
Final Pb conc.(mg/l)
(F)
Kd
(ml/g)m
Average
Kd
(ml/g)m
Average
bulk
(mg/l)
Standard
deviation
Relative
SD
1 100 mg/l
(no solid)
99.96 92.92
2 100 mg/l
(no solid)
99.96 92.13
3 10 mg/l
spike
250 246.87 9.87 5.74 0.43 4.28 307.54
4 10 mg/l
spike
250 246.87 9.87 5.69 0.44 4.33 307.69
5 10 mg/l
spike
250 246.87 9.87 5.69 0.43 4.22 337.29 317.51 17.13 5.40
6 50 mg/l
spike
1250 1256.50 50.26 5.68 0.24 11.83 77.90
7 50 mg/l
spike
1250 1256.50 50.26 5.68 0.25 12.35 75.03
8 50 mg/l
spike
1250 1256.50 50.26 5.68 0.24 12.09 76.35 76.43 1.44 1.88
9100 mg/l
spike
2500 2499.03 99.96 5.54 0.39 39.17 38.81
10 100 mg/l
spike
2500 2499.03 99.96 5.44 0.39 39.24 37.84
11 100 mg/l
spike
2500 2499.03 99.96 5.44 0.41 41.09 35.70 37.45 1.59 4.25
12 Blank 6.56 0.019
13 Blank 6.56 0.004 0.012
Science Report Partition coefficient (Kd) test method for environmental risk assessments46
Table A2.12 NLS batch test data for zinc in siltstone – sorption equilibration time 48 hoursTube No. Wt tube +
lid (g)Wt solid added(g)
(M)
Wt NaCl added(g)
Total wt afteradding NaCl (g)
pH after pre-equilibration
Wt Zn added(g)
Total wt tube +liquid (g)
pH afteraddition of Zn
pH ratio afteraddition of Zn
Total wt liquid (g)
(V)
1 100 mg/l (nosolid)
2 100 mg/l (nosolid)
3 10 mg/lspike
12.60 0.759 23.98 37.34 6.57 0.99 38.33 6.36 0.97 24.97
4 10 mg/lspike
12.64 0.758 23.97 37.37 6.66 0.99 38.36 6.45 0.97 24.96
5 10 mg/lspike
12.62 0.751 24.00 37.37 6.83 0.99 38.36 6.62 0.97 24.99
6 50 mg/lspike
12.64 5.01 24.02 41.67 6.55 1.00 42.67 6.44 0.98 25.02
7 50 mg/lspike
12.71 5.05 24.01 41.77 6.55 0.99 42.76 6.44 0.98 25.00
8 50 mg/lspike
12.70 5.04 24.04 41.78 6.55 0.99 42.77 6.44 0.98 25.03
9 100 mg/lspike
12.67 5.03 24.02 41.72 6.55 1.00 42.72 6.42 0.98 25.02
10 100 mg/lspike
12.66 5.03 24.04 41.73 6.55 1.00 42.73 6.42 0.98 25.04
11 100 mg/lspike
12.68 5.02 24.02 41.72 6.55 1.00 42.72 6.42 0.98 25.02
12 Blank 12.66 5.05 24.02 41.73 6.55 0.99 42.72 6.98 1.07 25.01
13 Blank 12.67 5.08 24.00 41.75 6.55 0.99 42.74 6.98 1.07 24.99

Science Report Partition coefficient (Kd) test method for environmental risk assessments 47
Table A2.12 (cont.) NLS batch test data for zinc in siltstone – sorption equilibration time 48 hoursTube No. Calc. Zn
conc. (mg/l)Actual Zn conc.
(mg/l)Zn conc. afterdilution in 25
ml(mg/l) (I)
pH afterequilibration
Zn ratiofinish/start
(F/I)
Final Znconc. (mg/l)
(F)
Kd
(ml/g)mAverage
Kd
(ml/g)
Averagebulk
(mg/l)
Standarddeviation
RelativeSD
1 100 mg/l
(no solid)
100.44 97.47
2 100 mg/l
(no solid)
100.44 97.44
3 10 mg/l
spike
250 248.01 9.92 6.19 0.43 4.35 42.13
4 10 mg/l
spike
250 248.01 9.92 6.28 0.43 4.25 43.93
5 10 mg/l
spike
250 248.01 9.92 6.53 0.41 4.07 47.83 44.63 2.91 6.52
6 50 mg/l
spike
1250 1256.90 50.28 6.01 0.26 13.10 14.17
7 50 mg/l
spike
1250 1256.90 50.28 6.01 0.26 12.93 14.30
8 50 mg/l
spike
1250 1256.90 50.28 6.01 0.26 13.02 14.21 14.23 0.067 0.47
9100 mg/l
spike
2500 2511.12 100.44 5.86 0.39 38.71 7.93
10 100 mg/l
spike
2500 2511.12 100.44 5.86 0.38 38.47 8.02
11 100 mg/l
spike
2500 2511.12 100.44 5.86 0.38 38.35 8.07 8.01 0.071 0.89
12 Blank 6.52 0.03
13 Blank 6.52 0.013 0.022

Science Report Partition coefficient (Kd) test method for environmental risk assessments48
Table A2.13 NLS batch test data for sulphate in siltstone – sorption equilibration time 48 hours (final SO4 conc. bulkcorrected)Tube No. Wt tube +
lidWt solid
added (g)(M)
Wt NaCladded (g)
Total wt afteradding NaCl (g)
pH after pre-equilibration
Wt SO4 added (g) Total wt tube +liquid (g)
pH afteraddition of
SO4
pH ratio afteraddition of SO4
Total wt liquid(g)(V)
1 QC 500 mg/l
(no solid)
2 QC 500 mg/l
(no solid)
3 125 mg/l spike 12.68 10.03 23.98 46.69 6.32 1.00 47.69 6.42 1.02 24.98
4 125 mg/l spike 12.67 10.02 23.97 46.66 6.35 0.99 47.65 6.45 1.02 24.96
5 125 mg/l spike 12.66 9.99 23.98 46.63 6.34 1.00 47.63 6.44 1.02 24.98
6 250 mg/l spike 12.73 10.05 24.01 46.79 6.34 1.00 47.79 6.41 1.01 25.01
7 250 mg/l spike 12.71 10.03 23.96 46.70 6.32 1.00 47.70 6.39 1.01 24.96
8 250 mg/l spike 12.71 10.05 23.96 46.72 6.34 1.00 47.72 6.41 1.01 24.96
9 500 mg/l spike 12.70 10.01 23.98 46.69 6.34 1.02 47.71 6.38 1.01 25.00
10 500 mg/l spike 12.63 10.04 23.93 46.60 6.32 1.01 47.61 6.36 1.01 24.94
11 500 mg/l spike 12.67 10.01 23.95 46.63 6.39 1.01 47.64 6.43 1.01 24.96
12 Blank 12.66 10.04 23.94 46.64 6.42 0.99 47.63 6.42 1.00 24.93
13 Blank 12.73 9.98 23.89 46.60 6.42 0.99 47.59 6.42 1.00 24.88

Science Report Partition coefficient (Kd) test method for environmental risk assessments 49
Table A2.13 (cont.) NLS batch test data for sulphate in siltstone – sorption equilibration time 48 hours (final SO4 conc. bulkcorrected)
Tube No. Calc. SO4conc. (mg/l)
Actual SO4conc. (mg/l)
SO4 conc. afterdilution in 25 ml(mg/l) (I)
pH afterequilibratio
n
SO4 ratiostart/finish
(F/I)
Final SO4 conc.(mg/l)
(F)
Kd
(ml/g)mAverage Kd
(ml/g)mBulk
average(mg/l)
Standarddeviation
RelativeSD
1 QC 500 mg/l(no solid)
499.92 499
2 QC 500 mg/l(no solid)
499.92 499
3 125 mg/l spike 3125.0 3093.95 123.76 6.46 0.98 122 0.061
4 125 mg/l spike 3125.0 3093.95 123.76 6.44 0.98 123 0.041
5 125 mg/l spike 3125.0 3093.95 123.76 6.44 0.98 123 0.041 0.048
6 250 mg/l spike 6250.0 6259.33 250.37 6.38 0.90 224 0.29
8 250 mg/l spike 6250.0 6259.33 250.37 6.41 0.91 227 0.25
9 250 mg/l spike 6250.0 6259.33 250.37 6.38 0.77 192 0.75 0.43
10 500 mg/l spike 12500.0 12498.03 499.92 6.32 0.96 480 0.10
11 500 mg/l spike 12500.0 12498.03 499.92 6.32 0.86 430 0.40
12 500 mg/l spike 12500.0 12498.03 499.92 6.33 0.93 464 0.19 0.23
13 Blank 6.50 13
14 Blank 6.50 11 12.0
RSDs have not been calculated because of the small amount of sorption.
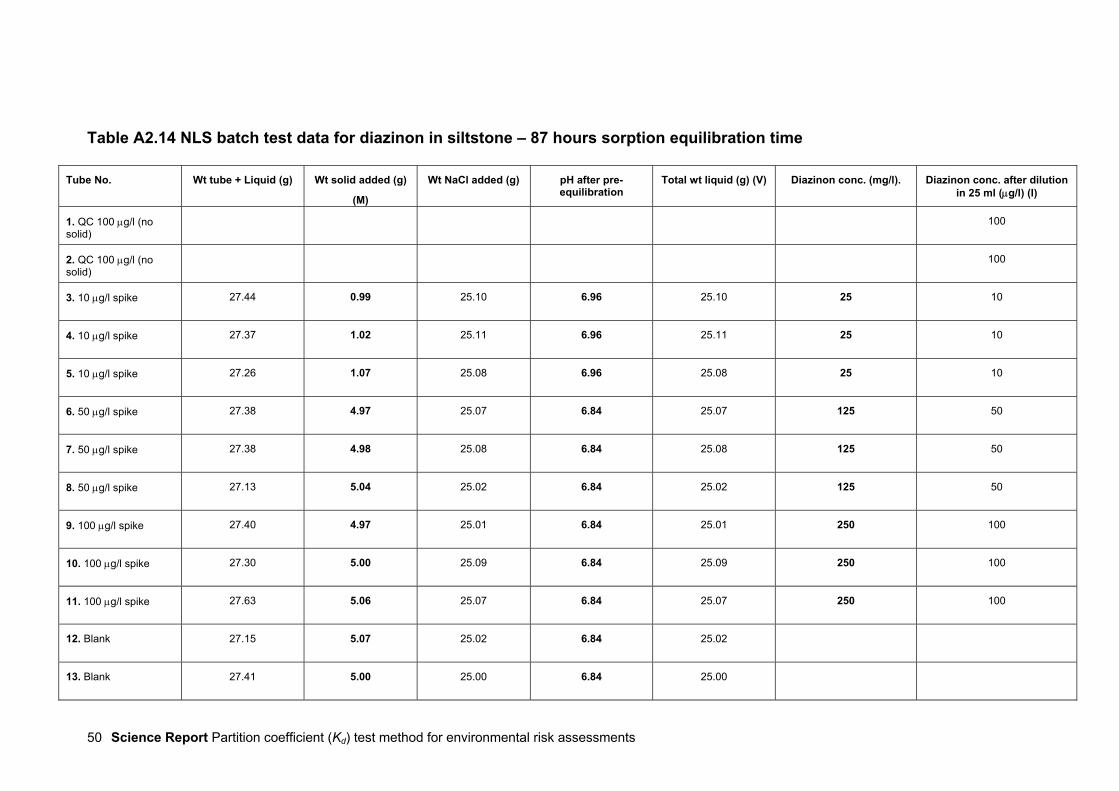
Science Report Partition coefficient (Kd) test method for environmental risk assessments50
Table A2.14 NLS batch test data for diazinon in siltstone – 87 hours sorption equilibration time
Tube No. Wt tube + Liquid (g) Wt solid added (g)
(M)
Wt NaCl added (g) pH after pre-equilibration
Total wt liquid (g) (V) Diazinon conc. (mg/l). Diazinon conc. after dilutionin 25 ml (µg/l) (I)
1. QC 100 µg/l (nosolid)
100
2. QC 100 µg/l (nosolid)
100
3. 10 µg/l spike 27.44 0.99 25.10 6.96 25.10 25 10
4. 10 µg/l spike 27.37 1.02 25.11 6.96 25.11 25 10
5. 10 µg/l spike 27.26 1.07 25.08 6.96 25.08 25 10
6. 50 µg/l spike 27.38 4.97 25.07 6.84 25.07 125 50
7. 50 µg/l spike 27.38 4.98 25.08 6.84 25.08 125 50
8. 50 µg/l spike 27.13 5.04 25.02 6.84 25.02 125 50
9. 100 µg/l spike 27.40 4.97 25.01 6.84 25.01 250 100
10. 100 µg/l spike 27.30 5.00 25.09 6.84 25.09 250 100
11. 100 µg/l spike 27.63 5.06 25.07 6.84 25.07 250 100
12. Blank 27.15 5.07 25.02 6.84 25.02
13. Blank 27.41 5.00 25.00 6.84 25.00

Science Report Partition coefficient (Kd) test method for environmental risk assessments 51
Table A2.14 (cont.) NLS batch test data for diazinon in siltstone – 87 hours sorption equilibration time
Tube No. Diazinon ratiofinish/start (F/I)
Final diazinonconc. (µg/l) (F)
Kd
(ml/g)
Average Kd
(ml/g)
Bulk
(µg/l)
Standard
deviation
Relative
SD
1. QC 100 µg/l (no solid) 88.72
2. QC 100 µg/l (no solid) 91.70
3. 10 µg/l spike 0.72 7.19 9.91
4. 10 µg/l spike 0.74 7.38 8.74
5. 10 µg/l spike 0.75 7.52 7.73 8.79 1.09 12.40
6. 50 µg/l spike 0.69 34.40 2.29
7. 50 µg/l spike 0.66 32.99 2.60
8. 50 µg/l spike 0.63 31.32 2.96 2.62 0.34 13.00
9. 100 µg/l spike 0.69 69.46 2.21
10. 100 µg/l spike 0.70 69.62 2.19
11.100 µg/l spike 0.71 70.58 2.07 2.16 0.08 3.70
12. Blank ND
13. Blank ND ND
ND, not detected.

Science Report Partition coefficient (Kd) test method for environmental risk assessments52
Table A2.15 NLS batch test data for Isoproturon in siltstone – 87 hours sorption equilibration time
Tube No. Wt tube +liquid (g)
Wt solid added (g)
(M)
Wt NaCl added (g) pH after pre-equilibration
Total wt liquid (g) (V) Isoproturon conc.(mg/l)
Isoproturon conc. afterdilution in 25 ml (µg/l) (I)
1. QC 100 µg/l (no solid) 100
2. QC 100 µg/l (no solid) 100
3. 10 µg/l spike 27.44 30.10 25.02 6.50 25.02 25 10
4. 10 µg/l spike 27.30 29.99 25.00 6.50 25.00 25 10
5. 10 µg/l spike 27.43 30.13 24.96 6.50 24.96 25 10
6. 50 µg/l spike 27.23 29.98 25.11 6.50 25.11 125 50
7. 50 µg/l spike 27.48 29.95 25.04 6.50 25.04 125 50
8. 50 µg/l spike 27.44 30.02 25.03 6.50 25.03 125 50
9. 100 µg/l spike 27.26 30.12 25.00 6.50 25.00 250 100
10. 100 µg/l spike 27.55 30.04 24.97 6.50 24.97 250 100
11. 100 µg/l spike 27.49 30.03 24.96 6.50 24.96 250 100
12. Blank 26.94 10.07 24.91 6.73 24.91
13. Blank 27.41 10.03 24.86 6.73 24.86

Science Report Partition coefficient (Kd) test method for environmental risk assessments 53
Table A2.15 (cont.) NLS batch test data for isoproturon in siltstone – 87 hours sorption equilibration time
Tube No. Isoproturon ratiofinish/start (F/I)
Final isoproturonconc. (µg/l) (F)
Kd
(ml/g)
Average Kd
(ml/g)
Bulk
(µg/l)
Standard
deviation
Relative
SD
1. QC 100 µg/l (no solid) 109.30
2. QC 100 µg/l (no solid) 105.65
3. 10 µg/l spike 1.17 11.73 <
4. 10 µg/l spike 1.13 11.27 <
5. 10 µg/l spike 1.08 10.76 <
6. 50 µg/l spike 1.07 53.72 <
7. 50 µg/l spike 1.02 50.98 <
8. 50 µg/l spike 1.03 51.69 <
9. 100 µg/l spike 0.96 96.43 0.031
10. 100 µg/l spike 0.96 95.84 0.036
11.100 µg/l spike 0.95 94.68 0.047
12. Blank ND
13. Blank ND
ND, not detected; < Kd not calculated since sorption too low.

Science Report Partition coefficient (Kd) test method for environmental risk assessments54
Table A2.16 NLS batch test data for mecoprop in siltstone – 87 hours sorption equilibration time
Tube No. Wt tube +liquid (g)
Wt solid added(g)
(M)
Wt NaCl added(g)
pH after pre-equilibration
Total wt liquid (g) (V) Mecoprop conc. (mg/l). Mecoprop conc. after dilutionin 25 ml (µg/l) (I)
1. QC 100 µg/l (no solid) 100
2. QC 100 µg/l (no solid) 100
3. 10 µg/l spike 27.43 10.00 25.04 6.73 25.04 25 10
4. 10 µg/l spike 27.09 10.06 25.01 6.73 25.01 25 10
5. 10 µg/l spike 27.34 10.06 25.00 6.73 25.00 25 10
6. 50 µg/l spike 27.22 20.07 24.98 6.67 24.98 125 50
7. 50 µg/l spike 27.38 20.01 24.94 6.67 24.94 125 50
8. 50 µg/l spike 27.40 20.07 24.94 6.67 24.94 125 50
9. 100 µg/l spike 27.49 19.97 24.90 6.67 24.90 250 100
10. 100 µg/l spike 27.16 20.03 24.97 6.67 24.97 250 100
11. 100 µg/l spike 27.16 20.04 24.93 6.67 24.93 250 100
12. Blank 27.27 10.04 24.94 6.73 24.94
13. Blank 27.26 10.07 24.90 6.73 24.90

Science Report Partition coefficient (Kd) test method for environmental risk assessments 55
Table A2.16 (cont.) NLS batch test data for mecoprop in siltstone – 87 hours sorption equilibration time
Tube No. Mecoprop ratiofinish/start (F/I)
Final mecopropconc. (µg/l) (F)
Kd
(ml/g)
Average Kd
(ml/g)
Average bulk
(µg/l)
Standard
Deviation
Relative
SD
1. QC 100 µg/l (nosolid)
111.28
2. QC 100 µg/l (nosolid)
129.40
3. 10 µg/l spike 1.10 11.04 <
4. 10 µg/l spike 1.27 12.68 <
5. 10 µg/l spike 1.10 11.00 <
6. 50 µg/l spike 0.92 45.83 0.11
7. 50 µg/l spike 1.25 62.59 <
8. 50 µg/l spike 1.00 49.87 0.003
9. 100 µg/l spike 1.04 104.09 <
10. 100 µg/l spike 1.07 106.82 <
11.100 µg/l spike 1.27 127.11 <
12. Blank ND
13. Blank ND
ND, not detected; < Kd not calculated since sorption too low.

Science Report Partition coefficient (Kd) test method for environmental risk assessments56
Table A2.17 NLS batch test data for benzene in siltstone – 48 hours sorption equilibration time
Tube No. Wt tube + liquid (g) Wt solid added (g)
(M)
Wt NaCl added (g) Total wt liquid (g) (V) Benzene conc. (mg/l) Benzene conc. afterdilution in 38 ml (mg/l)
(I)
1. QC 1.0 mg/l (nosolid)
3500 1.0
2. QC 1.0 mg/l (nosolid)
3500 1.0
3. 0.1 mg/l spike 27.56 10.07 37.83 37.83 350 0.1
4. 0.1 mg/l spike 27.61 10.01 37.83 37.83 350 0.1
5. 0.1 mg/l spike 27.65 10.03 37.81 37.81 350 0.1
6. 1.0 mg/l spike 27.49 10.04 37.82 37.82 3500 1.0
7. 1.0 mg/l spike 27.21 10.06 37.78 37.78 3500 1.0
8. 1.0 mg/l spike 27.53 10.07 37.79 37.79 3500 1.0
9. 10 mg/l spike 27.58 9.99 37.81 37.81 35000 10.0
10. 10 mg/l spike 27.52 10.00 37.83 37.83 35000 10.0
11. 10 mg/l spike 27.54 10.01 37.85 37.85 35000 10.0
12. Blank 27.70 9.97 38.00 38.00
13. Blank 27.57 10.02 37.86 37.86

Science Report Partition coefficient (Kd) test method for environmental risk assessments 57
Table A2.17 (cont.) NLS batch test data for benzene in siltstone – 48 hours sorption equilibration time
Tube No. Benzene ratiofinish/start (F/I)
Final benzeneconc. (mg/l) (F)
Kd
(ml/g)
Average
Kd
(ml/g)
Average
Koc
(ml/g OC)
Average bulk
(mg/l)
Standard
deviation
Relative
SD
1. QC 1.0 mg/l (nosolid)
0.92
2. QC 1.0 mg/l (nosolid)
0.92
3. 0.1 mg/l spike 0.25 0.025 11.27
4. 0.1 mg/l spike 0.25 0.025 11.34
5. 0.1 mg/l spike 0.27 0.027 10.19 10.93 1040.95 0.64 5.90
6. 1.0 mg/l spike 0.35 0.35 7.00
7. 1.0 mg/l spike 0.43 0.43 4.98
8. 1.0 mg/l spike 0.33 0.33 7.62 6.53 621.90 1.38 21.14
9. 10 mg/l spike 0.51 5.06 3.70
10. 10 mg/l spike 0.53 5.31 3.34
11.10 mg/l spike 0.52 5.16 3.55 3.53 336.19 0.18 5.12
12. Blank ND
13. Blank ND ND
ND, not detected.

Science Report Partition coefficient (Kd) test method for environmental risk assessments58
Table A2.18 NLS batch test data for naphthalene in siltstone – 48 hours sorption equilibration time
Tube No. Wt tube + liquid (g) Wt solid added (g)
(M)
Wt NaCl added (g) Total wt liquid (g) (V) Naphthalene conc.(mg/l).
Naphthalene conc.after dilution in 38 ml
(mg/l) (I)
1. QC 1.0 mg/l (nosolid)
3500 1.0
2. QC 1.0 mg/l (nosolid)
3500 1.0
3. 0.1 mg/l spike 27.28 5.04 39.77 39.77 350 0.1
4. 0.1 mg/l spike 27.47 5.04 39.81 39.81 350 0.1
5. 0.1 mg/l spike 27.73 5.03 39.75 39.75 350 0.1
6. 1.0 mg/l spike 27.32 7.48 37.89 37.89 3500 1.0
7. 1.0 mg/l spike 27.27 7.51 37.83 37.83 3500 1.0
8. 1.0 mg/l spike 27.43 7.48 37.78 37.78 3500 1.0
9. 10 mg/l spike 27.44 10.08 37.77 37.77 17500 10.0
10. 10 mg/l spike 27.40 10.01 37.72 37.72 17500 10.0
11. 10 mg/l spike 27.49 10.06 37.73 37.73 17500 10.0
12. Blank 27.53 5.04 39.65 39.65
13. Blank 27.44 5.03 39.72 39.72

Science Report Partition coefficient (Kd) test method for environmental risk assessments 59
Table A2.18 (cont.) NLS batch test data for naphthalene in siltstone – 48 hours sorption equilibration time
Tube No. Naphthalene ratiofinish/start (F/I)
Final naphthaleneconc. (mg/l) (F)
Kd
(ml/g)
Average
Kd
(ml/g)
Average
Koc
(ml/g OC)
Average bulk
(mg/l)
Standard
deviation
Relative
SD
1. QC 1.0 mg/l (nosolid)
0.93
2. QC 1.0 mg/l (nosolid)
0.95
3. 0.1 mg/l spike 1.00 0.10 <
4. 0.1 mg/l spike 1.00 0.10 <
5. 0.1 mg/l spike 1.00 0.10 <
6. 1.0 mg/l spike 0.93 0.93 0.38
7. 1.0 mg/l spike 0.96 0.96 0.21
8. 1.0 mg/l spike 0.87 0.87 0.75 0.45 42.86
9. 10 mg/l spike 0.90 9.02 0.41
10. 10 mg/l spike 0.88 8.84 0.49
11.10 mg/l spike 0.88 8.78 0.52 0.47 44.76
12. Blank ND
13. Blank ND
ND, not detected; < Kd not calculated since sorption too low. RSDs have not been calculated because of the small amount of sorption.
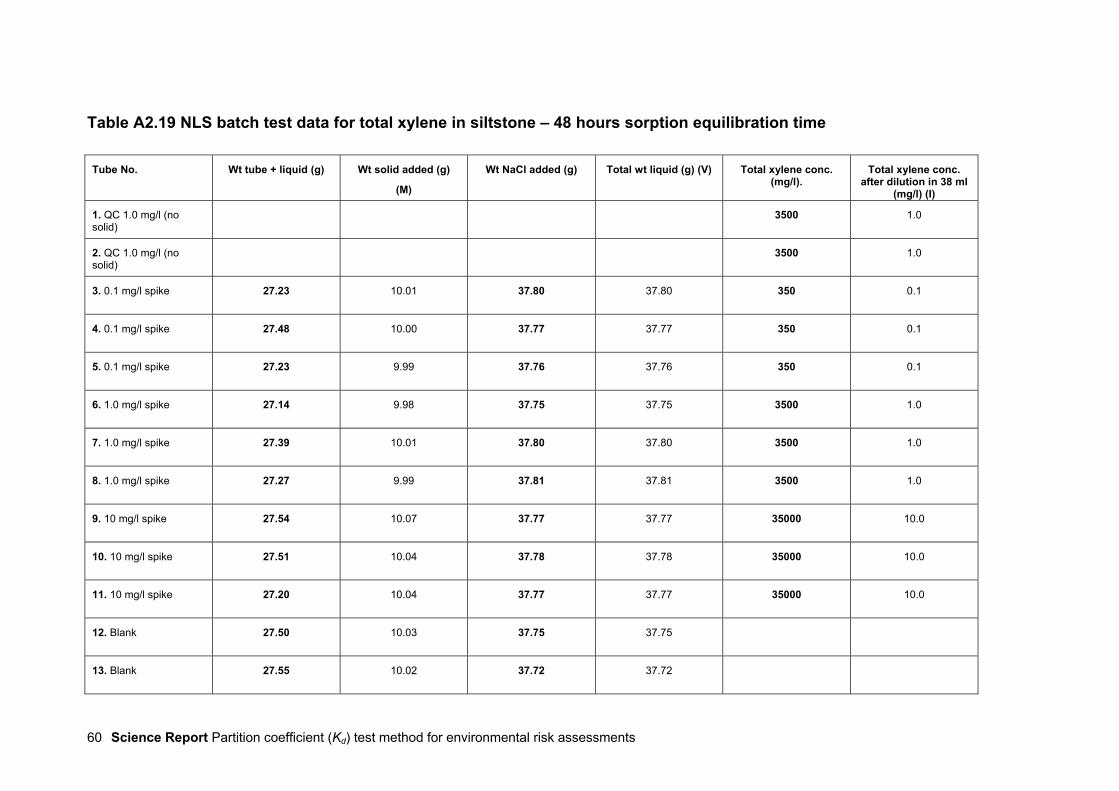
Science Report Partition coefficient (Kd) test method for environmental risk assessments60
Table A2.19 NLS batch test data for total xylene in siltstone – 48 hours sorption equilibration time
Tube No. Wt tube + liquid (g) Wt solid added (g)
(M)
Wt NaCl added (g) Total wt liquid (g) (V) Total xylene conc.(mg/l).
Total xylene conc.after dilution in 38 ml
(mg/l) (I)
1. QC 1.0 mg/l (nosolid)
3500 1.0
2. QC 1.0 mg/l (nosolid)
3500 1.0
3. 0.1 mg/l spike 27.23 10.01 37.80 37.80 350 0.1
4. 0.1 mg/l spike 27.48 10.00 37.77 37.77 350 0.1
5. 0.1 mg/l spike 27.23 9.99 37.76 37.76 350 0.1
6. 1.0 mg/l spike 27.14 9.98 37.75 37.75 3500 1.0
7. 1.0 mg/l spike 27.39 10.01 37.80 37.80 3500 1.0
8. 1.0 mg/l spike 27.27 9.99 37.81 37.81 3500 1.0
9. 10 mg/l spike 27.54 10.07 37.77 37.77 35000 10.0
10. 10 mg/l spike 27.51 10.04 37.78 37.78 35000 10.0
11. 10 mg/l spike 27.20 10.04 37.77 37.77 35000 10.0
12. Blank 27.50 10.03 37.75 37.75
13. Blank 27.55 10.02 37.72 37.72

Science Report Partition coefficient (Kd) test method for environmental risk assessments 61
Table A2.19 (cont.) NLS batch test data for total xylene in siltstone – 48 hours sorption equilibration time
Tube No. Total xyleneratiofinish/start(F/I)
Final total xyleneconc. (mg/l) (F)
Kd
(ml/g)
Average
Kd
(ml/g)
Average
Koc
(ml/g OC)
Average bulk
(mg/l)
Standard
deviation
Relative
SD
1. QC 1.0 mg/l (nosolid)
0.99
2. QC 1.0 mg/l (nosolid)
0.89
3. 0.1 mg/l spike 0.22 0.022 13.39
4. 0.1 mg/l spike 0.25 0.025 11.33
5. 0.1 mg/l spike 0.21 0.021 14.22 12.98 1236.19 1.49 11.46
6. 1.0 mg/l spike 0.35 0.35 7.02
7. 1.0 mg/l spike 0.44 0.44 4.81
8. 1.0 mg/l spike 0.33 0.33 7.68 6.50 619.05 1.50 23.13
9. 10 mg/l spike 0.64 6.35 2.16
10. 10 mg/l spike 0.44 4.44*
11.10 mg/l spike 0.62 6.17 2.34 2.25 214.29 0.13 5.66
12. Blank ND
13. Blank ND
ND, not detected; *, Faulty centriprep cell (not used for average Kd measurement).

Science Report Partition coefficient (Kd) test method for environmental risk assessments62
Table A2.20 NLS batch test data for toluene in siltstone – 48 hours sorption equilibration time
Tube No. Wt tube + liquid (g) Wt solid added (g)
(M)
Wt NaCl added (g) Total wt liquid (g) (V) Toluene conc. (mg/l) Toluene conc. afterdilution in 38 ml (mg/l)
(I)
1. QC 1.0 mg/l (nosolid)
3500 1.0
2. QC 1.0 mg/l (nosolid)
3500 1.0
3. 0.1 mg/l spike 27.40 10.04 37.83 37.83 350 0.1
4. 0.1 mg/l spike 27.40 10.05 37.78 37.78 350 0.1
5. 0.1 mg/l spike 27.46 10.01 37.91 37.91 350 0.1
6. 1.0 mg/l spike 27.39 9.98 37.89 37.89 3500 1.0
7. 1.0 mg/l spike 27.35 10.03 37.86 37.86 3500 1.0
8. 1.0 mg/l spike 27.42 9.98 37.83 37.83 3500 1.0
9. 10 mg/l spike 27.19 10.03 37.86 37.86 35000 10.0
10. 10 mg/l spike 27.35 9.99 37.82 37.82 35000 10.0
11. 10 mg/l spike 27.40 10.05 37.81 37.81 35000 10.0
12. Blank 27.65 10.05 37.75 37.75
13. Blank 27.55 9.99 37.74 37.74

Science Report Partition coefficient (Kd) test method for environmental risk assessments 63
Table A2.20 (cont.) NLS batch test data for toluene in siltstone – 48 hours sorption equilibration time
Tube No. Toluene ratiofinish/start(F/I)
Final Tolueneconc. (mg/l) (F)
Kd
(ml/g)m
Average
Kd
(ml/g)m
Average
Koc
(ml/g OC)
Average bulk
(mg/l)
Standard
Deviation
Relative
SD
1. QC 1.0 mg/l (nosolid)
0.96
2. QC 1.0 mg/l (nosolid)
0.94
3. 0.1 mg/l spike 0.17 0.017 18.40
4. 0.1 mg/l spike 0.20 0.020 15.04
5. 0.1 mg/l spike 0.20 0.020 15.15 16.20 1542.86 1.91 11.78
6. 1.0 mg/l spike 0.17 0.17 18.54
7. 1.0 mg/l spike 0.24 0.24 11.96
8. 1.0 mg/l spike 0.17 0.17 18.51 16.34 1556.19 3.79 23.20
9. 10 mg/l spike 0.53 5.29 3.36
10. 10 mg/l spike 0.34 3.43 7.25
11.10 mg/l spike 0.48 4.80 4.08 4.90 466.67 2.07 42.24
12. Blank ND
13. Blank ND ND
ND, not detected.

Science Report Partition coefficient (Kd) test method for environmental risk assessments64
Table A2.21 NLS batch test data for trichloroethene in siltstone – 48 hours sorption equilibration time
Tube No. Wt tube + liquid (g) Wt solid added (g)
(M)
Wt NaCl added (g) Total wt liquid (g) (V) Trichloroethene conc.(mg/l).
Trichloroethene conc.after dilution in 38 ml
(mg/l) (I)
1. QC 1.0 mg/l (nosolid)
3500 1.0
2. QC 1.0 mg/l (nosolid)
3500 1.0
3. 0.1 mg/l spike 27.22 9.99 37.67 37.67 350 0.1
4. 0.1 mg/l spike 27.59 9.99 37.66 37.66 350 0.1
5. 0.1 mg/l spike 27.59 10.05 37.67 37.67 350 0.1
6. 1.0 mg/l spike 27.47 10.02 37.74 37.74 3500 1.0
7. 1.0 mg/l spike 27.63 10.03 37.64 37.64 3500 1.0
8. 1.0 mg/l spike 27.66 10.02 37.65 37.65 3500 1.0
9. 10 mg/l spike 27.60 9.99 37.65 37.65 35000 10.0
10. 10 mg/l spike 27.20 10.05 37.64 37.64 35000 10.0
11. 10 mg/l spike 27.59 10.05 37.68 37.68 35000 10.0
12. Blank 27.69 9.99 37.68 37.68
13. Blank 27.36 10.03 37.68 37.68

Science Report Partition coefficient (Kd) test method for environmental risk assessments 65
Table A2.21 (cont.) NLS batch test data for trichloroethene in siltstone – 48 hours sorption equilibration time
Tube No. Trichloroetheneratio finish/start(F/I)
Final trichloroetheneconc. (mg/l) (F)
Kd
(ml/g)
Average
Kd
(ml/g)
Average
Koc
(ml/g OC)
Average bulk
(mg/l)
Standard
deviation
Relative
SD
1. QC 1.0 mg/l (nosolid)
0.93
2. QC 1.0 mg/l (nosolid)
0.93
3. 0.1 mg/l spike 0.26 0.026 10.73
4. 0.1 mg/l spike 0.26 0.026 10.73
5. 0.1 mg/l spike 0.25 0.025 11.24 10.90 1038.10 0.29 2.70
6. 1.0 mg/l spike 0.52 0.52 3.48
7. 1.0 mg/l spike 0.62 0.62 2.30
8. 1.0 mg/l spike 0.66 0.66 1.94 2.57 244.76 0.81 31.34
9. 10 mg/l spike 0.54 5.42 3.18
10. 10 mg/l spike 0.38 3.82 6.06
11.10 mg/l spike 0.46 4.63 4.35 4.53 431.43 1.45 32.00
12. Blank ND
13. Blank ND
ND, Not detected.

Science Report Partition coefficient (Kd) test method for environmental risk assessments66
Table A2.22 NLS batch test data for tetrachloroethene in siltstone – 48 hours sorption equilibration time
Tube No. Wt tube + liquid (g) Wt solid added (g)
(M)
Wt NaCl added (g) Total wt liquid (g) (V) Tetrachloroethene conc.(mg/l)
Tetrachloroethene conc.after dilution in 38 ml (mg/l)
(I)
1. QC 1.0 mg/l (nosolid)
3500 1.0
2. QC 1.0 mg/l (nosolid)
3500 1.0
3. 0.1 mg/l spike 27.51 5.01 39.82 39.82 350 0.1
4. 0.1 mg/l spike 27.35 5.06 39.78 39.78 350 0.1
5. 0.1 mg/l spike 27.46 5.07 39.78 39.78 350 0.1
6. 1.0 mg/l spike 27.15 10.01 37.84 37.84 3500 1.0
7. 1.0 mg/l spike 27.40 10.05 37.80 37.80 3500 1.0
8. 1.0 mg/l spike 27.27 10.01 37.82 37.82 3500 1.0
9. 10 mg/l spike 27.41 9.98 37.76 37.76 35000 10.0
10. 10 mg/l spike 27.35 9.99 37.76 37.76 35000 10.0
11. 10 mg/l spike 27.32 10.07 37.72 37.72 35000 10.0
12. Blank 27.29 5.03 39.71 39.71
13. Blank 27.32 4.98 39.69 39.69

Science Report Partition coefficient (Kd) test method for environmental risk assessments 67
Table A2.22 (cont.) NLS batch test data for tetrachloroethene in siltstone – 48 hours sorption equilibration time
Tube No. Tetrachloroetheneratio finish/start (F/I)
Finaltetrachloroetheneconc. (mg/l) (F)
Kd
(ml/g)
Average
Kd
(ml/g)
Average
Koc
(ml/g OC)
Average bulk
(mg/l)
Standard
deviation
Relative
SD
1. QC 1.0 mg/l (nosolid)
0.83
2. QC 1.0 mg/l (nosolid)
0.80
3. 0.1 mg/l spike 0.80 0.080 1.99
4. 0.1 mg/l spike 0.66 0.066 4.05
5. 0.1 mg/l spike 0.66 0.066 4.04 3.36 320.00 1.19 35.31
6. 1.0 mg/l spike 0.60 0.60 2.52
7. 1.0 mg/l spike 0.49 0.49 3.91
8. 1.0 mg/l spike 0.52 0.52 3.49 3.31 315.24 0.71 21.53
9. 10 mg/l spike 0.61 6.12 2.40
10. 10 mg/l spike 0.73 7.34 1.37
11.10 mg/l spike 0.54 5.38 3.22 2.33 221.90 0.93 39.78
12. Blank ND
13. Blank ND
ND, not detected.