development of the notched shear test
TRANSCRIPT

DEVELOPMENT OF THE NOTCHEDSHEAR TEST
Mikael Nygårds1,2, Christer Fellers2 and Sören Östlund1
1KTH, Department of Solid Mechanics, SE-100 44 Stockholm, Sweden2Innventia, Box 5604, SE-114 86, Stockolm, Sweden
ABSTRACT
The notched shear test (NST) will be proposed to measure shearstrength of paperboard by utilizing standard in-plane tensile test-ing equipment. The test is a further development of the doublenotch shear test specimen; where plastic lamination has been util-ized. With the new test setup it becomes possible to measure shearstrength profile in the thickness direction of paperboard. As aspin-off of the NST also the strip shear test (SST) was suggested.The SST test can be used as a quick measure of shear strength. Itis shown that the SST measurement correlates well with the trad-itional rigid shear test (RST). In order to verify that the NSTspecimen failed due to shear stresses, finite element simulationswere performed. The simulations showed that the shear zone hada uniform shear stress field at the time of failure. Moreover, withthe finite element simulations it was also possible to predict theforce-displacement curve.
1. INTRODUCTION
For paper materials the out-of-plane direction is often referred to as the Z-direction (ZD), while the paper machine direction is referred to as MD, andthe cross-machine direction is referred to as CD. The out-of-plane materialproperties of paperboard play an important role for the mechanicalbehaviour of paper materials. In converting operations such as creasing and
14th Fundamental Research Symposium, Oxford, September 2009 877
Preferred citation: M. Nygårds, C. Fellers and S. Östlund. Development of the notched shear test. In Advances in Pulp and Paper Research, Oxford 2009, Trans. of the XIVth Fund. Res. Symp. Oxford, 2009, (S.J. I’Anson, ed.), pp 877–897, FRC, Manchester, 2018. DOI: 10.15376/frc.2009.2.877.

subsequent folding of paperboard the governing mechanisms for good con-verting behaviour are deformation and damage in the out-of-plane direction.In the creasing operation the dominating deformation mechanisms is sheardeformation of the fibres and joints [1]. In printing applications, papermaterials exhibit a risk of ZD failure due to ink tack. In off-set printing thepaper has a tendency to stick to the printing cylinder when exiting the print-ing nip, while the web tension still acts in the MD direction. Hence, the paperbecomes loaded in the ZD direction, which increases the risk of delamina-tion. In many other operations, such as embossing, package forming, etc.knowledge about the out-of-plane properties are important to increase thepaper performance. For paperboard multiply structures are manufacturedcommercially. The multiply structure enables maintained or improved bend-ing stiffness with less fibres, but it also offers the possibility to engineer pro-files of properties in the thickness direction for different applications. Withthe possibility to engineer papers in the thickness direction the need to char-acterize such properties has also increased. Characterization becomes animportant tool to verify that correct processing strategies are implemented.
From general mechanical point of view the out-of-plane behaviour can bedivided into tension/compression and shear. In traditional shear testing ofpaper materials samples are glued to some kind of rigid supports, as schemat-ically illustrated in Figure 1. In the literature this has been done in by forexample the Arcan device [2, 3] the Rigid block method [4–6] and theIosipescu method [7]. The fact that paper samples need to be glued to a rigidsubstrate leads to problem when testing thin papers, normally only papermaterials with basis weights above approximately 60 g/m2 can be tested in theout-of-plane direction [8].
In the composite literature double notch tests are common to evaluateshear properties. An ASTM standard exists, which utilize the double notch
Figure 1. Schematic of rigid support shear methods; samples are glued.
Mikael Nygårds, Christer Fellers and Sören Östlund
878 Session 6: Mechanical Properties

compression test [9]. For this test finite element simulations have been per-formed in order to ensure that a uniform shear strain field is measured, c.f.[10–11]. Moreover, experiments and simulations have been performed inorder to suggest improvements of the standard, c.f. [11].
Recently Nygårds et al. [6] proposed the double notch shear (DNS) test forshear testing of paperboard. This test has the advantage that it does not relyon gluing. Instead, notches are fabricated, and a predominantly shear failureoccurs between the notches upon tensile loading of the specimen. Due to thenotches the DNS test has one major disadvantage; tensile failure can beinduced by the notches when the shear zone is too large. This limits the typesof paper that can be tested. Therefore, in this work a modified test specimen isproposed, the notched shear test (NST). The test specimen will be improvedby the utilization of plastic lamination, which will greatly improve the applic-ability of the test method. With the laminated test specimen tensile failurecan be avoided. Moreover, the effect of notch depth will be investigated. Asan extreme case the strip shear test (SST), i.e. when the notches go throughthe whole board will be investigated. This test resembles the rigid supportshear methods, which therefore will be used as a comparative verification ofthe two former test specimens. When the experimental data has been pre-sented, numerical finite element simulations will be used to show the stressdistributions along the shear zone in the NST specimen. In order to performrealistic simulations of the stresses in the specimen the paperboard elastic-plastic properties need to be characterised, and fitted to an adequate materialmodel, which also will be presented.
2. EXPERIMENTAL SETUP
Three shear tests will be presented. The first two tests originate from the DNSspecimen [6], which has been improved by plastic lamination. The third test isthe RST that was used as a comparison and verification of the other two tests.To test the different methods a commercial multiply paperboard was used.The paperboard was recently characterized by Nygårds [13] and its behavioris therefore well known.
2.1 Characterization of elastic-plastic properties
Four experimental techniques were used to characterize the elastic-plasticmaterial properties of the paperboard. To evaluate the properties as functionsof paperboard thickness the different plies were separated by grinding, andthe bottom, middle and top plies were tested separately, as described by
Development of the Notched Shear Test
14th Fundamental Research Symposium, Oxford, September 2009 879

Nygårds [13]. Each ply was characterized with respect to in-plane tension,cyclic ZD tension, cyclic ZD compression and out-of-plane shear. These testswere chosen since they are easily interpreted in term of stresses and strains,and give a good set of elastic-plastic material properties that are needed todescribe the mechanical behaviour of the material.
For the ZD tension and ZD compression tests several loading/unloadingcycles were used in order to evaluate how the elastic modulus evolves as afunction of deformation.
2.2 Notched shear test (NST)
The notched shear test (NST) specimen was manufactured by using grindingand plastic lamination. The manufacturing of the specimen started with anA4 sized paperboard with thickness h. In Figure 2 the manufacturing andtesting of one specimen is illustrated. In reality several specimens were manu-factured from each sheet. Hence, the four stages of the manufacturing andtesting procedure were:
1. The A4 sheet was ground by a 15 mm wide porous grinding wheel. Twogrooves were ground on each sheet, one from each side, and 15 mm apart.With reference to the top surface the grooves were ground down a dis-tance d. Hence, the groove from the bottom side were ground a depth h-d,such that the grooves met at the same thickness position.
2. Two pre-cut plastic sheets (Perfex gloss 250 (175/75), GMP Co. LTD.)were then positioned such that the cuts were aligned along the innergroove edges on both sides. To simplify the positioning of the plasticsheets double sided tape was used to fasten the plastic sheets locally.Thereafter the sandwich consisting of plastic sheet/paperboard/plasticsheet was put into an office laminator (Lamiart 320I).
3. The laminated sheet was cut into 15 mm wide strips. From each A4 sheetat least 10 samples were made for each thickness position.
4. All samples were tested separately in a tensile testing machine (Lorentzen& Wettre Alwetron TH1), following the standard for tensile testing [14].At peak load failure occurred between the two grooves.
It was observed that the plastic foil used in the experiments was sufficientlystrong to prevent in-plane failure, caused by the notches, during testing. Thisplastic strength reinforcement has two aspects of major interest. First of all,it was possible to notch the paperboard not just to the middle but also toother positions in the thickness direction in order to measure the out-of-planeshear strength in different plies or along the interfaces. In principle any notch
Mikael Nygårds, Christer Fellers and Sören Östlund
880 Session 6: Mechanical Properties

depth 0 < d < h could be tested. In Figure 2 the special case d = h/2 is shown.In this work, shear strength profiles in the thickness direction will be meas-ured. The second improvement due to the plastic reinforcement was that itenabled us to test longer shear zones. In fact with the tested paperboard andthe proposed geometrical parameters all specimens failed in shear.
2.3 Strip shear test (SST)
As a new complementary test also completely cut laminated paperboardswere tested. Then the paperboard samples were laminated with notched plas-tic sheets, according to the previous procedure. In Figure 3 a schematic illus-tration of this test can be seen. Since this test will load the whole paperboard,its failure will involve the weakest position in the thickness direction. There-fore this test procedure should act as a reference and verification of the NSTprocedure.
Figure 2. The manufacturing and testing procedure for the notched shear test(NST). (a) A paperboard with thickness h was the starting point, (b) two grooves wereground, (c) the paperboard was laminated with plastic, (d) the sample was tested in a
tensile testing machine, (e) failure occurred between the two grooves.
Development of the Notched Shear Test
14th Fundamental Research Symposium, Oxford, September 2009 881

2.4 Rigid shear test (RST)
In the rigid block shear test the paperboard was glued to metal blocks withphoto mounting tissue (Bienfang, ColorMount Dry Mounting Adhesive), c.f.Figure 4. The adhesive must be heated to 92°C in order to melt. If theadhesive does not melt the interface against the paperboard will not be strongenough. On the other hand if the adhesive was heated more than necessary itwould penetrate more easily into the paperboard. Glue penetration will how-ever not be an issue here since paperboard is tested; Girlanda and Fellers [8]have shown that papers down to 60 g/m2 can be tested with this glue. How-ever, to deal with these two conditions an empirical procedure was developedthat heated the glue enough, but did not heat the paperboard more thannecessary. The specimen preparation procedure that worked best followed:
1. The metal block was heated to 110°C.2. After heating the metal blocks was placed in a purpose-made rig to
ensure alignment during the gluing and reconditioning.
Figure 3. The manufacturing and testing procedure for the strip shear test (SST). (a)A paperboard with thickness h was the starting point, (b) two cuts were made, (c) thepaperboard was laminated with plastic, (d) the sample was tested in a tensile testing
machine, (e) failure occurred somewhere between the two cuts.
Mikael Nygårds, Christer Fellers and Sören Östlund
882 Session 6: Mechanical Properties

3. A sandwich consisting of two glue layers and one paperboard specimenwas centred between the loading points on the metal blocks.
4. A compressive load was applied over the specimen to enhance adhesion.5. The specimen was conditioned for at least 24 hours before the normal
pressure was removed and the specimen was tested.
The shear specimens were tested in an MTS system with displacement controland a loading rate of 0.0025 mm/s. In RST the load was applied in tension bya system of links that minimizes the risk of misalignment.
2.5 Shear stress
For all tests the force, F, was measured and the maximum shear strength wascalculated as the maximum force divided by the area of the shear zone. ForNST and SST specimens the area of the shear zone was the distance betweenthe notches multiplied by the width, i.e. 15 mm × 15 mm. For the RST speci-mens had width 20 mm and length 20 mm.
3. EXPERIMENTAL RESULTS
The SST and RST both provided a numerical value of the shear strength. Theshear strength for paperboard previously characterized by Nygårds [13] wasused to measured shear strength both in MD and CD and the average resultsare tabulated in Figure 5.
In Figure 5, box plots were used to illustrate the results. The box gives the75% confidence interval for a normal distribution. The line in the box isthe median value, and the star is the mean value. The dashed bars representthe 95% confidence interval. The plus signs outside the boxes represent
Figure 4. Schematic illustration of the manufacturing process of a rigid shear test(RST) specimen.
Development of the Notched Shear Test
14th Fundamental Research Symposium, Oxford, September 2009 883

measurements that were not considered in the normal distribution. It wasobserved that both tests gave a higher value in MD than in CD. The similaritybetween the results for the two test methods is noteworthy. For both RST andSST ten samples were tested in each direction. It was noted that the scatterwithin each measurement series was about the same as the scatter between themethods.
NST measures the shear strength locally in the thickness direction, whileSST and RST test a whole volume. Therefore, the NST was used to measureshear strength profiles in the ZD direction. Samples with different notchdepths, d, but all with shear zone length, L = 15 mm were tested. The shearstrength was measured in both MD and CD, for notch depths between d = 50μm and d = 350 μm at intervals of 15 μm, as seen in Figure 6. From the shearstrength profiles in Figure 6 it can be observed that the shear strengths in theMD in general were 10–20% higher than the measurements in the CD, whichalso was in accordance with the measurements by the SST and RST tests inTable 1.
It shall, however, be noted that the shear strengths measured by the NSTwere higher than the SST and RST measurements, therefore the effect ofnotch depth, d, was investigated to understand this observation. The results
Figure 5. Measured shear strengths in MD and CD with SST and RST.
Mikael Nygårds, Christer Fellers and Sören Östlund
884 Session 6: Mechanical Properties

Figure 6. Measured shear strength profiles in (a) MD and (b) CD.
14th Fundamental Research Symposium, Oxford, September 2009 885
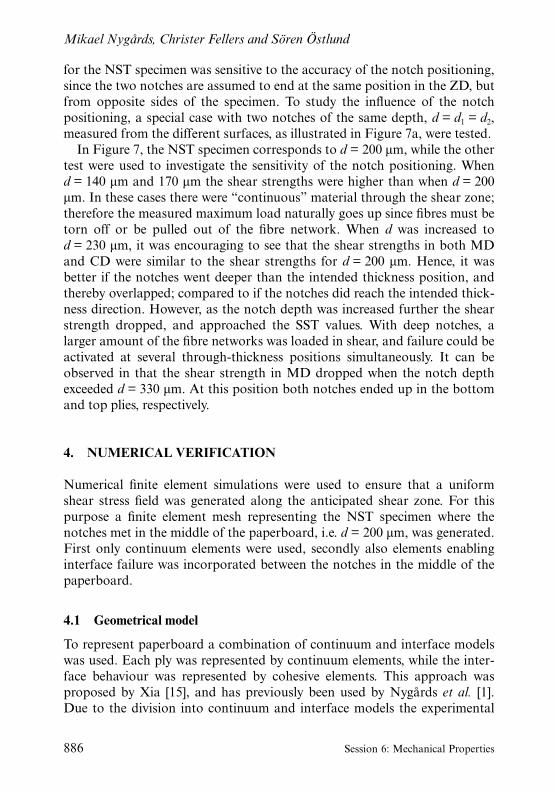
for the NST specimen was sensitive to the accuracy of the notch positioning,since the two notches are assumed to end at the same position in the ZD, butfrom opposite sides of the specimen. To study the influence of the notchpositioning, a special case with two notches of the same depth, d = d1 = d2,measured from the different surfaces, as illustrated in Figure 7a, were tested.
In Figure 7, the NST specimen corresponds to d = 200 μm, while the othertest were used to investigate the sensitivity of the notch positioning. Whend = 140 μm and 170 μm the shear strengths were higher than when d = 200μm. In these cases there were “continuous” material through the shear zone;therefore the measured maximum load naturally goes up since fibres must betorn off or be pulled out of the fibre network. When d was increased tod = 230 μm, it was encouraging to see that the shear strengths in both MDand CD were similar to the shear strengths for d = 200 μm. Hence, it wasbetter if the notches went deeper than the intended thickness position, andthereby overlapped; compared to if the notches did reach the intended thick-ness direction. However, as the notch depth was increased further the shearstrength dropped, and approached the SST values. With deep notches, alarger amount of the fibre networks was loaded in shear, and failure could beactivated at several through-thickness positions simultaneously. It can beobserved in that the shear strength in MD dropped when the notch depthexceeded d = 330 μm. At this position both notches ended up in the bottomand top plies, respectively.
4. NUMERICAL VERIFICATION
Numerical finite element simulations were used to ensure that a uniformshear stress field was generated along the anticipated shear zone. For thispurpose a finite element mesh representing the NST specimen where thenotches met in the middle of the paperboard, i.e. d = 200 μm, was generated.First only continuum elements were used, secondly also elements enablinginterface failure was incorporated between the notches in the middle of thepaperboard.
4.1 Geometrical model
To represent paperboard a combination of continuum and interface modelswas used. Each ply was represented by continuum elements, while the inter-face behaviour was represented by cohesive elements. This approach wasproposed by Xia [15], and has previously been used by Nygårds et al. [1].Due to the division into continuum and interface models the experimental
Mikael Nygårds, Christer Fellers and Sören Östlund
886 Session 6: Mechanical Properties

Figure 7. Investigation of notch positioning for the (a) NST for the special cased = d1 = d2 and the corresponding measured shear strengths as function of d in (b)
MD and (c) CD.

characterization data also need to be divided into continuum and interfacebehaviour. Hence, it was assumed that the elastic-plastic behaviour was cap-tured by the continuum elements, and the softening behaviour in ZD wascaptured by the cohesive interface elements. Therefore, the elastic stiffnesscomponents in the interface model were sufficiently stiffer than thecorresponding continuum stiffness.
To represent the NST specimen a three dimensional mesh consisting ofcontinuum elements was created in Abaqus [15]. The model was however only0.1 mm deep in the CD direction, and a plane strain condition was applied inthis direction. In the CD direction two layers of elements were used through-out the model. From a continuum mechanics viewpoint the model could aswell have been two dimensional, but experiences showed that the two dimen-sional interface models in Abaqus [12] caused numerical problems with thematerial properties for paperboard. The mesh was finer in the areas wheredeformation could be expected, i.e. in the anticipated shear zone between thenotches, as seen in Figure 8 for the right notch.
The elements representing the paperboard were divided into sets represent-ing the bottom, middle and top plies. The paperboard was 0.400 mm thick,where the bottom and top plies were assumed to be 0.090 mm. Outside thepaperboard a plastic layer with thickness 0.250 was applied one each side. InFigure 8 the mesh around one of the notches can be seen, where the differentsets have been marked. To account for the delamination behaviour in thefinite element model cohesive elements were inserted between the notches, i.e.in the middle of the paperboard, as shown in Figure 8.
4.2 Material models
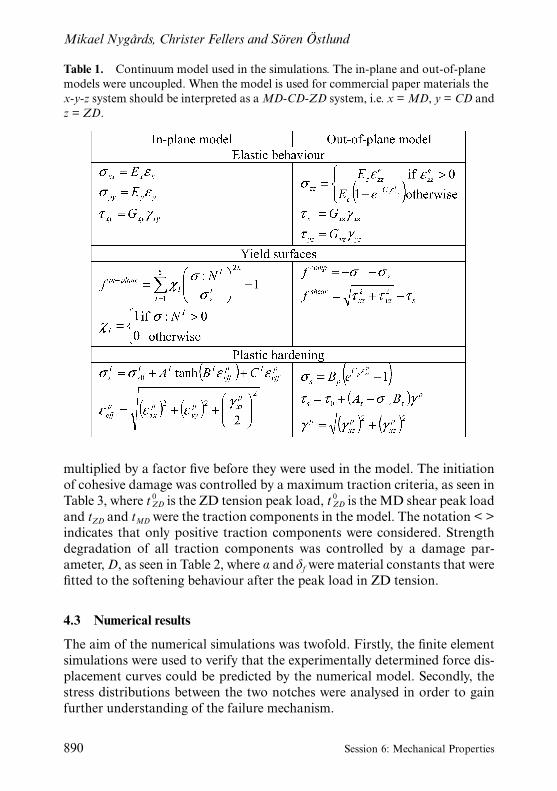
The continuum behaviour of the paperboard was represented by an aniso-tropic elastic model, which is developed by Nygårds [17] and Nygårds et al. [1]based on the observations from the experimental characterization. In thecontinuum model it was assumed that the in-plane and out-of-plane modelswere uncoupled.
Figure 8. The mesh representing the NST specimen shown around the right notch.
Mikael Nygårds, Christer Fellers and Sören Östlund
888 Session 6: Mechanical Properties

4.2.1 In-plane model
In the in-plane model a concept proposed by Xia et al. [18] consisting of fiveyield planes, in MD tension, CD tension, in-plane shear, MD compressionand CD compression with normal components NI (I = 1–5) was used to con-struct the yield surface, f in-plane, as seen in Table 2. The elastic material con-stants Ex, Ey and Gxy in the in-plane model were determined by least squarefits to the experimental [13]. The hardening associated with each plane wascontrolled by yield stress components, σI
s, where σ Is0, AI, BI and CI were
material constants that were fitted to the plastic part of the in-plane tensioncurves in [13]. In the simulations it was assumed that hardening in compres-sion was equivalent to hardening in tension.
4.2.2 Out-of-plane model
In the out-of-plane model the plastic behavior was divided into two parts; oneyield surface for compression, f comp, and one yield surface for shear, f shear, asseen in Table 1. The compressive behavior was assumed to be uncoupled fromthe shear behavior, while a normal component, σzz, was incorporated in theyield stress in shear, τs. In the out-of-plane model the elastic material con-stants Ez, Ec, Exz and Gyz were all determined by least square fits to the data in[13].
All material constants in Table 1 were determined from the experimentalcharacterization by Nygårds [13]. More details on the determination of con-stitutive parameters can be found in [1, 13, 18].
The plastic foil used for lamination was assumed to be elastic isotropic withE = 3800 MPa and ν = 0.3. The notches, whose geometry can be seen inFigure 2, were also represented by elements, although those have beenremoved in Figure 8. This approach made the model more stable, comparedto if the specimen would have been meshed around the notches. The notch“material” was assumed to be elastic isotropic with E = 0.1 MPa and ν = 0.0.
4.2.3 Cohesive properties
The interface behaviour of the paperboard was represented by an elastic-plastic cohesive behaviour that was available in Abaqus [16]. The initialthickness of the cohesive elements was zero. Therefore, the constitutive equa-tions for this model were expressed in tractions and displacements. The elasticstiffness components in MD, CD and ZD were evaluated from the ZD ten-sion and MD and CD shear tests, respectively. In order to make the interfacestiffer than that of the continuum plies, the stiffness components were
Development of the Notched Shear Test
14th Fundamental Research Symposium, Oxford, September 2009 889
multiplied by a factor five before they were used in the model. The initiationof cohesive damage was controlled by a maximum traction criteria, as seen inTable 3, where t 0
ZD is the ZD tension peak load, t 0ZD is the MD shear peak load
and tZD and tMD were the traction components in the model. The notation < >indicates that only positive traction components were considered. Strengthdegradation of all traction components was controlled by a damage par-ameter, D, as seen in Table 2, where α and δf were material constants that werefitted to the softening behaviour after the peak load in ZD tension.
4.3 Numerical results
The aim of the numerical simulations was twofold. Firstly, the finite elementsimulations were used to verify that the experimentally determined force dis-placement curves could be predicted by the numerical model. Secondly, thestress distributions between the two notches were analysed in order to gainfurther understanding of the failure mechanism.
Table 1. Continuum model used in the simulations. The in-plane and out-of-planemodels were uncoupled. When the model is used for commercial paper materials thex-y-z system should be interpreted as a MD-CD-ZD system, i.e. x = MD, y = CD andz = ZD.
Mikael Nygårds, Christer Fellers and Sören Östlund
890 Session 6: Mechanical Properties

In Figure 9 the experimental force displacement curves from ten specimenswith d = 200 μm are shown together with the result from two numerical simu-lations. In the first simulation only continuum elements were used. In thesecond simulation cohesive elements were inserted in the plane between thenotch tips. The cohesive elements will in this case account for delaminationdamage in the paperboard model. It is observed in Figure 9 that the con-tinuum model captured the experimental force-displacement curves well, butsince no delamination behaviour were present in the model, the failure couldnot be predicted. However, when the cohesive elements had been inserted thesame initial behaviour was achieved. But when the model was loaded to anelongation of about 0.5 mm, the cohesive elements started to open up, andthe model became slightly more compliant. When the model was loaded toabout 0.64 mm it failed, and a peak load was reached. Thereafter the forcedropped in a manner similar to the experimental curves.
Table 2. The constitutive equations used in the interface model, which wereexpressed in terms of tractions, tZD, tMD, and tCD, and displacements, δZD, δMD and δCD
Development of the Notched Shear Test
14th Fundamental Research Symposium, Oxford, September 2009 891

In Figure 10 the normalized shear traction component, tMD/t 0MD, and the
normalized normal traction component tZD/t 0ZD, in the cohesive elements have
been plotted along the shear zone. The traction components have dimensionpressure in the model and shall be interpreted as stress components. Thestress distribution in Figure 14 have been plotted at two different displace-ments, δ = 0.48 mm and δ = 0.64 mm, as indicated in Figure 9. At δ = 0.48mm the deviation of the continuum/cohesive model from the continuummodel was initiated. In Figure 10a it is observed that at the left notch deform-ation in the cohesive model had been initiated by the normal stress compon-ent, since tZD/t 0
ZD = 1. However, this was only observed in the element closestto the notch on the left side, but not on the right side. Instead the shear stresscomponent, tMD/t 0
MD, dominate along the rest of the shear zone. In Figure 10ait was also observed that only the elements closest to the notches started toopen up when δ = 0.48, but this without specimen failure. Hence, theflexibility of the continuum/cohesive model cancelled any existing stress
Figure 9. Force-displacement curves from the experimental and numerical tests ofthe NST specimen.
Mikael Nygårds, Christer Fellers and Sören Östlund
892 Session 6: Mechanical Properties

Figure 10. Stress components along the NST shear zone at different positions alongthe force-displacement curve at δ = 0.48 mm (a) and δ = 0.64 mm(b), as indicated in
Figure 13.

concentrations. Instead a uniform shear stress distribution was present atspecimen failure, as seen in Figure 10b. Therefore the failure was clearly sheardominated.
5. DISCUSSION
The development of the NST has been a journey where different specimensetups have been tested. Originally the idea of a double notch shear specimencame up when considering the work of Pettersson and Neumeister [12].Thereafter, Nygårds et al. [6] proposed the double notch shear test for testingof paperboard. This test worked fine, but the size of the shear zone waslimited due to the risk of tensile failure. Therefore the concept of plasticlamination was investigated. This enabled us to test shear zones that were aslarge as 15 × 15 mm2. The major advantage with the plastic lamination washowever the possibility to investigate through thickness shear strength pro-files. As the test now is designed shear strength profiles can easily be deter-mined, as shown in Figure 7. Hence the test can both be used as an industrialquality control measure, and in materials design to correlate process changesto their influence on the properties in the thickness direction of paperboard.The latter can be particular important for multiply structures since differentplies and interfaces can be altered independently. The shear strength profilescan therefore be used in optimisation of the paperboard design for differentapplications.
Different producers manufacture paperboards that can have similar valuesof quality control measures in the out-of-plane direction, such as ZD tensionand Scott bond. However, due to different process strategies the paperboardscan behave differently in converting operations. This is due to the fact that thethrough-thickness profiles of the quality measures differ. In Figure 6, theprofiles for a multiply paperboard are shown in MD and CD, respectively,and it is shown that this particular board has its weakest points in the interval100–150 μm from the top surface, while the bottom interface and bottom plyshows higher shear strength. If the producer chooses to make weaker andbetter defined interfaces, and also strengthens the middle ply, a more pro-nounced profile would be observed. In creasing and folding operations thiswould be advantageous since the repeatability of the operation wouldincrease and delamination would primarily occur at the interfaces.
The shear strengths obtained with different methods showed that the RSTand SST tests gave the same results. Both these tests prescribe a displacementat the surfaces of the material; therefore a larger material volume in thethickness direction will be loaded. In these tests delamination can be initiated
Mikael Nygårds, Christer Fellers and Sören Östlund
894 Session 6: Mechanical Properties

in multiple positions, both along the interfaces and within the different plies.It therefore comes natural that paperboard failure involves the weakest link.With the NST specimen, the failure location was instead prescribed due tothe positioning of the notches. This was the concept that enabled us to meas-ure profiles. As a consequence of this approach the measurements at thedifferent positions in the thickness direction will be higher than the RST andSST measurements. There are two reasons for this. Firstly, the positions weuse for NST measurements are discrete, here they were 15 μm apart, andhence we cannot ensure that we hit the weakest link of the paperboard.Secondly, in the NST specimen there will be only one shear damage site, whileRST and SST can initiate shear damage in multiple positions.
To verify that the NST was a shear test, finite element simulations of theloaded specimen were conducted. To enable the simulations both geometricaland material models were needed. The geometrical model was straight-forward to generate, since the specimen had been tested and improvedexperimentally. The choice of material model was, however trickier, sinceappropriate paper material models are not in general available in commercialfinite element software. Our choice instead fell on a continuum model pro-posed by Nygårds et al. [1], which was used together with a built-in interfacemodel in Abaqus [16]. The continuum model is experimentally verified forcreasing operations with good predictability [1]. Therefore, we relied on itsaccuracy also for this work, and the comparison between numerical andexperimental results in this work also showed a very good agreement, whichstrengthen our trust in the model.
6. CONCLUSIONS
A notched shear test (NST) has been proposed, and as a spin-off from thistest also the strip shear test (SST) was suggested. The NST test can be used tomeasure shear strength profiles in the thickness direction of paperboard,while the SST test can be used as a quick measure of shear strength. TheSST measurement correlates well with the rigid shear test (RST), which is atraditional shear test.
Finite element simulations were performed in order to show that theforce-displacement behaviour from the experiments could be predicted. Thefinite elements simulations were also used to ensure that the NST specimenhad a uniform shear stress distribution between the notches at the time offailure.
Development of the Notched Shear Test
14th Fundamental Research Symposium, Oxford, September 2009 895

7. ACKNOWLEDGEMENT
Important experimental and numerical contributions during the develop-ment of the test method have been carried out by Johan Bäckström and MarcSpirig. Moreover, Sune Karlsson and Jean Malnory are acknowledged forhelping us with the shear strength measurements.
8. REFERENCES
1. M. Nygårds, M. Just and J. Tryding. Experimental and numerical studies ofcreasing of paperboard. Int. J. Solids Struct. 46:2493–2505, 2009.
2. J.F. Waterhouse. The failure envelop of paper when subjected to combined out-of-plane stress. In Proceeding of the International Paper Physics Conference,Hawaii, USA, pp. 629–639, 1991.
3. N. Stenberg, C. Fellers and S. Östlund. Measuring the stress-strain properties ofpaperboard in the thickness direction. J. Pulp Paper Sci. 27(6):213–221, 2001.
4. L.V. Byrd, V.C. Setterholm and J.F. Wichmann. Method for measuring theinterlaminar shear properties of paper. Tappi J. 58(10):132–135, 1975.
5. C. Fellers. Procedure for measuring the interlaminar shear properties of paper”,Svensk papperstidning 80(3):89–93, 1977.
6. M. Nygårds, C. Fellers, S. Östlund. Measuring out-of-plane shear properties ofpaperboard. J. Pulp Paper Sci. 33(2):1–5, 2007.
7. Y.P. Qui, M. Millan, C.H. Lin and T.D. Gerhardt. Nonlinear properties of highstrength paperboards. In Proceedings of the 1997 Mechanics of CellulosicMaterials Conference, Evanston, Illinois, The American Society of MechanicalEngineers (ASME), 1997.
8. O. Girlanda and C. Fellers. Evaluation of the tensile stress-strain properties inthe thickness direction of paper materials. Nord. Pulp Paper Res. J. 22(1): 49–56,2007.
9. ASTM D 3846. Standard Test Method for In-Plane Shear Strength ofReinforced Plastics. In ASTM International, West Conshohocken, PA 19428-2959, USA, 2002.
10. M. M. Shokrieh and L.B. Lessard. An assessment of the double-notch shear testfor interlaminar shear characterization of a unidirectional graphite/epoxy understatic and fatigue loading. Applied Composite Materials, 5:289–304, 1998.
11. Y. Shindo, R. Wang, K. Horiguchi and S. Ueda. Theoretical and experimentalevalution of double-notch shear strength of G-10CR glass-cloth/Epoxy laminatesat cryogenic temperatures. Journal of Engineering Materials and Technology,121:367–373, 1999.
12. K.B. Pettersson and J.M. Neumeister. A tensile setup for the IDNS compositeshear test. Composites Part A: Applied Science and Manufacturing, 37:229–242,2006.
Mikael Nygårds, Christer Fellers and Sören Östlund
896 Session 6: Mechanical Properties

13. M. Nygårds. Experimental techniques for characterization of elastic-plasticmaterial properties in paperboard. Nord. Pulp Paper Res. J. 23(4): 432–437, 2008.
14. ASTM D 828. Standard Test Method for Tensile Properties of Paper and Paper-board Using Constant-Rate-of-Elongation Apparatus, In ASTM International,West Conshohocken, PA 19428-2959, USA, 1997.
15. Q.S. Xia. Mechanics of inelastic deformation and delamination in paperboard.PhD-thesis, Massachusetts Institute of Technology, Cambridge, MA, USA, 2002.
16. ABAQUS. Version 6.8-1. Abaqus Inc, Providence, RI, USA, 2008.17. M. Nygårds. Modelling the out-of-plane behaviour of paperboard. Nord. Pulp
Paper Res. J. 24(1):72–76, 2009.18. Q. Xia, M. Boyce, and D. Parks. A constitutive model for the anisotropic elastic-
plastic deformation of paper and paperboard. Int. J. Solids Struct. 39:4053–4071,2002.
Development of the Notched Shear Test
14th Fundamental Research Symposium, Oxford, September 2009 897

DEVELOPMENT OF THENOTCHED SHEAR TEST
Mikael Nygårds,1,2 Christer Fellers2 and Sören Östlund 1
1KTH, Department of Solid Mechanics, SE-100 44 Stockholm, Sweden2Innventia, Box 5604, SE-114 86, Stockholm, Sweden
Mark Kortschot University of Toronto
Very interesting paper. I just wondered, have you ever considered using anenergy-based failure criterion, instead of a stress-based criterion? I do somework with composite delamination and one of the things that the compositeguys do is to worry about the mode of delamination. What occurs to me isthat in the creasing operation, you have pretty clear Mode II delamination. Infact, it looks a lot like the test that is used for Mode II in composite materials,which is a bending test. But in the new test that you devised, any rotationwould lead to a kind of opening mode, which would be expected to actuallychange the delamination energy. So it is a long question, but I guess the firstpart of it is: have you considered energy-based failure criteria rather thanstress-based criteria, or yield-envelope criteria? And could you tell me a littlebit about the difference in mode between the creasing operation you areinterested in and the test?
Mikael Nygårds
We have not considered energy-based criteria for the reason that we likestress-strain based constitutive models. It is not a problem to do this, but whatyou try to work with, in general, is an interpretation of experimental data andyou try to translate that to numerical models. Working a lot with verificationto see what is happening or not, we believe it works well in that respect.Maybe it could work also with an energy-based criterion. Going into thequestion that there is shearing: yes, creasing is mode 2, but there is also anopening mode. So there is a combination in there as well, so it is not a puremode 2, I do not know which one is best.
14th Fundamental Research Symposium, Oxford, September 2009
Transcription of Discussion

Mark Kortschot
Okay! Thank you.
Jean-Claude Roux University of Grenoble
In your presentation, the distance, L, between the two notches seems to havean importance. Can you comment on this? What would be an adequate dis-tance, according to your experience, in a test?
Mikael Nygårds
We are using 15 mm, so we are testing an area which is 15 mm × 15 mm. Thatis given in the paper. First of all, we chose that because we are going to have adistance that is comparable with previous testing methods. Also, the idea oflaminating it first, enabled us to go up in distance, because, if we do notlaminate, the testing distance has to be very small. Yes, the strength goesdown if you increase the length. My interpretation is that, if you have a crackgoing between the notches, the length of the path it can take will increasewith increased length, so it will go more and more towards the normal sheartest where it is following the weakest link; it has a tendency to jump up to theinterface. And so, with this one, we believe that it is working quite well and Lis longer than the fibre length. It is getting reproducible data, but it is not 30mm. Also shear testing of very large shear zones creates a lot of elastic energyin that zone so you will have more rapid, or more brittle failure at that point,so it seems convenient from the testing.
Jean-Claude Roux
Thank you!
Session 6
Discussion