development of the mediterranean extinction code...
TRANSCRIPT

Downl
Development of the Mediterranean extinctioncode „MEDEX…
Jacques PiazzolaFrederic BoucharaUniversity of Toulon-VarLEPIB.P. 13283957 La Garde cedex, France
Gerrit de LeeuwAlexander M. J. Van EijkTNO Physics and Electronics LaboratoryP.O. Box 96864The Hague, NL-2509 JGThe Netherlands
Abstract. The performance of electro-optical systems can be substan-tially affected by aerosol particles that scatter and absorb electromag-netic radiation. The model that is most frequently used for the predictionof aerosols and their effect on extinction in the marine atmosphere is theUS Navy Aerosol Model (NAM). However, NAM can be significantly lessreliable in coastal areas than on the open ocean. Based on an extensiveseries of measurements conducted on the island of Inisheer (Irish WestCoast), an empirical aerosol model for the coastal zone formulated as anextension of NAM, in which coastal effects are modeled as a function offetch, has been developed. This work is extended to the Mediterraneanusing an aerosol dataset recorded on the island of Porquerolles in theBay of Toulon (France) and has been coupled with the Mie theory to givea code for the extinction, the code MEDiterranean EXtinction (MEDEX).© 2003 Society of Photo-Optical Instrumentation Engineers. [DOI: 10.1117/1.1556765]
Subject terms: coastal aerosols; optical propagation; NAM; fetch.
Paper 020246 received Jun. 18, 2002; revised manuscript received Oct. 7, 2002;accepted for publication Oct. 8, 2002.
o aFoc-
Inactac-n brta
ro-nd
ad,per
isase
etecan
re-the
esandro-
ol
eaon
tureto
ex-ot-
heany
n-t in
ay.ta,
. Pi-fen-therllessed
hehe
der-er-
ndis-
lonx-
1 Introduction
The performance of a given electro-optical system is tlarge extent determined by the atmospheric conditions.good visibility, i.e., low aerosol concentrations, the detetion range is in general large, andvice versa, in adversevisibility conditions, the detection range may be small.addition, atmospheric refraction effects may heavily imptarget detection probability. For example, under subrefrtive conditions, targets close to the sea surface that caseen under neutral conditions cannot be observed at ceranges irrespective of the visibility.
The visibility is determined by both molecules and aesols. Molecular effects are relatively well quantified acan be calculated using propagation codes suchMODTRAN.1 Aerosols are much less well characterizeespecially because their concentrations and optical proties ~chemical composition! are very variable both in timeand space. Effects of aerosols and refractivity on transmsion in the coastal environment have been analyzed bon field experiments along the Californian coast.2 The re-sults show that refractive effects are the primary paraminfluencing near-surface propagation, while aerosolsalso have a very large effect in this coastal region.3 Theelectro-optical propagation codes IRBLEM4 and EOSTAR5
aim at a description of these effects by including bothfraction and extinction due to gases and aerosols formarine environment.
The previously mentioned MODTRAN code describthe attenuation of electro-optical radiation by gasesaerosols. Over the ocean, MODTRAN uses the Navy Aesol Model~NAM !6 and the Naval Oceanic Vertical AerosModel ~NOVAM !.7 NAM is the kernel for NOVAM, whichin turn is used to extend NAM from about 10-m above slevel to the top of the boundary layer, and it is based
912 Opt. Eng. 42(4) 912–924 (April 2003) 0091-3286/2003/$15.0
oaded From: http://opticalengineering.spiedigitallibrary.org/ on 07/08/2014 T
r
ein
s
-
-d
r
atmospheric models describing the boundary layer strucand aerosol transport. NAM is currently being upgradedthe Advanced Navy Aerosol Model~ANAM !,8 which pro-vides a better description of large aerosols and allowstension downwards to the surface. ANAM is presently navailable in MODTRAN, but has been included in EOSTAR.
We focus on aerosol effects on propagation in tcoastal environment, building on the work of Piazzola, VEijk, and De Leeuw9 to include coastal effects in the NavAerosol Model ~NAM !.6 NAM is mainly based on datacollected prior to 1983. In general, NAM provides reasoable predictions for extinction over the open ocean, bucoastal regions they are often less reliable9,10 when, in anoff-shore wind, continental aerosols mix with the sea sprSince NAM was developed from mainly open ocean dathe model cannot be expected to cover such situationsazzola, Van Eijk, and De Leeuw9 proposed an extension othe Navy Aerosol Model based on the analysis of an extsive series of measurements on the island of Inisheer offIrish Atlantic Coast. This work extends NAM with a similaanalysis using data collected on the island of Porquerooff the French Mediterranean Coast. The results were uto develop the extinction model MEDEX~MediterraneanExtinction!. The results are compared with those from tInisheer dataset to explore potential generalization. Tanalysis of the two datasets also leads to a better unstanding of the similarities and differences between diffent coastal zones.
2 Field Site and Instrumentation
Measurements of aerosol particle size distributions asupporting meteorological parameters were made at theland of Porquerolles in the Mediterranean Sea near Tou@Fig. 1~a!#. The experimental station is located at the e
0 © 2003 Society of Photo-Optical Instrumentation Engineers
erms of Use: http://spiedl.org/terms
trato
niteel-g
n-c-
n-a-eanr onceIn
thaa
ne
calla-e’s
thean
e-iod.st-, a
nga-
en-d00anentn
enite
icalpec-pledand
Piazzola et al.: Development of the Mediterranean extinction code
Downl
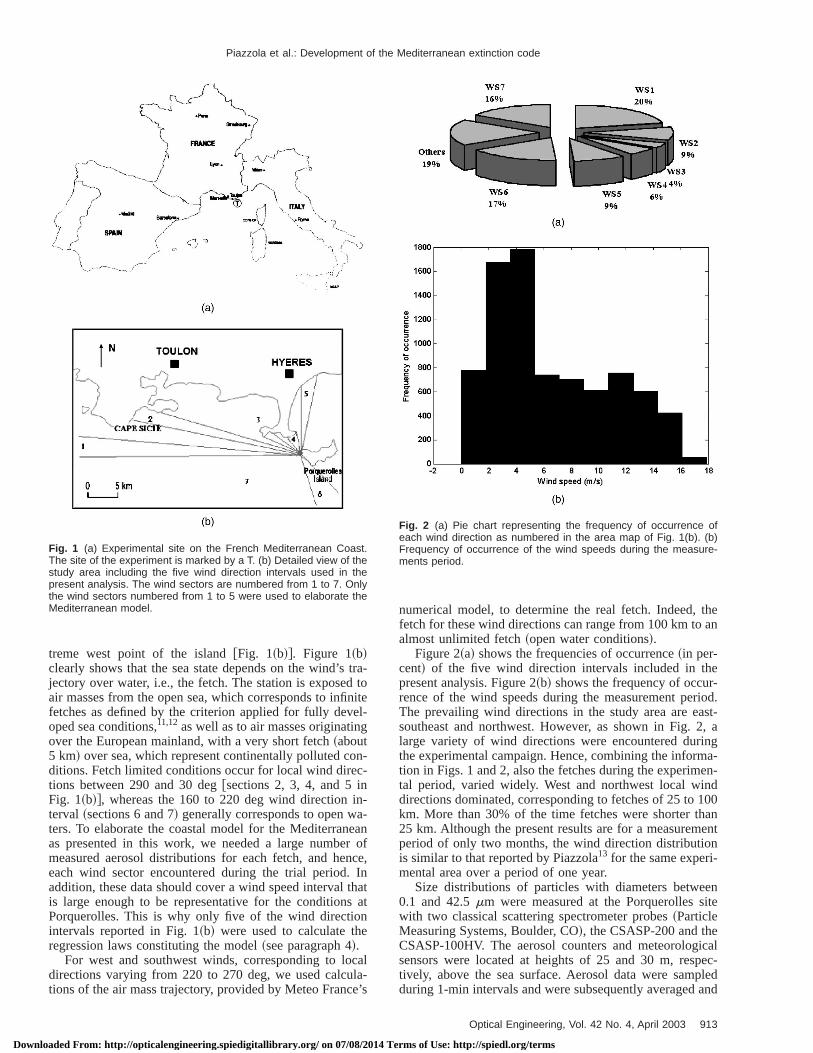
treme west point of the island@Fig. 1~b!#. Figure 1~b!clearly shows that the sea state depends on the wind’sjectory over water, i.e., the fetch. The station is exposedair masses from the open sea, which corresponds to infifetches as defined by the criterion applied for fully devoped sea conditions,11,12as well as to air masses originatinover the European mainland, with a very short fetch~about5 km! over sea, which represent continentally polluted coditions. Fetch limited conditions occur for local wind diretions between 290 and 30 deg@sections 2, 3, 4, and 5 inFig. 1~b!#, whereas the 160 to 220 deg wind direction iterval ~sections 6 and 7! generally corresponds to open wters. To elaborate the coastal model for the Mediterranas presented in this work, we needed a large numbemeasured aerosol distributions for each fetch, and heeach wind sector encountered during the trial period.addition, these data should cover a wind speed intervalis large enough to be representative for the conditionsPorquerolles. This is why only five of the wind directiointervals reported in Fig. 1~b! were used to calculate thregression laws constituting the model~see paragraph 4!.
For west and southwest winds, corresponding to lodirections varying from 220 to 270 deg, we used calcutions of the air mass trajectory, provided by Meteo Franc
Fig. 1 (a) Experimental site on the French Mediterranean Coast.The site of the experiment is marked by a T. (b) Detailed view of thestudy area including the five wind direction intervals used in thepresent analysis. The wind sectors are numbered from 1 to 7. Onlythe wind sectors numbered from 1 to 5 were used to elaborate theMediterranean model.
oaded From: http://opticalengineering.spiedigitallibrary.org/ on 07/08/2014 T
-
f,
tt
numerical model, to determine the real fetch. Indeed,fetch for these wind directions can range from 100 km toalmost unlimited fetch~open water conditions!.
Figure 2~a! shows the frequencies of occurrence~in per-cent! of the five wind direction intervals included in thpresent analysis. Figure 2~b! shows the frequency of occurrence of the wind speeds during the measurement perThe prevailing wind directions in the study area are easoutheast and northwest. However, as shown in Fig. 2large variety of wind directions were encountered durithe experimental campaign. Hence, combining the informtion in Figs. 1 and 2, also the fetches during the experimtal period, varied widely. West and northwest local windirections dominated, corresponding to fetches of 25 to 1km. More than 30% of the time fetches were shorter th25 km. Although the present results are for a measuremperiod of only two months, the wind direction distributiois similar to that reported by Piazzola13 for the same experi-mental area over a period of one year.
Size distributions of particles with diameters betwe0.1 and 42.5mm were measured at the Porquerolles swith two classical scattering spectrometer probes~ParticleMeasuring Systems, Boulder, CO!, the CSASP-200 and theCSASP-100HV. The aerosol counters and meteorologsensors were located at heights of 25 and 30 m, restively, above the sea surface. Aerosol data were samduring 1-min intervals and were subsequently averaged
Fig. 2 (a) Pie chart representing the frequency of occurrence ofeach wind direction as numbered in the area map of Fig. 1(b). (b)Frequency of occurrence of the wind speeds during the measure-ments period.
913Optical Engineering, Vol. 42 No. 4, April 2003
erms of Use: http://spiedl.org/terms

Piazzola et al.: Development of the Mediterranean extinction code
914 Optical Engi
Downloaded From: http://o
Fig. 3 Examples of polynomial representations of particle size distributions recorded during the cam-paign. The figure shows aerosol size distributions recorded for a wind speed of 10 m/s at variousfetches. The thick black curve represents the size distribution recorded for a fetch of 13 km, the grayline is the data measured for a fetch of 25 km, and the dashed line is for a 100-km fetch.
d am-
ingnd
, thduebe-01
tersnd
ialfer-n in
seabe-onlesle othes b
tri-hezedby
eedsalmi
in-iclesin-tion
ontedsezesher
ofb-in
rteri-
redndnsinehepro-nd
zed
siveac-
eb-va-er
ata
stored as 4-min averages. Meterological data measurethe site were wind speed, wind direction, air and sea teperature, and relative humidity. Data were collected durtwo months, in the period between November 2000 aFebruary 2001. Because of the remoteness of the sitedata were collected unattended. Accounting for lossesto down time, about 1000 hours of data were acquiredtween the end of November 2000 and early February 20
3 Typical Aerosol Size Distributions in theMediterranean Coastal Zone
Aerosol size distributions and meteorological paramewere continuously recorded. Polynomial fits of first afifth order in Log~dN/dD! versus Log~D! space were madeto the distributions to facilitate the analysis. Polynomrepresentations of aerosol distributions recorded for difent fetches at a wind speed of about 10 m/s are showFig. 3. The concentrations of coarse particles~.1 mm!,which at longer fetch are assumed to be dominated bysalt particles, increase with increasing fetch. This effectcomes more prominent as particle size increases. In ctrast, the concentrations of submicrometer particdecrease at larger fetch. The data in Fig. 3 is an exampthe transition from a continental to a marine aerosol asair mass is advected over the sea, similar to observationVignati et al.14 and Van Eijk and De Leeuw15 in othercoastal locations.
Figure 4 shows the variations of the aerosol size disbution with wind speed for two fetches. To eliminate teffects of RH, the aerosol concentrations were normalito 80% relative humidity using equations formulatedFitzgerald.16 For a fetch of 25 km, Fig. 4~a! shows that theconcentration of coarse particles increases with wind spThis is ascribed to the increased production of seadroplets at the surface. The concentrations of the sub
neering, Vol. 42 No. 4, April 2003
pticalengineering.spiedigitallibrary.org/ on 07/08/2014 T
t
e
.
-
-
f
y
.t-
crometer particles decrease slightly as the wind speedcreases. For such short fetches, the land-originated partprevail in the submicron range and their concentrationscrease with decreasing wind speeds due to accumulacaused by slower dispersion.14,17 For a fetch of about 100km, Fig. 4~b! shows that the concentration of supermicrparticles has a similar behavior with wind speed, as noin Fig. 4~a!. For submicron particles, the slight decreawith wind speed is still present at the smallest particle siwhen the wind speed increases from 8 to 12 m/s. For higwind speeds~.15 m/s!, however, we note an increasethe submicrometer particles with wind speed. This is proably due to the enhancement of the marine contributionthis size range. Although the submicron particles at shofetches are predominantly from continental origin, submcron sea spray production has been observed.17–20
As shown above, the aerosol size distributions measuat Porquerolles clearly show the influence of fetch awind speed. The shape of the particle size distributiochanges due to changing relative contributions of marand land-originated aerosols with increasing fetch. Tconcentrations are determined by the balance betweenduction and removal. The production varies with the wispeed, roughly asu
*3 ~e.g., Andreas, 1998!,21 whereas for a
source from above the deposition velocity is parameterias linearly dependent on the wind speed.22
4 Mediterranean Aerosol Model
The Mediterranean aerosol model is based on an extenseries of measurements, described before, which werequired on Porquerolles island from November 2000 to Fruary 2001. This extended period allowed for the obsertion of a large variety of aerosol size distributions unddifferent meteorological conditions. The experimental d
erms of Use: http://spiedl.org/terms

Piazzola et al.: Development of the Mediterranean extinction code
Downloaded From: http://o
Fig. 4 (a) Polynomial representations of aerosol size distributions recorded for a fixed fetch of 25 kmand different wind speeds. The line represents the aerosol size distribution recorded at a wind speedof 7 m/s, while the dashed one represents data recorded for a wind speed of 16 m/s. The aerosolspectra are normalized to a relative humidity of 80%. (b) the same as Fig. 4(a) for a fetch of 100 km.The line represents the data recorded at a wind speed of 8 m/s, while the dashed curve is for windspeed of about 12 m/s, and the diamonds represent an aerosol size distribution measured in a windspeed of 15.5 m/s.
anto
lo-an
y-c-amforn-
ngthe
rayone
thesolr
from Porquerolles were statistically analyzed to developempirical coastal aerosol model for implementation inMEDEX. The Mediterranean model is formulated anagously to the Inisheer model proposed by Piazzola, VEijk, and De Leeuw,9 i.e., as a modification of the NavAerosol Model~NAM !.6 As in NAM, the aerosol concentration N(r ) is calculated as the sum of lognormal funtions, but the amplitudes of the various modes are pareterized as functions of fetch. This approach allowscoastal influence in all modes, whereas in NAM, the co
pticalengineering.spiedigitallibrary.org/ on 07/08/2014 T
-
tinental influence was limited to the first mode describithe smallest particles. The coastal zone not only affectsconcentrations of the submicron particles~originating overland!, but also those of the larger particles, i.e., sea spproduced by breaking waves, which in turn dependwave age and fetch.23 Furthermore, as suggested by DLeeuw,24 a fourth mode has been introduced to modellargest sea spray particles. As shown in Fig. 5, the aeroconcentrationN(r ) is then calculated as the sum of foulognormal functions:
915Optical Engineering, Vol. 42 No. 4, April 2003
erms of Use: http://spiedl.org/terms

Piazzola et al.: Development of the Mediterranean extinction code
916 Optical Engi
Downloaded From: http://o
Fig. 5 The modeled aerosol spectrum (the gray line) as defined in Eq. (1). The crosses represent thefourth lognormal functions, numbered directly on the graph.
en-ec-of
eson, 2of
talp-
m-re-ize
ameedn.
s oterpo
eptthehisthedesileseangh
od-heex-
rra-ndly
dnd
talpre-forw
ndn.m
N~r !5(i 51
4Ai
fexp$2Ci@ ln~r / f r oi!#
2%, ~1!
wherer 0150.03,r 0250.24,r 0352 mm, r 04510mm, f rep-resents the humidity growth factor,25 Ai denotes thei thmode amplitude, andCi is the width of thei th mode.
To determine the effect of fetch on the aerosol conctrations, the aerosol data were sorted into five wind dirtion intervals@Fig. 1~b!#. For each sector, the amplitudethe first mode,A1 , was directly related to the fetch@result-ing in Eq. ~2!#. The fetch dependence of mode amplitudA2 , A3 , andA4 was determined using linear regressionthe concentration versus wind speed for particles of 0.24and 10mm radius. Having obtained the parameterizationmode amplitudesA2 , A3 , and A4 , the four widths,Ci ,were obtained from a multivariable fit to the experimensize distributions as functions of wind speed and fetch. Otimization of the widths was obtained by assuming a liited range of variations of the mode radii, since they corspond to a physical characteristic of the aerosol sdistributions. Subsequently, plots of the regression pareters~slopes and intercepts of the concentration/wind spplots! versus fetch were fitted to an exponential functioThis procedure resulted in mode amplitudes as functionwind speed and fetch. The dependence of slope and incept on fetch for the second and the third modes are opsite; with the slope increasing with fetch and the intercdecreasing. For the fourth mode, both the slope andintercept of the regression lines increase with fetch. Tdifference in behavior for the various modes arises fromdifferent nature of the aerosol. The second and third mostill have a contribution from continental aerosols, whthe fourth mode consists almost exclusively of freshspray particles. The fit procedures yielded the followimode amplitudes and mode widths as a function of fetcX~in meters!, and wind speedU ~in m/s!:
neering, Vol. 42 No. 4, April 2003
pticalengineering.spiedigitallibrary.org/ on 07/08/2014 T
,
-
f--
A15224350LnX1345901, ~2!
A2510@~0.03LnX20.282!U20.385LnX15.25#, ~3!
A3510@~0.045LnX20.398!U20.47LnX13.25#, ~4!
A4510@~0.0095LnX20.0593!U10.1424LnX24.3417#, ~5!
C1520.19LnX13.2, ~6!
C2520.148LnX12.883, ~7!
C3520.295LnX14.55, ~8!
C4510. ~9!
Equations ~2! through ~9! apply to 3000 m,X,120 000 m 3 m/s,U,18 m/s and RH,98%.
5 Limit of Validity and Performance of theMediterranean Model
Figure 6 shows comparisons between observed and meled size distributions for fetches of 3, 13, and 25 km. Tmodeled distributions show good agreement with theperimental data.
Figure 7 shows a comparison between the Meditenean modeled distribution, the prediction of the Irelamodel, both for the largest fetches for which they app~120 and 200 km, respectively!, and the spectrum predicteby NAM. The three curves are very close between 0.7 a10 mm, which indicates that for large fetch, the two coasaerosol models closely approach the open ocean NAMdiction. Deviations up to a factor of 10 are observedsubmicron particles for which the removal rate is too sloto allow for complete equilibrium between production aremoval, i.e., the transition to an infinite fetch conditioHoppel et al.26 report the time required to reach equilibriu
erms of Use: http://spiedl.org/terms

shin
soltheareelicheri-
l
tioncts
for
er
vesindudyrger-rgerin
ionhefi-
icalsolns
Piazzola et al.: Development of the Mediterranean extinction code
Downl
to be four days for 1-mm particles. Deviations for particlelarger than 10mm are due to the addition of the fourtmode in the Mediterranean model, which is not includedNAM or the Inisheer model.
The mean error of the model for predicting the aeroconcentration has been estimated from the deviation ofmodel results from the experimental data. The resultspresented in Table 1, where the reliability of the modprediction is expressed as the maximum factor by whthe modeled aerosol concentration differs from the exp
Fig. 6 (a) Measured particle size distribution and model predictions(solid line) for a 3-km fetch and for wind speeds between 9.5 and10.5 m/s. (b) Measured particle size distribution and model predic-tions (solid line) for a 13-km fetch and for wind speeds between 7.5and 9.5 m/s. (c) Measured particle size distribution and model pre-dictions (solid line) for a 25-km fetch and for wind speeds between12.5 and 13.5 m/s.
oaded From: http://opticalengineering.spiedigitallibrary.org/ on 07/08/2014 T
mental concentration~68 % confidence!. Figure 8 illustratesthe performance of the model for 5-mm particles against althe data~i.e., for all wind directions!. The liney5x repre-sents ideal model performance and the standard deviafrom this line is 0.4, which means that the model predithe concentration of 5-mm particles to within a factor of 1.5~68% confidence limit!.
Table 1 shows that the model predictions are betterthe second and the third modes~the entries for 0.5- and5-mm particles!, but have a slightly smaller accuracy for thfourth mode~20-mm particles!. However, the largest errois found for the first mode~0.2-mm particles!.
The very large aerosols are produced by breaking waand surface tearing, and hence are influenced by wgusts. Generally, the west and northwest winds in the starea are quite gusty, which may result in the relatively launcertainty of the model for the ‘‘giant particles.’’ Furthemore, measurement uncertainties increase for the laparticles due to sampling statistics. The large variationthe concentrations of the particles of the accumulatmode, in particular for very short fetches, is due to tvariability of the sources over land, a factor which is difcult to account for in an empirical model.
The model confidence factors~Table 1! for the presentstudy, both MPN15 and the Inisheer9 studies, are all of thesame order of magnitude. This indicates that such empirmodels may well describe local variations of the aerosize distribution as a function of meteorological conditiofor a variety of coastal locations.
Fig. 7 Comparison of the predictions by NAM (thick line), the Ire-land model (gray line) for a fetch of 200 km, and the Mediterraneanmodel for a fetch of 120 km (crosses) for a wind speed of 10 m/s.
Table 1 Model performance for different particle sizes: tabulatedare the factors to within the difference between the model predic-tions, and the experimental aerosol concentrations vary, with 68%confidence and 95% confidence limit, respectively.
D (mm) 68% Confidence 95% Confidence
0.2 2.8 4.6
0.5 1.70 1.72
5 1.49 1.50
15 1.50 1.52
20 2.0 2.22
917Optical Engineering, Vol. 42 No. 4, April 2003
erms of Use: http://spiedl.org/terms

anareal-i.edi-r aesr
It isely
thelestri-
cheepo-
-ri-pol. Innandorttra
ion,meair
la-e,
thentlyhy
cto
talcu
ledand
in-
uree-duest-air
a-
Piazzola et al.: Development of the Mediterranean extinction code
Downl
6 Comparison Between the Inisheer and thePorquerolles Coastal Aerosol Models
Aerosol size distributions modeled for the Mediterraneand the Irish coast at fetches of 15, 25, and 100 kmcompared in Fig. 9. A comparison for large fetch hasready been presented in Fig. 7. For the shortest fetch,smaller than 15 km, the aerosol concentrations in the Meterranean area are significantly higher for all sizes. Fo25-km fetch, the concentrations of particles with sizaround 1 to 2mm are similar, and for particles eithesmaller than 0.5mm or larger than 5mm, the concentrationsare larger at the Mediterranean coast than at Inisheer.noted that for giant particles, the discrepancies are largdue to the fact that the fourth mode is available only forMediterranean model. The differences for small particare discussed later. For a 100-km fetch, the particle disbutions behave as though already observed for large fetin Fig. 6, i.e., the two coastal models are very close excfor both the submicron and the ‘‘giant’’ portion of the aersol spectrum.
6.1 Differences in the First Mode
The amplitude of the first mode,A1 , describes the accumulation mode aerosol, which is mainly of anthropogenic ogin. High concentrations are observed near sources oflution from densely populated and industrialized areasNAM,6 the amplitudeA1 was parameterized as a functioof the residence time of the air mass over the sea,determined from the air mass trajectories, the visibility,the radon counts.6 Visibility and radon counts are direcmeasures of the continental influence and the concentions of submicron particles. The current parameterizatas a function of the fetch, is similar to the residence timethod, and in fact the fetch was determined from themass trajectories. The problem with this kind of formution is thatA1 is not only determined by the residence timbut also by upwind sources.
The importance of the anthropogenic contribution toaerosol concentrations in the Mediterranean was receconfirmed by chemical analysis using ion chromatograpon particles collected with a low pressure cascade impaduring the FETCH campaign in the Golf du Lion27 by Sell-egri et al.28 Measurements made in winds of continenorigin at fetches of less than 100 km showed that the ac
Fig. 8 Scatter plot of the modeled concentrations of 5-mm particlesversus experimental values. The line denotes ideal model perfor-mance.
918 Optical Engineering, Vol. 42 No. 4, April 2003
oaded From: http://opticalengineering.spiedigitallibrary.org/ on 07/08/2014 T
.,
st
-
-
r
-
mulation mode, essentially the first mode of the modeaerosol spectrum, mainly contains nitrate, ammonium,non-sea salt sulfates, which indicate an anthropogenicfluence.
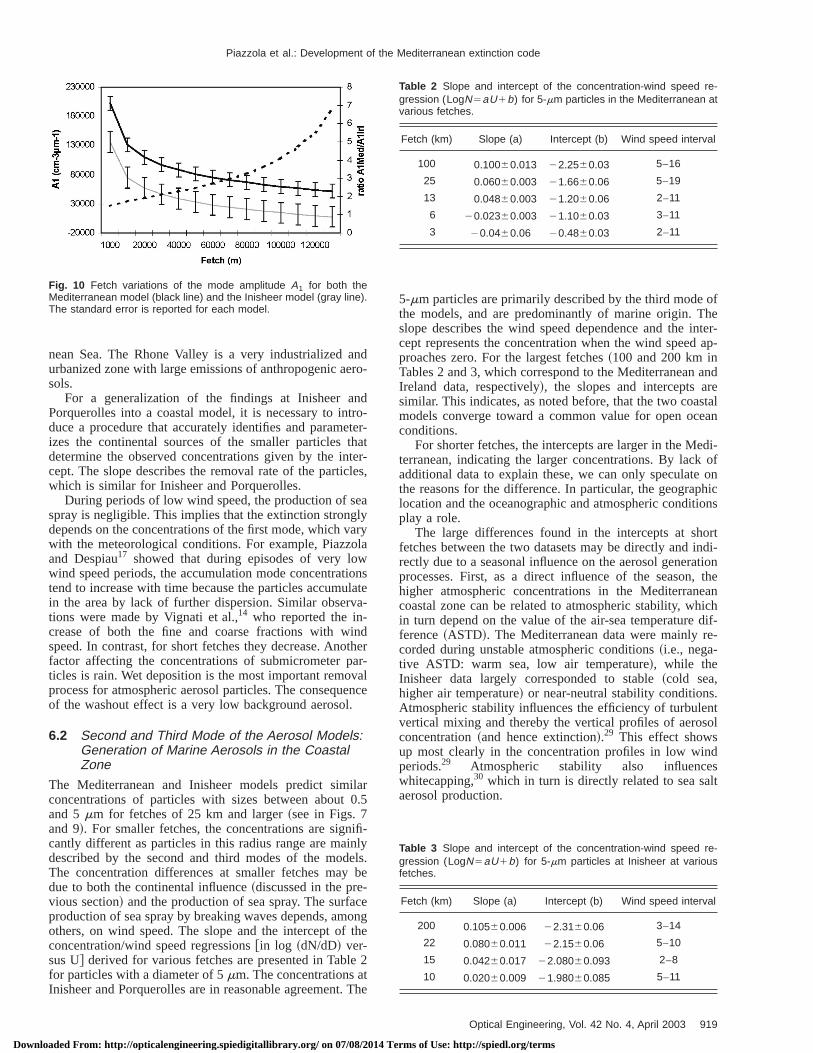
The slope of the first mode, Eq.~2!, is quite similar tothat for the Inisheer model~where A15226300LnX1317350). The variations ofA1 with fetch for the Inisheerand the Porquerolles models are shown in Fig. 10. Fig10 shows thatA1 is larger in the Mediterranean model bcause the submicron aerosol concentrations are largerto upwind sources. For example, for specific west or wesouthwest local wind directions at Porquerolles, themass sampled has passed over the Rhone Valley~northeastof Marseille! before turning eastward over the Mediterr
Fig. 9 (a) Comparison of the Mediterranean model and the Inisheermodel for a fetch of 15 km and a wind speed of 7 m/s. The crossesrepresent the Mediterranean model and the line the predictions ofthe Inisheer model. (b) Comparison of the Mediterranean model(crosses) and the Inisheer model (line) for a fetch of 25 km and awind speed of 8 m/s. (c) Comparison of the Mediterranean model(crosses) and the Inisheer model (line) for a fetch of 100 km and awind speed of 10 m/s.
erms of Use: http://spiedl.org/terms
ndero
ndtro-etethaterles
ealyaryolawionlata-
indthear-valenc.
ilar0.5
ifi-nlyelsbe
-ceonthe
e 2t. Th
ofhenter-ap-
andrestalean
di-ofonhic
ions
ortndi-tionthe
eanichdif-e-
.ntol
dslt
Piazzola et al.: Development of the Mediterranean extinction code
Downl
nean Sea. The Rhone Valley is a very industrialized aurbanized zone with large emissions of anthropogenic asols.
For a generalization of the findings at Inisheer aPorquerolles into a coastal model, it is necessary to induce a procedure that accurately identifies and paramizes the continental sources of the smaller particlesdetermine the observed concentrations given by the incept. The slope describes the removal rate of the particwhich is similar for Inisheer and Porquerolles.
During periods of low wind speed, the production of sspray is negligible. This implies that the extinction strongdepends on the concentrations of the first mode, which vwith the meteorological conditions. For example, Piazzand Despiau17 showed that during episodes of very lowind speed periods, the accumulation mode concentrattend to increase with time because the particles accumuin the area by lack of further dispersion. Similar observtions were made by Vignati et al.,14 who reported the in-crease of both the fine and coarse fractions with wspeed. In contrast, for short fetches they decrease. Anofactor affecting the concentrations of submicrometer pticles is rain. Wet deposition is the most important remoprocess for atmospheric aerosol particles. The consequof the washout effect is a very low background aerosol
6.2 Second and Third Mode of the Aerosol Models:Generation of Marine Aerosols in the CoastalZone
The Mediterranean and Inisheer models predict simconcentrations of particles with sizes between aboutand 5mm for fetches of 25 km and larger~see in Figs. 7and 9!. For smaller fetches, the concentrations are signcantly different as particles in this radius range are maidescribed by the second and third modes of the modThe concentration differences at smaller fetches maydue to both the continental influence~discussed in the previous section! and the production of sea spray. The surfaproduction of sea spray by breaking waves depends, amothers, on wind speed. The slope and the intercept ofconcentration/wind speed regressions@in log ~dN/dD! ver-sus U# derived for various fetches are presented in Tablfor particles with a diameter of 5mm. The concentrations aInisheer and Porquerolles are in reasonable agreement
Fig. 10 Fetch variations of the mode amplitude A1 for both theMediterranean model (black line) and the Inisheer model (gray line).The standard error is reported for each model.
oaded From: http://opticalengineering.spiedigitallibrary.org/ on 07/08/2014 T
-
r-t-,
se
r
e
.
g
e
5-mm particles are primarily described by the third modethe models, and are predominantly of marine origin. Tslope describes the wind speed dependence and the icept represents the concentration when the wind speedproaches zero. For the largest fetches~100 and 200 km inTables 2 and 3, which correspond to the MediterraneanIreland data, respectively!, the slopes and intercepts asimilar. This indicates, as noted before, that the two coamodels converge toward a common value for open occonditions.
For shorter fetches, the intercepts are larger in the Meterranean, indicating the larger concentrations. By lackadditional data to explain these, we can only speculatethe reasons for the difference. In particular, the geograplocation and the oceanographic and atmospheric conditplay a role.
The large differences found in the intercepts at shfetches between the two datasets may be directly and irectly due to a seasonal influence on the aerosol generaprocesses. First, as a direct influence of the season,higher atmospheric concentrations in the Mediterrancoastal zone can be related to atmospheric stability, whin turn depend on the value of the air-sea temperatureference~ASTD!. The Mediterranean data were mainly rcorded during unstable atmospheric conditions~i.e., nega-tive ASTD: warm sea, low air temperature!, while theInisheer data largely corresponded to stable~cold sea,higher air temperature! or near-neutral stability conditionsAtmospheric stability influences the efficiency of turbulevertical mixing and thereby the vertical profiles of aerosconcentration~and hence extinction!.29 This effect showsup most clearly in the concentration profiles in low winperiods.29 Atmospheric stability also influencewhitecapping,30 which in turn is directly related to sea saaerosol production.
Table 2 Slope and intercept of the concentration-wind speed re-gression (LogN5aU1b) for 5-mm particles in the Mediterranean atvarious fetches.
Fetch (km) Slope (a) Intercept (b) Wind speed interval
100 0.10060.013 22.2560.03 5–16
25 0.06060.003 21.6660.06 5–19
13 0.04860.003 21.2060.06 2–11
6 20.02360.003 21.1060.03 3–11
3 20.0460.06 20.4860.03 2–11
Table 3 Slope and intercept of the concentration-wind speed re-gression (LogN5aU1b) for 5-mm particles at Inisheer at variousfetches.
Fetch (km) Slope (a) Intercept (b) Wind speed interval
200 0.10560.006 22.3160.06 3–14
22 0.08060.011 22.1560.06 5–10
15 0.04260.017 22.08060.093 2–8
10 0.02060.009 21.98060.085 5–11
919Optical Engineering, Vol. 42 No. 4, April 2003
erms of Use: http://spiedl.org/terms

n, iob-edenosoino-
ectlesi-
ingndbelepecew
theas
ltiodnceerncd.
the
e orgeueeri
eedl londthentsthe
al-er
ive
ved/phian
relyueitesnd
m-tha
lotsea
nd
ero-
eve
re-w.ed
al-hethe
icher-her
tasetbexi-
or-
for
eedtan-
inicalyof
stp to-mo-sea
elytem
di-.u-maysult-
ofub-
nk-eay,hica-
ar
Piazzola et al.: Development of the Mediterranean extinction code
Downl
In addition, as an indirect consequence of the seasois likely that the value of the intercept depends on the prability and frequency of occurrence of high wind speperiods. For experiments in the winter, the time betweperiods with enhanced wind speed and increased aergeneration through wave breaking is much smaller thanthe summer. Hence, in the winter more frequent atmspheric loading occurs with aerosols of all sizes. The effof frequent loading is more pronounced for large particwith short residence times~thus making them more senstive to wind speed variations! than for smaller particleswith longer residence times and relatively slowly changconcentrations. This would explain why, at medium alarge fetches, the concentrations of particles with sizestween 0.5 and 5mm at the two sites are in reasonabagreement, whereas for particles with larger sizes the stra diverge. During the Inisheer experiments only a fperiods occurred with elevated wind speeds.9 At the Porqu-erolles site the wind speed exceeded 15 m/s 13% oftime. During the Inisheer experiments the wind speed wnever higher than 14 m/s.9 Variable wind speeds also resuin changes in the wave generation process. During perof constant wind speed, wind and wave fields are in balaresulting in ‘‘aged’’ waves. Variable winds result in youngwaves that are steeper and break more frequently. Hethere are more whitecaps and more sea salt is produce
The variation of the sea salt concentrations withwind speed~given by the slopes! for different fetches arepresented in Tables 2 and 3. The data show that the slopthe wind speed/concentration regressions are slightly lafor the Inisheer model for all fetches. This is probably dto the wind speed range encountered during the expments. Indeed, on comparing the slopes of the wind spconcentration regressions in three different geographicacations in the Northern hemisphere, Piazzola, Van Eijk, aDe Leeuw9 suggest a correlation between the slope andmaximum wind speed encountered during the experimei.e., the larger the maximum wind speed, the lowerslope.
In addition, the slope of these plots results from a bance between two processes: production of sea spray asol ~increasing with wind speed and resulting in a positslope31! and removal of atmospheric aerosol particles~moreeffective with wind speed and resulting in a negatislope17!. By comparing the slopes of the wind speeconcentration regressions calculated at different geogracal locations in the northern hemisphere, Piazzola, VEijk, and De Leeuw9 showed that the larger slopes afound at Inisheer. This larger slope implies a relativelarge contribution of marine aerosols, which could be dto an increased production as compared to the other sIn particular, the Inisheer data was obtained in August aSeptember during a phytoplankton bloom, which comonly leads to an increase of gas dissolved in the sea,could in turn enhance particle production.32 This could ex-plain the larger slope of the wind speed/concentration pobserved in Ref. 9 in Ireland compared to the North Sdata,15 Smith, Consterdine, and Park31 in the Hebrides, andthe aerosol data recorded by De Leeuw, Van Eijk, aNoordhuis33 in the remote North Atlantic.
920 Optical Engineering, Vol. 42 No. 4, April 2003
oaded From: http://opticalengineering.spiedigitallibrary.org/ on 07/08/2014 T
t
l
-
-
s
e
fr
-/-
,
o-
-
.
t
6.3 Fourth Mode in the Mediterranean AerosolModel
The addition of the fourth mode to NAM to describe thconcentrations and effects of very large particles was pposed by De Leeuw.24 This size fraction~with diameterslarger than 10 to 20mm! mainly consist of so-called spumdrops, which are produced by direct tearing from the watops at wind speeds larger than about 9 ms21 ~as discussedby Monahan et al.34!. De Leeuw et al.35 argued that NAMunderestimates the concentration of the spume dropletssulting in an estimate of the IR extinction that is too loAs already mentioned in the introduction, the AdvancNavy Aerosol Model~ANAM !8 aims at resolving this un-derestimate by the introduction of a fourth mode. In anogy with ANAM, we have also added a fourth mode to tMediterranean model. The optimized center radius forMediterranean model (C4510mm) corresponds well withthe C458 mm used in the preliminary version of ANAM.36
The Inisheer model does not include a fourth mode, whexplains in part some of its discrepancies with the Meditranean model, at least for large particles. Because higwind speeds were encountered at Porquerolles, this dais suitable for the introduction of a fourth mode to descrithe observed aerosol size distribution. At Inisheer the mamum wind speed encountered was 14 ms21; at these windspeeds the spume droplet production is relatively unimptant.
7 Discussion of the Aerosol Model
Discrepancies between the two coastal models occuraerosols with radii equal to and larger than 5mm. Thelinear regression of concentrations versus wind spshows that the intercepts of the regression lines are substially larger in the Mediterranean~Tables 2 and 3!. Therelatively large marine aerosol concentrations observedthe Mediterranean may be due to more intensive biologactivity. Indeed, biological activity is primarily induced blight, and furthermore, depends strongly on the inputnutrients into the sea.32 Whereas rivers provide the largeamounts of nutrients, the atmosphere may account for u40% of the total inputs37 in the coastal zone. Riverine inputs are most effective close to the coast, whereas atspheric inputs are not only very large close to the land-transition,38 but ~due to atmospheric transport! also at largerdistances from the coastline. Atmospheric inputs are largan anthropogenic perturbation to the coastal ecosysleading to relatively high biological activity.38 High con-centrations of pollutants have been observed in the Meterranean area, in particular from the run-off after a rain39
The pollution from urbanized coastal sites with large poplation densities, such as the Mediterranean study area,cause an excess of phosphate and nitrate compounds reing in eutrophication. Combined with the high intensitysolar radiation in the Mediterranean area, this induces sstantial enhancement in both chlorophyll and phytoplaton concentrations.40 Biological studies conducted in thMediterranean area, i.e., in Toulon Bay and in Hyeres Bhave indeed revealed an excess in nutrients and eutroption processes throughout the year.40 The effects of marinepollution are thus not limited to a specific period of the ye
erms of Use: http://spiedl.org/terms

onay
In-ain
atiob-curintiosh-es.riseonaner
ultd
e.m-s isbe
husro-ate
ternt oct
heinegi-the
n al, a
asc-co-ol
ros-
di--
hen
ro-isono-
ar-enfi-
11ve-5
r-taltra--n-oftchevi-ve-e-
byd
tses
ithcedof
-
Piazzola et al.: Development of the Mediterranean extinction code
Downl
with a limited duration, as is the case for a phytoplanktbloom. Biologically enhanced production of sea spray malso occur in the winter.
For short fetch, additional effects can play a role.creased pollution has been observed after a strong repisode in bays and estuaries.39 Also, whitecap cover maybe enhanced in the shallow water near the coast.13 Both theincrease in the whitecap cover and the enhanced generdue to the biologic activities induced by pollution, contriute to the production of marine aerosol and can octhroughout the year. The biological effects could explathe relatively large dependence of the aerosol concentraon the wind speed found in the Mediterranean and in Inieer when compared to other sites, such as The Hebrid9
Seasonal variations in aerosol production can also afrom the influence of the sea surface temperaturebubble-mediated sea spray aerosol production. WalshMulhearn41 note that the concentrations of bubbles largthan 100mm ~the precursors of jet droplets! increase withsea surface temperature. In accordance with this, resobtained in a simulation tank by Bowyer, Woolf, anMonahan42 show that the concentrations of jet drops~withradii larger than 2mm! increase with the water temperaturIn addition, Blanchard43 suggested that when the sea teperature increases, the ejection height of the jet droplarger, thereby making it easier for these droplets tocaptured by the turbulent airflow over the waves and tbe transported aloft. A model for the bubble-mediated pduction of sea spray aerosol as a function of the sea wtemperature has been formulated by Ma˚rtensson et al.20
Their model suggests larger production at higher watemperatures, and thus, a seasonal variation dependethe specific geographical location. In addition, this effewould lead to generally higher aerosol production in tMediterranean than at Inisheer. The relatively large marpollution in the Mediterranean area, combined with biolocal and water temperature effects when compared toInisheer site, may thus induce greater aerosol productioyear long, implying a high background level and hencelarger intercept of the regression line.
8 Code MEDEX
In the code MEDEX the Mediterranean aerosol model wcoupled to a Mie44 program to calculate the aerosol extintion for the Mediterranean coastal zone. The extinctionefficient,k ~km21!, of electromagnetic radiation by aerosparticles is given by the expression:
k5E Q~r ,l,m!•N~r !•pr 2dr, ~10!
whereN(r ) is the concentration of particles of radiusr, andQ(r ,l,m) is the extinction efficiency of a particle~as-sumed to be spherical! with radiusr and complex refractiveindex m at wavelengthl. The MEDEX model calculatesthe aerosol size distributionN(r ) from the Mediterraneanaerosol model, or alternatively, accepts a measured aesize distribution. The output of MEDEX has a format compatible with MODTRAN, and hence, can be used torectly supply MODTRAN with aerosol extinction param
oaded From: http://opticalengineering.spiedigitallibrary.org/ on 07/08/2014 T
y
n
n
d
s
r
n
l
ol
eters. In addition, MEDEX offers an option to calculate tvertical profile of aerosol extinction, from 0 to 25 m iheight, using the vertical humidity profile.
9 MEDEX Extinction Calculations
This section describes the predictions of the MEDEX aesol extinction code. To assess coastal effects, a comparis made with extinction values published for different gegraphical locations in the northern hemisphere.
9.1 Extinction During Light Wind Periods
The influence of continental sources on extinction is pticularly observed during periods of low wind speeds, whmarine production is small. In Fig. 11, extinction coefcients calculated at a wind speed of 5 ms21 for fetches of 5,15, and 25 km are plotted versus wavelength. First, Fig.shows that the extinction increases toward shorter walengths, implying that the extinction coefficient in the 3 tomm band is larger than in the 8 to 12mm band. The strongincrease below 2mm is due to submicron continental paticles in the first mode. This is characteristic for continenaerosols with a strong decrease of the particle concentions toward larger sizes~representing the particle size distribution as a power law function, the exponent for a cotinental aerosol size distribution would be on the order24!. The gradual removal of aerosol particles as the feincreases results in a decrease of the extinction asdenced in Fig. 11. The decrease is observed at all walengths, but is relatively more important at shorter wavlengths, where small~continental! aerosols contribute moreto the extinction. Their removal is less counterbalancedthe low production of marine aerosols at this low winspeed.
9.2 Extinction Calculations for High Wind SpeedPeriods at Various Fetches
Figure 12 shows the variation of the extinction coefficienversus wavelength, calculated using MEDEX, for fetchvarying from 3 to 100 km, for wind speed of 12 ms21.Figure 12 clearly shows that the extinction increases wfetch at all wavelengths. This indicates that the enhanproduction of sea spray compensates for the dilutioncontinental particles by advection,14 even at smaller wave
Fig. 11 Variations of the extinction coefficient versus wavelength fora wind speed of 5 m/s and for different fetches. The dashed curverepresents a fetch of 5 km, while the black one is for a fetch of 15 kmand the gray line was recorded for 25-km fetch.
921Optical Engineering, Vol. 42 No. 4, April 2003
erms of Use: http://spiedl.org/terms

EXtud
esolcepX
ose
at
820ad
ea
Xalx-d i
rian-ra.of
rqurica. Ththerlyel,sc-
rallin
ch
rthofef-f thentd
pe-to
l tobyrthal
tobe
icalsonwoon-
thei.e.,ro-to
eano bepro-d ines,
ela-n-an
orthgenicnce.bleosol
pre-ceind-all
romre-r-nt issents
Thehowiallydis-naleer
ter-000er
Piazzola et al.: Development of the Mediterranean extinction code
Downl
lengths. The extinction values predicted using the MEDcode are larger than those usually measured in the sarea13,45 and other geographical locations.46 For example,MEDEX predictions were compared with extinction valupublished by Tolliday et al.,47 which are based on aerosmeasurements at about 10-m height at the Hebrides. Exfor low wind speed episodes at short fetch, the MEDEmodel predicts substantially larger extinctions than thmeasured at the Hebridean coast~almost a factor-of-3 dif-ference!. For wind speed of 17 m/s, the mean extinction10-m height is around 0.13 km21 in the Mediterranean fora fetch of 25 km and 0.55 km21 for a fetch of 100 km,while Tolliday et al.47 present an extinction around 0.1km21 at 10-m height for wind speeds between 15 andm/s. The measurements on the Hebridean coast were min purely marine air masses, representative of open occonditions.
The higher extinction values calculated with MEDEare due to the addition of the fourth mode. For therminfrared wavelengths, the effect of the fourth mode is epected to be even higher. This has also been observeother studies. The 10-mm extinction calculated by theANAM model is about a factor of 2 higher36 than the onegiven by NAM due to the additional fourth mode. Similaenhancement was demonstrated by the addition of gaerosol particles (r .6 mm) measured with Rotorod impaction samplers48 to simultaneously measured PMS spectThe 10-mm extinction increased by roughly a factor3.48,49
10 Summary and Conclusion
On the basis of a dataset obtained on the island of Poerolles near the French Mediterranean Coast, an empiaerosol model for the coastal zone has been developedaerosol model accounts for both the generation andtransport and removal of aerosols. Advection is particulaimportant in the case of land winds. This aerosol modcoupled with a Mie program, is called MEDEX and allowfor an improvement in the prediction of the aerosol extintion in the coastal zone as compared to the more geneused NAM model6 that applies to the open ocean. The maimprovements of MEDEX are the introduction of the fet
Fig. 12 Variations of the extinction coefficient versus wavelength fora wind speed of 12 m/s and for different fetches. The crosses rep-resent a 100-km fetch, while the squares show extinction coeffi-cients at a 25-km fetch, the black one is for a fetch of 13 km, thegray line deals with a 6-km fetch, and the dashed curve gives theextinction for a 3-km fetch.
922 Optical Engineering, Vol. 42 No. 4, April 2003
oaded From: http://opticalengineering.spiedigitallibrary.org/ on 07/08/2014 T
y
t
en
n
t
-le
y
as the governing parameter, and the addition of the foumode in the modeled aerosol spectrum. The introductionthe fetch results in a better parameterization of coastalfects, such as the generation and dispersion processes oaerosol particles. In particular, this allows for improvemein the extinction predictions for moderate and low winspeeds. The extinction predictions for high wind speedriods are improved through the addition of a fourth modethe modeled aerosol size distribution. This is essentiaaccount for the generation of the ‘‘giant’’ spume dropsthe direct action of the wind on the wave crests. The foumode results in larger extinction coefficients in the therminfrared than previously reported in the literature.46
One of the objectives of the present work is to showwhat extent the coastal model for the Mediterranean canused to predict the aerosol extinction at any geographlocation in the northern hemisphere. Thus, a comparibetween the aerosol size distributions predicted for tcoastal sites of Inisheer and the Mediterranean was cducted.
The two coastal areas showed large differences inaerosol concentration for submicron aerosol particles,the continentally influenced first mode of the modeled aesol spectrum. The differences in the first mode are duethe larger anthropogenic emissions near the Mediterrancoast as compared to the Inisheer site, but they may alsa consequence of seasonal variations of the generationcesses. The discrepancies between the two models founthe first mode are reduced for medium and large fetchwhere the effect of the continental particles becomes rtively less important. For relatively short fetches, the cocentrations for aerosols of all sizes in the Mediterranecoastal area are substantially larger than at the Irish NAtlantic Coast, as clearly shown in Fig. 9. This is to a larextent also explained by the influence of anthropogesources on the Mediterranean Coast in the south of Fra
In contrast, for medium and large fetches, a reasonaagreement is found at the two coastal sites between aerspectra for sizes between 0.5 and 5mm ~corresponding tothe second and third modes of the model!. This is to a largepart due to the fact that particles with these sizes aredominantly of marine origin and have larger residentimes in the atmosphere. In particular, a study of the wspeed dependence of the 5-mm concentrations shows a reasonable agreement between the slope coefficients forfetches in both areas, although the intercepts derived fthe Mediterranean data are larger. This may be in partlated to a larger biological activity in that area. Furthemore, for open ocean conditions, a reasonable agreemefound between the two coastal areas studied in the prearticle and the original NAM, although minor differenceexist at small and large particle radii.
For aerosol sizes greater than 5mm, larger discrepanciesbetween the Inisheer and Mediterranean models occur.linear regressions of concentration versus wind speed sthat the intercepts of the regression lines are substantlarger in the Mediterranean. To a large extent, thesecrepancies are directly or indirectly related to the seasovariations of the sea salt aerosol generation. The Inishdata were recorded during the summer, while the Mediranean experiments took place between November 2and February 2001, i.e., in the winter. During the summ
erms of Use: http://spiedl.org/terms

thes
ughtheocr aoferto-an
ason-
to--
35,or. Dou
T.e.
-sA
. dec-ents
M.on,nd
.ofdur-
,
cted
y
ols
he
-gicaean
’
ence
les
ion
ze
ofthe
thene,’’
erron
,2.
-Cen-
eds
on
unc-
ver
o--
ceean
J.ne
ofCH
n
as-
d-
g
ger,’’
b-rine
ter,
d
.o-
and-
ner,DC
, E.in,h
iza-eanl
e
of
n-
Piazzola et al.: Development of the Mediterranean extinction code
Downl
experiments at Inisheer, the wind speed was most oftime relatively low, resulting in low production rate~which resulted in small background concentrations!. Sea-sonal effects not only influence aerosol generation throthe sea temperature and biological activity, but alsoatmospheric aerosol loading due to the more frequentcurrence of moderate and high wind speeds in the wintecompared to summer conditions. In addition, the effectthe pollution in the Mediterranean may explain a highmarine aerosol production in the winter time comparedother geographical locations.9 The consequence is a relatively large background observed in the Mediterraneaerosol concentrations.
Acknowledgments
The experimental campaign on Porquerolles Island wsponsored by the French Ministry of Defense under ctract number 99-42-144-00-470-35-15. The authors wishthank Dr. Y. Hurtaud~DGA! for this support. The contribution of TNO was supported by the Dutch Ministry of Defense and the analysis was part of KM Program V0Project A99KM617. We are grateful to Ing. L. H. Cohen fsetting up the aerosol measurements at PorquerollesPiazzola wishes to express his gratitude to Mr. T. Missamfor his helpful work during the campaign and to Mr.Bourdelles for his help in the conception of the softwar
References1. A. Berk, L. S. Bernstein, and D. C. Robertson, ‘‘MODTRAN: A mod
erate resolution model for LOWTRAN 7,’’ Air Force GeophysicLaboratory Technical Report GL-TR-89-0122, Hanscom AFB, M~1989!.
2. D. R. Jensen, S. G. Gathman, C. R. Zeisse, C. P. McGrath, GLeeuw, M. H. Smith, P. A. Frederickson, and K. L. Davidson, ‘‘Eletro optical propagation assessment in coastal environm~EOPACE!: Overview and initial accomplishments,’’Opt. Eng.40~8!,1486–1498~2001!.
3. S. M. Doss-Hammel, C. R. Zeisse, A. E. Barrios, G. de Leeuw,Moerman, A. N. de Jong, P. A. Frederickson, and K. L. Davids‘‘Low altitude infrared propagation in a coastal zone: refraction ascattering,’’Appl. Opt.~in press!.
4. J. L. Forand, D. Dion, M. Duffy, S. G. Gathman, K. Littfin, A. NJong, G. De Leeuw, and K. L. Davidson, ‘‘An extensive analysislow-level IR transmission measurements taken over a 15km pathing EOPACE with IRBLEM,’’ Proc. SPIE3433, 90–101~1998!.
5. G. J. Kunz, M. M. Moerman, and A. M. J. Van Eijk, ‘‘ARTEAMadvanced ray tracing with earth atmospheric models,’’Proc. SPIE4718, 397–404~2002!.
6. S. G. Gathman, ‘‘Optical properties of the marine aerosol as prediby the Navy aerosol model,’’Opt. Eng.22~1!, 57–62~1983!.
7. S. G. Gathman, ‘‘A preliminary description of NOVAM, the NavOceanic Vertical Aerosol Model,’’ NRL Report no. 9200~1989!.
8. S. G. Gathman and A. M. J. Van Eijk, ‘‘Characterizing large aerosat the lowest levels of marine atmosphere,’’Proc. SPIE3433, 41–52~1998!.
9. J. Piazzola, A. M. J. Van Eijk, and G. De Leeuw, ‘‘An extension of tNavy Aerosol Model to coastal areas,’’Opt. Eng.39~6!, 1620–1631~2000!.
10. M. Tanguy, H. Bonhommet, M. L. Autric, and P. Vigliano, ‘‘Correlation between the aerosol profiles measurements, the meteoroloconditions and the atmospheric I.R transmission in a Meditterranatmosphere,’’Proc. SPIE1487, 172–184~1991!.
11. S. A. Hsu, ‘‘A mechanism for the increase of wind stress~drag! coef-ficient with wind speed over water surfaces: A parametric model,’J.Phys. Oceanogr.16, 144–150~1986!.
12. G. J. Komen, S. Hasselmann, and K. Hasselmann, ‘‘On the existof a fully developed wind-sea spectrum,’’J. Phys. Oceanogr.14,1271–1285~1984!.
13. J. Piazzola, ‘‘Etude de la distribution verticale des particud’aerosols au voisinage de l’interface mer-air en zone coˆtiere Medi-terraneenne,’’ PhD thesis, University of Toulon-Var, France~1996!.
14. E. Vignati, G. de Leeuw, M. Schulz, and E. Plate, ‘‘Characterizatof aerosols at a coastal site near Vindeby~Denmark!,’’ J. Geophys.Res.104~C2!, 3277–3287~1999!.
15. A. M. J. Van Eijk and G. De Leeuw, ‘‘Modeling aerosol particle si
oaded From: http://opticalengineering.spiedigitallibrary.org/ on 07/08/2014 T
-s
r.
l
distributions over the North sea,’’J. Geophys. Res.97~C9!, 14417–14429~1992!.
16. J. W. Fitzgerald, ‘‘Approximation formulas for the equilibrium sizean aerosol particle as a function of its dry and composition andambient relative humidity,’’J. Appl. Meteorol.14, 1044–1049~1975!.
17. J. Piazzola and S. Despiau, ‘‘Contribution of marine aerosols inparticle size distributions observed in Mediterranean coastal zoAtmos. Environ.31~18!, 2991–3009~1997!.
18. C. D. O’Dowd and M. H. Smith, ‘‘Physical properties of aerosols ovthe Northeast Atlantic: evidence for wind-speed-related submicsea-salt aerosol production,’’J. Geophys. Res.98~D1!, 1137–1149~1993!.
19. E. D. Nilsson, U¨ . Rannik, E. Swietlicki, C. Leck, P. P. Aalto, J. Zhouand M. Norman, ‘‘Turbulent aerosol fluxes over the Arctic OceanWind-driven sources from the sea,’’J. Geophys. Res.106, 32139–32154~2001!.
20. M. Martensson, E. D. Nilsson, G. de Leeuw, L. H. Cohen, and HHansson, ‘‘Laboratory simulations of the primary marine aerosol gerated by bubble bursting’’~submitted for publication!.
21. E. L. Andreas, ‘‘A new sea spray generation function for wind speup to 32 ms21,’’ J. Phys. Oceanogr.28, 2175–2184~1998!.
22. S. A. Slinn and W. G. N. Slinn, ‘‘Predictions for particle depositionnatural waters,’’Atmos. Environ.14, 1013–1016~1980!.
23. J. Piazzola, P. Forget, and S. Despiau, ‘‘A sea spray generation ftion for fetch-limited conditions,’’Ann. Geophys.20~1!, 121–131~2002!.
24. G. De Leeuw, ‘‘Aerosol effects on electro-optical propagation osea,’’Proc. SPIE1971, 2–15~1993!.
25. H. E. Gerber, ‘‘Relative humidity parameterization of the Navy Aersol Model ~NAM !,’’ NRL Report no. 8956, National Research Laboratory, Washington DC~1985!.
26. W. A. Hoppel, G. M. Frick, and J. W. Fitzgerald, ‘‘The surface sourfunction for sea-salt aerosol and aerosol dry deposition to the ocsurface,’’J. Geophys. Res.~in press!.
27. D. Hauser, H. Dupuis, X. Durrieu, C. De Madron, C. Estournel,Flamant, P. Pelon, and P. Queffeulou, ‘‘La Campagne FETCH: Uexperience l’etude des e´changes oce´an/atmosphe`re dans les conditionscotieres du Golfe du Lion,’’La Meteorologie, 8~29!, ~2000!.
28. K. Sellegri, S. Despiau, and J. Gourdeau, ‘‘Chemical compositionmarine aerosol in a Mediterranean coastal zone during the FETexperiment,’’J. Geophys. Res.~in press!.
29. A. K. Goroch, S. K. Burk, and K. L. Davidson, ‘‘Stability effects oaerosol size and height distributions,’’Tellus32, 245–250~1980!.
30. E. C. Monahan and I. G. O’Muircheartaigh, ‘‘Whitecaps and the psive remote sensing of the ocean surface,’’Int. J. Remote Sens.7,627–642~1986!.
31. M. H. Smith, I. E. Consterdine, and P. M. Park, ‘‘Atmospheric loaings of marine aerosol during a Hebridean cyclone,’’Q. J. R. Meteo-rol. Soc.115, 383–395~1989!.
32. S. A. Thorpe, P. Bowyer, and D. K. Woolf, ‘‘Some factors affectinthe size distributions of oceanic bubbles,’’J. Phys. Oceanogr.22,382–389~1992!.
33. G. De Leeuw, A. M. J. van Eijk, and G. R. Noordhuis, ‘‘Modellinaerosols and extinction in the marine atmospheric boundary layProc. SPIE1968, 70–80~1993!.
34. E. C. Monahan, C. W. Fairall, K. L. Davidson, and P. J. Boyle, ‘‘Oserved interrelation between 10 m winds, ocan whitecaps and maaerosols,’’Q. J. R. Meteorol. Soc.109, 375–392~1983!.
35. G. de Leeuw, K. L. Davidson, S. G. Gathman, and R. V. Noonkes‘‘Modeling of aerosols in the marine mixed layer,’’Proc. SPIE1115,287–294~1989!.
36. A. M. J. van Eijk, ‘‘The ANAM-3.0 development,’’ TNO Physics anElectronics Laboratory, Report FEL-01-C187~2001!.
37. H. W. Paerl, W. R. Boynton, R. L. Dennis, C. T. Driscoll, H. SGreening, J. N. Kremer, N. N. Rabalais, and S. P. Seitzinger, ‘‘Atmspheric deposition of nitrogen in coastal waters: biogeochemicalecological implications,’’ inNitrogen Loading in Coastal Water Bodies: An Atmospheric Perspective, R. A. Valigura, R. B. Alexander, M.S. Castro, T. P. Meyers, H. W. Paerl, P. E. Stacey, and R. E. TurEds., pp. 11–52, American Geophysical Union, Washington,~2001!.
38. G. De Leeuw, L. Spokes, T. Jickells, C. Ambelas Skjøth, O. HertelVignati, S. Tamm, M. Schulz, L.-L. Sorensen, B. Pedersen, L. Kleand K. H. Schlu¨nzen, ‘‘Atmospheric nitrogen inputs into the NortSea: Effect on productivity’’~submitted for publication!.
39. C. Germain, Y. Lucas, C. Lamorte, and C. Le Poupon, ‘‘Charactertion and quantification of transfer in a small coastal mediterranriver during a storm event,’’1st French Meeting on EnvironmentaChemistry, abstract E099, Nancy, Water Institute~2000!.
40. J. L. Jamet, G. Boge´, S. Richard, C. Geneys, and D. Jamet, ‘‘Thzooplankton community in bays of Toulon area~northwest Mediterra-nean sea, France!,’’ Hydrobiologia457, 155–165~2001!.
41. A. L. Walsh and P. J. Mulhearn, ‘‘Photographic measurementsbubble populations from breaking wind waves at sea,’’J. Geophys.Res.92, 14553–14565~1987!.
42. P. A. Bowyer, D. K. Woolf, and E. C. Monahan, ‘‘Temperature depe
923Optical Engineering, Vol. 42 No. 4, April 2003
erms of Use: http://spiedl.org/terms

king
les
-
nde se
he
‘Athe
nd4,
sea
ownd
Piazzola et al.: Development of the Mediterranean extinction code
Downl
dence of the charge and aerosol production associated with breawave in a whitecap simulation tank,’’J. Geophys. Res.95~C4!, 5313–5319 ~1990!.
43. D. C. Blanchard, ‘‘The electrification of the atmosphere by particfrom bubbles in the sea,’’Prog. Oceanogr.1, 71–202~1963!.
44. G. Mie, ‘‘Beitrage zur optik tru¨ber medien, speziell kolloidaler metallosungen,’’Annalen der Physik, 25 ~1908!.
45. J. Piazzola and S. Despiau, ‘‘The vertical variation of extinction aatmospheric transmission due to aerosol particles close above thsurface in Mediterranean coastal zone,’’Opt. Eng.37~6!, 1684–1695~1998!.
46. G. De Leeuw, ‘‘Aerosol models for optical and IR propagation in tmarine atmospheric boundary layer,’’Proc. SPIE 1487, 130–159~1991!.
47. N. P. Tolliday, M. H. Smith, P. M. Park, and I. E. Consterdine, ‘survey of the maritime-aerosol data collected at south uist andimplications for the Lowtran maritime aerosol model,’’ inAtmo-spheric Propagation in the UV, Visible, IR and MMwave Region aRelated Systems Aspects, pp. 1–11, Agard Conference C-P 45Copenhague~1989!.
48. G. De Leeuw, ‘‘Vertical profiles of giant particles close above thesurface,’’Tellus38B, 51–61~1986!.
49. G. de Leeuw, ‘‘Vertical distributions of sea-spray particles at lheights and calculated extinction coefficients,’’ TNO Physics aElectronics Laboratory, report FEL 1985-33~1985!.
Jacques Piazzola received his PhD thesisfrom Toulon University, France, in 1996. In1997, he worked as a post-doctoral at theTNO Physics and Electronics Laboratory inThe Hague, The Netherlands. He joinedthe Institute of Engineering Sciences(ISITV) of the University of Toulon-Var in1998, where he currently holds a perma-nent position of Associate Professor in theOceanic Engineering Department. His re-search interests lie in marine boundary
layer meteorology with a focus on the air-sea interaction processesand the marine aerosol generation. In particular, one part of his work
924 Optical Engineering, Vol. 42 No. 4, April 2003
oaded From: http://opticalengineering.spiedigitallibrary.org/ on 07/08/2014 T
a
deals with the influence of the sea state development on the seaspray production and the infrared propagation.
Frederic Bouchara received his PhD degree from Toulon Univer-sity, France, in 1998, where he has been an assistant professorsince 1998. His research deals with optical propagation in maritimeenvironment and image processing.
Gerrit de Leeuw received his PhD in 1981 from the University ofAmsterdam, The Netherlands. Since then, he has worked at theTNO Physics and Electronics Laboratory, where he is currently re-sponsible for the section Atmospheric Research. In 1989 he spent asabbatical year at the Naval Postgraduate School in Monterey, Cali-fornia. Since 1996, he has been a Senior Research Fellow of TNO.Since 1999, he has also been a Professor of the University of Sun-derland, United Kingdom. His research interests are physical pro-cesses in the atmosphere, with applications in the field of radiativeeffects (climate), pollution (air and water), and atmospheric effectson the performance of electro-optical sensors.
Alexander M.J. Van Eijk received his PhD degree in physicalchemistry from Leyden University, The Netherlands. In 1989 heworked as a post-doctoral at the University of California at Riversidein the field of multiphoton ionization spectroscopy. At the end of1989, he joined the TNO Physics and Electronics Laboratory in TheHague, The Netherlands, where he is a scientist in the Electro-Optical Propagation Group. In 1992, he was a visiting assistant pro-fessor at the Ecole Centrale de Nantes in France. His current inter-est is aerosol physics in the atmospheric surface layer. Researchefforts include participation in experimental programs, statisticalanalysis of the aerosol concentration as function of meteorologicalparameters, and numerical modeling to provide a physical under-standing of the processes that govern the aerosol concentrationclose to the sea surface.
erms of Use: http://spiedl.org/terms