development of the loss aversion questionnaire
TRANSCRIPT

D/2012/6482/09
DEVELOPMENT OF
THE LOSS AVERSION
QUESTIONNAIRE
SHARI DE BAETS
MARC BUELENS
October 2012
September 2012
2012/09
2012/09

2
DEVELOPMENT OF THE LOSS AVERSION QUESTIONNAIRE
SHARI DE BAETS
Vlerick Business School
MARC BUELENS
Vlerick Business School
Contact:
Shari De Baets
Vlerick Business School
Vlamingenstraat 83
3000 Leuven

3
ABSTRACT
Little is known about individual differences in loss aversion. This is particularly surprising if one
considers the strong emphasis on individual differences in both economics and psychology. A Loss
Aversion Questionnaire is proposed as an instrument that is capable of measuring interindividual
differences in loss aversion. Two studies (N1 = 187; N2 = 455) were conducted to validate the
measure. Results support the view that loss aversion can be conceptualized as a measure of
interindividual difference. Various groups (students, entrepreneurs, managers, and civil servants)
were found to differ significantly in the degree to which they displayed loss aversion. Furthermore,
we report on issues of differential validity with other well-known concepts such as risk aversion,
impulsivity, and anxiety
4
INTRODUCTION
Despite the widespread acceptance of prospect theory and its emphasis on loss aversion,
little or nothing is known about individual differences in loss aversion. Mohammed and Schwall
(2009) note a surprising and consistent reluctance to include individual differences in decision-
making studies. This is certainly the case in the study of decisions that involve risk. Individual
differences are usually disregarded when interpreting the descriptive/normative gap in risk
assessment (Stanovich & West, 1998), and not much has changed since Li and Liu’s (2008) warning
that individual differences have received too little attention in studies on risk preference.
This gap in the research is particularly surprising if one considers the strong emphasis on
individual differences in fields such as economics and psychology. Modern economic theory even
puts the concept of heterogeneity at its core (Hommes, 2006). Nobel laureate Kenneth J. Arrow has
emphasized that, in microeconomics, heterogeneity of expectations may be the most fundamental
starting point. Without heterogeneity, there is no trade (Arrow, 2004). In psychology, cognitive
styles, personality, cognitive abilities, and cognitive strategies represent fundamental determinants
of individual and organizational behavior that become apparent in individual workplace actions and
in organizational systems, processes, and routines (e.g. Sadler-Smith, 2009).
More specifically, it is remarkable how little attention has been paid to interindividual
differences with respect to the longstanding concept of loss aversion. The impact on loss aversion of
sociodemographic individual characteristics such as age, gender, education, or profession has been
investigated in behavioral economics (e.g. Eckel & Grossman, 2003; Gächter, Johnson, & Herrmann,
2007; Haigh & List, 2005; Schmidt & Traub, 2002). However, the interest from personality
psychologists has been minimal. Thus far, there are no answers to questions such as: Is loss aversion
a personality trait? If it is, how stable is it over time and situations? Is it correlated with personality
factors such as trait anxiety or sensation seeking?
Our study is intended to contribute to the loss aversion literature in a number of ways. First,
we address the issue of individual differences in loss aversion. Second, with regard to its
measurement, we question the current use of mathematical choice dilemmas, and address issues of
generalizability, and external and predictive validity. Finally, we propose a new instrument for loss
aversion that is capable of measuring individual differences, namely a psychometric scale entitled the
Loss Aversion Questionnaire (LAQ).

5
PROSPECT THEORY AND LOSS AVERSION
Prospect theory (Kahneman & Tversky, 1979) is a model in the field of decision making and
risk psychology that effectively describes how individuals differ from normative models in their day-
to-day decision making. A central assumption of prospect theory is that the probability weighting
function for risk-involved decisions toward gains has greater curvature than the function for losses.
This was first described by Kahneman and Tversky (1979) as loss aversion, referring to the fact that
“losses loom larger than gains.”
Köbberling and Wakker (2005) suggest that risk attitude includes three separate
components: basic utility, probability weighting, and loss aversion. Loss aversion is deemed
responsible for the largest part of risk aversion, and it refers to the tendency of people making
subjective evaluations to place greater weight on losses than on objective equivalent gains.
Outcomes are evaluated as losses (or gains) if they are below (or above) a reference outcome, which
can be a status quo or an “aspiration level” (Heath, Larrick, & Wu, 1999). Indeed, one of the
fundamentals of prospect theory is that people frame a problem around a reference point
(Kahneman & Tversky, 1979), a phenomenon termed reference dependence (Tversky & Kahneman,
1991). In decision choices, loss aversion will play its role if something is framed as a loss rather than a
gain relative to the reference point.
Loss aversion is frequently used to explain facts that are often observed, but it lacks a
coherent explanation, which is not provided by expected-utility economic theories such as the
endowment effect, status quo bias, and the Willingness to Accept–Willingness to Pay (WTA–WTP)
gap (Kahneman, Knetsch, & Thaler, 1990). It has also been used to explain a wide array of
nonlaboratory phenomena (for an overview, see Holmes, Bromiley, Devers, Holcomb, & McGuire,
2011) such as the behavior of cab drivers, who stop work earlier on days with bad weather, when
their number of fares is highest (Camerer, Babcock, Loewenstein, & Thaler, 2000), or the fact that
progress made by racial minorities is perceived differently according to group membership (Eibach &
Keegan, 2006).
The existence of loss aversion has thus been extensively shown in a vast number of situations
and via multiple research methods, ranging from economic and psychological laboratory studies to
field studies, and by neurobiological approaches such as measuring skin conductance response
(Sokol-Hessner et al., 2009) or pupil dilation and heart rate (Hochman & Yechiam, in press), and the
use of fMRI scans (e.g. Rick, in press)
6
MEASUREMENTS AND INDIVIDUAL DIFFERENCES IN LOSS AVERSION
In his review of psychology and economics, Rabin (1998) emphasized the importance of loss
aversion as a psychological phenomenon that should be integrated into the field of economics.
Although risk and loss aversion are seen as crossovers between economics and psychology, the main
body of research still focuses on the economics side. Consequently, measurement is usually in the
form of mathematical choice dilemmas. The question arises whether the predictive validity of
expected-utility-based assessments of loss aversion is sufficient. Such assessments typically consist of
short, novel tasks that require participants simply to select between a provided set of alternatives.
This type of task limits choice and restricts behavior, thereby giving personality traits little time to
manifest (Mohammed & Schwall, 2009). A loss aversion questionnaire that does not utilize choice
dilemmas may thus have better predictive validity. Mathematically formulated questionnaires also
impose severe problems in measuring loss aversion among innumerate people. Moreover, even
within economics, the predictive validity of such mathematical choices can be called into question.
Kusev, van Schaik, Ayton, Dent and Chater (2009) disproved the assumption that decisions involving
monetary gambles are predictive of domain-independent risk preferences, and even for same-
domain preferences such as finances. In addition, because of their choice dilemma nature, most loss-
aversion studies are conducted in laboratories using young, well-educated student subjects (Gächter
et al., 2007), thereby limiting possible variation. The general problem of external validity of
laboratory experiments raises further methodological issues (Allport, 1968). Lange and Ratan (2010)
recently investigated and confirmed this in the case of loss aversion and concluded with a word of
caution regarding transferring findings from laboratory experiments to the field. The research field is
thus in need of a psychometric tool to measure loss aversion outside the games and decisions
framework and the laboratory. This instrument will also enable researchers to relate loss aversion to
other individual differences such as cognitive styles or personality.
Although classical decision theory has regarded risk propensity as situational (Kahneman &
Tversky, 1979), it has long been acknowledged that individual risk attitude is a key part of personality
(for an overview, see Mohammed & Schwall, 2009). We argue that loss aversion differs significantly
across individuals, which is supported by the findings of Gächter et al. (2007). They found individual
heterogeneity in loss aversion in their experiment: 4.9% of respondents were loss seeking, 7.1% were
loss neutral, and 88% were loss averse. More importantly, the 88% loss-averse individuals differed in
their degree of loss aversion; among them 10% were even classified as “very strongly loss averse.”

7
From the abovementioned research, we may infer that individual differences in loss aversion
do exist. We propose that they can be measured with a psychometric questionnaire to overcome the
issues associated with mathematical choice dilemmas.
Hypothesis 1. Individual differences in loss aversion can be measured with a psychometric
questionnaire.
For the relation between loss aversion and personality traits, we can refer to the research
into the relation between risk aversion and personality traits. In a study of reported risk taking over
several decision domains, risk taking overall was associated positively with extraversion and
openness, and negatively with neuroticism, agreeableness, and conscientiousness (Nicholson, Soane,
Fenton-O’Creevy, & Willman, 2005). Another study found that risk taking was positively associated
with openness and negatively with agreeableness and conscientiousness (Kowert & Hermann, 1997).
According to Soane and Chmiel (2005), the research into the relationship between risk and
personality has two important ramifications. First, people will avoid (or take) risks consistent with
their character. Second, because personality is relatively stable throughout adulthood (McCrae &
Costa, 1997), the tendency to avoid (or take) risks may also be robust. In line with their research, we
propose that loss aversion is also correlated with stable personality traits.
As stated above, loss aversion is thought to be responsible for the majority of risk aversion
(Kobberling & Wakker, 2005); thus, the following hypothesis can be deduced.
Hypothesis 2. Loss aversion is positively related to risk aversion.
It has been suggested by Camerer (2005) that the basis of loss aversion lies in fear. This is
supported by the finding by De Martino et al. (2010) that patients with lesions to the amygdala, the
brain region associated with fear processing, experienced no loss aversion. In addition, Loewenstein
(2001) proposed that, in line with this risk-as-feelings hypothesis, risk-related research should take
emotions into account. Considering the neurological basis and support from the risk-as-feelings
hypothesis, we will investigate the relationship between loss aversion and fear.
Hypothesis 3. Loss aversion is positively related to anxiety.
It has been suggested that the neural systems responsible for loss aversion are the same as
those for impulsive behavior (e.g. Tom, Fox, Trepel, & Poldrack, 2007). Damage to the DA system, for
8
instance, leads to a diminished sensitivity to loss aversion, but is at the same time responsible for
increased impulsivity. We therefore make the following hypothesis.
Hypothesis 4. Loss aversion is negatively related to impulsivity.
METHOD
Constructing the Loss Aversion Questionnaire
We created an initial pool of items based on an extensive study of the loss aversion
literature. In addition, a convenience sample of nine adults (mean age = 38.7 yr., five men and four
women) were interviewed about their experience of and emotions toward the subject of loss and
loss aversion. Sixty items were derived from the literature study and the interviews. Of those 60
items, we selected 20 items, after taking several criteria into account. We aimed to select a wide
variety of losses, such as in personal affairs, reputation, status, and identity. Both positively and
negatively formulated items were included to avoid acquiescence bias (Billiet & McClendon, 2000).
To ensure content validity (Haynes, Richard, & Kubany, 1995; Most & Zeidner, 1995), three experts in
the field of decision making judged the content and relevance of the original 60 items. Modifications
such as the removal of synonymic items were made and double negations were removed. Feedback
from the experts suggested that the items had acceptable face validity. Based on their review, 20
items were retained for use in the first test version of the Loss Aversion Questionnaire.
In the first two preliminary studies the reliability, consistency, and validity were tested.
Preliminary Study 1
In study 1, the 20 items retained based on the expert review were tested for the first time
among a random selection of participants.

9
Sample and Procedure
A survey was conducted of 65 conference attendees from a variety of Belgian organizations.
One of the authors of this study was a guest speaker and invited attendees to participate in the
study. Ninety paper-and-pencil surveys were distributed and 65 were returned, indicating a response
rate of 72%. The questionnaire consisted of English items; all conference attendees were
multilingual, because they were attending a conference conducted in the English language. To
minimize bias because of social desirability, confidentiality and anonymity were guaranteed. The
sample consisted of 37 men (56.90%) and 28 women (43.10%), with a mean age of 41.23 (SD = 9.84),
ranging from 24 to 69 yr. The average educational level was high; the majority of people in the
sample held a university degree (67.70%), 18.50% a postgraduate degree, and 13.80% a secondary
education degree.
Measures and Results
All 20 items were answered on a five-point Likert scale (1 = strongly disagree, 5 = strongly
agree) to indicate the extent to which the respondent agreed with the statement. Participants were
invited to write down qualitative feedback or provide it orally.
Loss Aversion
The 20 items had a Cronbach’s of .62 (Table 1).
Insert Table 1 about here
Preliminary Study 2
Based on qualitative feedback from preliminary study 1, five items were altered to achieve
positive wording and less cognitive complexity. Based on previous experience and further theoretical
research, five further items were added to improve quality. The following five items were reworded
(strikethrough indicates removed words, bold indicates new words).

10
I really don’t care feel awful if someone talks bad about me behind my back.
I don’t care It’s horrible if my your boss thinks less of me you than I’m you’re really worth.
I wouldn’t care if I had I would have problems with having to move to a smaller place.
I would never accept have no problem accepting a job that has less pay than my
previous/current one.
I wouldn’t like it would feel very tense if the company changed our way of working.
In addition, the following five extra items were added.
21. I always save my computer files in different locations.
22. I think I could cope with losing all my belongings in a fire.
23. I think I would go crazy, being locked up in prison.
24. I would be okay with trading my current car (bike) for a cheaper model.
25. I get easily attached to material things (my car, my furniture …).
Moreover, items from the State-Trait Anxiety Inventory (STAI; Spielberger, 1983) for
measuring anxiety were added to the survey to test their reliability for the validation study.
Sample and Procedure
A survey was conducted among 122 participants from a variety of Belgian organizations. Two
hundred paper-and-pencil surveys were distributed after a lecture on general management and 122
were returned, indicating a response rate of 61%. The questionnaire consisted of English items; all
participants were multilingual, because they had attended a lecture in the English language. To
minimize bias because of social desirability, confidentiality and anonymity were guaranteed. The
sample consisted of 99 men (81.10%) and 23 women (18.90%), with a mean age of 39.46 (SD =
11.91), ranging from 20 to 65 yr. The majority of the sample held a university degree (70.50%), 0.80%
held a secondary education degree, and 28.70% a postgraduate degree.

11
Measures
All items were answered on a five-point Likert scale (1 = strongly disagree, 5 = strongly agree)
to indicate the extent to which the respondent agreed with the statement. Because of the limited
timeframe, the number of scales was limited.
Anxiety
To measure anxiety, the STAI was used. More specifically, the items from the Anxiety scale of
the STAI-T were used. The STAI is one of the most frequently used and long-standing measures of
anxiety, appearing in more than 3000 studies (Bieling, Antony, & Swinson, 1998). The STAI-T
measures a stable inclination to experience anxiety, and perceive stressful situations as threatening.
Based on the analysis of Bieling et al. (1998), all items of the Anxiety scale with a factor loading above
.30 were used. Items were “I worry too much over stuff that doesn’t really matter,” “I have
disturbing thoughts,” “I take disappointments so keenly that I can’t put them out of my mind,” and “I
get in a state of tension or turmoil as I think over my recent concerns and interests.” Cronbach’s
was .63, indicating acceptable reliability for a four-item scale.
Loss Aversion
In preliminary study 2, the 25 items had a Cronbach’s of .69.
Results
Table 2 shows the means and standard deviations of the 25 proposed items of the Loss
Aversion Questionnaire. The number of missing values was low, ranging from 0% to 0.82% and the
distribution of the missing values was considered random (Cohen & Cohen, 1983). The means of all
items ranged from 2.43 to 3.87. All standard deviations exceeded 0.50, indicating adequate
variability (Stumpf, Colarelli, & Hartman, 1983).
Insert Table 2 about here
12
A positive relationship was predicted between the Loss Aversion Questionnaire and the STAI,
measuring anxiety, which was confirmed and significant (r = .298, p < .01).
Study 3
In study 3, the questionnaire was tested with a large number of participants in various
positions. The 18 items with the highest item total correlation and greatest contribution to the
overall reliability of the scale from the preliminary studies were retained for larger-scale testing.
Sample and Procedure
A survey was conducted among 479 participants. Six hundred paper-and-pencil surveys were
distributed after a lecture on general management for managers (Belgium), a lecture for
entrepreneurs (Belgium), a class of first-grade economics students (Belgium), and a congress for civil
servants (the Netherlands). The response rate was 79%. The questionnaire consisted of English items;
all participants were multilingual, because the congress and lectures were in the English language. To
minimize bias because of social desirability, confidentiality and anonymity were guaranteed. The
sample consisted of 296 men (61.80%) and 180 women (37.60%), with a mean age of 35.34 (SD =
14.22), ranging from 19 to 68 yr. Of the respondents, 0.40% held a primary school degree, 45.50% a
secondary education degree, 41.50% a university degree (41.50%), and 4.00% a postgraduate degree.
The sample consisted of 45 managers (9.40%), 55 entrepreneurs (11.50%), 204 students (42.60%),
and 173 civil servants (36.10%).
Measures
All items were answered on a five-point Likert scale (1 = strongly disagree, 5 = strongly agree)
to indicate the extent to which the respondent agreed with the statement. To select the items from
the scales, relevance to the current study as well as high factor loadings in previous validation studies
were taken into account. Where necessary, small adjustments were made to the items so that they
would fit the response scale.

13
Impulsiveness
Impulsiveness was measured by a selection of four items of the Barratt Impulsiveness Scale
(BIS; Barratt, 1959). More specifically, items were selected from a pool of 30 items from the BIS-11, a
self-report scale designed to measure general impulsiveness (Patton, Stanford, & Barratt, 1995).
Items were: “I act on impulse,” “I say things without thinking,” “I act on the spur of the moment,”
and “I do things without thinking.” Cronbach’s was .80.
Anxiety
Anxiety was measured using the same items as in study 2, from the State-Trait Anxiety
Inventory (STAI; Spielberger, 1983). Cronbach’s was .68.
Risk Aversion
To measure risk aversion, items were used from the DOSPERT scale (Weber, Blais, & Betz,
2002). The DOSPERT scale was developed by Weber et al. (2002) to measure individual differences in
attitude towards risk and is the only psychometric scale available for measuring risk aversion. From
the original 40-item scale, 10 items were selected and adapted so that they could be answered on
our Likert scale. An example item is “I would dare to invest 10% of my annual income in a very
speculative stock.” Cronbach’s was .56.
Loss Aversion
Eighteen items with the highest item-total correlation and highest contribution to the overall
reliability from the scale from the preliminary studies were retained for larger-scale testing.
Cronbach’s was .82.
Results
Table 3 shows the means and standard deviations of the 18 items of the Loss Aversion
Questionnaire. The number of missing values was low, ranging from 0% to 0.40% and the distribution
of the missing values was considered random (Cohen & Cohen, 1983). The means of all items ranged
from 2.48 to 3.94. All standard deviations exceeded 0.50, indicating adequate variability (Stumpf et
al., 1983). Cronbach’s supports hypothesis 1, which states that individual differences in loss
aversion can be measured with a psychometric questionnaire.
14
Insert Table 3 about here
Based on an exploratory principal axis analysis with Oblimin rotation, the DOSPERT scale was
removed because of low reliability and low factor loadings. Moreover, items 4 and 17 of the Loss
Aversion Questionnaire were deleted because of a strong wording effect. BIS (impulsivity) loaded on
a single factor and had no confounding characteristics with the items of the Loss Aversion
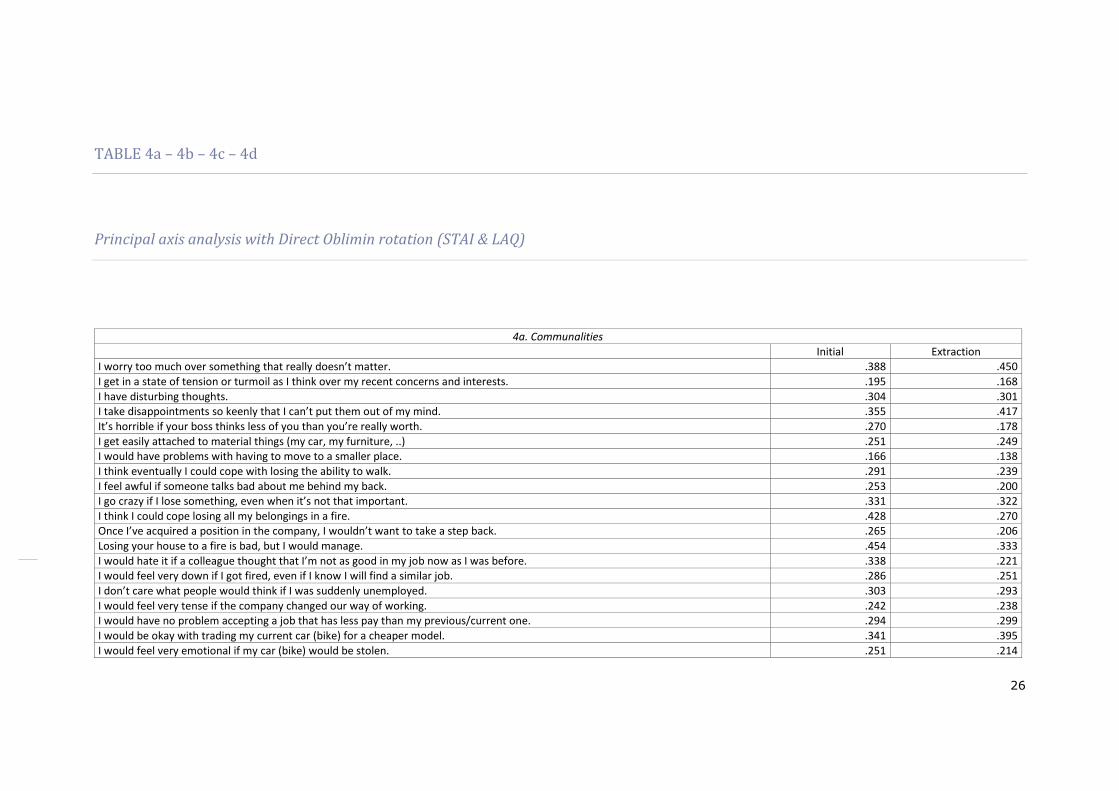
Questionnaire. We then repeated the exploratory principal axis analysis with Oblimin rotation with
the loss aversion and anxiety scales on two factors (Table 3). We chose Oblimin rotation given the
correlation between the two scales. Only the items with a factor loading above .40 on the second
factor (loss aversion), with no significant loadings (<.30) on the first factor (anxiety) were retained to
form the final version of the Loss Aversion Questionnaire. This final version consists of seven items
(in bold in Table 4) with a Cronbach’s of .72. We then performed a confirmatory factor analysis
with AMOS 19 containing three factors for the final loss aversion scale (LAQ), the impulsivity scale
(BIS) and the anxiety scale (STAI), respectively. Modification indices indicated that covariance should
be added between the error terms of LAQ 5 and LAQ 8. An examination of the items suggests that
this is theoretically justifiable because both deal specifically with “coping.” Good fit is traditionally
indicated by a nonsignificant Chi-square measure of absolute fit. However, this measure is often
significant with a large sample size (Hu & Bentler, 1999). Therefore, other indices that are less
susceptible to the effects of sample size are used. Good fit is indicated by a relative likelihood ratio
(RLR; ²/df) < 5 or 3 (Wheaton, Muthen, Alwin, & Summers, 1977), a comparative fit index (CFI) > .9,
and a root mean square error of approximation (RMSEA) < .06 (Hu & Bentler, 1999). The results
indicated a good fit (² (100) = 221, 398, p < .001; RLR: 2.21; RMSEA = .05; and CFI = .921).
Insert Table 4 about here
15
Sociodemographic Variables
Gender.—Men and women did not differ significantly in their score on loss aversion (F =
4.361, p = .102) or impulsivity (F = .158, p = .125). They did, however, differ significantly in their score
on anxiety (F = .374, p = .003) with women scoring higher on anxiety (mean = 2.82) than men (mean
= 2.62).
Educational level.—Participants differed significantly according to their educational level in
their score on loss aversion (F = 80.457, p < .001) and anxiety (F = 17.836, p < .001), and the
difference was marginally significant in their score on impulsivity (F = 2.211, p < .10). Having a
university or postgraduate degree (N = 198, mean = 2.82) significantly reduced displayed loss
aversion (F = .018, p < .000) compared with secondary education (N = 207, mean = 3.44). The number
of people with only primary school education (N = 2) was insufficient to draw valid conclusions.
Similarly, people holding a university or postgraduate degree (N = 198, mean = 2.48) had significantly
lower scores on anxiety (F = .852, p < .000) compared with those with only secondary education (N =
216, mean = 2.96). A university or postgraduate degree (N = 198, mean =2.58) also meant a
decreased impulsivity score (F = 9.519, p < .05) compared with secondary education alone (N = 207,
mean = 2.76).
Employment type.—Participants also differed significantly according to their employment
type in their scores on loss aversion (F = 80.399, p < .001), anxiety (F = 19.891, p < .001), and
impulsivity (F = 5.678, p < .001). Students displayed the highest average score on loss aversion (mean
= 3.46) and anxiety (mean = 2.97), and entrepreneurs displayed the highest average score on
impulsivity (mean = 2.79). The lowest average score on impulsivity (mean = 2.30) was displayed by
managers, as well as the lowest average score on anxiety (mean = 2.43). The lowest average score on
loss aversion (mean = 2.78) was for the civil servants group.
Age.—Participants scored differently according to their age on loss aversion (F = 5.574, p <
.000) and anxiety (F = 2.519, p < .000). To further explore the shape of these relations, we performed
a median split according to age (median age = 36). Those who scored below the median (N = 228)
displayed greater loss aversion (mean = 3.38) than those who scored above the median (N = 233,
mean = 2.85; F = .015, p < .000). Similarly, those who scored below the median (N = 237) scored
higher on anxiety (mean = 2.89) than those who scored above the median (N = 237, mean = 2.51; F =
2.091, p < .000).
16
Related Variables
Hypothesis 2 predicted a positive relationship between loss aversion, measured by the Loss
Aversion Questionnaire, and risk aversion, measured by the DOSPERT scale. However, because of the
low reliability of the DOSPERT scale in this study, the hypothesis cannot be tested. Similarly,
hypothesis 3 predicted a positive relationship between the Loss Aversion Questionnaire and the
State-Trait Anxiety Inventory, measuring anxiety, which was confirmed and significant (r = .290, p <
.01). A negative relationship was predicted in Hypothesis 4 between impulsivity, as measured by the
Barratt Impulsiveness Scale, and loss aversion, as measured by the Loss Aversion Questionnaire.
However, the relation was not significant (r = .087, p = .09). Means, standard deviations, and
correlations of the scales are given in Table 5.
Insert Table 5 about here

17
DISCUSSION
The present study aimed to contribute to the loss aversion literature by focusing on
individual differences, which is a consistent gap in behavioral research (Li & Liu, 2008; Mohammed &
Schwall, 2009; Stanovich & West, 1998).
It was argued that loss aversion is subject to individual differences and can be seen as a
personality trait. The question remained concerning how to measure effectively those differences.
We argued that the current measurement methods have limitations and that loss aversion can be
measured more effectively by using a psychometric questionnaire. Loss aversion as a personality trait
is supported by a wide array of research results, ranging from laboratory experiments (e.g. Gächter
et al., 2007) to neuroscientific research (e.g. Tom et al., 2007). So far, measurements of loss aversion
are usually conducted in laboratories in the format of mathematical choice dilemmas. It was argued
that the predictive validity of expected utility-based assessments of loss aversion is questionable,
because such assessments typically limit choice and restrict behavior, thereby giving personality
traits little time to manifest (Mohammed & Schwall, 2009). Issues with external validity, limited
individual variety, and applicability for innumerate people were discussed. To measure loss aversion
in a more valid way, a psychometric questionnaire was proposed—namely, the Loss Aversion
Questionnaire (LAQ).
The internal consistency of the scales was acceptable, with Cronbach’s ranging from .68 to
.82. An exception to the case was the DOSPERT scale with a Cronbach’s of .56. The full version of
the DOSPERT scale has been validated and normally shows acceptable internal consistency and
construct reliability, ranging from .70 to .84 (Weber et al., 2002). Although the reason for our low
Cronbach’s remains unclear, a low reliability for the DOSPERT scale has been found before (Brown,
2011).
We predicted and found a significant positive relationship between loss aversion and risk
aversion, and between loss aversion and anxiety. Although we predicted a negative relationship
between impulsivity and loss aversion, the results show a significant positive relationship. The reason
for this remains unclear.
The finding that people differ significantly in their degree of displayed loss aversion according
to educational level, employment level, and age was unexpected. Higher education seems to reduce
the amount of displayed loss aversion, which was also noticed by Gächter et al. (2007). They refer to
the findings from neuroscience (Tom et al., 2007), primate research (Chen, Lakshminarayanan, &
Santos, 2006), and young children (Harbaugh, Krause, & Vesterlund, 2001), which suggest that loss
aversion is deeply rooted, and requires learning and experience to overcome. Following the same
18
reasoning, age should also reduce displayed loss aversion. This was confirmed by our study, with
people below the median age scoring significantly higher on loss aversion than people above.
Limitations and Future Research
Because of the rather low reliability score on the DOSPERT scale, the hypothesis concerning
risk aversion could not be tested. The correlation between impulsivity and loss aversion was not
significant; the reason remains unclear.
Our study aimed at a large target audience, instead of focusing on well-educated young
people, as is the case with laboratory experiments. Although we reached a broad audience with
regard to age (range 19–68 yr.), the educational level of respondents remained quite high with 45.5%
holding a high school qualification and 49.3% a university or postgraduate degree. Further research
should seek to include people with lower educational attainment.
Likewise, future research should test the Loss Aversion Questionnaire with a longitudinal
design, which would test for the stability of loss aversion as a personality trait.
This paper has contributed to the loss aversion literature by shedding light on the
psychological side of the phenomenon and highlighting the importance of individual differences in
loss aversion. The LAQ promises to be a useful and valid questionnaire for measuring loss aversion on
a large scale without the need to resort to mathematical choice dilemmas or other forced-choice
laboratory tasks.
19
REFERENCES
Allport, G. W. (1968). The historical background of modern psychology. In G. Lindzey & E. Aronson
(Eds.), The handbook of social psychology (Vol. 1): Reading, Mass.: Addison-Wesley.
Arrow, K. J. (2004). In D. Colander, R. P. F. Holt & J. B. Rosser (Eds.), The Changing Face of Economics.
Conversations with Cutting Edge Economists. Ann Arbor: The University of Michigan Press.
Barratt, E. S. (1959). Anxiety and impulsiveness related to psychomotor efficiency. Perceptual and
Motor Skills, 9, 191 - 198.
Bieling, P. J., Antony, M. M., & Swinson, R. P. (1998). The State-Trait Anxiety Inventory, Trait version:
Structure and context re-examined. Behavior Research and Therapy, 36, 777 - 788.
Billiet, J. B., & McClendon, M. J. (2000). Modeling acquiescence in measurement models for two
balanced sets of items. Structural Equation Modeling, 7, 608 - 628.
Brown, A. B. (2011). The relationship of expected value-based risky decision making tasks to attitudes
toward various kinds of risks Retrieved September 13, 2011, from http://etd.ohiolink.edu/send-
pdf.cgi/Brown%20Andrew%20B.pdf?ucin1304448647
Camerer, C. (2005). Three cheers - psychological, theoretical, empirical – for loss aversion. Journal of
Marketing Research, 42(2), 129 - 133.
Camerer, C., Babcock, L., Loewenstein, G., & Thaler, R. (2000). Labor supply of New York City cab
drivers: one day at a time. The Quarterly Journal of Economics, 112(2), 407 - 441.
Chen, M. K., Lakshminarayanan, V., & Santos, L. R. (2006). How basic are behavioral biases? Evidence
from Capuchin monkey trading behavior. Journal of Political Economy, 114(3), 517 - 537.
Cohen, J., & Cohen, P. (1983). Applied multiple regression/correlation analysis for the behavioral
sciences (2 ed.): Hillsdale, NJ: Erlbaum.
demartino, B., Camerer, C., & Adolphs, R. (2010). Amygdala damage eliminates monetary loss
aversion. Proceedings of the National Academy of Sciences of the United States of America, 107(8),
3788 - 3792.
Eckel, C. C., & Grossman, P. J. (2003). Forecasting risk attitudes: An experimental study of actual and
forecast risk attitudes of women and men. Department of Economics, Virginia Tech.

20
Eibach, R., & Keegan, T. (2006). Free at last? Social dominance, loss aversion, and white and black
Americans’ differing assessments of racial progress. Journal of Personality and Social Psychology,
90(3), 453 - 467.
Gächter, S., Johnson, E. J., & Herrmann, A. (2007). Individual-level loss aversion in riskless and risky
choices. CeDEx Discussion Paper. University of Nottingham.
Haigh, M. S., & List, J. A. (2005). Do professional traders exhibit myopic loss aversion? An
experimental analysis. The Journal of Finance, 60(1), 523 - 534.
Harbaugh, W. T., Krause, K., & Vesterlund, L. (2001). Are adults better behaved than children? Age,
experience, and the endowment effect. Economic Letters, 70(2), 175 - 181.
Haynes, S. N., Richard, D. C. S., & Kubany, E. S. (1995). Content validity in psychological assessment: a
functional approach to concepts and methods. Psychological Assessment, 7(238 - 247).
Heath, C., Larrick, R. P., & Wu, W. (1999). Goals as reference points. Cognitive psychology, 38, 79 -
109.
Hochman, G., & Yechiam, E. (in press). Loss aversion in the eye and in the heart: The autonomic
nervous system’s response to losses. Journal of Behavioral Decision Making.
Holmes, R. M., Bromiley, P., Devers, C. E., Holcomb, T. R., & McGuire, J. B. (2011). Management
theory applications of prospect theory: Accomplishments, challenges, and opportunities. Journal of
Management, 37(4), 1069 - 1107.
Hommes, C. (2006). Heterogeneous agent models in economics and finance. In K. L. J. In L. Tesfatsion
(Ed.), Handbook of computational economics, agent-based computational economics (pp. 1109 –
1186): Amsterdam: Elsevier.
Hu, L., & Bentler, P. M. (1999). Cutoff criteria in fix indexes in covariance structure analysis:
conventional criteria versus new alternatives. Structural Equation Modeling, 6, 1 - 55.
Kahneman, D., Knetsch, J. L., & Thaler, R. H. (1990). Experimental tests of the endowment effect and
the Coase Theorem. The Journal of Political Economy, 98(6), 1325 - 1348.
Kahneman, D., & Tversky, A. (1979). Prospect Theory: an analysis of decision under risk.
Econometrica, 47(2), 263 - 291.

21
Kobberling, V., & Wakker, P. P. (2005). An index of loss aversion. Journal of Economic Theory, 122(1),
119 - 131.
Kowert, P. A., & Hermann, M. G. (1997). Who takes risks? Daring and caution in foreign policy
making. Journal of Conflict Resolution, 41(5), 611 - 637.
Kusev, P., Schaik, P. v., Ayton, P., Dent, J., & Chater, N. (2009). Exaggerated risk: Prospect theory and
probability weighting in risky choice. Journal of Experimental Psychology, 35(6), 1487 - 1505.
Lange, A., & Ratan, A. (2010). Multi-dimensional reference-dependent preferences in sealed-bid
auctions – How (most) laboratory experiments differ from the field. Games and Economic Behavior,
68, 634 - 645.
Li, S., & Liu, C.-J. (2008). Individual differences in a switch from risk-averse preferences for gains to
risk-seeking preferences for losses: can personality variables predict the risk preferences? . Journal of
Risk Research, 11(5), 673 - 686.
Loewenstein, G. (2001). Risk as feelings. Psychological Bulletin, 127(2), 267 - 286.
McCrae, R. R., & Costa, P. T. (1997). Personality trait structure as a human universal. American
Psychologist, 52(5), 509 - 516.
Mohammed, S., & Schwall, A. (2009). Individual differences and decision making: What we know and
where we go from here. In G. P. H. J. K. Ford (Ed.), International Review of Industrial and
Organizational Psychology (Vol. 24, pp. 249 - 312): John Wiley & Sons.
Most, R. B., & Zeidner, M. (1995). Constructing personality and intelligence instruments: methods
and instruments. In D. H. S. M. Zeidner (Ed.), International handbook of personality and intelligence
(pp. 457 - 503). New York: Plenum Press.
Nicholson, N., Soane, E., Fenton-O’Creevy, M., & Willman, P. (2005). Domain specific risk taking and
personality. Journal of Risk Research, 8(2), 157 - 176.
Patton, J. H., Stanford, M. S., & Barratt, E. S. (1995). Factor structure of the Barratt Impulsiveness
Scale. Journal of Clinical Psychology, 51(6), 768 - 774.
Rabin, M. (1998). Psychology and Economics. Journal of Economic Literature, 36, 11 - 46.
22
Rick, S. (in press). Losses, gains, and brains: Neuroeconomics can help to answer open questions
about loss aversion. Journal of Consumer Psychology.
Sadler-Smith, E. (2009). A duplex model of cognitive style. In L. F. Zhang & R. J. Sternberg (Eds.),
Perspectives on the nature of intellectual styles (pp. 3 – 28): Heidelberg: Springer.
Schmidt, U., & Traub, S. (2002). An experimental test of loss aversion. The Journal of Risk and
Uncertainty, 25(3), 233 - 249.
Soane, E., & Chmiel, N. (2005). Are risk preferences consistent? The influence of decision domain and
personality. Personality and Individual Differences, 38, 1781 - 1791.
Sokol-Hessner, P., Hsu, M., Curley, N. G., Delgado, M. R., Camerer, C., & Phelps, E. A. (2009). Thinking
like a trader selectively reduces individuals’ loss aversion. Proceedings of the National Academy of
Sciences, 106(13), 5035 - 5040.
Spielberger, C. D. (1983). Manual for the State-Trait Anxiety Inventory STAI (form Y): Palo Alto, CA:
Mind Garden.
Stanovich, K. E., & West, R. F. (1998). Individual differences in rational thought. Journal of
Experimental Psychology, 127(2), 161 - 188.
Stumpf, S. A., Colarelli, S. M., & Hartman, K. (1983). Development of the career exploration survey
(CES). Journal of Vocational Behavior, 22, 191 - 226.
Tom, S. M., Fox, C. R., Trepel, C., & Poldrack, R. A. (2007). The neural basis of loss aversion in
decision-making under risk. Science, 315(5811), 515 - 518.
Tversky, A., & Kahneman, D. (1991). Loss aversion in riskless choice: A reference-dependent model.
Quarterly Journal of Economics, 106, 1039 - 1061.
Weber, E. U., Blais, A.-R., & Betz, N. E. (2002). A domain-specific risk-attitude scale: Measuring
perceptions and risk behaviors. Journal of Behavioral Decision Making, 15, 263 - 290.
Wheaton, B., Muthen, B. O., Alwin, D., & Summers, G. (1977). Assessing reliability and stability in
panel models. In D. R. Heise (Ed.), Sociological Methodology (pp. 84 - 136). San Fransisco: Jossey-
Bass.

23
TABLE 1
Means and Standard Deviations of Initial Pool of Items of study 1 (N = 65)
Item Mean SD
1. If I lose a sweater at home, I keep on searching until I find it. 3.40 1.44
2. I really don’t care if someone talks bad about me behind my back. (R) 3.55 1.15
3. I would feel very down if I got fired, even if I know I will find a similar job. 3.48 1.23
4. I would hate it if a colleague thought that I’m not as good in my job now as I was before.
3.74 0.96
5. In marriage, a woman should keep her own last name. 3.75 1.11
6. In a relationship, I would hate not having my separate group of friends. 3.45 1.07
7. Losing your house to a fire is bad, but I would manage. (R) 2.30 1.15
8. I think eventually I could cope with losing the ability to walk. (R) 3.68 1.23
9. I tend to keep old stuff around. 2.89 1.19
10. If my reputation in the company takes a blow, I wouldn’t want to come to work anymore.
2.75 1.21
11. If I can’t find the documents I’m looking for, I get real nervous. 3.58 1.05
12. Once I’ve acquired a position in the company, I wouldn’t want to take a step back.
3.69 1.07
13. I would feel very emotional if my car (bike) would be stolen. 2.97 1.40
14. I don’t care if my boss thinks less of me than I’m really worth. (R) 3.74 1.18
15. I don’t like throwing away stuff. 3.11 1.19
16. I wouldn’t care if I had to move to a smaller place. (R) 3.00 1.25
17. I’d rather quit than get fired. 4.02 1.09
18. I would never accept a job that has less pay than my previous/current one. 2.36 1.02
19. I wouldn’t like it if the company changed our way of working. 2.46 1.03
20. I don’t care what people would think if I was suddenly unemployed. (R) 3.11 1.32

24
TABLE 2
Means and Standard Deviations of Initial Pool of Items of study 2 (N = 122)
Item Mean SD
1. If I lose a sweater at home, I keep on searching until I find it. 3.43 1.13
2. I really don’t care if someone talks bad about me behind my back. (R) 3.82 0.98
3. I would feel very down if I got fired, even if I know I will find a similar job. 3.61 1.10
4. I would hate it if a colleague thought that I’m not as good in my job now as I was before.
3.71 0.90
5. In marriage, a woman should keep her own last name. 3.77 1.03
6. In a relationship, I would hate not having my separate group of friends. 3.06 0.99
7. Losing your house to a fire is bad, but I would manage. (R) 2.43 0.88
8. I think eventually I could cope with losing the ability to walk. (R) 3.33 1.16
9. I tend to keep old stuff around. 3.36 1.15
10. If my reputation in the company takes a blow, I wouldn’t want to come to work anymore.
2.48 0.83
11. If I can’t find the documents I’m looking for, I get real nervous. 3.37 0.90
12. Once I’ve acquired a position in the company, I wouldn’t want to take a step back.
3.47 1.07
13. I would feel very emotional if my car (bike) would be stolen. 3.18 1.14
14. It’s horrible if your boss thinks less of you than you’re really worth. 3.87 0.88
15. I don’t like throwing away stuff. 3.30 1.16
16. I would have problems with having to move to a smaller place. 2.98 1.04
17. I’d rather quit than get fired. 3.58 1.14
18. I would have no problem accepting a job that has less pay than my previous/current one. (R)
3.09 1.03
19. I would feel very tense if the company changed our way of working. 2.50 0.91
20. I don’t care what people would think if I was suddenly unemployed. (R 3.18 1.05
21. I always save my computer files on different locations. 3.40 1.32
22. I think I could cope losing all my belongings in a fire. (R) 3.17 1.08
23. I think I would go crazy, being locked up in prison. 3.67 1.16
24. I would be okay with trading my current car (bike) for a cheaper model. (R) 2.99 1.12
25. I get easily attached to material things (my car, my furniture, ..). 3.07 1.07

25
TABLE 3
Means and Standard Deviations of Items of study 3 (N = 479)
Item Mean SD
1. It’s horrible if your boss thinks less of you than you’re really worth. 3.94 0.86
2. I get easily attached to material things (my car, my furniture, ..). 2.97 1.10
3. I would have problems with having to move to a smaller place. 2.98 1.12
4. I tend to keep old stuff around. 2.88 1.07
5. I think eventually I could cope with losing the ability to walk. (R) 3.32 1.18
6. I go crazy if I lose something, even when it’s not that important. 2.65 1.11
7. Once I’ve acquired a position in the company, I wouldn’t want to take a step back.
3.52 1.04
8. I think I could cope losing all my belongings in a fire. (R) 3.23 1.15
9. I would feel very down if I got fired, even if I know I will find a similar job. 3.33 1.04
10. I don’t care what people would think if I was suddenly unemployed. (R) 3.13 1.07
11. I don’t like throwing away stuff. 2.95 1.11
12. I would feel very emotional if my car (bike) would be stolen. 3.11 1.15
13. I feel awful if someone talks bad about me behind my back. 3.60 1.01
14. I would hate it if a colleague thought that I’m not as good in my job now as I was before.
3.49 0.91
15. Losing your house to a fire is bad, but I would manage. (R) 2.49 0.98
16. I would feel very tense if the company changed our way of working. 2.50 0.88
17. I would have no problem accepting a job that has less pay than my previous/current one. (R)
3.26 1.02
18. I would be okay with trading my current car (bike) for a cheaper model. (R)
2.74 1.03
26
TABLE 4a – 4b – 4c – 4d
Principal axis analysis with Direct Oblimin rotation (STAI & LAQ)
4a. Communalities
Initial Extraction I worry too much over something that really doesn’t matter. .388 .450
I get in a state of tension or turmoil as I think over my recent concerns and interests. .195 .168
I have disturbing thoughts. .304 .301 I take disappointments so keenly that I can’t put them out of my mind. .355 .417
It’s horrible if your boss thinks less of you than you’re really worth. .270 .178
I get easily attached to material things (my car, my furniture, ..) .251 .249 I would have problems with having to move to a smaller place. .166 .138
I think eventually I could cope with losing the ability to walk. .291 .239
I feel awful if someone talks bad about me behind my back. .253 .200 I go crazy if I lose something, even when it’s not that important. .331 .322
I think I could cope losing all my belongings in a fire. .428 .270 Once I’ve acquired a position in the company, I wouldn’t want to take a step back. .265 .206
Losing your house to a fire is bad, but I would manage. .454 .333
I would hate it if a colleague thought that I’m not as good in my job now as I was before. .338 .221 I would feel very down if I got fired, even if I know I will find a similar job. .286 .251
I don’t care what people would think if I was suddenly unemployed. .303 .293
I would feel very tense if the company changed our way of working. .242 .238 I would have no problem accepting a job that has less pay than my previous/current one. .294 .299
I would be okay with trading my current car (bike) for a cheaper model. .341 .395
I would feel very emotional if my car (bike) would be stolen. .251 .214

27
4b Pattern Matrix
Factor 1 2
I worry too much over something that really doesn’t matter. .699 -.061 I get in a state of tension or turmoil as I think over my recent concerns and interests. .447 -.096
I have disturbing thoughts. .594 -.115
I take disappointments so keenly that I can’t put them out of my mind. .637 .017 It’s horrible if your boss thinks less of you than you’re really worth. .230 .261
I get easily attached to material things (my car, my furniture, ..) .066 .465
I would have problems with having to move to a smaller place. -.009 .375 I think eventually I could cope with losing the ability to walk. .029 .474
I feel awful if someone talks bad about me behind my back. .419 .052
I go crazy if I lose something, even when it’s not that important. .470 .164 I think I could cope losing all my belongings in a fire. .055 .491
Once I’ve acquired a position in the company, I wouldn’t want to take a step back. .027 .440 Losing your house to a fire is bad, but I would manage. .159 .483
I would hate it if a colleague thought that I’m not as good in my job now as I was before. .389 .136
I would feel very down if I got fired, even if I know I will find a similar job. .406 .157 I don’t care what people would think if I was suddenly unemployed. .333 .296
I would feel very tense if the company changed our way of working. .351 .209
I would have no problem accepting a job that has less pay than my previous/current one. -.096 .587 I would be okay with trading my current car (bike) for a cheaper model. -.120 .678
I would feel very emotional if my car (bike) would be stolen. .254 .284
Eigenvalue Percentage of total variance accounted for
5.005 25.025%
1.783 8.916%

28
4c. Structure Matrix
Factor
1 2
I worry too much over something that really doesn’t matter. .669 .275 I get in a state of tension or turmoil as I think over my recent concerns and interests. .401 .119
I have disturbing thoughts. .539 .171
I take disappointments so keenly that I can’t put them out of my mind. .646 .324 It’s horrible if your boss thinks less of you than you’re really worth. .355 .371
I get easily attached to material things (my car, my furniture, ..) .289 .496
I would have problems with having to move to a smaller place. .171 .371 I think eventually I could cope with losing the ability to walk. .257 .488
I feel awful if someone talks bad about me behind my back. .445 .254
I go crazy if I lose something, even when it’s not that important. .549 .390 I think I could cope losing all my belongings in a fire. .292 .518
Once I’ve acquired a position in the company, I wouldn’t want to take a step back. .239 .453 Losing your house to a fire is bad, but I would manage. .392 .560
I would hate it if a colleague thought that I’m not as good in my job now as I was before. .454 .323
I would feel very down if I got fired, even if I know I will find a similar job. .481 .352 I don’t care what people would think if I was suddenly unemployed. .476 .456
I would feel very tense if the company changed our way of working. .452 .378
I would have no problem accepting a job that has less pay than my previous/current one. .187 .541 I would be okay with trading my current car (bike) for a cheaper model. .206 .620
I would feel very emotional if my car (bike) would be stolen. .390 .406
4d. Factor Correlation Matrix Factor 1 2
1 1.000 .481
2 .481 1.000 Extraction Method: Principal Axis Factoring. Rotation Method: Oblimin with Kaiser Normalization.

29
TABLE 5
Means, Standard Devations and Intercorrelations (N = 479)
Scale Mean SD LAQ BIS STAI DOSPERT
LAQ 3.07 0.65 .82
BIS 2.65 0.74 .078 .80
STAI 2.70 0.72 .290** .237** .68
DOSPERT 2.75 0.44 .322** .001 .259** .56
** p < .01; Cronbach’s α in bold on diagonal