development of technologies for minimizing environmental ... · development of technologies for...
TRANSCRIPT
Development of Technologies for Minimizing Environmental Impacts
A. Ido*1, T. Kurita *2, Y. Wakabayashi *2, M. Hara*2, H. Shiraishi *2, M. Horiuchi*2
*1Aerodynamics, Environmental Engineering Division, Railway Technical Research Institute 2-8-38, Hikari -cho, Kokubunji-shi, Tokyo 185-8540 Japan
(Former affiliation: Advanced Railway System Development Center , JR East Group Research and Development Center, East Japan Railway Company )
*2Advanced Railway System Development Center , JR East Group Research and Dev elopment Center East Japan Railway Company , 2-0 Nisshincho, Kita -ku, Saitama-shi, Saitama 331-8513 Japan
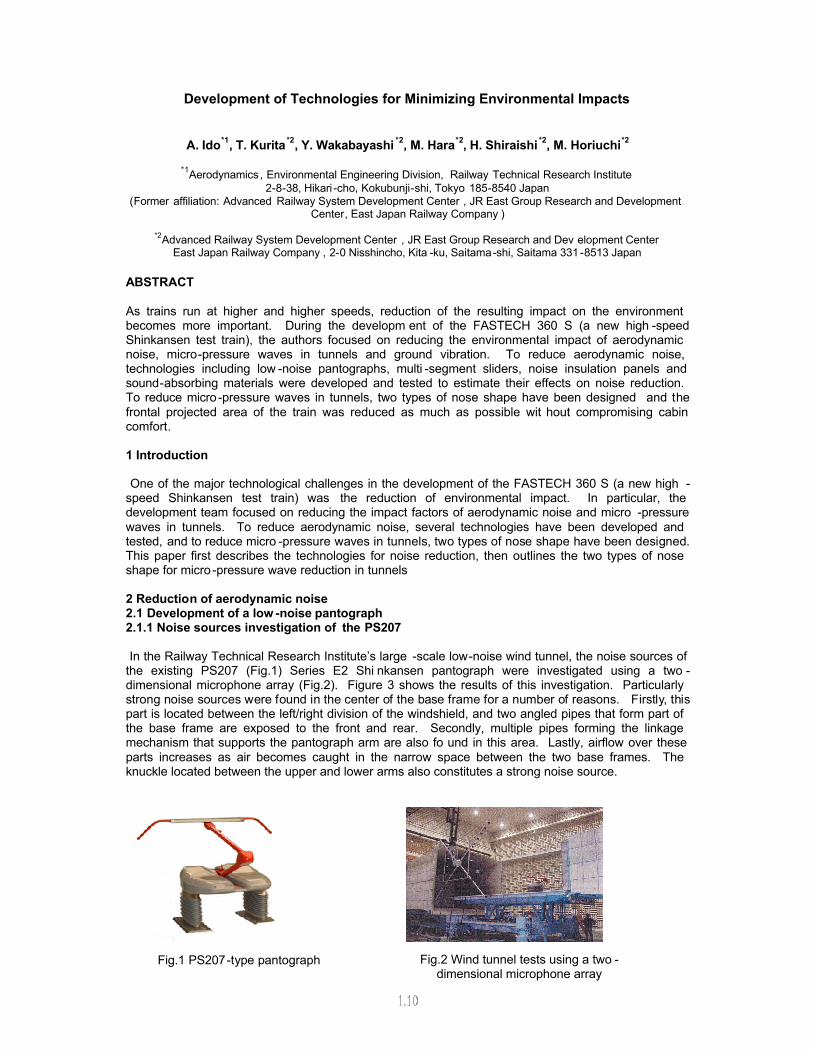
ABSTRACT As trains run at higher and higher speeds, reduction of the resulting impact on the environment becomes more important. During the developm ent of the FASTECH 360 S (a new high -speed Shinkansen test train), the authors focused on reducing the environmental impact of aerodynamic noise, micro-pressure waves in tunnels and ground vibration. To reduce aerodynamic noise, technologies including low -noise pantographs, multi -segment sliders, noise insulation panels and sound-absorbing materials were developed and tested to estimate their effects on noise reduction. To reduce micro-pressure waves in tunnels, two types of nose shape have been designed and the frontal projected area of the train was reduced as much as possible wit hout compromising cabin comfort. 1 Introduction One of the major technological challenges in the development of the FASTECH 360 S (a new high -speed Shinkansen test train) was the reduction of environmental impact. In particular, the development team focused on reducing the impact factors of aerodynamic noise and micro -pressure waves in tunnels. To reduce aerodynamic noise, several technologies have been developed and tested, and to reduce micro -pressure waves in tunnels, two types of nose shape have been designed. This paper first describes the technologies for noise reduction, then outlines the two types of nose shape for micro -pressure wave reduction in tunnels 2 Reduction of aerodynamic noise 2.1 Development of a low -noise pantograph 2.1.1 Noise sources investigation of the PS207 In the Railway Technical Research Institute’s large -scale low-noise wind tunnel, the noise sources of the existing PS207 (Fig.1) Series E2 Shi nkansen pantograph were investigated using a two -dimensional microphone array (Fig.2). Figure 3 shows the results of this investigation. Particularly strong noise sources were found in the center of the base frame for a number of reasons. Firstly, this part is located between the left/right division of the windshield, and two angled pipes that form part of the base frame are exposed to the front and rear. Secondly, multiple pipes forming the linkage mechanism that supports the pantograph arm are also fo und in this area. Lastly, airflow over these parts increases as air becomes caught in the narrow space between the two base frames. The knuckle located between the upper and lower arms also constitutes a strong noise source.
Fig.1 PS207-type pantograph Fig.2 Wind tunnel tests using a two -dimensional microphone array
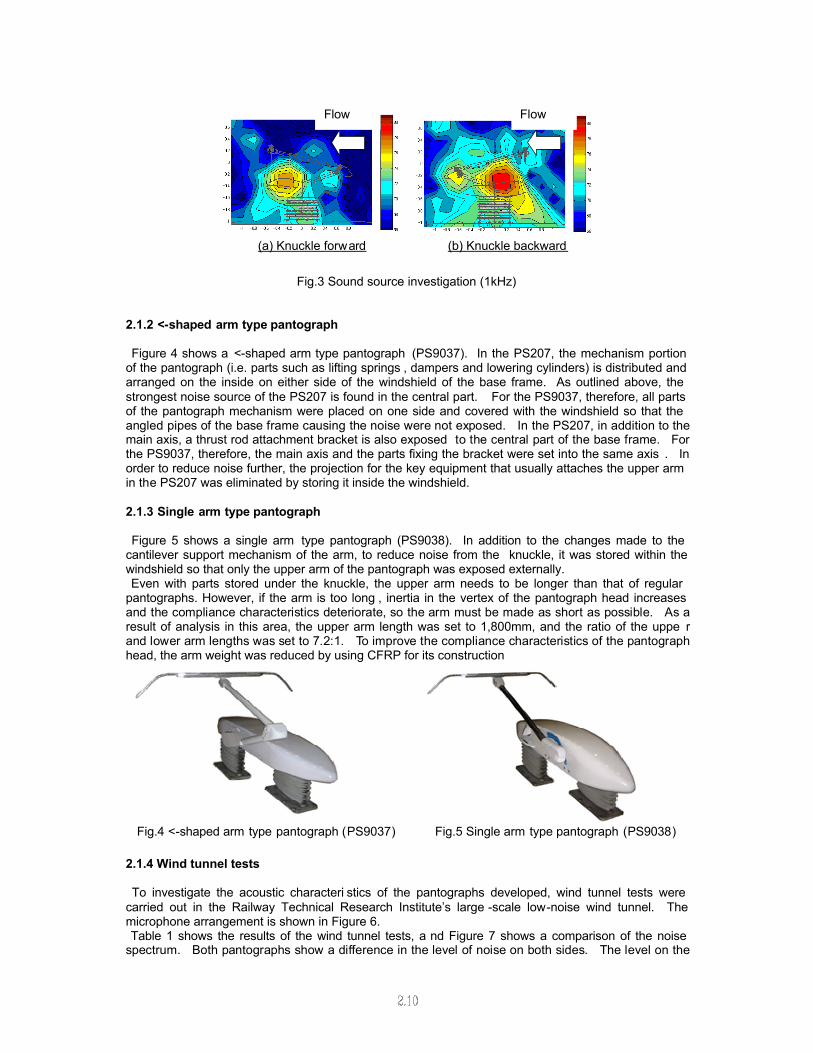
Fig.3 Sound source investigation (1kHz)
2.1.2 <-shaped arm type pantograph Figure 4 shows a <-shaped arm type pantograph (PS9037). In the PS207, the mechanism portion of the pantograph (i.e. parts such as lifting springs , dampers and lowering cylinders) is distributed and arranged on the inside on either side of the windshield of the base frame. As outlined above, the strongest noise source of the PS207 is found in the central part. For the PS9037, therefore, all parts of the pantograph mechanism were placed on one side and covered with the windshield so that the angled pipes of the base frame causing the noise were not exposed. In the PS207, in addition to the main axis, a thrust rod attachment bracket is also exposed to the central part of the base frame. For the PS9037, therefore, the main axis and the parts fixing the bracket were set into the same axis . In order to reduce noise further, the projection for the key equipment that usually attaches the upper arm in the PS207 was eliminated by storing it inside the windshield. 2.1.3 Single arm type pantograph Figure 5 shows a single arm type pantograph (PS9038). In addition to the changes made to the cantilever support mechanism of the arm, to reduce noise from the knuckle, it was stored within the windshield so that only the upper arm of the pantograph was exposed externally. Even with parts stored under the knuckle, the upper arm needs to be longer than that of regular pantographs. However, if the arm is too long , inertia in the vertex of the pantograph head increases and the compliance characteristics deteriorate, so the arm must be made as short as possible. As a result of analysis in this area, the upper arm length was set to 1,800mm, and the ratio of the uppe r and lower arm lengths was set to 7.2:1. To improve the compliance characteristics of the pantograph head, the arm weight was reduced by using CFRP for its construction
2.1.4 Wind tunnel tests To investigate the acoustic characteri stics of the pantographs developed, wind tunnel tests were carried out in the Railway Technical Research Institute’s large -scale low-noise wind tunnel. The microphone arrangement is shown in Figure 6. Table 1 shows the results of the wind tunnel tests, a nd Figure 7 shows a comparison of the noise spectrum. Both pantographs show a difference in the level of noise on both sides. The level on the
(a) Knuckle forward (b) Knuckle backward
Flow Flow
Fig.4 <-shaped arm type pantograph (PS9037) Fig.5 Single arm type pantograph (PS9038)

arm side with a direct line to the microphones is greater than that on the base frame side where the arm is hidden by the windshield of the base frame. This is due to the pantograph being asymmetrical because of the cantilever support of the arm. As a whole, noise from the single arm type pantograph is lower than that of the <-shaped arm type pantograph . Comparing the results from an NM6 microphone corresponding to an actual Shinkansen noise -measuring point, a noise reduction of 1.2dB over the PS207 was found for the <-shaped arm type pantograph , while a reduction value of 2.4dB was found for the single arm type pantograph.
Figure.6 Experimental equipment
Table.1 Noise measurement results (overall differences in level from the PS207) (Velocity: 100m/s)
Microphones (Unit:dB) Pantograph type
NM1 NM2 NM3 NM4 NM5 NM6 Knuckle forward -2.2 -3.0 -2.0 -2.6 -1.1 -1.2
PS9037 Knuckle backward -3.1 -2.5 -2.7 -1.8 -1.3 -1.2
Knuckle forward -1.7 -4.7 -2.3 -4.7 -1.4 -2.4 PS9038
Knuckle backward -4.4 -3.7 -3.4 -2.3 -2.1 -1.6
Figure.7 Results of wind tunnel tests (measurement microphone NM6)
2.2 Development of a multi-segment slider Reducing the contact loss ratio of pantographs enables a reduction in the number of pantographs per
Flow
5m
Pantograph head center
Insulator center
Base-frame side
Arm side
NM1
NM3
NM5
NM2
NM6
NM4
2.5m
1/3 octave band center frequency [Hz]
A-w
eigh
ted
soun
d pr
essu
re le
vel [
dB]

train, which results in lower noise generation. To impr ove this ratio, a multi -segment slider (i.e. a pantograph slider with multiple plates) has been developed. Figure 8 shows the slider unit of the PS207 located on a flat spring. The pin in both ends supports the slider, and neither end part is stroked, alt hough the central part is. A ±5mm spring stroke is also kept in the central part, but as the spring constant is large, it is thought that a small stroke is practical. Figure 9 shows the multi -segment slider. It is possible to maintain sufficient stroke and to lighten the equivalent mass by effectively improving the compliance characteristics to overhead contact lines. Details of the structures are shown in Figure 10. The slider, which was divided into four in the PS207, was this time divided into ten, and springs were arranged between sliders. The unit consists of a slider on glass-fiber-reinforced silicone rubber and a copper plate with a guide below it, joined with phosphor bronze bolts. Thanks to this composition, the sliders are combined more flexibly, and only the slider near the point in contact with the overhead lines moves. This has enabled a reduction in the mass of the mobile parts used and improvement of the compliance characteristics.
Fig.8 Structure of slider unit (PS207) Fig.9 Structure of multi -slider unit
- -
Fig.10 Detail of multi -slider structure 2.3 Development of a pantograph noise insulation panel A pantograph noise insulation panel has been developed to i nsulate the aerodynamic noise caused by pantographs. The panel’s length and cross -section have been designed to maximize its noise -insulation effect within the confined space resulting from the rolling stock gauge and electric insulation. The effectiveness of the panel has been validated through bench tests. 2.3.1 Optimum cross-sectional shape The rolling stock gauge and electric insulation limit the cross -sectional shape of the panel. With this limit in mind, the cross-sectional shape was designed with a strong diffraction effect, and sound insulation effects were studied using two -dimensional sound simulation. Figure 11 shows the cross -sectional shapes studied, Figure 12 shows the areas of analysis and e stimation points, and Figure 13 shows the simulation results. In all the cross -sectional shapes studied, the sound level in the frequency range of 500Hz and above decreases sharply compared with that in case [00] where there is no noise insulation panel. In the regular flat-plate type (case [01]), ins ulation performance near the 315Hz level was insufficient due to exiting standing waves. In cases [03] and [04] where noise insulation panels curve inside or outside, insulation performance improves because of the decreasing influence of standing waves am ong the noise insulation panels. To ensure high performance, it is important to prevent standing waves and
Spring Slider
Pin
Slider
Spring
Spring
Copper plate
Slider
Phosphor bronze bolts
Guide
Silicone rubber Guide
Stopper

move the diffraction point higher and more towards the outer side. Case [12] satisfies these conditions and displays a reduction effect of about 4d B. The noise insulation panels of the FASTEC 360 S have been designed based on this cross -sectional shape.
[00] [01] [03] [04] [12]
Fig.11 Cross-sectional shapes of a noise insulation panel
Fig.12 Analysis area
Fig.13 Frequency analysis of sound pressu re levels 2.3.2 Length of noise insulation panels To estimate the ideal noise insulation panel length, acoustic tests were performed using a 1/5 -scale model. Figure 14 shows the measurement points of the tests, and Figure 15 shows the results of the
GL
RL=GL+7.0m
Estimation point
25m
Analysis area
5m
1.2m
GL+12.0m
1/3 octave band center frequency [Hz]
A-w
eigh
ted
soun
d pr
essu
re le
vel [
dB]

sound levels measured. In P1, located at the front of the pantograph, the sound level of the 3m-long type is higher than that of other lengths. This is thought to be due to the influence of diffraction sound from the front and tail edges of the noise insulation panels, meaning that a length of 3m is insufficient. In the 3m-length type, the sound level is also higher than other lengths at point P4. This is because there is an area between P3 and P4 where the range of direct sound and sound reflected from the opposite noise insulation panel overlap (Figure 16). This is thought to have an influence on P4, and the sound level increases. In the 6m length, as the overlap range is between P6 and P7, a similar influence was found, although the increase in the s ound level was not as high. It was found that improvements in the panel’s noise insulation performance can be expected up to a length of 10m. To locate noise insulation panels within the same car in reality, the length will be twice the distance from the pantograph head center to the car edge. The noise insulation panel length decided on was 7m for the FASTEC 36 0 S.
0 12.5 25m 37.5 50m 62.5 75m 100m 150m
P1 P2 P3 P4 P5 P6 P7 P8 P9 P5' P6' P7' P8' P9'
Fig.14 Measurement points in acoustic tests
Fig.15 Sound pressure level in acoustic tests
Fig.16 Sound lines of 3m panels (plan view)
Measurement points
Car
No diffraction
P9'
P8'
P5'
P6'
P7'
P4 P2 P1 P3
Reflection of opposite side panel
A-w
eigh
ted
soun
d pr
essu
re le
vel [
dB]
No panels 3m panels 6m panels 9m panels 12m panels
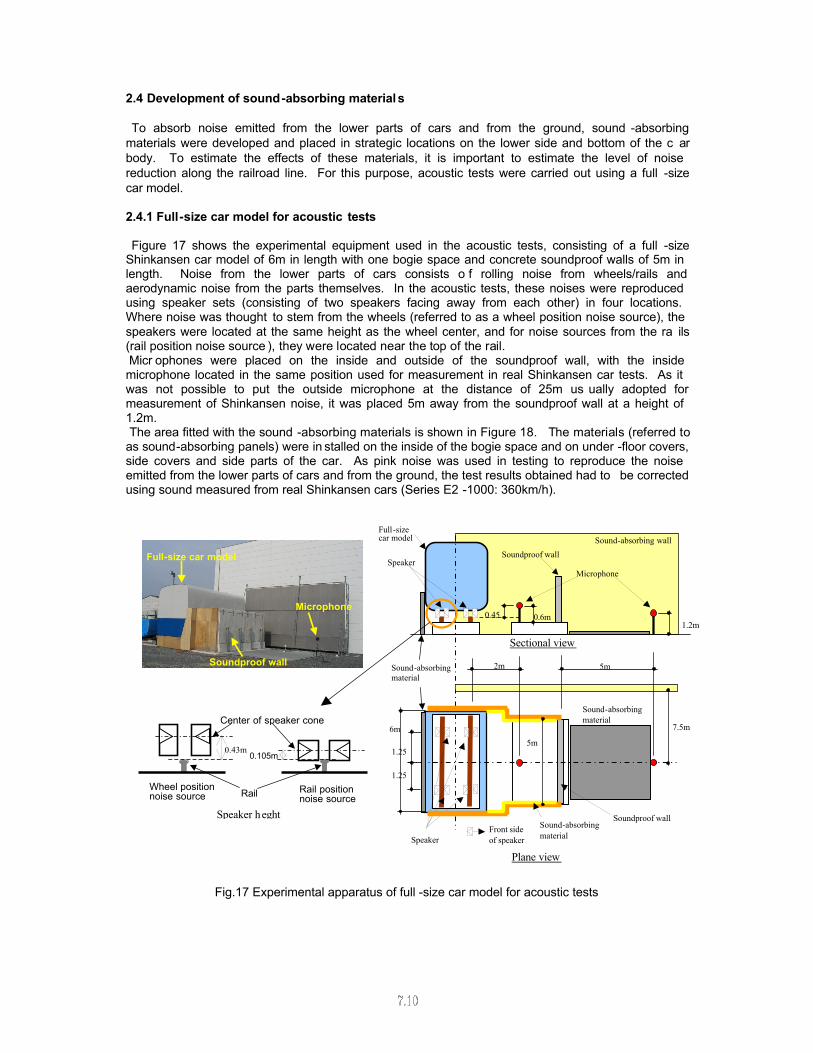
2.4 Development of sound-absorbing materials To absorb noise emitted from the lower parts of cars and from the ground, sound -absorbing materials were developed and placed in strategic locations on the lower side and bottom of the c ar body. To estimate the effects of these materials, it is important to estimate the level of noise reduction along the railroad line. For this purpose, acoustic tests were carried out using a full -size car model. 2.4.1 Full-size car model for acoustic tests Figure 17 shows the experimental equipment used in the acoustic tests, consisting of a full -size Shinkansen car model of 6m in length with one bogie space and concrete soundproof walls of 5m in length. Noise from the lower parts of cars consists o f rolling noise from wheels/rails and aerodynamic noise from the parts themselves. In the acoustic tests, these noises were reproduced using speaker sets (consisting of two speakers facing away from each other) in four locations. Where noise was thought to stem from the wheels (referred to as a wheel position noise source), the speakers were located at the same height as the wheel center, and for noise sources from the ra ils (rail position noise source ), they were located near the top of the rail. Micr ophones were placed on the inside and outside of the soundproof wall, with the inside microphone located in the same position used for measurement in real Shinkansen car tests. As it was not possible to put the outside microphone at the distance of 25m us ually adopted for measurement of Shinkansen noise, it was placed 5m away from the soundproof wall at a height of 1.2m. The area fitted with the sound -absorbing materials is shown in Figure 18. The materials (referred to as sound-absorbing panels) were in stalled on the inside of the bogie space and on under -floor covers, side covers and side parts of the car. As pink noise was used in testing to reproduce the noise emitted from the lower parts of cars and from the ground, the test results obtained had to be corrected using sound measured from real Shinkansen cars (Series E2 -1000: 360km/h).
Fig.17 Experimental apparatus of full -size car model for acoustic tests
Plane view
Microphone Speaker
Sound-absorbing wall
Sound-absorbing material
Speaker
2m 5m
1.2m
7.5m
1.25
m 1.25
m
6m 5m
0.45
m 0.6m
Sound-absorbing material
30mm 2
Sound-absorbing material
Front side of speaker
Sectional view
Soundproof wall
Soundproof wall
Full-size car model
0.43m
Speaker heght
0.105m
Rail position noise source
Wheel position noise source Rail
Center of speaker cone
Full-size car model
Soundproof wall
Microphone

Fig.18 Area installed sound -absorbing panels (Diagonal area sound-absorbing materials)
2.4.2 Sound-absorbing materials Estimation was carried out with three types of sound -absorbing material using the experimental equipment outlined above. Figure 19 shows these materials. Type 1: Aluminum fiber + resonance structure Type 2: Punching metal + porous material + honeycomb Type 3: Aluminum fiber + air layer The test results showed that Type 2 had the highest sound -absorbing performance, and thus the Type 2 materials were selected.
Fig.19 Sound-absorbing structure
Type1 Type2 Type3
Surface Aluminum fiber Punching metal
Porous material + honeycomb
Aluminum fiber
Resonance structure Air layer
Side parts of the car
Side cover (Outside)
Side cover (Inside)
Side cover (Inside)
Top cover of bogie space
Front and back cover of bogie space
Front and back cover of bogie space
Under-floor cover Under-floor cover
Exploded view
Sectional view
Side view (Outside)
Side view (Inside)
Side parts of the car
Under-floor cover
Front and back cover of bogie space
Top cover of bogie space
Side cover (Outside)
Side cover (Inside)
Under-floor cover Front and back coverof bogie space

2.4.3 Sound-absorbing area To study the relationship between the sound -absorbing area and the sound reduction effects, the sound-absorbing area was changed and the sound level measured. Figure 20 shows the results of the outside sound levels. For both the rail position noise source and the wheel position noise source, the sound reduction effects improve with increases in the sound -absorbing area. It was found that the sound level was effectively reduced up to a sound -absorbing area ratio of about 50%.
(a) Rail position noise source (b) Wheel position noise source
Fig.20 Relationship between the sound -absorbing area and the sound reducing effects (Outside microphone)
2.4.4 Sound reduction effects in the FASTEC 360 S The sound-absorbing panels were improved (Fig. 21) to give sufficient strength for installation on the FASTEC 360 S. In the tests, the installation area was simulated as shown in Figure 18 to represent the limited sound-absorbing panel installation area of the FASTEC 360 S. Figure 22 shows the results of the outside sound levels. Sound levels were reduced in the frequency range of 315Hz and above, and a strong reduction was seen between 500Hz and 4000Hz in particular. The overal l sound level was reduced by 2.8 dB ( rail position noise source ) and 3.2dB ( wheel position noise source).
Fig.21 Sound-absorbing panel structure of FASTEC 360 S
(a) Rail position noise source (b) Wheel position noise source Fig.22 Acoustic test results of sound -absorbing panel for FASTEC 360 S
Porous material honey comb
Punching metal
Punching metal
Honeycomb Surface
Sound-absorbing area ratio (%) Ove
all s
ound
leve
l [dB
(A)]
Sound-absorbing area ratio (%) Ove
all s
ound
leve
l [dB
(A)]
1/3 octave band center frequency [Hz] A-w
eigh
ted
soun
d pr
essu
re le
vel [
dB]
1/3 octave band center frequency [Hz] A-w
eigh
ted
soun
d pr
essu
re le
vel [
dB]
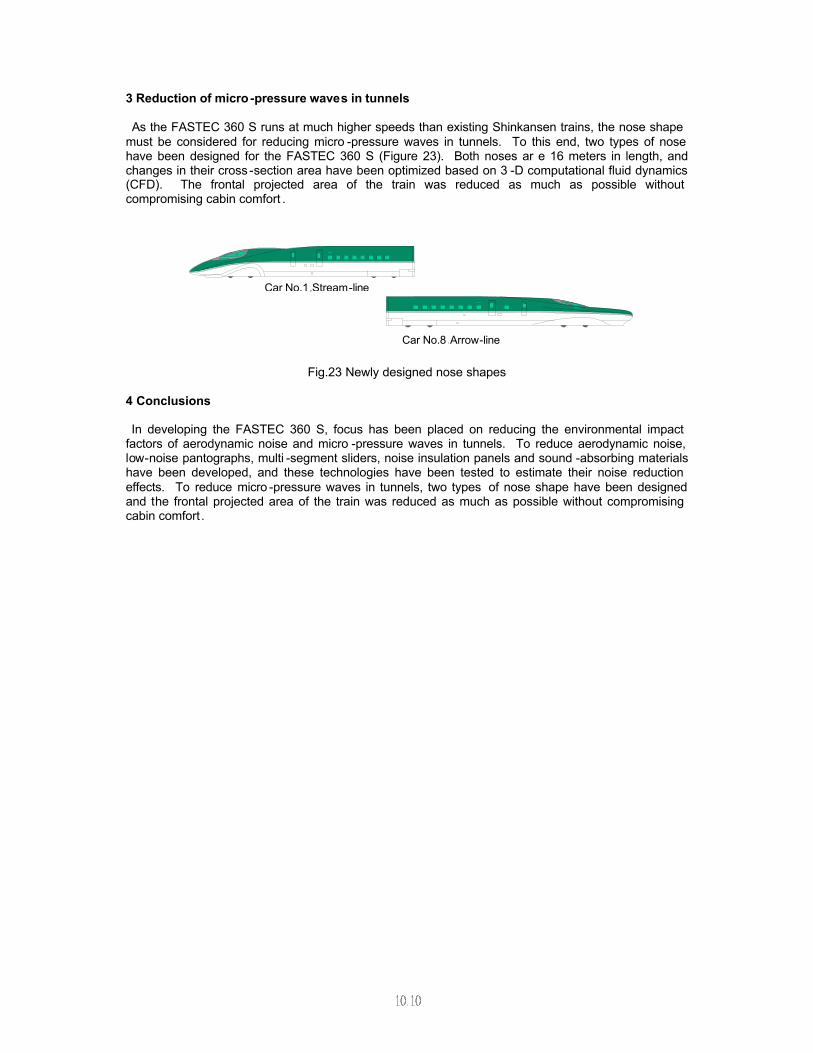
3 Reduction of micro -pressure waves in tunnels As the FASTEC 360 S runs at much higher speeds than existing Shinkansen trains, the nose shape must be considered for reducing micro -pressure waves in tunnels. To this end, two types of nose have been designed for the FASTEC 360 S (Figure 23). Both noses ar e 16 meters in length, and changes in their cross -section area have been optimized based on 3 -D computational fluid dynamics (CFD). The frontal projected area of the train was reduced as much as possible without compromising cabin comfort .
Fig.23 Newly designed nose shapes
4 Conclusions In developing the FASTEC 360 S, focus has been placed on reducing the environmental impact factors of aerodynamic noise and micro -pressure waves in tunnels. To reduce aerodynamic noise, low-noise pantographs, multi -segment sliders, noise insulation panels and sound -absorbing materials have been developed, and these technologies have been tested to estimate their noise reduction effects. To reduce micro -pressure waves in tunnels, two types of nose shape have been designed and the frontal projected area of the train was reduced as much as possible without compromising cabin comfort .
Car No.1 Stream-line
Car No.8 Arrow-line