development of scaling criteria for...
TRANSCRIPT

DEVELOPMENT OF SCALING CRITERIA FOR
WATERFLOODING AND IMMISCIBLE CO2 FLOODING
IN UNCONVENTIONAL RESERVOIRS
A Thesis
Submitted to the Faculty of Graduate Studies and Research
In Partial Fulfillment of the Requirements
For the Degree of
Master of Applied Science
In
Petroleum Systems Engineering
University of Regina
By
Deyue Zhou
Regina, Saskatchewan
February, 2015
Copyright 2015: Deyue Zhou

UNIVERSITY OF REGINA
FACULTY OF GRADUATE STUDIES AND RESEARCH
SUPERVISORY AND EXAMINING COMMITTEE
Deyue Zhou, candidate for the degree of Master of Applied Science in Petroleum Systems Engineering, has presented a thesis titled, Development of Scaling Crieteria for Waterflooding and Immiscible CO2 Flooding in Unconventional Reservoirs, in an oral examination held on January 22, 2015. The following committee members have found the thesis acceptable in form and content, and that the candidate demonstrated satisfactory knowledge of the subject material. External Examiner: Dr. Amornvadee Veawab, Envirnomental Systems
Engineering
Supervisor: Dr. Daoyong Yang, Petroleum Systems Engineering
Committee Member: Dr. Gang Zhao, Petroleum Systems Engineering
Committee Member: Dr. Peng Luo, Petroleum Systems Engineering
Chair of Defense: Dr. Nader Mobed, Department of Physics

i
ABSTRACT
As conventional oil reserves are depleting, the rising energy demand as well as
advancements in well drilling and stimulation technologies have attracted increasingly
interests in exploiting the unconventional oil resources (e.g., tight oil and heavy oil).
Tight oil resources in Canada are mainly located in Cardium and Viking pools in Alberta,
Bakken formation in Saskatchewan, and Western Canada Shale plays, respectively. Also,
tremendous heavy oil resources accounting for almost half of the total world heavy oil
reserves are mainly found in Western Canada, though they are contained in thin and
depleted reservoirs. Such unconventional oil resources either have been deposited in
extremely unfavourable environments or possess high carbon intensity, requiring more
efforts and energy to recover than conventional oils. In practice, three-dimensional (3D)
displacement models show unique advantages for designing appropriate well
configurations, though their physical constraints make it impossible to duplicate the real
reservoirs under certain conditions. Therefore, it is of fundamental and practical
importance to develop scaling criteria for describing fluid flow behaviour in
unconventional reservoirs.
Scaling criteria have been developed and validated to evaluate the performance of
both waterflooding and immiscible CO2 flooding in tight formations. Experimentally,
saturation pressures of the CO2-light oil systems are determined with a versatile PVT
system and then used to tune the binary interaction parameter (BIP) correlations between
CO2 and the lumped pseudo-components. Subsequently, waterflooding and immiscible
CO2 flooding have been respectively conducted with light oil in the 3D physical model.
Theoretically, mathematical formulae have been derived to reveal fluid flow of

ii
immiscible displacements in tight oil reservoir by performing dimensional and
inspectional analyses. Since not all of the scaling groups can be satisfied, relaxation of
the scaling groups will be made to neglect capillary pressure force. Scaling criteria have
been validated by history matching the experimental measurements, and then extended
for field applications. Geometric factor is demonstrated to be negligible while
gravitational and viscous forces have been considered for scaling up waterflooding and
immiscible CO2 flooding. Since capillary pressure and relative permeability have a
negligible effect on general movement of the displacing fluid, sacrificing these two
parameters has been proved permissible.
Scaling criteria have then been modified and validated to evaluate performance of
waterflooding and immiscible CO2 flooding in heavy oil reservoirs by using the 3D
sandpacked displacement model. Experimentally, waterflooding and immiscible CO2
flooding of heavy oil have been conducted with 3D sandpacked models. Theoretically,
scaling criteria have been relaxed by neglecting the ratio of gravitational force to viscous
force while other scaling groups including geometric factor, diffusion groups, and ratio
of capillary forces to viscous forces can be satisfied. The relaxed scaling criteria are
validated by comparing the simulation results of synthetic reservoirs with experimental
measurements, and then extended for field applications. There exists a reasonably good
agreement between the laboratory measurements and the simulation results of the
synthetic models. This is consistent with the findings from literature that, as for thin
heavy oil reservoirs (i.e., ratio of well spacing to thickness and mobility ratio larger than
50) gravity effect is negligible.
iii
ACKNOWLEDGEMENTS
I sincerely wish to acknowledge my academic supervisor, Dr. Daoyong (Tony) Yang,
for his excellent guidance, continuous encouragement, and strong support throughout the
course of my MASc studies at the University of Regina.
I also wish to acknowledge the following individuals and organizations for their
support and encouragement during my MASc study at the University of Regina.
My past and present research group members: Dr. Huazhou Li, Dr. Yin Zhang,
Dr. Huijuan Sun, Ms. Xiaoli Li, Mr. Sixu Zheng, Mr. Feng Zhang, Mr. Chengyao
Song, Ms. Min Yang, Ms. Ping Yang, Ms. Xiaoyan Meng, Dr. Zhaoqi Fan, and
Mr. Zan Chen, for their great technical discussions and assistance;
Natural Sciences and Engineering Research Council of Canada (NSERC) for the
Discovery Grant and the Collaborative Research and Development (CRD) Grant
to Dr. Yang, respectively;
Petroleum Technology Research Centre (PTRC) for the innovation research fund
to Dr. Yang; and
Many friends who have extended their encouragement and friendship to me
during my stay in Regina.

iv
DEDICATION
To my beloved parents, Mrs. Guilan Gong and Mr. Yiyin Zhou, my brother, Dexiang
Zhou for their continuous support and unconditional love.

v
TABLE OF CONTENTS
ABSTRACT ..................................................................................................................... i
ACKNOWLEDGEMENTS .............................................................................................. iii
DEDICATION .................................................................................................................. iv
TABLE OF CONTENTS ................................................................................................... v
LIST OF TABLES ............................................................................................................ ix
LIST OF FIGURES ........................................................................................................... x
NOMENCLATURE ........................................................................................................ xiii
CHAPTER 1 INTRODUCTION ....................................................................................... 1
1.1 Unconventional Oil Resources and CO2 EOR Techniques ..................................... 1
1.2 Importance of Scaling Criteria ................................................................................. 3
1.3 Objectives of This Thesis Study .............................................................................. 4
1.4 Outline of The Thesis ............................................................................................... 4
CHAPTER 2 LITERATURE REVIEW ............................................................................ 6
2.1 Unconventional Oil Resources ................................................................................. 6
2.2 Waterflooding .......................................................................................................... 7
2.3 CO2 EOR .................................................................................................................. 8
2.3.1 Oil swelling effect ............................................................................................. 9
2.3.2 Viscosity reduction ......................................................................................... 10

vi
2.3.3 IFT reduction................................................................................................... 11
2.3.4 Light-components extraction .......................................................................... 12
2.4 Scaled Model Studies ............................................................................................. 12
2.4.1 Dimensional analysis ...................................................................................... 15
2.4.2 Inspectional analysis ....................................................................................... 16
2.4.3 Relaxation of scaling criteria .......................................................................... 17
2.5 Summary ................................................................................................................ 20
CHAPTER 3 DEVELOPMENT OF SCALING CRITERIA FOR FLUID FLOW IN
TIGHT FORMATIONS ........................................................................... 21
3.1 Mathematical Formulations ................................................................................... 22
3.1.1 Dimensional analysis ...................................................................................... 22
3.1.2 Inspectional analysis ....................................................................................... 23
3.2 Relaxation of the Scaling Criteria .......................................................................... 29
3.2.1 Geometric factor ............................................................................................. 29
3.2.2 Gravitational force to viscous force ratio ........................................................ 30
3.2.3 Capillary pressure and relative permeability .................................................. 31
3.2.4 Diffusion and dispersion ................................................................................. 32
3.3 Experimental .......................................................................................................... 35
3.3.1 Materials.......................................................................................................... 35
3.3.2 Experimental setup .......................................................................................... 35

vii
3.3.3 Experimental preparation ............................................................................... 45
3.3.4 Experimental procedures................................................................................. 47
3.4 Numerical Simulation ............................................................................................ 50
3.4.1 History matching ............................................................................................. 51
3.4.2 Validation of scaling criteria ........................................................................... 51
3.4.3 Field application .............................................................................................. 53
3.5 Results and Discussion ........................................................................................... 56
3.5.1 Saturation pressure .......................................................................................... 56
3.5.2 Experimental displacements ........................................................................... 60
3.5.3 Validation of scaling criteria ........................................................................... 65
3.5.4 Field application .............................................................................................. 69
3.6 Summary ................................................................................................................ 73
CHAPTER 4 DEVELOPMENT OF SCALING CRITERIA FOR IMMISCIBLE
DISPLACEMENTS IN HEAVY OIL RESERVOIRS ............................ 74
4.1 Relaxation of the Scaling Criteria .......................................................................... 74
4.1.1 Geometric factor ............................................................................................. 75
4.1.2 Gravitational force to viscous force ratio ........................................................ 75
4.1.3 Diffusion and dispersion ................................................................................. 75
4.1.4 Capillary force to viscous force ratio .............................................................. 77
4.2 Experimental .......................................................................................................... 78

viii
4.2.1 Materials.......................................................................................................... 78
4.2.2 Experimental setup .......................................................................................... 78
4.2.3 Experimental preparation ................................................................................ 82
4.2.4 Experimental procedures................................................................................. 83
4.3 Numerical Simulation ............................................................................................ 85
4.3.1 Fluid properties ............................................................................................... 85
4.3.2 Validation of scaling criteria ........................................................................... 86
4.3.3 Case studies ..................................................................................................... 90
4.4 Results and Discussion ......................................................................................... 103
4.4.1 Experimental measurements ......................................................................... 103
4.4.2 Validation of scaling criteria ......................................................................... 107
4.4.3 Case studies ................................................................................................... 109
4.5 Summary .............................................................................................................. 111
CHAPTER 5 CONCLUSIONS AND RECOMMEDATIONS ..................................... 113
5.1 Conclusions .......................................................................................................... 113
5.2 Recommendations ................................................................................................ 115
REFERENCES ............................................................................................................... 116
APPENDIX: DERIVATION OF THE DIMENSIONLESS CONTINUITY
EQUATIONS ......................................................................................... 127

ix
LIST OF TABLES
Table 3-1 A complete set of scaling groups derived by dimensional and inspectional
analyses ........................................................................................................... 28
Table 3-2 Physical properties of light oil sample ............................................................ 36
Table 3-3 Compositional analysis of the light oil sample ............................................... 37
Table 3-4 Properties of reservoir brine ............................................................................ 38
Table 3-5 Typical screen analysis of #710 silica sand .................................................... 39
Table 3-6 Typical screen analysis of #13 glassbeads ...................................................... 40
Table 3-7 Properties of the scaled theoretical reservoir and physical model for
waterflooding and CO2 flooding..................................................................... 52
Table 3-8 Properties of the field model and sandpacked model for waterflooding ........ 55
Table 3-9 Lumped pseudo-components and the BIPs with CO2 ..................................... 58
Table 4-1 Compositional analysis of the Lloydminster heavy oil ................................... 79
Table 4-2 Composition of synthetic brine ....................................................................... 80
Table 4-3 Measured viscosity of the Lloydminster heavy oil sample at different
temperatures.................................................................................................... 84
Table 4-4 Comparison of properties of sandpacked model and synthetic reservoir model
........................................................................................................................ 87
Table 4-5 Properties of Aberfeldy oil and brine (Rojas, 1985) ....................................... 91
Table 4-6 Summary of Northminster Sparky pool (AccuMap, 2014) ............................ 98
Table 4-7 Properties of 3D sandpacked model (Rojas, 1985) and Northminster Sparky
pool ............................................................................................................... 104

x
LIST OF FIGURES
Figure 3-1 Flow regime characterizations for (a) Aqueous system, and (b) Gaseous
system (Perkins and Johnston, 1963) ............................................................ 34
Figure 3-2 Schematic of the PVT setup .......................................................................... 41
Figure 3-3 3D experimental setup: (a) Schematic diagram; and (b) Digital image ........ 43
Figure 3-4 A 3D view of synthetic reservoir model for CO2 flooding ........................... 54
Figure 3-5 A 3D view of real reservoir model ................................................................ 57
Figure 3-6 P-V relations measured by the continuous depressurization method for (a)
Feed #1 (60.11 mol% light oil, 39.89 mol% CO2); (b) Feed #2 (67.67 mol%
light oil, 32.33 mol% CO2); and (c) Feed #3 (74.52 mol% light oil, 25.48 mol%
CO2) at 292.65 K ........................................................................................... 59
Figure 3-7 Measured oil recovery and water-cut versus water injection volume for
waterflooding ................................................................................................ 61
Figure 3-8 Measured oil recovery versus CO2 injection volume for CO2 flooding ........ 62
Figure 3-9 Measured oil recovery and pressure drop versus CO2 injection volume for
CO2-WAG flooding ...................................................................................... 64
Figure 3-10 Water-oil relative permeability and capillary pressure curves for
waterflooding .............................................................................................. 66
Figure 3-11 Comparison of the measured and simulated oil production and water-cut for
waterflooding .............................................................................................. 67
Figure 3-12 Relative permeability and capillary pressure curves for (a) Water-oil system;
and (b) Gas-liquid system during CO2 flooding ......................................... 68

xi
Figure 3-13 Comparison of the measured and simulated oil recovery and pressure drop
for CO2 flooding .......................................................................................... 70
Figure 3-14 Relative permeability curves and capillary pressure curves for the real
reservoir model: (a) Oil-water systems; (b) Liquid-gas systems (Song, 2013)
..................................................................................................................... 71
Figure 3-15 Comparison of the measured and simulated oil production and water-cut for
waterflooding .............................................................................................. 72
Figure 4-1 Schematic diagram of the 3D displacement experimental setup ................... 81
Figure 4-2 3D view of the synthetic reservoir model ..................................................... 89
Figure 4-3 Waterflooding of heavy oil conducted by Rojas (1985) ............................... 92
Figure 4-4 3D view of the sandpacked model (Rojas, 1985) .......................................... 94
Figure 4-5 Relative permeability and capillary pressure curves for Rojas’s waterflooding:
(a) Water-oil system; (b) Liquid-gas system ................................................ 95
Figure 4-6 Comparison of simulation results and experimental measurements for Rojas’s
waterflooding (1985) ..................................................................................... 96
Figure 4-7 Northminster Sparky pool (AccuMap, 2014) ................................................ 99
Figure 4-8 A 3D view of the numerical simulation model of Northminster Sparky pool
..................................................................................................................... 100
Figure 4-9 Relative permeability curves and capillary pressure curves of field reservoir
model: (a) Oil-water system; (b) Liquid-gas system .................................. 101
Figure 4-10 History matching results for the Northminster Sparky reservoir production
................................................................................................................... 102

xii
Figure 4-11 Experimental measurements of the waterflooding and immiscible CO2
flooding of heavy oil: Oil recovery and flow rate .................................... 105
Figure 4-12 Experimental measurements of the waterflooding and immiscible CO2
flooding of heavy oil: Water-cut and injector bottom-hole pressure ........ 106
Figure 4-13 Relative permeability and capillary pressure curves: (a) Water-oil system;
(b) Liquid-gas system for experimental displacement of heavy oil by water
and CO2 ..................................................................................................... 108
Figure 4-14 History matching results of synthetic reservoir case: (a) Oil recovery and
water cut; (b) Injector bottom-hole pressure ............................................ 110
Figure 4-15 Comparison of experimental measurements and simulation results of the
field reservoir ............................................................................................ 112

xiii
NOMENCLATURE
Notations
B Formation volume factor, m3/sm3
pc Pressure coefficient defined in Eq. 3-16
Tc Temperature coefficient defined in Eq. 3-16
Cgo CO2 concentration in oil phase, sm3/m3
D Diffusion coefficient, m2/s
f Normalized velocities
F Coefficients defined in Eqs. 3-6a to 3-6c
g Gravitational acceleration constant, m/s2
H Reservoir or model height, m
( )SJ Leverett J-functions of saturations
k Specific permeability, mD
kr Relative permeability
K Dispersion coefficient, m2/s
K Diagonal tensor of dispersion coefficient
L Reservoir or model length, m
M Formation morphology factor

xiv
n Coefficient defined in Eq. 3-17
p Pressure, kPa
cP Capillary pressure, kPa
*cP Characteristic transverse capillary pressure, Pa
S Saturation
t Time, s
tn Normalized time
T Temperature, ºC
Tc Critical temperature, ºC
u Darcy’s velocity, m/s
v Superficial velocity, m/s
W Reservoir or model width, m
x Relevant variables in a given problem
Greek letters
Reservoir dip angle, º
ε Measurement error
Contact angle, º
Viscosity, Pa∙s

xv
Density, kg/m3
Interfacial tension, mN/m
Porosity, dimensionless
Subscripts
av Average vertical
g Gas phase
go Gas-oil system
gox Gas dispersion in oil in x direction
goy Gas dispersion in oil in y direction
goz Gas dispersion in oil in z direction
M Model
o Oil phase
ow Oil-water system
R Prototype
s Solvent
t Total
w Water phase

xvi
SI Metric Conversion Factors
cP × 1.0 E+03 = Pa∙s (°F−32)/1.8 E+00 = C (K−273.15) E+00 = °C
mD × 1.0132 E+03 = µm2 psi × 1.4503 E−01 = kPa

1
CHAPTER 1 INTRODUCTION
1.1 Unconventional Oil Resources and CO2 EOR Techniques
As conventional oil reserves are depleting, the rising energy demand as well as
advancements in well drilling and stimulation technologies combined with recently high
oil prices have attracted increasingly interests in exploiting the unconventional oil
resources (e.g., tight oil and heavy oil) and developing them to the maximum potential.
Unconventional light oil has been classified into three categories, i.e., halo oil, tight oil,
and shale oil, which are mainly discovered from low-permeability areas of the Cardium
and Viking pools in Alberta, Bakken formation in Saskatchewan, and Western Canada
shale oil plays, respectively (Clarkson and Pedersen, 2011). Meanwhile, the Canadian
heavy oil reserves, which are mainly located in Western Canada, i.e., Saskatchewan and
Alberta, account for almost half of the total world heavy oil reserves.
As for unconventional light oil recovery, it is a challenging task to recover oil from a
tight formation due to its inherent low permeability and low injectivity, leading to a low
recovery with the conventional waterflooding processes. Higher injectivity is expected to
be achieved by injecting low-viscosity injectants such as gas (Jarrell et al., 2002; Song,
2013). CO2 has been used as an enhanced oil recovery (EOR) agent for many years from
both laboratory studies and field tests (e.g., Beeson and Ortloff, 1959; Holm and O’Brien,
1971; Holm and Josendal, 1982; Ghaderi et al., 2012; Song and Yang, 2012; Liu et al.,
2014). According to a survey conducted in 2008, the number of CO2 flooding projects in
the USA has been increasing steadily from less than 10 to more than 100 since 1980s due

2
to the availability of affordable and sufficient CO2 from natural sources (Manrique et al.,
2010). However, limited efforts have been made to evaluate CO2 flooding performances
in tight formations.
Heavy oil resources in Western Canada account for a major part of energy resources
in Canada with the estimated average recovery of as low as 15% of the original oil-in-
place (OOIP) after primary depletion (Canada National Energy Board, 2005). In addition
to its high carbon intensity, such heavy oil requires more efforts and energy to recover
than conventional oils, resulting in adverse environmental consequences during
exploitation. The major challenge is to develop techniques for recovering these heavy oil
resources while minimizing greenhouse gas emissions (mainly CO2) and thus reducing
the carbon footprint. Physically, thermal methods, e.g., steam-assisted gravity drainage
(SAGD) and vapor extraction (VAPEX), have seen their limitations on heavy oil
recovery from the low pressure and thin formations, while CO2 has been adopted as an
efficient agent to increase oil recovery through its superiority in viscosity reduction and
oil swelling effect during an immiscible displacement process.
Extensive laboratory studies have been conducted to identify the flooding
mechanisms and performance of immiscible CO2 flooding processes. As for heavy oil,
the experimental displacements are commonly conducted with either core samples from
targeted formations or 3D sandpacked models. When it comes to tight oil, the laboratory
studies are usually limited to coreflooding experiments with real cores due to the fact
that the permeability of the sandpacked models cannot reach as low as that of tight
formations. However, one-dimensional (1D) coreflooding might have limitations on both
designing well configurations (Ammer et al., 1991) and up-scaling process compared

3
with 3D model displacements. In addition, 3D model has been considered to be
reasonably representative of the production performance of corresponding reservoirs if it
is properly scaled (Geertsma et al., 1956; Loomis and Crowell, 1964; Rojas et al., 1991).
1.2 Importance of Scaling Criteria
Scaling model studies on petroleum reservoirs can be traced back to 1950s when
Leverett et al. (1942) firstly proposed the basic theories for evaluating reservoir
performance with properly dimensional models. A limited number of “scaling ratios”
were then derived from the continuity equations of water and oil flow. By comparing the
experimental measurements, the scaled models are found to be superior to unscaled
models in describing the reservoir behaviour.
After developing the theories associated with dimensionally scaled models for cold-
water drive, hot-water drive, and solvent injection processes, Geertsma et al. (1956)
pointed out that it is necessary and practical to neglect some scaling groups (e.g.,
Reynolds group). However, the question of whether deletion of the Reynolds group and
possibly other groups is permissible has not been answered. Lozada and Farouq Ali
(1987) derived the scaling criteria for the immiscible CO2 flooding process for heavy oil
recovery by using both dimensional and inspectional analyses. A relaxation process has
then been made to the complete set of scaling groups by neglecting the ratio of capillary
forces to the viscous forces, though the relaxed scaling criteria have not been validated
experimentally as of yet.

4
1.3 Objectives of This Thesis Study
The purpose of this thesis study is to systematically develop the scaling techniques for
the experimental displacements of unconventional oil reservoirs associated with
waterflooding and immiscible CO2 flooding processes. The primary objectives of this
thesis study are listed as follows.
(1). To develop scaling groups for the processes of waterflooding and immiscible
CO2 flooding by using dimensional and inspectional analyses.
(2). To examine effects of the scaling groups on the scaling process with respect to
tight oil and heavy oil reservoirs.
(3). To conduct waterflooding and immiscible CO2 displacement experiments of light
oil and heavy oil by using a 3D sandpacked model.
(4). To validate the scaling criteria by history matching the experimental
displacements and simulation results of the synthetic reservoirs, and extend them
for field applications.
1.4 Outline of The Thesis
This thesis is composed of five chapters. Chapter 1 introduces the thesis research topic
together with the major research objectives and scope. Chapter 2 provides an updated
literature review on waterflooding and immiscible CO2 flooding processes for the tight
oil formations and heavy oil reservoirs as well as the corresponding studies on the scaled
models. Chapter 3 develops the scaling criteria for waterflooding and immiscible CO2
flooding processes by using both dimensional and inspectional analyses. A relaxation

5
process is made to the scaling groups with respect to oil displacement in tight formations.
This chapter also includes the validation of the relaxed scaling criteria by using
experimental measurements. Chapter 4 presents the development and validation of
scaling criteria for waterflooding and immiscible CO2 flooding processes for heavy oil
reservoirs, including the theoretical formulations and experimental measurements.
Chapter 5 summarizes the major scientific findings of this study and provides
recommendations for future research.

6
CHAPTER 2 LITERATURE REVIEW
2.1 Unconventional Oil Resources
Unconventional oil resources, e.g., tight oil and heavy oil, have been increasingly
recovered as conventional oil reserves are depleting and the energy consumptions are
escalating. In North America, unconventional oil resources including tight oil, heavy oil,
oil shale, and oil sands are estimated to be 3.5 trillion barrels, nearly two times larger
than the world’s recoverable conventional oils (Forrest et al., 2011). The majorities of
unconventional oil supplies are coming from the Canadian oil sands as well as tight oil.
Unconventional tight oils in North America are mainly discovered from low-
permeability areas of the Cardium play in Alberta, the Bakken play in Williston Basin,
the Eagle Ford play in Texas, and the Miocene Monterey play in California’s San
Joaquin Basin (Clarkson and Pedersen, 2011). The total estimated tight oil reserves,
mainly contributed by Bakken play, range from 5.6 to 10 billion barrels which include
3.65 to 4.3 billion barrels of recoverable resources (U.S. Geological Survey, 2008). The
recoverable oil resources could be more when new enhanced oil recovery (EOR)
techniques are applied to developing these deposits (Forrest et al., 2011). Early
exploitation of tight oil in Bakken Formation in 1950s via vertical wells was hindered by
the quick depleting production. After first implementation of horizontal wells in Bakken
play in 1980s, improvements in well drilling, completion, and stimulation technologies
combined with high oil prices have attracted increasing interest in Bakken play
exploitation since 2005 (Lolon et al., 2009; Canada National Energy Board, 2011).

7
In addition to unconventional tight oil, there are vast heavy oil and oil sands resources
in Canada which are mainly located in northeastern Alberta and western Saskatchewan.
These abundant resources are estimated to be more than 2.2 trillion barrels of oil in place
(Dusseault, 2002). OOIP of heavy oil resources in Canada is over 35 billion barrels while
only 8−12% of OOIP has been recovered by using primary depletion and cold
production methods (Forrest et al., 2011).
2.2 Waterflooding
Waterflooding has been considered as one of the cheapest and most profitable secondary
oil recovery (SOR) methods on conventional oil productions (Morsy et al., 2013). As for
unconventional tight oil recovery, waterflooding has been widely implemented by
Lightstream Resources, Crescent Point Energy, and Tundra Oil and Gas Partnership
(Canada) in the Bakken fields, South Saskatchewan (AccuMap, version 2014, IHS Inc..
However, it is a challenging task to recover oil from a tight formation due to its low
injectivity of waterflooding, leading to low recovery with the conventional waterflooding
processes.
Since 1990s, water has also been injected to recover conventional heavy oil resources.
The combined heavy oil production from Alberta and Saskatchewan reached its peak in
1997 due to the advancements of progressive cavity pump and horizontal drilling
technology (Dusseault, 2002). As for unconventional heavy oil exploitation, high oil
viscosity leads to unfavourable mobility ratio of water displacement, resulting in poor
sweep efficiency and low oil recovery factor. Usually, waterflooding is combined with
polymer flooding and gas flooding processes to improve the sweep efficiency and

8
mobility ratio, resulting in a better recovery factor in those unconventional heavy oil
reservoirs (e.g., presence of an aquifer in communication with the payzone and narrow
payzone thickness) where thermal recovery methods are inapplicable.
2.3 CO2 EOR
CO2 injection has been used as an EOR approach in tight oil productions, especially in
the USA, due to the availability of affordable and sufficient CO2 from natural sources
(Manrique et al., 2010). Most of the tight oil reservoirs in Saskatchewan, Canada, have
reached their economic limit of recovery by waterflooding (Srivastava et al., 1999) and
are considered to be good candidates for miscible/near miscible CO2 flooding (Huang
and Dyer, 1992). In a miscible and near miscible CO2 flooding process, dispersion is
considered to be a dominant phenomenon (Dullien, 1992) because of the rock
heterogeneity and viscous fingering, results in an immiscible displacement region (Zekri
et al., 2006).
Thermal recovery processes (e.g., SAGD) have been extensively adopted since oil
viscosity can be significantly reduced by steam injection. However, thermal methods
become inefficient when it comes to thin payzones and/or reservoirs with bottom
aquifers because large heat losses to the overburden and underburden formations may
occur (Butler, 2001; Zheng and Yang, 2013). In addition, there are many unresolved
issues (e.g., artificial lift) for low pressure SAGD operations for those heavy oil
formations with upper thief layers (Kisman, 2003). Also, water supply and treatment can
impose severe constraints for successful SAGD applications (Butler, 2001). Compared
with waterflooding and thermal methods, CO2 injection has been adopted as a more

9
efficient approach to enhance heavy oil recovery from these low pressure and thin
formations. As for heavy oil reservoirs exploited in Western Canada, although miscible
CO2 displacement cannot be achieved due to the low reservoir pressure (e.g., initial
reservoir pressure for Lloydminster heavy oil reservoir, Canada, is about 3,500 kPa
(Adams, 1982)). CO2 has been found, through worldwide applications in heavy oil
reservoirs, to be an efficient agent for recovering low pressure and thin heavy oil
reservoirs through an immiscible displacement process (Thomas and Harvey, 1981;
Mohammed-Singh and Singhal, 2005; Sahin et al., 2008).
During an immiscible CO2 flooding process, CO2 is injected into the formation,
mobilizing the contacted oil and displacing it towards the production wells. Major
mechanisms related in the immiscible flooding process include oil swelling effect,
viscosity reduction, Interfacial tension (IFT) reduction, and light-component extraction
(Schechter and Guo, 1996). To obtain a better utilization of CO2 and improve sweep
efficiency, in general, continuous CO2 flooding is alternated by water injection which is
usually named as a water-alternating-CO2 (CO2-WAG) process.
2.3.1 Oil swelling effect
When CO2 contacts with crude oil, it promotes oil expansion (i.e., the volume of CO2-
saturated crude oil is larger than that of crude oil alone). Oil swelling effect is an
important factor during CO2 EOR processes since it provides information on the extent
to which crude oil is driven out of pore by such an expansion (Mulliken and Sandler,
1980).

10
Comparing with the effect of viscosity reduction, oil swelling is recognized to be a
more important mechanism by which light oil is recovered in the immiscible CO2
flooding processes (Thomas and Monger-McClure, 1991). With low permeability matrix
in tight formations where gravity drainage is negligible, oil swelling and expulsion from
matrix to fractures are resulted from CO2 dissolution in light oil phase (Ravel and
Anterion, 1985). The magnitude of swelling factor for heavy oil is not as high as for light
oil, which can be expanded to more than twice its original volume. As for heavy oil,
swelling factor is increased linearly with CO2 solubility (Chung et al., 1988).
2.3.2 Viscosity reduction
Viscosity reduction is the major recovering mechanism for immiscible CO2 flooding of
heavy oil. The viscosity of the heavy oil can be significantly reduced as a result of
dissolution of CO2 in low-API-gravity oil. For example, at reservoir temperature of 63ºC,
the viscosity of Bati Raman oil with 12 ºAPI is reduced from 600 cP to 60 cP with the
pressure increasing from atmosphere pressure to the reservoir pressure of 2,000 psi
(Sahin et al., 2008).
The viscosity reduction of heavy oil with CO2 saturation depends on temperature,
pressure, and contact time. Jacobs et al. (1980) pointed out that CO2 has a dramatic
effect on bitumen viscosity at the temperature less than 100ºC. Contact time is also an
important factor to allow CO2-oil system to achieve an equilibrium state because of the
slow dissolution process of CO2 into the oil system. The heavy oil recovery rate with
which immiscible CO2 contacted and displaced is limited by the diffusion rate of CO2 in
oil phase (Hara and Christman, 1993). Both laboratory experiments and field

11
applications support that enough contact time is required to maximize ultimate oil
recovery in a CO2 huff-n-puff process (Monger and Coma, 1988).
2.3.3 IFT reduction
Large quantities of residual oil remain in the reservoir rocks after waterflooding due to
the fact that driving force is inadequate to expel oil trapped by capillary forces, resulting
from IFT between any two immiscible phases in porous media. Extensive studies show
that displacement efficiency under both oil-wet and water-wet conditions can be
significantly improved by sufficiently reducing IFT (Mungan, 1964; Wagner and Leach,
1966).
The effect of low IFT as one of the CO2 displacement mechanisms can be
experimentally determined. The residual oil saturation was reduced from 37.4% to 25.0%
of the total pore volume while the IFT was reduced from 24.8 to 0.105 dynes/cm by
replacing waterflooding with CO2 flooding (Rosman and Zana, 1977). In a CO2 flooding
process, IFT reduction is a function of CO2 dissolution in the oil phase. In general, the
equilibrium IFT is decreased as the pressure increases, whereas it is decreased with
temperature. This is ascribed to the fact that dissolution of CO2 in oil phase is increased
with pressure and decreased with temperature, respectively (Yang et al., 2005). As for
CO2 injection, IFT reduction is more profound in light oil than heavy oil.

12
2.3.4 Light-components extraction
Hydrocarbon vaporization and diffusion in the CO2 gas phase result in the well-known
condensate recovery (Ravel and Anterion, 1985). Theoretical studies on increasing
recovery in low permeability and naturally fractured reservoirs by CO2 injection
indicated the possibility of significant oil production by light-components extraction
(Schechter and Guo, 1996). This phenomenon was further manifested by laboratory
studies with the PVT cell system (Hand and val Pinczewski, 1990), semi-batch
extraction system (Siagian and Grigg, 1998), and pendant drop system (Yang et al.,
2005).
During CO2 injection processes, the light-component extraction is dependent on
pressure, temperature, and oil composition. Usually it is increased with an increase in
pressure, whereas it is strongly affected by extraction temperature reversely (Siagian and
Grigg, 1998). Lighter components (from propane to pentane) are more likely extracted
than the heavier ones. In addition, the mole ratio of the CO2 to oil also has an effect on
the extraction capacity. Hand and val Pinczewski (1990) pointed out that the actual
amount of extraction increases with increasing CO2 volume and decreasing oil volume.
2.4 Scaled Model Studies
It is very difficult to bridge between theoretical multiphase flow systems and field
applications for any given hydrocarbon reservoirs without introducing greatly
simplifying assumptions, resulting in questionable conclusions (Rapoport, 1954).
Laboratory investigations could compensate the deficiencies of analytical solutions,

13
though difficulties still remain that such measurements could be entirely misleading with
respect to field applications, unless certain relationships must be satisfied between
physical and geometric properties of the reservoir and laboratory systems (Nielsen and
Tek, 1963; Loomis and Crowell, 1964).
Laboratory coreflooding is one of the most common methods to investigate certain
EOR methods (e.g., solvent injection and polymer flooding) before they are implemented
in the oilfields. Used as a small replica of the real reservoir, the core has many
limitations on representing the properties of the reservoir (e.g., reservoir heterogeneity
and lithology). In addition, accuracy of the displacement experiments (e.g., gas
displacing oil) conducted within cores is often seriously affected by the capillary end
effect (Huang and Honarpour, 1996). Also, many experimental issues associated with
coreflooding tests including composite core-samples and high dead volume limit its
capacity (Saeedi, 2012).
As for a tight oil reservoir, laboratory displacing tests on CO2 flooding are limited to
one-dimensional (1D) coreflooding, though 3D model may have unique advantages to be
adopted to design well configurations (Ammer et al., 1991; Zheng and Yang, 2013). In
addition, 3D model has been considered to be reasonably representative of the
production behaviour of corresponding reservoirs if it is properly scaled (Geertsma et al.,
1956; Loomis and Crowell, 1964; Rojas et al., 1991). However, the permeability of a 3D
displacement model packed with sand cannot reach as low as that in a tight formation.
As such, it is essential that scaling criteria be developed to design proper physical
models that can represent a tight formation in a reasonable and scalable way.

14
As reservoir permeability of a heavy oil reservoir can be satisfied in 3D sandpacked
models, displacing experiments of heavy oil by water, solvents, and polymer are
conducted with sandpacked models to optimize the injection strategy and well
configurations (Rojas, 1985; Wu et al., 2011; Zheng and Yang, 2013). However, whether
the displacements performed with these 3D sandpacked models are capable of
representing the reservoir fluid behaviours has yet to be answered.
Scaled model studies on petroleum reservoirs can be traced back to 1950s when
Leverett et al. (1942) firstly published the basic theories for dimensional-model studies
to investigate immiscible displacement of oil by water. Concerns of the scaled model
technique have been focused on the fact that very coarse sand might limit the capacity of
the sandpacked model to represent the relative permeability-saturation relations.
Rapoport (1954) developed the scaling laws for an incompressible, immiscible, and
two-phase flow in a water-oil displacement process. Scaling groups have been derived
from inspectional analysis. Difficulties have been raised on reproducing identical relative
permeability and similar capillary pressure curves. Various model tests performed with
different materials might be capable of studying waterflooding processes for a wide
range of reservoir conditions. In turn, given a specific reservoir, its behaviour could be
evaluated by interpolating the characteristics of this reservoir into the ranges covered by
the scaled model studies.
Geertsma et al. (1956) extended the scaling theory to hot-water drive and solvent
injection by using dimensional and inspectional analyses. Uniform porosity and
permeability, and isotropic permeability have been assumed. Since not all the scaling
groups can be satisfied in building a model, comprehensive discussions on which scaling

15
groups are negligible have been conducted. However, experimental studies need to be
performed to verify the feasibility of neglecting some scaling groups. Van Daalen and
van Domslaar (1972) derived the scaling groups by applying inspectional analysis to
macroscopic displacement processes and pointed out that geometric factor (length to
thickness ratio) can usually be neglected if no cross flow occurs.
Rojas (1985) performed scaled model studies for immiscible CO2 flooding of heavy
oil. A complete set of scaling groups has been derived by using dimensional and
inspectional analyses, through selection of the scaling groups has yet to be made. In
general, scaling groups are derived by using dimensional and inspectional analyses.
2.4.1 Dimensional analysis
Dimensional analysis was firstly adopted in developing dimensionless groups for the
investigation of reservoir behaviour by Leverett et al. (1942). The first step in the
dimensional analysis is to ascertain all the relevant variables that affect the flow
behaviour. These variables can be arranged in a set of independent dimensionless groups
by using the Buckingham’s π-theorem (Buckingham, 1914). This theorem states that
dimensional variables that are relevant in a given problem can be grouped in a functional
relationship which is equal to zero, i.e.,
1 2 3 n( , , , , ) 0F x x x x [2-1]
where x1 to xn are n relevant variables in a given problem.
Proper usage of dimensional analysis requires that all the related variables are
included. According to the Buckingham’s π-theorem, the number of the independent

16
dimensionless groups is equal to the total number of the variables minus the number of
the basic dimensions (i.e., mass, length, time, and temperature).
2.4.2 Inspectional analysis
Inspectional analysis is based on the differential equations that govern the displacement.
As such, all equations that describe the process of interest are combined to form a single
differential equation of which the parameters form the dimensionless scaling groups
(Loomis and Crowell, 1964). The equations describing flow behaviour in porous media
are listed as follows (Geertsma et al., 1956):
(1). Conservation of basic quantities such as continuity equation, Darcy’s law, and
thermal balance equation;
(2). Properties of single components which are dependent on pressure and
temperature.
One advantage of the inspectional analysis is that the derived scaling groups have
physical meanings comparing with those from dimensional analysis. Inspectional
analysis was firstly adopted by Rapoport (1954) to derive a scaling relationship of
immiscible displacement of oil by cold water. This work was extended by Geertsma et al.
(1956) to hot waterflooding and miscible solvent injection processes, assuming that there
is no cross flow between layers which simplified the derivation process. By following
the procedure of inspectional analysis, Rojas et al. (1991) presented a set of scaling
groups for immiscible CO2 flooding of heavy oil. Mass transfer shall be taken into
account due to dissolution, diffusion, and dispersion of CO2 in oil and water phase.

17
2.4.3 Relaxation of scaling criteria
It is expected that all of the scaling groups from dimensional and inspectional analyses
should be satisfied to obtain similarity between a model and its prototype. In practice, it
is a challenging task to satisfy all scaling groups for designing a scaled model of a
hydrocarbon reservoir (Geertsma et al., 1956; Craig et al., 1957; Doscher and Gharib,
1983). It is necessary and practical to neglect some scaling groups (e.g., Reynolds’ group)
whenever possible. Many discussions have been made on which scaling group should be
met while neglecting other unimportant ones (e.g., Geertsma et al., 1956; Loomis and
Crowell, 1964).
(1) Geometric factor
To be capable of representing the flow behaviour of the prototype, a model must be
firstly geometrically similar, requiring the scaling groups of L/H (length/thickness) and
L/W (length/width) should be satisfied (Langhaar, 1951; Geertsma et al., 1956; Doscher
and Gharib, 1983). Van Daalen and van Domslaar (1972) stated that geometrical
similarity can be violated if no cross flow occurs in an immiscible displacement;
otherwise, the aspect ratio becomes important and needs to be met.
(2) Driven forces
All the forces that affect the flow behaviour in the prototype should be known and
scaling groups related to those forces should be satisfied, though this requirement has
been extensively recognized to be unlikely satisfied (e.g., Geertsma et al., 1956; Craig et

18
al., 1957; Doscher and Gharib, 1983). A properly scaled model cannot be built unless
those more important scaling groups are recognized and satisfied.
Gravity force and viscous force: Particularly in a post waterflooding process of
recovering the residual oil by solvent gas injection, residual oil is recovered after mobile
water is firstly displaced out (Dosher and Gharib, 1983). During this process, the applied
pressure and innate buoyancy gradients (i.e., viscous force and gravity force) play an
important role. Therefore, the scaling group of the ratio of gravity force to viscous force
should be equal between a model and its prototype. However, Pozzi and Blackwell (1963)
presented that the ratio of viscous force to gravity force need not be scaled if it falls in
the range of lower and upper limits determined experimentally. Otherwise, the ratio must
be identical between a model and its prototype.
Capillary pressure: Pujol and Boberg (1972) stated that, for highly viscous oil (viscosity
higher than 100,000 cP), capillary pressure levels can be left unscaled because the ratio
of capillary to viscous forces is so small that the unscaled capillary pressure imposes a
negligible effect on the measured oil recovery. Neglecting capillary force unscaled for
medium-viscous oil (viscosity less than 10,000 cP) might then lead to optimistic oil
recovery values. Perkins and Collins (1960) demonstrated that it is possible to design
unconsolidated models in which relative permeability and capillary pressure are different
functions of saturation from the consolidated prototype.
Doscher and Gharib (1983) suggested that capillary pressure presents a serious
problem in scaling of multiphase flow in porous media. This is because satisfying
capillary pressure requires sacrificing the scaling of other important viscous and gravity
forces. After quantifying the effect of capillary force on fluid flow in a simple

19
heterogeneous reservoir, Zhou et al. (1997) found that, for an immiscible displacement
process, fluid flow transfers from viscous-dominated to capillary-dominated in the
following range:
*w c av w
2o t o o
0.35 1 4.1LP kH u
[2-2]
where w and o are water and oil viscosity, respectively, Pa∙s; L and H are reservoir
length and thickness, respectively, m; *
cP is characteristic transverse capillary pressure,
N/m2; kav is average vertical permeability, m2; tu is total Darcy flow velocity, m/s. Since
it is difficult to determine the capillary pressure, the bound set by Eq. 2-2 for immiscible
displacement may have a relative large uncertainty.
(3) Relative permeability
The relative permeability curves are usually quite different between unconsolidated
sandpacks and consolidated reservoirs and violation of the necessary relationships could
lead to significant deviations between reservoir and model performance (Nielsen and
Tek, 1963). Bentsen (1976) suggested that mobility ratio is a more useful scaling group
than relative permeability because using mobility ratio would result in the same end-
points of the relative permeability functions between a model and its prototype,
weakening the scaling requirement of unique relative permeability curves.

20
(4) Rock wettability
Rock wettability is another requirement that the laboratory model should have the same
wettability as the consolidated reservoir. For the laboratory model packed with silica
sand, Demetre et al. (1982) found that the silica sand is preferentially water wet if it is
firstly contacted by water. If the sandpacked model is allowed to contact with reservoir
fluids for a reasonable long period, it is expected to have similar wettability to that of the
prototype (Rojas, 1985).
2.5 Summary
This chapter summarizes previous studies on unconventional resources together with
waterflooding and CO2 flooding to recover crude oil from both tight oil and heavy oil
reservoirs. Due to limitations of coreflooding, the performance of 3D models on CO2
EOR has been widely conducted through scaled models and its importance has been
demonstrated. However, a comprehensive scaling theory needs to be developed for
laboratory studies of waterflooding and immiscible CO2 flooding in tight and heavy oil
formations. Extensively attentions have been previously focused on scaled model studies
in order to reveal fluid flow behaviours in a real reservoir by using the properly scaled
models. The scaling groups derived from dimensional and inspectional analyses need to
be relaxed because of difficulties on satisfying them simultaneously. The reliability of
the scaled model according to the relaxed scaling criteria has been discussed in the
literature, though many uncertainties of scaled model studies still need to be
experimentally validated.

21
CHAPTER 3 DEVELOPMENT OF SCALING CRITERIA FOR
FLUID FLOW IN TIGHT FORMATIONS
In this chapter, techniques have been developed to evaluate performance of
waterflooding and CO2 flooding in tight formations by using a 3D sandpacked
displacement model. Experimentally, saturation pressures of the CO2-light oil systems
are determined with a versatile PVT system and then used to tune the binary interaction
parameter (BIP) correlations between CO2 and the lumped pseudo-components.
Waterflooding and immiscible CO2 flooding have been respectively conducted with light
oil in the 3D physical model. Three major parameters including oil production rate,
water-cut, and pressure drop are measured during the displacements. Theoretically,
scaling criteria have been developed for waterflooding and immiscible CO2 flooding by
performing dimensional and inspectional analyses and then used for building the
synthetic reservoir models with CMG GEM (version 2011.10, Computer Modelling
Group Ltd.). The scaling criteria are validated by history matching the experimental
measurements and simulation results of the synthetic reservoir, and then extended for
field applications.

22
3.1 Mathematical Formulations
3.1.1 Dimensional analysis
In the dimensional analysis approach, all parameters involved in the waterflooding and
immiscible CO2 flooding should be considered (Buckingham, 1914). The following
variables control the immiscible displacements of oil:
(1). Geometrical dimensions: L, W, and H are length, width, and thickness of the
formation, respectively; is the angle of dip, dimensionless (Loomis and
Crowell, 1964);
(2). Sand characteristics: k is the specific permeability; is porosity; and M is the
formation morphology factor (Rojas, 1985);
(3). Fluid properties: o , w , g are viscosities of oil, water, and gas, respectively;
owg and ogg are density differences between the displacing and displaced
fluids multiplied by the force of gravity; go and ow are interfacial tensions for
gas-oil and oil-water systems, respectively; usually, interfacial tension and the
contact angle of wetting, , are combined as cos (Loomis and Crowell,
1964);
(4). Variables to describe the mixing or microscopic dispersion: Kgox, Kgoy, and Kgoz
are dispersion coefficients of gas in oil in x, y, and z directions, respectively
(Rojas, 1985);
(5). Variables which depend upon the interactions between reservoir fluids and rocks:
krg, kro, and krw are relative permeability for gas, oil, and water phases,

23
respectively; gn( )SJ and wn( )SJ are Leverett J-functions of dimensionless gas
and water saturations, respectively (Geertsma et al., 1956);
(6). Other variables: v is total or superficial velocity; p is pressure difference;
according to Darcy’s law, v or p will be selected (Geertsma et al., 1956); t is
time; T is temperature.
According to the theory of dimensional analysis, all the independent variables
mentioned above could be grouped in a functional relationship equal to zero
(Buckingham, 1914):
rg ro rw g o w og wo go
ow gn wn gox goy goz
, , , , , , , , , , , , , , cos ,
cos , ( ), ( ), , , , or , , 0
f L W H k k k k g g
S S K K K v p t T
M
J J [3-1]
By applying the Buckingham’s -theorem, 17 scaling groups are derived: L
W, L
H,
wo
w
k g
v
, og
g
k g
v
, go
g
cosk
L v
, ow
w
cosk
L v
, goxK
Lv, goyK
Wv, gozK
Hv, , M , woM , goM ,
gn( )SJ , wn( )SJ , T, and 2
t pkL
. Detailed derivations can be found elsewhere (Loomis and
Crowell, 1964).
3.1.2 Inspectional analysis
As for inspectional analysis, all equations describing the behaviour of the process are
combined to form a single equation. The coefficients of these equations are then
combined to form the dimensionless scaling groups. In the immiscible displacements of
oil by water and CO2, the three phases are immiscible; however, CO2 may exist as free or

24
solution gas. During the displacement processes, the reservoir is assumed to be at
constant temperature, and the fluids are assumed to be in thermodynamic equilibrium
throughout the reservoir. The continuity equations for the two immiscible phases of oil
and water can be written as (Ertekin et al., 2001):
o o
o o
u S
B t B
[3-2a]
for oil, and
w w
w w
u S
B t B
[3-2b]
for water, where ou
and wu
are phase velocities of oil and water from Darcy’s law. Bo
and Bw are formation volume factors (FVF) of oil and water.
If taking into account mass transfer between CO2 and oil by molecular diffusion,
dispersion, and solution, the equation of continuity of CO2 is expressed as below (Rojas
et al., 1991; Ertekin et al., 2001):
gog go o go g go o
g o g g g
u C u K C S C S
B B B t B B
[3-2c]
where gu
is gas velocity from Darcy’s law; Bg is the FVF of gas; goK is the diagonal
tensor of dispersion coefficient of CO2 in oil phase; Cgo is CO2 concentration in oil phase.
The total saturation of the three phases is equal to one:
o w g 1S S S [3-3]

25
Generally, water is wetting phase, gas is nonwetting phase, and oil is an intermediate
wetting phase (Perkins and Johnston, 1963). Therefore, oil-water capillary pressure can
be written as:
cow o wP p p [3-4a]
and gas-oil capillary pressure is:
cgo g oP p p [3-4b]
In order to normalize Eqs. 3-2a to 3-2c, normalized fluid saturations (Stone, 1970;
Perkins and Collins, 1960), and time (Perkins and Collins, 1960), given by Eqs. 3-5a to
3-5d, will be adopted.
o oron
wi or1
S SS
S S
[3-5a]
w wiwn
wi or1
S SS
S S
[3-5b]
g gcgn
wi or1
S SS
S S
[3-5c]
tn
wi or(1 )
v tt
L S S
[3-5d]
Likewise, normalizing the total velocities along the three principal axes can be made
possible by dividing the total velocity: x x tf v v , y y tf v v , and z z tf v v .
To simplify the continuity equation, the derivatives of the reciprocal FVF (i.e., Bo, Bw,
and Bg) versus pressure are not expressed. Then, the continuity equations, i.e., Eqs 3-2a

26
to 3-2c, of oil, water, and gas could be rewritten as dimensionless forms (The detailed
derivation can be found in APPENDIX):
owwn wn wnx y z
wn o w t
2 2
rw wn rw wn rw wn
o wn o wn o wn
rg go rg
g t o
cos1
cos
kS L S L S df f f
x W y H z dS F v L
k d S L k d S L k d S
x F dS x W y F dS y H z F dS z
k k k d
v L x F d
J J J
J2
gn rg gn
gn o gn
2rg gn og rgrw wo rw
o gn t w o t g o
gox go goy
t o
1
S k SL d
S x W y F dS y
k S k g kL d k k g k
H z F dS z v z F v z F
K C KL
Lv x F x W W
J
J
go goz go on
t o t o n
1 1C K CL S
v y F y H Hv z F z t
[3-6a]
for oil phase;
owwn wn wnx y z
wn w w t
2rg rgw ro wn w ro wn
w o g wn w o g wn
2rgw ro
w o g
cos1 kS L S L S df f f
x W y H z dS F v L
k kk d S L k d S
x F dS x W y F dS y
kL k
H z F
J J
go rg gnwn
wn g t w gn
2 2rg gn rg gn
w gn w gn
rgwo w ro
t w w g o
cosk k Sd S d
dS z v L x F dS x
k S k SL d L d
W y F dS y H z F dS z
kk g k
v z F
J J
J J
og rg gox go
t g w t w
goy go goz go wn
t w t w n
1
1 1
k g k K C
v z F Lv x F x
K C K CL L S
W Wv y F y H Hv z F z t
[3-6b]
for water phase; and

27
wn wn wnx y z
wn g
2
ow rw wn rw wn
w t g wn g wn
2go grw wn
g wn g t
1
cos
cos
S L S L S df f f
x W y H z dS F
k k d S L k d S
v L x F dS x W y F dS y
kL k d S
H z F dS z v L x
J J
J gnro rw
g o w gn
2 2g gn g gnro rw ro rw
g o w gn g o w gn
og gow rw
t w g t g g
Sk k d
F dS x
S SL k k d L k k d
W y F dS y H z F dS z
k gk g k
v z F v z F
J
J J
ro rwgn go on
o w n
k kS C S
t
[3-6c]
for gas phase,
where
rg orw oo
ro w ro g
1kk
Fk k
; rg wro ww
rw o rw g
1kk
Fk k
; and ro g rw gg
rg o rg w
1k k
Fk k
.
From the normalized fractional flow equation, the following dimensionless groups
can be obtained: L
W,
L
H, woM , goM , wo
w t
k g
v
, og
g t
k g
v
, ow
t w
cosk
v L
, go
t g
cosk
v L
,
rok , rgk , rwk , gox
t
K
v L, goy
t
K
v W, goz
t
K
v H, wn
wn
( )d S
dS
J, gn
gn
( )d S
dS
J, and t
wi or(1 )
v t
L S S .
A complete set of scaling groups could be obtained by combining the scaling groups
from dimensional analysis and inspectional analysis, as shown in Table 3-1.

28
Table 3-1 A complete set of scaling groups derived by dimensional and inspectional
analyses
Scaling groups Name References
L W , L H Geometric factor Geertsma et al., 1956
woM , goM Mobility ratio of water-oil and gas-oil systems
Bentsen, 1976
wo t wk g v Gravitational to viscous forces of oil-water system
Geertsma et al., 1956
og t gk g v
Gravitational to viscous forces of gas-oil system
Geertsma et al., 1956
go g tcosk L v
Capillary to viscous forces of gas-oil system
Geertsma et al., 1956
ow w tcosk L v Capillary to viscous forces of water-oil system
Geertsma et al., 1956
gox t goy t goz t, ,K Lv K Wv K Hv
Dispersion groups of gas in oil phase
This study
Porosity Geertsma et al., 1956
M Morphology factor Rojas and Farouq Ali, 1986
rok , rgk , rwk Relative permeabilities Geertsma et al., 1956
gn( )SJ
Leverett J-function for gas-oil systems
Geertsma et al., 1956
wn( )SJ Leverett J-function for oil-water systems
Geertsma et al., 1956
wn wn( )d S dSJ Slope of Leverett J-function for gas-oil systems
Geertsma et al., 1956
gn gn( )d S dSJ Slope of Leverett J-function for oil-water systems
Geertsma et al., 1956
T System temperature This study 2t pk L
Ratio of pressure forces to viscous forces
Geertsma et al., 1956
t wi or(1 )v t L S S Dimensionless time Perkins and Collins, 1960

29
3.2 Relaxation of the Scaling Criteria
In general, models designed with the scaling criteria must be a replica in every necessary
way of a real reservoir; however, the main problem encountered is that all the scaling
criteria shall be satisfied simultaneously (Geertsma et al., 1956; Craig et al., 1957;
Perkins and Johnston, 1963). In practice, it is necessary to eliminate one or more of the
scaling groups if such groups are less important when comparing with those involved
ones. This process is usually called the relaxation of scaling criteria. The relaxation of
scaling criteria has been extensively discussed elsewhere (Geertsma et al., 1956; Bentsen,
1976; Doscher and Gharib, 1983). In this study, a similar procedure is followed for the
relaxation of scaling criteria, provided that the following assumptions have been made:
(1). The reservoir is assumed to be homogeneous and bounded by impermeable
layers.
(2). Molecular dispersion can be neglected when the fluid flow falls into a laminar
flow region by injecting the fluid at a moderate flow rate (Perkins and Johnston,
1963).
3.2.1 Geometric factor
To be capable of representing the behaviour of a large prototype (R), the model (M) must
first be geometrically similar (Langhaar, 1951):
R M
L H L H [3-7a]
R M
L W L W [3-7b]

30
where L is length; H is height; and W is width.
Craig et al. (1957) stated that geometric similarity is negligible in frontal driven
where mixing is unimportant since the displacements are dominated by viscous and
gravitational forces. Pozzi and Blackwell (1963) suggested that geometric factor (L/H)
be not required when mixing is important. In this study, geometric factor is included for
scaling up CO2 flooding processes, but excluded for waterflooding.
3.2.2 Gravitational force to viscous force ratio
The forces related to viscosity of the fluid and gravity control the displacement of oil.
The two forces can be termed as viscous force and gravitational force, respectively. The
ratio of gravitational force to viscous force which is defined as the gravity number
(Sharma and Rao, 2008) should be the same between the prototype and the model:
R M
k g k g
v v
[3-8]
In this study, the oil, water, and CO2 used in the experiments are the same as those in
the prototype. As such, Eq. 3-8 can be simplified to
M M
R R
v k
v k [3-9]
From Eq. 3-9, it can be seen that when the gravity and viscous forces are considered
as important ones, a perfectly scaled model of immiscible displacement requires fluid
velocity increased in the model over that of the prototype by the same ratio as the
permeability is increased in the model.

31
3.2.3 Capillary pressure and relative permeability
Since unconsolidated sands may have connate water and residual oil saturations are quite
different from the consolidated reservoirs, scaling criteria pertaining to relative
permeability and capillary pressure usually cannot be met (Loomis and Crowell, 1964).
It has been experimentally demonstrated that capillary force has a negligible effect upon
the gross movement of the displacing fluid (gas or water) and that flow behaviour in
terms of sweep efficiency is only dependent on mobility ratio in the unconsolidated
formations (Craig et al., 1957). Perkins and Collins (1960) demonstrated that it is
possible to design unconsolidated models in which relative permeability and capillary
pressure are different functions of saturation from the consolidated prototype. Doscher
and Gharib (1983) stated that an inability of the scaled capillary pressure does not detract
from the capability of the scaled model to reveal basic information about the
displacement mechanism.
In this study, if the capillary force was taken into account, the ratio of capillary
pressure to viscous force should be equal for a model and its prototype,
M R
cos cosk k
L v L v
[3-10]
As the fluids used in the model are the same as that of the prototype, the requirement
in Eq. 3-10 can be simplified to
M R
k k
Lv Lv
[3-11]

32
The flow rate could be calculated with Stalkup’s suggestion (1983) that the proper
width for average velocity is one-fifth of the distance between wells:
2
5q LHv [3-12]
Substituting Eqs. 3-9 and 3-11 into Eq. 3-12, the relations of the flow rate between a
model and its prototype could be expressed as
MM R
R
q q
[3-13]
As can be seen from Eq. 3-13, the injection rate will be the same magnitude as the
flow rate of the prototype which is too large to be practically performed for laboratory
measurements. Therefore, scaling criteria related to capillary forces has not been
satisfied in the up-scaling process.
3.2.4 Diffusion and dispersion
Diffusion occurs as two immiscible fluids are in contact and diffuse into one another
because of random motion of the molecules (Perkins and Johnston, 1963).
Simultaneously, dispersion occurs in the porous media when additional mixing is caused
by uneven fluids flow or concentration gradients. In a CO2 flooding process, diffusion
and dispersion may occur when CO2 is made in contact with oil so that the forces related
to diffusion and dispersion must be considered. The longitudinal and transverse
dispersion coefficients can be calculated with the Perkins and Johnston equation (Perkins
and Johnston, 1963). If the solvent is injected at a moderate flow rate, transverse

33
dispersion is characterized by a region in which transverse diffusion dominates (Perkins
and Johnston, 1963). In this study, water and CO2 injection rates are set to be 2.0
cm3/min and 200.0 Scm3/min, respectively. The calculated Reynolds numbers are
1.05×10⁻⁴, 2.90×10⁻⁴, and 3.56×10⁻³ for light oil, brine, and CO2, respectively, ensuring
that the flow falls into the diffusion-dominated region in this study, as shown in Figure
3-1. Thus the dispersion coefficient could be represented by the molecular diffusion
coefficient (D). The dispersion groups of the gas in oil phase are replaced with
gox t goy t goz t, ,D Lv D Wv D Hv . As diffusion coefficient is independent of direction, these
foregoing groups could be simplified into
t tM R
D D
v L v L
[3-14]
The diffusion coefficient is considered to be dependent on pressure, temperature and
the concentrations of the solvents involved (Grogan et al., 1988; Yang and Gu, 2008). In
this study, the diffusion coefficient is regarded as identical for the model and prototype
when the fluids, pressure, and temperature are the same. When Eq. 3-14 is combined
with Eq. 3-9, the requirements for scaling become
M M R
R R M
v k L
v k L [3-15]

34
(a)
(b)
Figure 3-1 Flow regime characterizations for (a) Aqueous system, and (b) Gaseous system (Perkins and Johnston, 1963)

35
3.3 Experimental
3.3.1 Materials
The light oil and reservoir brine used in this study are collected from the Viewfield area
of Bakken formation, Saskatchewan, Canada. As shown in Table 3-2, the density and
viscosity of the dead oil at 20ºC and atmospheric pressure are 801.2 kg/m3 and 2.17 cP,
respectively. Compositional analysis results of the dead oil are tabulated in Table 3-3.
As can be seen, the major components of the oil sample are lighter than C20+, which
account for 75.33 wt% of the oil sample. In this study, synthetic brine is prepared
according to the measured composition of reservoir brine as shown in Table 3-4.
In this study, research grade CO2 with a purity of 99.998 mol% is purchased from the
Praxair, Canada. To minimize the permeability of the sandpack model, the Ottawa sand
#710 (Bell & Mackenzie, Canada) and glassbeads #13 (Potters Industries LLC, USA) are
combined to pack the 3D physical model and their screen analyses are listed in Tables 3-
5 and 3-6, respectively.
3.3.2 Experimental setup
(1) PVT system
To measure saturation pressure for the CO2-light oil system, a mercury-free DBR PVT
system (PVT-0150-100-200-316-155, DBR, Canada) is used to perform the pressure-
volume-temperature (PVT) measurements. The schematic diagram of the DBR PVT
system (see Figure 3-2) is mainly comprised of a visual high-pressure PVT cell that has
an inner diameter and length of 3.177 and 20.320 cm, respectively. The PVT cell is

36
Table 3-2 Physical properties of light oil sample
Property Value
Density, kg/m3 at 15°C 805.0
at 20°C 801.2
at 30°C 793.1
Viscosity, cP at 15°C 2.54
at 20°C 2.17
at 30°C 2.22
Acid number, mg-KOH/g 0.4
Molecular weight, g/mol 162 Note: Measured by the Saskatchewan Research Council (SRC), Canada.

37
Table 3-3 Compositional analysis of the light oil sample
Components wt% mol% Components wt% mol% Components wt% mol%
C1 0.00 0.00 C8 11.96 16.16 C20 2.22 1.21
C2 0.48 2.46 C9 4.55 5.47 C21 2.42 1.26
C3 0.31 1.09 C10 5.60 6.07 C22 1.43 0.71
i-C4 0.00 0.00 C11 4.89 4.83 C23 1.79 0.85
n-C4 1.72 4.57 C12 4.59 4.16 C24 1.53 0.70
i-C5 1.08 2.31 C13 4.39 3.67 C25 1.46 0.64
n-C5 2.02 4.32 C14 3.77 2.93 C26 1.31 0.55
other C5 0.24 0.51 C15 3.91 2.84 C27 1.19 0.48
i-C6 1.74 3.12 C16 3.22 2.19 C28 1.11 0.43
n-C6 1.70 3.04 C17 3.01 1.93 C29 0.92 0.35
Other C6 1.91 3.42 C18 2.93 1.78 C30 0.79 0.29
C7 7.63 11.75 C19 2.48 1.43 C30+ 10.51 2.48
Total 100.00 100.00Note: Measured by the Saskatchewan Research Council (SRC), Canada.

38
Table 3-4 Properties of reservoir brine
Property Value Major components mg/l
Density, kg/m3 at 15ºC 1,110.2 Chloride 94,340
at 20ºC 1,108.7 Sulphate 4,100
at 40ºC 1,099.6 Sodium 56,200
Viscosity, cP at 15ºC 1.41 Potassium 1,500
at 20ºC 1.24 Magnesium 460
at 40ºC 0.85 Calcium 1,900
Refractive index at 25ºC 1.359 Iron 1
Conductivity, mS/m at 25ºC 125.4 Barium 0.25
pH at 25ºC 6.87 Manganese 0.61 Note: Measured by the Saskatchewan Research Council (SRC), Canada.

39
Table 3-5 Typical screen analysis of #710 silica sand
U.S. sieve, mesh % retained
40 Trace
50 0.30
70 7.00
100 52.00
140 32.00
200 8.00
270 0.70

40
Table 3-6 Typical screen analysis of #13 glassbeads
U.S. sieve, mesh % retained
140 0.00
170 4.70
325 91.61
400 3.05
400+ 0.64

41
Figure 3-2 Schematic of the PVT setup
Oil sample
CO2
DBR pump
Hydraulic oil
Floating piston
Oil mixture
Air bath
Vacuum pump
Camera
Syringe pump

42
capable of operating at a maximum pressure of 69 MPa and a temperature range of
283.15-473.15 K. Inside the PVT cell, a floating piston is used to isolate the testing
mixture from the hydraulic oil which can be driven downward and upward by a high-
pressure automatic positive displacement pump (PMP-0500-1-10-MB-316-M4-C0, DBR,
Canada). A magnetic mixer is equipped at the bottom of the PVT cell to stir the CO2-
light oil mixture for sufficient mixing. Meanwhile, a video-based digital cathetometer
with a measuring resolution of 0.002 cm is used to measure the volume of the fluids. A
pressure gauge (2089, Ashcroft, USA) with an accuracy of 0.05% of full scale of 13,790
kPa is installed at the inlet of the PVT cell to measure the system pressure. The air bath
temperature is controlled by a microprocessor-based controller and a resistance
temperature device sensor at an accuracy of within ±0.1 K.
(2) 3D displacement model
The schematic diagram and its digital image of the 3D displacement model is shown in
Figure 3-3. This setup mainly includes three subsystems, i.e., injection subsystem,
displacement subsystem, and production subsystem. The fluid injection subsystem is
used to supply CO2 and brine, respectively. The CO2 injection system includes a CO2
cylinder, a gas regulator, a CO2 flow meter (XFM17S, Aalborg, USA) and a digital
pressure gauge, while the displacement subsystem contains a high pressure syringe pump
(500 HP, Teledyne ISCO Inc., USA) and a transfer cylinder (500 cm3 and 5,000 psi).
The CO2 cylinder is used to provide continuous CO2 supply, while the synthetic brine is
introduced from the transfer cylinder to the physical model by using the syringe pump at
a constant flow rate. The accuracy of the CO2 flow meter can be calculated by using Eq.

43
(a)
(b)
Figure 3-3 3D experimental setup: (a) Schematic diagram; and (b) Digital image
Brine
Check valve
BPR Check valve
CO2
Syringe pump
Gas flow meter
3D physical model
Vent
Syringe pump
Separating tube Computer

44
3-16 (XFM Operating Manual, 2009),
total p T( )c p c T [3-16]
where total is the total error coefficient, % of full scale (FS); pc is pressure coefficient,
0.01% of FS/psia; Tc is temperature coefficient, 0.015% of FS/ºC; p is CO2 pressure at
the flow meter, psi; and T is test temperature, ºC. The accuracy of CO2 flowrate in this
study is calculated to be ± 3.19% of FS under the experimental temperature and pressure
of 19.5ºC and 2,000 kPa, respectively.
The 3D displacement subsystem consists of five vertical wells and three horizontal
wells with an inside dimension of 30.4 cm × 30.4 cm × 12.7 cm. The maximum
operational pressure for the 3D physical model is 6 MPa at room temperature. All the
wells with a diameter of 0.635 cm are perforated to allow fluids flow, while they are
wrapped with a 400 × 400 mesh wire-screen (Ferrier Wire Goods, Canada) to prevent
sand production during the displacements. During the displacements, the pressure drop is
measured by two digital pressure gauges (DPG 8001-500, Omega, USA) with an
accuracy of ±0.1% of test gauge.
The production subsystem is comprised of two digital pressure gauges, a back
pressure regulator (BPR) (EB1HP1, Equilibar, USA), an oil-gas separator, and a CO2
flow meter. The BPR is used to maintain a pre-specified pressure inside the physical
model during each displacement on which the reference pressure is exerted with a
syringe pump. The separated gas is measured by using the gas flow meter before being
exhausted to the atmosphere, while the produced liquids are collected with conical-
bottom glass centrifuge tubes (Kimble, USA). During each test, the injected and

45
produced CO2 flow rate can be recorded and stored in a desktop computer, while the
total produced gas volume is read directly from the CO2 flow meter (XFM17S, Aalborg,
USA).
3.3.3 Experimental preparation
(1) Sand-packing
After the wells being prepared and located at designated positions, the physical model is
placed horizontally prior to filling the void space with Ottawa #710 sand and/or
glassbeads #13. In the water flooding, a combination of Ottawa #710 and glassbeads #13
(volume ratio is 2:1) has been used to get a lower permeability. In the CO2 flooding
process, only Ottawa #710 is used. Once being fully packed, the physical model is
shaken with a pneumatic vibrator (NP 35, Northern Vibrator, USA) for at least 12 h.
During the vibration, more sands will be added into the void space wherever necessary.
Once fully and tightly packed, the lid is covered and tightened with 28 bolts so that the
3D physical model is ready for experimental displacements.
(2) Porosity measurement
Two different methods are used to calculate the porosity of the 3D physical model. The
first method is called the imbibition method. Firstly, the physical model is connected to a
vacuum pump (M12C, Fisher Scientific, Canada) through one of the wells. The pressure
in the physical model will be evacuated to as low as −92.0 kPa for 12 h via a valve.
Secondly, once completed, the valve is closed so that the physical model is disconnected

46
from the vacuum pump. Then, the physical model is connected to a tube which is
submerged into a container filled with certain volume of the synthetic brine. Once the
valve is turned on, the brine imbibes into the model. Subsequently, the volume of the
remaining brine in the container is measured. As such, the volume of brine imbibed into
the model can be considered as the pore volume which is used to calculate the porosity.
On the other hand, porosity of the physical model can also be calculated once the model
is packed with the sand when its density and volume has been measured. Usually, the
latter is more accurate for the existence of trace air within the pore. The porosities are
determined to be 33.20%, 34.94%, and 36.90% of pore volume (PV) for waterflooding,
CO2 flooding and CO2-WAG, respectively.
(3) Permeability measurement
The 3D physical model is placed horizontally while two diagonally opposite vertical
wells are chosen as an injector and a producer to measure absolute permeability. The 3D
sandpacked model was initially saturated with the synthetic brine. Then, the water bucket
is set at a certain height and the brine is allowed to flow from the injector to the producer
by the potential energy. The volume flowrate of the brine is measured using a centrifuge
tube (100 cm3) and a stop watch after the flowrate is stable, while the height difference
between the brine surface in the bucket and the producing outlet is recorded. During the
test, usually three different flow rates under three heights are measured so that the
flowrate and height difference are averaged to minimize the error of measurement. Then,
the CMG IMEX module (version 2011.10) is used to determine absolute permeability by
history matching the production profile. The simulated absolute permeabilities for

47
waterflooding, CO2 flooding, and CO2-WAG flooding are 910, 1,070, and 1,150 mD,
respectively.
(4) Saturating oil
After absolute permeability has been determined, the light oil sample is introduced to the
physical model through the wells from a transfer cylinder with a syringe pump. The
saturating process is terminated when no more water is displaced out. This means that
the model has been saturated with light oil sample to ensure reasonable initial oil
saturation under immobile water saturation. The initial oil saturation is calculated as the
volume of oil divided by the pore volume of the physical model. After oil saturating
process, the model is aged for 24 h to equilibrate the distribution of fluids (Zheng and
Yang, 2013).
3.3.4 Experimental procedures
(1) Saturation pressure measurement
Prior to each test, the PVT cell and fluid handling tubing are thoroughly cleaned with
kerosene, flushed with air and finally evacuated by using a vacuum pump (M12C, Fisher
Scientific, Canada) to remove all traces of kerosene and air. In addition, the temperature
of the air bath is set to the desired value for 12 h to ensure the sample cylinders and the
PVT cell are able to reach the preset constant pressure prior to any measurements. As for
CO2-light oil system, the experimental procedures are briefly described as follows.

48
The density of the liquid CO2 in the PVT cell can be determined from correlations in
the following form (Yaws, 2003).
s10 10 10
c
log log ( ) log ( ) 11000
nT
h lT
[3-17]
where s is density of the liquid solvent in kg/m3; T is temperature, K; Tc is the critical
temperature of the solvent, K; and h, l, n are the coefficients with the corresponding
values of 0.4638, 0.2616, and 0.2903 for CO2, respectively. At the experimental
temperature of 19.5 ºC and pressure of 1,100 psi, the density of liquid CO2 is calculated
to be 779.20 kg/m3.
The volume of the liquid CO2 is measured by using the cathetometer, and thus the
mass of the CO2 can be obtained. The magnetic mixer is switched on after CO2 is
injected into the PVT cell. A certain amount of light oil is then added into the PVT cell
by maintaining a constant pressure in the PVT cell, ensuring the mixture is in the liquid
phase. The volume of light oil added is determined to be the total volume reading from
the cathetometer minus the CO2 volume, assuming that there is no volume change due to
mixing of CO2 and light oil since the volume measurement is conducted right after the
light oil injection. The mass of the added light oil can be then determined after its density
is measured. The CO2-light oil mixture is vigorously stirred for 6 h prior to any further
measurements.
In this study, continuous depressurization method (Badamchi-Zadeh et al., 2009;
Memon et al., 2010) has been adopted for determining the saturation pressure of CO2-
light oil system. By continuously depressurizing the pressure of PVT cell and recording

49
the corresponding volume, a pressure-volume relationship curve can be obtained. In this
study, a withdrawal rate of 3 cm3/h is used (Li et al., 2013). The saturation pressure is
determined by locating the transitioning point on the pressure-volume curve. It is
worthwhile noting that, the magnetic stirrer is always kept on to rigorously stir the CO2-
light oil mixture in order to significantly shorten the time for the mixture to reach its
equilibrium state. After the measurement of one concentration of CO2 to light oil is
completed, a certain amount of additional oil is injected into the PVT cell and the
measurement of saturation pressure is repeated. In this study, saturation pressures of
three different concentrations of CO2 to light oil (mol% of CO2 are 39.89, 32.33, and
25.48, respectively) at 19.5ºC are experimentally measured.
(2) Displacement experiments
Waterflooding: The synthetic brine is injected into the 3D physical model at a constant
rate of 2 cm3/min, while water injection is terminated once no more oil is produced. For
waterflooding, the system pressure is maintained at 2.0 MPa. The produced liquids are
collected and measured with conical-bottom glass centrifuge tubes (Kimble, USA). The
injection and production pressures are measured by two digital pressure gauges (DPG
8001-500, Omega, USA) with an accuracy of ±0.1% of test gauge.
CO2 flooding: CO2 is introduced into the physical model from a CO2 cylinder where a
gas regulator is used to control the flow rate at a relatively stable value of 200 Scm3/min
by using the regulator. Similarly, once there is no more oil production, the flooding
process is terminated. The system pressure is maintained at 2.0 MPa. As mentioned

50
previously, the separated gas is measured by using the gas flow meter before being
exhausted to the atmosphere, while the produced liquids are collected and measured with
conical-bottom glass centrifuge tubes (Kimble, USA). During test, the injected and
produced CO2 flow rate can be recorded and stored in a desktop computer, while the
total produced gas volume is read directly from the CO2 flow meter (XFM17S, Aalborg,
USA).
CO2-WAG flooding: To examine the effects of interrupting continuous CO2 injection by
waterflooding, CO2-WAG flooding has been conducted with the 3D sandpacked model.
In the experiment, CO2-WAG flooding was followed after waterflooding. Similar to the
waterflooding and continuous CO2 flooding, the system pressure is maintained at 2.0
MPa and the injection rates of water and CO2 are controlled at 2.0 cm3/min and 200
Scm3/min, respectively.
3.4 Numerical Simulation
To validate the scaling criteria and obtain a better understanding on the mechanisms
governing waterflooding and immiscible CO2 flooding in tight formations, history
matching technique has been used to obtain relative permeability and capillary pressure
curves of the sandpack displacements. Subsequently, CMG GEM module (version
2011.10) is used to build synthetic models for validating the relaxed scaling criteria, and
then applied to a field case.

51
3.4.1 History matching
To simulate the experimental displacement of tight oil via waterflooding and immiscible
CO2 flooding processes, a compositional reservoir simulator CMG GEM module is used
for simulation while history matching technique is selected to tune the relative
permeability curves. A grid system of 11 × 11 × 4 gridblock is applied for both
waterflooding and CO2 flooding. Meanwhile, homogeneous distribution of oil saturation,
porosity, and absolute permeability are assigned to each model.
The CMG WinProp module (version 2011.10) is used to lump the light oil
components into 7 pseudo-components. The measured saturation pressures of the CO2-
light oil systems are used to tune the binary interaction parameter (BIP) correlations
between CO2 and the lumped pseudo-components. Finally, a PVT model compatible
with GEM compositional simulator is generated and incorporated into the displacement
model.
3.4.2 Validation of scaling criteria
To validate the scaling criteria for waterflooding and immiscible CO2 flooding, synthetic
reservoir models are built with the CMG GEM module by correspondingly scaling up
the experimental models. Table 3-7 tabulates the comparison of the experimental and
synthetic reservoir models. By using the CMG GEM simulator, a grid system of 11 × 11
× 4 gridblock is applied throughout the simulations, though the dimension of each model
varies for two scenarios (i.e., 276.6 × 276.6 × 115.6 m for waterflooding and 325.3 ×
325.3 × 135.9 m for CO2 flooding). Meanwhile, the homogeneous distribution of oil

52
Table 3-7 Properties of the scaled theoretical reservoir and physical model for
waterflooding and CO2 flooding
Scenarios Waterflooding CO2 flooding
Properties Synthetic reservoir
Sandpack #1Synthetic reservoir
Sandpack #2
Well radius, m 0.0762 0.0032 0.0762 0.0032
Length (=width), m 276.64 0.304 325.28 0.304
Thickness, m 115.57 0.127 135.89 0.127
Permeability, mD 1 910 1 1070
Porosity 0.1400 0.3320 0.1500 0.3494
Angle of dip 0 0 0 0
Viscosity of oil, cP 2.5 2.5 2.5 2.5
Viscosity of water, cP 1.24 1.24 1.24 1.24
Density of oil, g/cm3 0.804 0.804 0.804 0.804
Density of water, g/cm3 1.108 1.108 1.108 1.108
Water injection rate 2.6 m3/day 2.0 cm3/min N/A N/A
CO2 injection rate, SC N/A N/A 308.2 m3/day 200 cm3/min
Temperatures, ºC 19.5 19.5

53
saturation, porosity, and absolute permeability are assigned to each model. A synthetic
reservoir model for CO2 flooding is shown in Figure 3-4. The relative permeability
curves tuned in history matching process are used for the synthetic reservoir model.
Since the permeability is down scaled for synthetic reservoir model, the capillary
pressure curves are tuned to history match the experimental measurements.
3.4.3 Field application
To further apply the scaling criteria for immiscible displacement of light oil in tight
formations, a real reservoir model is employed to perform the simulation task. The
prototype model selected is a tight oil formation in the Bakken field located in the south
Saskatchewan, Canada (Song, 2013). Usually in numerical simulation process, the study
area could be a well pattern within a reservoir (Memon et al., 2010). A region with 600 ×
600 m with a net pay thickness of 9.24-9.34 m is used for the numerical simulation. The
permeability of the formation matrix ranges from 0.12 to 0.66 mD, while the porosity
has a range of 4.0-5.0%. The initial water saturation is 20%, with initial reservoir
pressure and temperature of 27.7 MPa and 63ºC, respectively. The physical properties
and compositional analysis of reservoir oil and brine can be referred to Tables 3-2 to 3-4.
As the reservoir pressure and temperature varying far from the experimental
conditions, field application has been conducted for waterflooding of tight oil to alleviate
the pressure and temperature effects on fluid phase behaviours. Table 3-8 shows the
comparison of the experimental and field models. Pozzi and Blackwell (1963) stated that
geometric similarity is negligible if the ratio of gravitational to viscous forces

54
Figure 3-4 A 3D view of synthetic reservoir model for CO2 flooding

55
Table 3-8 Properties of the field model and sandpacked model for waterflooding
Scenarios Waterflooding
Properties Sandpack Reservoir
Well radius, m 0.0032 0.0762
Length (=width), m 0.3 600.0
Thickness, m 0.1 9.3
Permeability, mD 910.0 0.5
Porosity 0.33 0.05
Angle of dip 0 0
Viscosity of oil, cP 2.5 2.2
Viscosity of water, cP 1.24 1.24
Density of oil, g/cm3 0.804 0.801
Density of water, g/cm3 1.108 1.108
Rate of water injection 2.0 cm3/min 5.2 m3/day
Temperatures, °C 19.5 63.0

56
is scaled. In this study, the geometric factor (L/H) is not satisfied in the field application
and its impact on the capability of the scaling criteria will be discussed.
By using the CMG GEM module, a grid system of 30 × 30 × 1 gridblock is employed
for the field model. Meanwhile, homogeneous distribution of oil saturation is assigned to
the model. Figure 3-5 shows a 3D view of the field model. Similar to the experiment, an
injector and a producer are drilled at the two corners to simulate a quarter of five-spot
flooding pattern. The injection rate and operation time are scaled up accordingly with the
scaling criteria determined previously are listed in Table 3-8.
3.5 Results and Discussion
3.5.1 Saturation pressure
Three CO2-light oil systems have been tested in this study. Figure 3-6 shows the
measured P-V relations by using continuous depressurization method for (a) Feed #1
(60.11 mol% light oil, 39.89 mol% CO2); (b) Feed #2 (67.67 mol% light oil, 32.33 mol%
CO2); and (c) Feed #3 (74.52 mol% light oil, 25.48 mol% CO2) at temperature of 292.65
K. The measured saturation pressures for these three feeds are 371.27, 359.66, and
275.55 psi, respectively. As can be seen, saturation pressure increases with CO2
solubility in light oil. The measured saturation pressures are incorporated into WinProp
simulator to regress the BIPs between CO2 and 7 lumped pseudo-components. The
regressed BIPs are tabulated in Table 3-9.

57
Figure 3-5 A 3D view of real reservoir model

58
Table 3-9 Lumped pseudo-components and the BIPs with CO2
No. Pseudo-components pc, atm Tc, K BIPs with CO2
1 C1 – C4 41.2044 385.6539 0.130673
2 C5 – C6 32.2255 490.5220 0.134766
3 C7 – C10 28.6421 575.3447 0.229173
4 C11 – C15 20.8138 677.6815 0.000123
5 C16 – C20 15.8736 756.6887 0.150000
6 C21 – C26 12.7803 814.3992 0.150020
7 C27 – C30+ 7.8835 949.0099 0.000002

59
(a)
(b)
(c)
Figure 3-6 P-V relations measured by the continuous depressurization method for (a) Feed #1 (60.11 mol% light oil, 39.89 mol% CO2); (b) Feed #2 (67.67 mol% light oil, 32.33 mol% CO2); and (c) Feed #3 (74.52 mol% light oil, 25.48 mol% CO2) at 292.65 K

60
3.5.2 Experimental displacements
(1) Waterflooding
Figure 3-7 shows the measured oil recovery and water-cut, respectively. As can be seen,
at the beginning of the displacement, oil is displaced continuously, while no water is
produced for the first 0.30 pore volume (PV) of water injected. Once water breakthrough
occurs, water-cut increases rapidly while oil production rate starts to decline. After water
breaks through, little incremental oil is produced as the water bypasses the oil. A total of
0.41 PV water is injected, resulting in an ultimate recovery of 42.9% of OOIP.
(2) CO2 flooding
Figure 3-8 shows the measured oil recovery versus CO2 injection volume. The oil
recovery increases gradually with the continuous injection of CO2 and then reaches to a
plateau of 33.8% of OOIP at the injection volume of 1.20 PV. During this process, water
production is reduced. This is consistent with the findings in the literature (Thomas and
Monger-McClure, 1991).
It can be seen that oil produced with a smaller rate at the beginning of the CO2
displacement and then with an increasing rate till gas breakthrough. This is attributed to
the fact that a large amount of CO2 firstly contacts with oil and dissolves into it to form a
CO2-rich phase on the upper layer of the reservoir (Orr et al., 1982). Within the CO2-rich
phase, the dissolved CO2 swells the oil, reduces oil viscosity, and mobilizes the light oil,
resulting in a higher recovery rate after it reaches the producer. The oil production rate
begins to decrease after gas breakthrough occurs at the 0.66 PV of CO2 injection.

61
Figure 3-7 Measured oil recovery and water-cut versus water injection volume for waterflooding

62
Figure 3-8 Measured oil recovery versus CO2 injection volume for CO2 flooding

63
(3) CO2-WAG
Figure 3-9 shows the measured oil recovery and water-cut versus injection volume of
the CO2-WAG flooding process. CO2 injection was started after 0.45 PV of water
injection during which 46.3% of OOIP oil has been displaced out and water-cut reached
70%. The CO2 injection rate was controlled at a moderate rate of 200 Scm3/min and the
total injection volume for this cycle was measured to be 0.20 PV. As can be seen,
cumulative oil recovery slightly increased from 46.3% to 49.6%. After CO2 injection, 0.1
PV of water was injected resulting in an incremental oil recovery of 3.8% of OOIP.
Subsequently, one more cycle of CO2 (0.15 PV) and water (0.11 PV) has been injected,
resulting in an incremental recovery of 2.7% and 3.7% of OOIP, respectively. During the
displacement, water-cut decreased with each cycle of CO2 injection and rose up quickly
when switching back to waterflooding.
Comparing the CO2-WAG flooding (Figure 3-9) with continuous CO2 flooding
(Figure 3-8), one can conclude that, a higher oil recovery can be expected from CO2-
WAG processes. This can be explained by the fact that CO2 can dissolve into oil phase to
swell the oil, reduce oil density and IFT; the diluted oil was displaced out by the
following water flooding process. This is consistent with the experimental results in the
literature (Song, 2013).

64
Figure 3-9 Measured oil recovery and pressure drop versus CO2 injection volume for CO2-WAG flooding

65
3.5.3 Validation of scaling criteria
(1) Waterflooding
Figure 3-10 shows the tuned water and oil relative permeability curves for history
matching the experimental waterflooding process. As can be seen, the water relative
permeability is rather low (less than 0.10) in the water saturation ranging from 0.16 to
0.40, while the oil phase relative permeability has low values (less than 0.10) in the
water saturation range of 0.50-0.68. With such determined relative permeability curves,
the simulation results obtained from the synthetic reservoir model are compared in
Figure 3-11. As can be seen, the experimental oil recovery and water-cut have been well
matched. As such, one can conclude that relative permeability and capillary pressure
curves for the unconsolidated sandpacked model can be applied to the synthetic reservoir
which is consolidated and has low permeability. This is a similar finding from the
literature that relative permeability and capillary pressure curves have negligible effect
on the measured oil recovery (Pujol and Boberg, 1972).
(2) CO2 flooding
Similar to waterflooding, the tuned water-oil relative permeability, gas-liquid relative
permeability, and capillary pressure curves for CO2 flooding are depicted in Figure 3-12.
As can be seen, gas phase relative permeability increases slightly when the gas saturation
is lower than 0.20, and increases sharply to high values with gas saturation.
Correspondingly, relative permeability for liquid phase decreases sharply when gas
saturation is larger than 0.20, and then maintains to a significantly low level (less than

66
Figure 3-10 Water-oil relative permeability and capillary pressure curves for waterflooding

67
Figure 3-11 Comparison of the measured and simulated oil production and water-cut for waterflooding

68
(a)
(b)
Figure 3-12 Relative permeability and capillary pressure curves for (a) Water-oil system; and (b) Gas-liquid system during CO2 flooding

69
0.05) in the gas saturation range of 0.30-0.68. Figure 3-13 compares the measured and
simulated oil recovery. As can be seen, measured oil recovery has been well matched
except for the small deviation at the end of the displacements. This is probably due to the
non-uniform distribution of oil and water saturations in the sandpack (Zhang et al., 2012).
3.5.4 Field application
As aforementioned, the relative permeability curves and capillary pressure curves for the
reservoir model have been obtained by history matching the production data, as shown in
Figure 3-14 (Song, 2013). As can be seen, the relative permeability of water at the
maximum water saturation is lower than 0.30, while the oil phase relative permeability
and capillary pressure have low values (less than 0.20) in the water saturation range of
0.40-0.90. It can be seen from the liquid-gas systems that the relative permeability of
liquid has low values (less than 0.10) when the gas saturation is higher than 0.50, while
the gas relative permeability increases to its high level (larger than 0.30). The capillary
pressure of liquid-gas phase increases with gas saturation which has a maximum value of
370.7 kPa. Figure 3-15 shows that the experimental oil recovery and water-cut curves
have been well matched.

70
Figure 3-13 Comparison of the measured and simulated oil recovery for CO2 flooding

71
(a)
(b)
Figure 3-14 Relative permeability curves and capillary pressure curves for the real reservoir model: (a) Oil-water systems; (b) Liquid-gas systems (Song, 2013)

72
Figure 3-15 Comparison of the measured and simulated oil production and water-cut for waterflooding

73
3.6 Summary
Scaling criteria have been developed and validated to evaluate performance of
waterflooding and immiscible CO2 flooding in tight formations by using a 3D
sandpacked displacement model. Geometric factor is demonstrated to be negligible while
gravitational and viscous forces have been considered for scaling up waterflooding and
immiscible CO2 flooding. This is because the immiscible displacement processes of light
oil by water and CO2 are controlled by gravity and viscosity of the fluids rather than by
the geometric factors (i.e. ratio of length to thickness). Since capillary pressure and
relative permeability have a negligible effect on movement of the displacing fluid,
sacrificing these two parameters have been proved permissible. This can be attributed to
the fact that in a uniform reservoir influences of capillary forces and permeability
variation on fluids flow are much less than that of gravity and viscous forces (if viscosity
ratio of displacing and displaced fluid is far from unity).
Continuous CO2 injection results in an early gas breakthrough and low ultimate
recovery rate. This is mainly ascribed to the fact that CO2-rich phase flows more quickly
than oil phase due to the unfavourable mobility ratio of gas and oil. Once gas
breakthroughs, gas phase tends to flow through gas channels while less oil is contacted
with CO2, thus the displacement efficiency is limited. A higher oil recovery can be
expected from CO2-WAG process comparing with continuous CO2 flooding. It is
attributed to the fact that CO2 can dissolve into oil phase to swell the oil, reduce oil
density, and IFT; the diluted oil was displaced out by the following water flooding
process by which gas breakthrough is delayed.

74
CHAPTER 4 DEVELOPMENT OF SCALING CRITERIA FOR
IMMISCIBLE DISPLACEMENTS IN HEAVY OIL
RESERVOIRS
In this chapter, scaling criteria developed in Chapter 3 by using dimensional and
inspectional analyses has been modified for waterflooding and immiscible CO2 flooding
in heavy oil reservoirs. The scaling group of the gravitational force to viscous force is
chosen to be neglected while other scaling groups including geometric factor, diffusion
groups, and ratio of capillary forces to viscous forces can be satisfied. Since the fluids,
pressure-temperature conditions, and initial water and oil saturations used in the
sandpacked model are the same as in the synthetic reservoir model, similarities of
chemical properties and relative permeabilities are also expected to be satisfied.
Experimentally, a set of waterflooding and immiscible CO2 flooding of heavy oil is
performed with the 3D sandpacked model. The relaxed scaling criteria are validated by
comparing the simulation results of synthetic reservoirs with experimental measurements,
and then extended for a field application.
4.1 Relaxation of the Scaling Criteria
Similar to relaxation of the scaling criteria for immiscible displacements in tight
formations in Chapter 3, discussions have been made on which scaling groups are more
important to be satisfied while neglecting the less important ones.

75
4.1.1 Geometric factor
Van Daalen and van Domslaar (1972) stated that geometrical similar can be violated if
no cross flow occurs or the component of flow across the layers is negligible compared
with that of parallel flow in immiscible displacement. However, in the waterflooding and
immiscible CO2 flooding of heavy oil processes, vertical flow is common due to the
density difference between the displacing fluids and oil. To be capable of representing
the behaviour of a large prototype, therefore, the model must first be geometrically
similar.
4.1.2 Gravitational force to viscous force ratio
If the scaling group of gravitational force to viscous force ratio (Eq. 3-8) is considered, it
can be simplified to Eq. 3-9 since the heavy oil sample, brine, and gas (CO2) used in the
experiments are the same as those in the reservoir. As can be seen from Eq. 3-9, if the
ratio of gravitational force to viscous force was scaled, the fluid velocity in the model
will be scaled by the same ratio as the permeability changes.
4.1.3 Diffusion and dispersion
As discussed in Section 3.2.4, the forces related to dispersion and molecular diffusion
must be taken into account with respect to waterflooding and immiscible CO2 flooding.
In the experimental displacements of heavy oil, water and CO2 injection rates are set to
be 2.0 cm3/min and 8.0 cm3/min (at the pressure of 3,000 kPa), respectively.
Correspondingly, the Reynolds number are calculated to be 9.16×10⁻⁸, 4.73×10⁻⁴, and

76
1.09×10⁻² for heavy oil sample, brine, and CO2, respectively, ensuring that the flow falls
into the diffusion-dominated region (see Figure 3-1). Thus, the dispersion coefficient
can be represented by diffusion coefficient only. As for diffusion, the dimensionless
group that relates diffusion to the pressure gradient can be written as Eq. 3-14.
In this study, diffusion coefficient is regarded as identical for the model and its
prototype because the fluids and the system temperature are the same between each other.
Although the system pressure of the prototype is slightly different from that of the
sandpack, difference on diffusion coefficients can be negligible (Perkins and Johnston,
1963; Song et al., 2010). When Eq. 3-9 is combined with Eq. 3-14, the requirements for
scaling become to be the relations shown in Eq. 3-15.
The permeability of the Lloydminster heavy oil reservoir ranges from 100 to 5,000
mD, with typical reservoir averaging about 2,000 mD (Adams, 1982). Since permeability
for the sandpacked model used in this study is from 1,500 to 4,000 mD, the ratio of Mk
to Rk has a range of 0.7 to 2.0 if the typical average reservoir permeability 2,000 mD is
used. From Eq. 3-15, it can be seen that R ML L equals to M Rk k which ranges from 0.7
to 2.0. This result is obviously impractical since the prototype is much larger in size than
the sandpacked model. As such, scaling groups in Eqs. 3-8 and 3-14 cannot be satisfied
simultaneously and one of them needs to be sacrificed. In this study, the ratio of
gravitational force to viscous force is neglected and the feasibility of which needs to be
further justified in the validation part.
77
4.1.4 Capillary force to viscous force ratio
As aforementioned, the scaling group that represents the ratio of capillary force to
viscous force should be the same in the sandpacked model and the prototype, as
expressed in Eq. 3-10. Since the heavy oil sample, brine, and CO2 in the sandpacked
model and the prototype are the same, thus, cos and can be cancelled out.
Rearrange Eq. 3-10 to get Eq. 3-11. Since, from Eq. 3-14, the term vL is identical for the
sandpacked model and the prototype, Eq. 3-11 can be met if
M R
k k [4-1]
For the sandpacked models used in this study, there exists a reasonably good linear
relationship between the natural logarithm of permeability (i.e., ln( )k ) and the porosity,
as following:
ln( ) 16.297 1.948k [4-2]
where k is permeability, mD; and is porosity.
It is assumed that the prototype reservoir has a similar characteristic to the
sandpacked models for the relationship of ln( )k and porosity. As such, if an absolute
permeability of 3,000 mD was used for the prototype reservoir, the porosity was
calculated with Eq. 4-2 to be 37.18%, correspondingly. The measured absolute
permeability and porosity for the water and immiscible CO2 flooding are 4,000 mD and
38.72%, respectively. Thus, the ratio of the left-hand side to the right-hand side in Eq. 4-
1 will be 1.18, which is very close to unity. In this way, the ratio of capillary force to the
viscous force can be met between the sandpacked model and the real reservoir.

78
4.2 Experimental
4.2.1 Materials
The heavy oil sample and reservoir brine used in this study are collected from the
Lloydminster area, Canada. The initial reservoir temperature and pressure are 21.0ºC and
3,500 kPa, respectively. The compositional analysis of the Lloydminster heavy oil is
tabulated in Table 4-1. As can be seen, no hydrocarbon components are lighter than C8.
The density and viscosity of the Lloydminster heavy oil are measured to be 988.33 kg/m3
at 15.6ºC and atmosphere pressure and 4,543 cP at 25ºC and atmosphere pressure,
respectively. The density and viscosity of reservoir brine are measured to be 1,051.7
kg/m3 and 1.03 cP at 20ºC and atmosphere pressure, respectively. The dominant
components of the reservoir brine are chloride, sodium, calcium and magnesium ions. In
this study, synthetic brine is prepared and used as a proxy for reservoir brine, the
compositions of which are shown in Table 4-2. The CO2 (Praxair, Canada) used in the
measurements has a purity of 99.998 mol%. The Ottawa sand #710 (Bell & Mackenzie,
Canada) is used to pack the 3D physical model and the screen analysis is listed in Table
3-5.
4.2.2 Experimental setup
The schematic diagram of the 3D displacement model for heavy oil displacements is
shown in Figure 4-1. This setup mainly includes three subsystems, i.e., injection
subsystem, displacement subsystem, and production subsystem. The fluid injection

79
Table 4-1 Compositional analysis of the Lloydminster heavy oil
Carbon No.
wt% mol% Carbon
No. wt% mol%
Carbon No.
wt% mol%
C1 0 0 C21 1.45 2.66 C41 0.67 0.63
C2 0 0 C22 0.93 1.63 C42 0.49 0.45
C3 0 0 C23 1.22 2.04 C43 0.77 0.69
C4 0 0 C24 1.03 1.65 C44 0.77 0.67
C5 0 0 C25 1.16 1.79 C45 0.47 0.40
C6 0 0 C26 1.03 1.53 C46 0.47 0.39
C7 0 0 C27 1.09 1.56 C47 0.56 0.46
C8 0.55 2.63 C28 1.00 1.37 C48 0.56 0.45
C9 0.62 2.63 C29 0.99 1.32 C49 0.50 0.39
C10 0.62 2.37 C30 0.93 1.20 C50 0.49 0.38
C11 0.81 2.80 C31 0.86 1.07 C51 0.50 0.37
C12 0.99 3.15 C32 0.91 1.10 C52 0.49 0.37
C13 1.21 3.57 C33 0.66 0.77 C53 0.42 0.31
C14 1.38 3.78 C34 0.71 0.81 C54 0.42 0.30
C15 1.64 4.19 C35 0.71 0.78 C55 0.43 0.30
C16 1.48 3.56 C36 0.82 0.88 C56 0.43 0.29
C17 1.50 3.39 C37 0.55 0.57 C57 0.43 0.29
C18 1.53 3.27 C38 0.55 0.55 C58 0.40 0.27
C19 1.47 2.97 C39 0.81 0.80 C59 0.40 0.26
C20 1.30 2.50 C40 0.67 0.64 C60+ 56.00 26.03
Total 100.00 100.00

80
Table 4-2 Composition of synthetic brine
Component Concentration (mg/L)
Chloride, Cl− 43,677
Sodium, Na+ 24,700
Calcium, Ca2+ 1,500
Magnesium, Mg2+ 850
Potassium, K+ 413

81
Figure 4-1 Schematic diagram of the 3D displacement experimental setup
Brine
Gas
Vent
Check valve
BPR
Separating tube
Check valve
CO2
Syringe pump
3D physical model
Syringe pump

82
subsystem is used to supply CO2 and brine, respectively. The CO2 injection system
includes a CO2 supply cylinder with a pressure regulator, a high pressure syringe pump
(500 HP, Teledyne ISCO Inc., USA) and a transfer cylinder (1,000 cm3 and 5,000 psi).
To improve the accuracy and operability of the CO2 injection process, CO2 is introduced
from the transfer cylinder to the physical model by using the syringe pump at constant
flow rates. The injection volume of CO2 is calculated with CMG WinProp (version
2011.10).
The 3D displacement and production subsystems are similar to the light oil
displacement setup (see Section 3.3.2). As for heavy oil experiments, the produced fluid
is collected with fluid collectors every 5 min and then heated in water bath at 60ºC for 30
min; oil and water productions are read after oil and water are separated by using a
centrifuge (Allegra X-30 Series, Beckman Coulter, USA) at a speed of 1,600 r/min for
10 min.
4.2.3 Experimental preparation
Before displacements, several experimental preparations need to be completed including
sand-packing, porosity measurement, permeability determination, and saturating heavy
oil sample into the sandpack. The detail procedure can be found in Section 3.3.3. The
measured porosity, permeability, and oil saturation are 38.72%, 3,500 mD, and 85.33%
respectively.

83
4.2.4 Experimental procedures
(1) Viscosity measurement
The viscosities of the heavy oil samples were measured at atmospheric pressure and a
temperature range of 25 to 80ºC by using a cone-plate viscometer (DV-II+, Brookfield
Engineering Laboratories, USA). The viscometer has a measurement accuracy of 1% of
the full-scale range. During the measurements, constant temperature is maintained with a
heated circulating water bath (Haake DC10, Thermo Electron Corporation, USA) with
an accuracy of ±0.1ºC. In the measurement, spindle CP-51 which covers the viscosity
range of 2.4 to 48,000 cP is used. Table 4-3 lists the measured viscosity at different
temperatures for the heavy oil sample.
(2) Displacement experiments
In this study, waterflooding is followed by immiscible CO2 flooding. As for
waterflooding, the synthetic brine is injected into the 3D physical model at a constant
rate of 2 cm3/min; while water injection is terminated once the water-cut reaches to 80%.
The system pressure is maintained at 3,000 kPa by using a BPR at the producer. The
produced liquids are collected and measured with a conical-bottom plastic centrifuge
tube (15 ml, VWR, USA). The injection and production pressures are measured by two
digital pressure gauges (DPG 8000-3k, Omega, USA) with an accuracy of 0.25% of full
scale range.
As for immiscible CO2 injection, gaseous CO2 is introduced into the transfer cylinder
(1,000 cm3 and 5,000 psi) from a CO2 storage cylinder where a gas regulator is used to

84
Table 4-3 Measured viscosity of the Lloydminster heavy oil sample at different
temperatures
Temperature, ºC Viscosity, cP
25 4,543
30 2,873
35 1,877
40 1,274
45 882.3
50 666.8
55 481.1
60 357.9
65 266.9
70 205.1
75 158.7
80 125.9
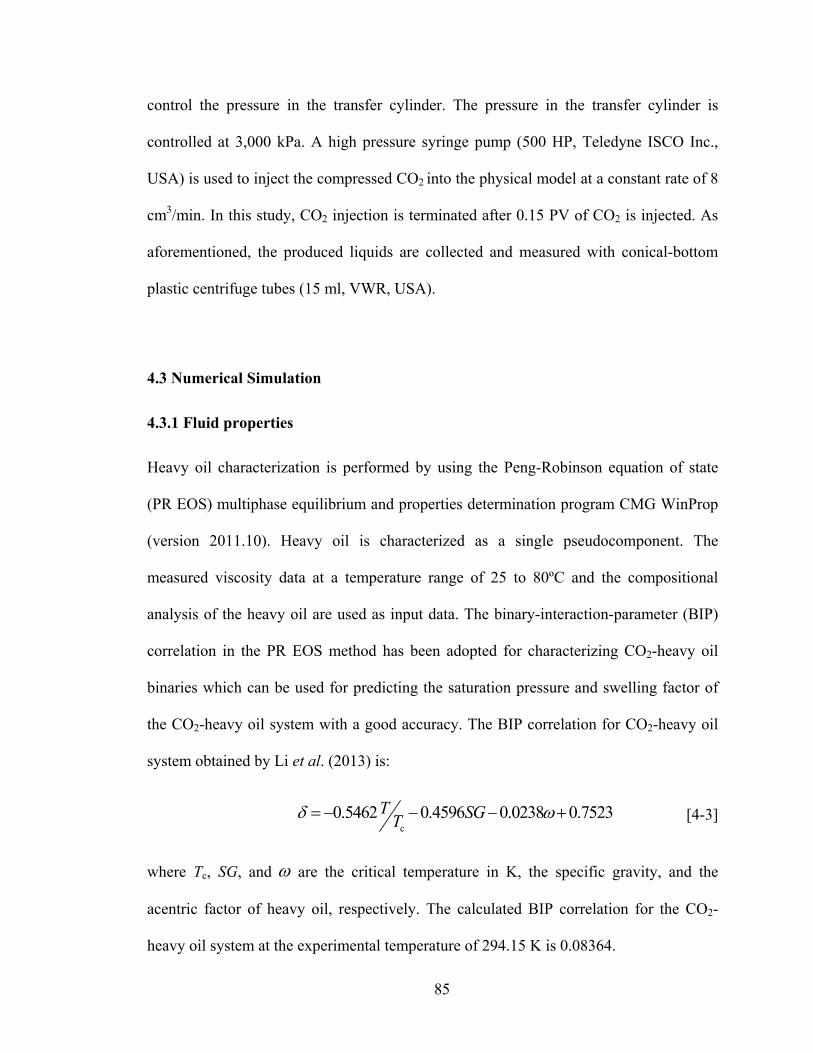
85
control the pressure in the transfer cylinder. The pressure in the transfer cylinder is
controlled at 3,000 kPa. A high pressure syringe pump (500 HP, Teledyne ISCO Inc.,
USA) is used to inject the compressed CO2 into the physical model at a constant rate of 8
cm3/min. In this study, CO2 injection is terminated after 0.15 PV of CO2 is injected. As
aforementioned, the produced liquids are collected and measured with conical-bottom
plastic centrifuge tubes (15 ml, VWR, USA).
4.3 Numerical Simulation
4.3.1 Fluid properties
Heavy oil characterization is performed by using the Peng-Robinson equation of state
(PR EOS) multiphase equilibrium and properties determination program CMG WinProp
(version 2011.10). Heavy oil is characterized as a single pseudocomponent. The
measured viscosity data at a temperature range of 25 to 80ºC and the compositional
analysis of the heavy oil are used as input data. The binary-interaction-parameter (BIP)
correlation in the PR EOS method has been adopted for characterizing CO2-heavy oil
binaries which can be used for predicting the saturation pressure and swelling factor of
the CO2-heavy oil system with a good accuracy. The BIP correlation for CO2-heavy oil
system obtained by Li et al. (2013) is:
c0.5462 0.4596 0.0238 0.7523T SGT [4-3]
where Tc, SG, and are the critical temperature in K, the specific gravity, and the
acentric factor of heavy oil, respectively. The calculated BIP correlation for the CO2-
heavy oil system at the experimental temperature of 294.15 K is 0.08364.

86
4.3.2 Validation of scaling criteria
To validate the scaling criteria for waterflooding and immiscible CO2 flooding, synthetic
reservoir models are built with CMG GEM module. Based on the theory of scaling
criteria, the sandpacked model has been up scaled to a synthetic reservoir model. The
comparison of these two models is shown in Table 4-4.
In this study, the dimension of the sandpacked model was scaled up with a ratio of
500 from 30.4 cm to 152.0 m and 12.7 cm to 63.5 m for length and thickness,
respectively. Because the up scaling process is based on an already built sandpack, the
thickness of the synthetic model is 63.5 m which is much higher than the real thickness
of 3.5 to 6.5 m in the Lloydminster heavy oil reservoir (Adams, 1982). This inability to
scale the reservoir thickness does not detract from the capability of the scale model to
reveal basic information about the displacement mechanisms (Doscher et al., 1983). In
addition, the main purpose of the up scaling process is to validate the relaxation of
scaling criteria and to finally evaluate the impact of each scaling group. The permeability
of the synthetic reservoir model was set to be 2,000 mD, which is the average value for
the Lloydminster heavy oil reservoirs (Adams, 1982). Correspondingly, the porosity is
assumed to be 0.35. As such, the ratio of the left-hand side to the right-hand side in Eq.
4-1 equals to 1.49, while the ratio of capillary force to viscous force is approximately
satisfied.
As suggested by Stalkup (1983), Eq. 3-12 is used to calculate the flow rate. As such,
the relations of the flow rates for sandpacked model and synthetic reservoir model is
M
R
1
500
q
q [4-4]

87
Table 4-4 Comparison of properties of sandpacked model and synthetic reservoir model
Properties Sandpacked model Synthetic reservoir Well radius, m 0.00246 0.0762 Length (=width), m 0.304 152.0 Thickness, m 0.127 63.5 Permeability, mD 4,000 2,000 Porosity 0.3872 0.3500 Angle of dip 0 0 Rate of water injection 2.0 cm3/min 1.44 m3/day Rate of CO2 injection, SC 283.68 cm3/min 204.25 m3/day Operation time 1.0 s 2.6 day Temperatures, ºC 21 21

88
The calculated flow rates for water and CO2 are tabulated in Table 4-4. From the scaling
group, it can be obtained as
t t
wi or wi orM R(1 ) (1 )
v t v t
L S S L S S
[4-5]
Assuming that the initial water saturation and residual oil saturation are the same for
the sandpack and reservoir, rearranging Eq. 4-5 yields
R M R
M R M
( )
( )
t v L
t v L
[4-6]
As can be seen from Eq. 4-6, with the same injection volume, the operation time
consumed in the reservoir is proportional to the dimension and porosity, and reversely
proportional to the velocity. In this case, the reservoir time is 2.2×10⁵ times longer than
that of the model time.
A Cartesian 3D model with a grid system of 11×11×5 gridblocks is built. Figure 4-2
shows the 3D view of the synthetic reservoir model. Similar to the sandpacked model,
both horizontal injector and producer are drilled in the 3rd layer and the well length has
been scaled up from 11.0 cm to 55.0 m for the synthetic reservoir model. Homogeneous
porosity and permeability are assigned for the synthetic reservoir model. Since heavy oil
is saturated into the sandpacked model at a moderate flow rate, a uniform distribution of
initial oil and water can be expected. Relative permeability and capillary pressure curves
tuned in the history matching process are used for the synthetic reservoir model.

89
Figure 4-2 3D view of the synthetic reservoir model

90
4.3.3 Case studies
To further apply the scaling criteria for immiscible displacement of heavy oil, an
experimental displacement conducted by Rojas (1985) and a heavy oil reservoir from
Northminster Sparky pool, Saskatchewan, Canada (AccuMap, 2014) are selected to
perform simulation tasks.
(1) Rojas’s waterflooding test (1985)
The experimental displacement selected was conducted by Rojas (1985). The 3D
sandpacked model with dimensions of 46.0 cm × 46.0 cm × 2.2 cm was used to carry out
the immiscible displacements of heavy oil by water and CO2. One scenario of
waterflooding in a quarter of five-spot pattern is chosen in this study. In the experiment,
Ottawa silica sand was used to prepare the sandpacked model. The porosity and absolute
permeability were measured to be 38.70% and 8,700 mD, respectively. The sandpack
was initially saturated with reservoir brine and then saturated with crude oil sample from
Aberfeldy field (Saskatchewan, Canada) while the initial oil saturation was measured to
be 88.3%. The physical properties of Aberfeldy oil and brine are tabulated in Table 4-5.
During the waterflooding process, the producer pressure was controlled at a range of
40-100 kPag. A total volume of 1.52 PV of brine was injected at an injection rate of 1.73
cm3/min, resulting in an ultimate oil recovery of 32.4% of OOIP. Figure 4-3 shows the
measured oil recovery, water-cut, and pressure drop. As can be seen, early water
breakthrough occurred after 0.09 PV of water injection while injection pressure begins to
decrease. This is attributed to the unfavourable mobility ratio (larger than 500) of

91
Table 4-5 Properties of Aberfeldy oil and brine (Rojas, 1985)
Properties Crude oil Brine
Density, kg/m3 at 1 atm and 23ºC 952.8 1,047.0
Viscosity, cP at 1 atm and 23ºC 1,032 1.14
Molecular weight, g/mol 425 N/A

92
Figure 4-3 Waterflooding of heavy oil conducted by Rojas (1985)

93
injected brine and Aberfeldy heavy oil, resulting in water channels formed between the
injector and producer. As waterflooding continues, water-cut is increased rapidly with
the injection volume, while pressure drop decreases from 400 kPa to less than 50 kPa.
The cumulative oil recovery reaches its plateau of 32.4% at the total injection volume of
1.52 PV.
To simulate the experimental waterflooding, CMG GEM module is used to build the
numerical model with a gridblock of 23 × 23 × 3 (see Figure 4-4). Homogeneous
permeability, porosity, and initial oil saturation are assigned to the model with the
measurements of 8,700 mD, 38.70%, and 88.3%, respectively. The reservoir fluid model
has been regressed with CMG WinProp module (version 2011.10) by using the
properties listed in Table 4-4.
The history matching technique has been used to tune the relative permeability and
capillary pressure curves by matching the experimental measurements (see Figure 4-5).
As can be seen, relative permeability curves change exponentially as a function of
saturations. Oil relative permeability decreases to a low value range (less than 0.10)
when water saturation is higher than 0.60. Capillary pressure for water-oil phase
decreases with water saturation. Figure 4-6 shows the simulated oil recovery and
pressure drop of the waterflooding. There exists an excellent agreement between
simulation results and experimental measurements. Minor mismatch for oil recovery
curve can be attributed to the experiment constraints and non-uniform of the oil
saturation distributions of the sandpacked model (Zhang et al., 2012).

94
Figure 4-4 3D view of the sandpacked model (Rojas, 1985)

95
(a)
(b)
Figure 4-5 Relative permeability and capillary pressure curves for Rojas’s waterflooding: (a) Water-oil system; (b) Liquid-gas system

96
Figure 4-6 Comparison of simulation results and experimental measurements for Rojas’s waterflooding (1985)

97
(2) Northminster Sparky pool
Northminster Sparky pool is a heavy oil reservoir located in Northminster field,
Saskatchewan, Canada (see Figure 4-7). According to AccuMap (2014), this reservoir
has been producing since July 1959, while the waterflooding was initiated in October
1970. Table 4-6 tabulates the rock and fluid properties of the reservoir.
To build a simulation model of the selected reservoir, a compositional reservoir
simulator CMG GEM module has been selected. A gridblock size of 200 × 200 × 6 m is
used when the net pay and porosity are homogeneously assigned to be 6.00 m and 34.0%,
respectively (see Figure 4-8). History matching technique has been adopted by using the
CMG CMOST module (version 2011.10) to simulate the production history from July
1959 to December 1974 of 66 producers and 6 injectors. During the history matching
process relative permeability curves, capillary pressure curves, and absolute permeability
are tuned. As can be seen from Figure 4-9, oil relative permeability and water-oil
capillary pressure decrease with water saturation while water relative permeability
increases with water saturation. Figure 4-10 plots the simulation results of the field
production. A reasonable good history match has been obtained between the simulation
results and field production profile.
(3) Procedure of field application
After obtained properties for the reservoir rock, fluid, and relative permeability, a section
with dimensions of 125 × 125 × 6 m is selected when geometric similarity (L/H) could
be satisfied. Similar to the experiment, a vertical injector and a vertical producer are
98
Table 4-6 Summary of Northminster Sparky pool (AccuMap, 2014)
Northminster Sparky pool, Saskatchewan, Canada
Mean depth, m 541
Net pay, m 6
Porosity 0.340
Permeability, mD 1,000−6,000
Oil density, kg/m3 967.0
Oil saturation 0.85
Reservoir temperature, ºC 21−23

99
Figure 4-7 Northminster Sparky pool (AccuMap, 2014)

100
Figure 4-8 A 3D view of the numerical simulation model of Northminster Sparky pool

101
(a)
(b)
Figure 4-9 Relative permeability curves and capillary pressure curves of field reservoir model: (a) Oil-water system; (b) Liquid-gas system

102
Figure 4-10 History matching results for the Northminster Sparky reservoir production

103
drilled at the two corners. A grid system of 25 × 25 × 1 is built with CMG GEM module
(version 2011.10). The Rojas’s experiment (1985) is scaled up and a comparison with
the Northminster Sparky reservoir is tabulated in Table 4-7. As can be seen, water
injection rate has been scaled up from 1.73 cm3/min of the experiment to 0.68 m3/day for
the reservoir. The injection volume for the reservoir is set to be the experimental value of
1.52 PV. The simulation results of the field reservoir production will be compared with
experimental measurement to validate the scaling criteria.
4.4 Results and Discussion
4.4.1 Experimental measurements
(1) Waterflooding
As aforementioned, waterflooding is followed by the immiscible CO2 flooding. The
cumulative oil recovery factor, oil rate, water-cut, and well bottom-hole pressure of the
injector are plotted versus injection volume, as shown in Figures 4-11 and 4-12. The
water injection is conducted at a constant flow rate of 2 cm3/min for 400 min, resulting
in a total injection volume of 0.18 PV. As can be seen from Figure 4-12, the initial
water-cut is nearly 40%, indicating relatively high water production in heavy oil
reservoirs due to the high oil viscosity. At the injection volume of 0.05 PV, water-cut
sharply increases from less than 50% to 60%, indicating water breakthrough. Meanwhile,
oil rate drops from 1.1 to 0.8 cm3/min (see Figure 4-11). After water breakthrough
occurs, water-cut levels off to about 80% and well bottom-hole pressure of the injector is
decreased with a gentle slope as well as of the oil rate.

104
Table 4-7 Properties of 3D sandpacked model (Rojas, 1985) and Northminster Sparky
pool
Properties Sandpacked model Field model
Well radius 0.25 cm 7.62 cm
Length (=width) 46.0 cm 125 m
Thickness 2.2 cm 6 m
Permeability, mD 8,700 5,000
Porosity 0.387 0.340
Angle of dip 0 0
Initial water saturation 0.117 0.150
Water injection rate 1.73 cm3/min 0.68 m3/day
Operation time 1.0 s 0.7 day
Temperatures, ºC 23 23

105
Figure 4-11 Experimental measurements of the waterflooding and immiscible CO2 flooding of heavy oil: Oil recovery and flow rate

106
Figure 4-12 Experimental measurements of the waterflooding and immiscible CO2 flooding of heavy oil: Water-cut and injector bottom-hole pressure

107
(2) CO2 flooding
After water injection, gaseous CO2 was introduced by using a transfer cylinder at
pressure of 3,000 kPa and a pump rate of 8 cm3/min. The CO2 flooding last 80 min and
was terminated due to the trace production of oil. Total amount of 0.14 PV of CO2 was
injected, leading to an incremental oil recovery of 1.1%. An obvious decline in water-cut
was observed from the beginning of the CO2 flooding process. The increased oil
production rate might be ascribed to that CO2 preferentially displaces heavy oil instead
of water, though in a high water saturation formation (Rojas and Farouq Ali, 1986).
Because of the unfavorable mobility ratio of the CO2-heavy oil system and slow
dissolution rate of CO2 in heavy oil, recovery mechanisms (oil swelling effect and IFT
reduction) by CO2 cannot be accomplished by single CO2 injection (Rojas and Farouq
Ali, 1986). As such, early CO2 breakthrough was observed after 0.06 PV of CO2
injection, resulting in a decline of both oil production rate and water-cut (see Figures 4-
11 and 4-12). The CO2 flooding process was terminated as oil production rate was as low
as 0.15 cm3/min.
4.4.2 Validation of scaling criteria
Experimental waterflooding and CO2 flooding processes are simulated with the CMG
GEM simulator by using history matching technique. Figure 4-13 shows the tuned
relative permeability and capillary curves. As can be seen, water relative permeability
slightly increases when water saturation is less than 0.50, indicating a strong water-wet
system. With an increase of water saturation, oil relative permeability decreases rapidly

108
(a)
(b)
Figure 4-13 Relative permeability and capillary pressure curves: (a) Water-oil system; (b) Liquid-gas system for experimental displacement of heavy oil by water and CO2

109
and remains low (less than 0.05) when water saturation is higher than 0.50. Because
waterflooding was terminated after 0.18 PV of water injection while water saturation is
less than 0.30, the history matching process is very sensitive to the relative permeability
curves where water saturation is lower than 0.30. As for liquid-gas curves, oil relative
permeability decreases significantly to a low value range (less than 0.20) when gas
saturation is higher than 0.20. Meanwhile, gas relative permeability increases to be
higher than 0.60.
The tuned relative permeability and capillary curves are assigned to the synthetic
reservoir model for simulation. The simulated results are plot together with experimental
measurements for comparison. Figure 4-14 shows a satisfactory match in all parameters
including cumulative oil recovery, water-cut, and well bottom-hole pressure of the
injector. The minor mismatches are probably ascribed to the fact of the non-uniform
distribution of oil and water saturations in the sandpack (Zhang et al., 2012).
Based on the excellent match to the experimental measurements, the displacement
processes of heavy oil by waterflooding and immiscible CO2 flooding can be scaled up
from physical sandpacked model to a synthetic reservoir model with the relaxed scaling
criteria. The neglect of the ratio of gravitational force to viscous force is demonstrated
permissible when scaling up immiscible oil displacement in heavy oil reservoirs.
4.4.3 Case studies
The validated scaling criteria have been applied to the Northminster heavy oil reservoir.

110
(a)
(b)
Figure 4-14 History matching results of synthetic reservoir case: (a) Oil recovery and water cut; (b) Injector bottom-hole pressure

111
As can be seen from Figure 4-15, a reasonable good match has been obtained between
Rojas’s experimental measurements and simulation results of the Northminster Sparky
pool production. By using the experimental sandpack to perform immiscible
displacements can be up scaled to a field reservoir. In this way, waterflooding and
immiscible CO2 flooding strategies can be optimized by performing experimental tests.
4.5 Summary
Scaling criteria have been modified and validated to evaluate performance of
waterflooding and immiscible CO2 flooding in heavy oil reservoirs by using a 3D
sandpacked displacement model. The ratio of gravitational force to viscous force was
neglected when scaling up experimental displacements to the field application.
Validation of the relaxed scaling criteria demonstrates the negligible effect of the ratio of
gravitational force to viscous force on immiscible displacing processes of heavy oil. This
is consistent with the findings in the literature made by Craig et al. (1957) that gravity
effect will be negligible in the reservoirs with a higher ratio of well distance to thickness
and having higher mobility ratio (M > 50).
The validated scaling criteria have been applied to a field reservoir by using a heavy
oil displacement experiment performed by Rojas (1985). Based on the excellent
matching results, the reliability of the relaxed scaling criteria is further justified.
Enhanced heavy oil recovery by immiscible CO2 injection is limited by early gas
breakthrough mainly due to the unfavourable mobility ratio between CO2 and heavy oil.

112
Figure 4-15 Comparison of experimental measurements and simulation results of the field reservoir

113
CHAPTER 5 CONCLUSIONS AND RECOMMEDATIONS
5.1 Conclusions
In this study, techniques have been developed and validated to evaluate performance of
waterflooding and immiscible CO2 flooding in both tight formations and heavy oil
reservoirs by using a 3D sandpacked displacement model, respectively. Experimentally,
a number of light oil and heavy oil displacements by waterflooding and immiscible CO2
flooding have been conducted with a 3D sandpacked model. Theoretically, scaling
criteria for waterflooding and immiscible CO2 flooding have been developed by
performing dimensional and inspectional analyses. Mass transfer from CO2 to oil and
water by solution and diffusion has been considered in the inspectional analysis, though
all of the scaling groups cannot be satisfied simultaneously. Relaxations of scaling
criteria for immiscible displacements in tight formations and heavy oil reservoirs have
been performed, resulting in two set of scaling criteria for tight oil and heavy oil
reservoirs, respectively. Scaling criteria have been validated by history matching the
experimental measurements, and then extended for field applications.
The major conclusions that can be drawn from this thesis are summarized as follows:
(1). As for waterflooding and immiscible CO2 flooding in tight oil formations:
a) Geometric factor is demonstrated to be negligible while gravitational and
viscous forces have been considered for scaling up waterflooding and
immiscible CO2 flooding. This is because the immiscible displacement
processes of light oil by water and CO2 are controlled by gravity and

114
viscosity of the fluids rather than by the geometric factors (i.e. ratio of length
to thickness).
b) Since capillary pressure and relative permeability have negligible effect on
general movement of the displacing fluid, sacrificing these two parameters
have been proved permissible. This can be ascribed to the fact that, in a
uniform reservoir, effects of capillary forces and permeability variation on
fluids flow are much less than that of gravity and viscous forces if viscosity
ratio of displacing and displaced fluid is far from unity.
(2). As for waterflooding and immiscible CO2 flooding in heavy oil reservoirs:
a) The scaling group of the gravitational force to viscous force is chosen to be
neglected while other scaling groups including geometric factor, diffusion
groups, and ratio of capillary forces to viscous forces can be satisfied.
b) Validation of relaxed scaling criteria demonstrates the negligible effect of the
ratio of gravitational force to viscous force on immiscible displacing
processes of heavy oil. This conclusion is consistent with the findings in the
literature made by Craig et al. (1957) that gravity effect is negligible in the
reservoirs with a higher ratio of well distance to thickness and having higher
mobility ratio (i.e., M > 50).
(3). The oil recovery factor by continuous CO2 flooding is usually limited in
unconventional reservoirs due mainly to the early gas breakthrough. By using
CO2-WAG flooding process, macro-sweep efficiency is enhanced, resulting in a
higher ultimate oil recovery.

115
5.2 Recommendations
The following recommendations for future studies can be made:
(1). Further validation on the scaling group about relative permeability and capillary
pressure curves, viscous force, and gravitational force should be performed by
comparing fluid flow in real reservoirs and scaled models.
(2). CO2 displacements experiments should be conducted under miscible and/or near-
miscible conditions to further validate the newly developed scaling criteria for
tight formations.
(3). 3D displacements experiments should be conducted with samples collected from
the outcrops of a tight formation, if applicable, to examine the effects of the
sandpacked models’ inability of representing real reservoirs on scaling processes.
(4). Given a real reservoir, production performance by immiscible CO2 flooding
could be further evaluated with the scaled models to optimize injection strategies
and well configurations.

116
REFERENCES
Aalborg Instruments and Controls, Inc.: Operating Manual: XFM Digital Mass Flow
Meters. Orangeburg, NY, 2009.
Adams, D.M. Experiences with Waterflooding Lloydminster Heavy-Oil Reservoirs.
Journal of Petroleum Technology 1982, 34(8), 1643–1650.
Ammer, J.R., Enick, R.M., and Klara, S.M. Modeling the Performance of Horizontal
Injection Wells in Carbon Dioxide Miscible Displacement Processes. Paper SPE
21220, presented at the 11th SPE Symposium on Reservoir Simulation, Anaheim, CA,
February 17–20, 1991.
Badamchi-Zadeh, A., Yarranton, H.W., Svrcek, W.Y., and Maini, B.B. Phase Behaviour
and Physical Property Measurements for VAPEX Solvents: Part I. Propane and
Athabasca Bitumen. Journal of Canadian Petroleum Technology 2009, 48(1), 54–61.
Beeson, D.M. and Ortloff, G.D. Laboratory Investigation of Water-Driven Carbon
Dioxide Process for Oil Recovery. Journal of Petroleum Technology 1959, 11(4), 63–
66.
Bentsen, R.G. Scaled Fluid-Flow Models with Permeabilities Differing From That of the
Prototype. Journal of Canadian Petroleum Technology 1976, 15(3), 46–52.
Buckingham, E. On Physically Similar Systems: Illustrations of the Use of Dimensional
Equations. Physical Review 1914, 4(2), 345–376.
Butler, R.M. Some Recent Developments in SAGD. Journal of Canadian Petroleum
2001, 40(1), 18–22.

117
Canada National Energy Board.: Short-Term Outlook for Canadian Crude Oil. Calgary,
AB, 2005.
Canada National Energy Board.: Tight Oil Developments in the Western Canada
Sedimentary Basin. Calgary, AB, 2011.
Chung, F.T.H., Jones, R.A., and Burchfield, T.E. Recovery of Viscous Oil Under High
Pressure by CO2 Displacement: A Laboratory Study. Paper SPE 17588, presented at
the International Meeting on Petroleum Engineering, Tianjin, China, November 1–4,
1988.
Clarkson, C.R. and Pedersen, P.K. Production Analysis of Western Canadian
Unconventional Light Oil Plays. Paper SPE 149005, presented at the SPE Canadian
Unconventional Resources Conference, Calgary, AB, November 15–17, 2011.
Craig, Jr., F.F., Sanderlin, J.L., and Moore, D.W. A Laboratory Study of Gravity
Segregation in Frontal Drives. Petroleum Transactions 1957, 210(1), 275–282.
Demetre, G.P., Bentsen, R.G., and Flock, D.L. A Multi-dimensional Approach to Scaled
Immiscible Fluid Displacement. Journal of Canadian Petroleum Technology 1982,
21(4), 49–61.
Doscher, T.M. and Gharib, S. Physically Scaled Model Studies Simulating the
Displacement of Residual Oil by Miscible Fluids. SPE Journal 1983, 23(3), 440–446.
Dullien, F.A.L. Porous Media: Fluid Transport and Pore Structure (2nd Ed.). Academic
Press, New York City, NY, 1992.

118
Dusseault, M.B. Comparing Venezuelan and Canadian Heavy Oil and Tar Sands. Paper
2001-061, presented at the Petroleum Society’s Canadian International Petroleum
Conference, Calgary, AB, June 12−14, 2001.
Dusseault, M.B. CHOPS: Cold Heavy Oil Production with Sand in the Canadian Heavy
Oil Industry. Alberta Department of Energy, Calgary, AB, 2002.
Ertekin, T., Abou-Kassem, J.H., and King, G.R. Basic Applied Reservoir Simulation.
SPE Monograph Series, Richardson, TX, 2001.
Forrest, J., Birn, K., Brink, S., Comb, T.J., Cuthbert, B., Dunbar, R.B., Harju, J.A.,
Isaace, E., Jones, F., Khanna, P., Snarr, D.G., Sorensen, J.A., Wall, T.J., and Whitney,
D. Working Document of NPC North American Resource Development Study-
Unconventional Oil. Paper No. 1−6, prepared for the U.S. National Petroleum
Council (NPC), Washington, DC, September, 2011.
Geertsma, J., Croes, G.A., and Schwarz, N. Theory of Dimensionally Scaled Models of
Petroleum Reservoirs. Petroleum Transactions 1956, 207(19), 118–127.
Ghaderi, S.M., Clarkson, C.R., and Chen, Y. Optimization of WAG Process for Coupled
CO2 EOR-Storage in Tight Oil Formations: An Experimental Design Approach. Paper
SPE 161884, presented at the SPE Canadian Unconventional Resources Conference,
Calgary, AB, October 30–November 1, 2012.
Grogan, A.T., Pinczewski, V.W., Ruskauff, G.J., and Orr, Jr., F.M. Diffusion of CO2 at
Reservoir Conditions: Models and Measurements. SPE Reservoir Engineering 1988,
3(1), 93–102.

119
Hand, J.L. and val Pinczewski, W. Interpretation of Swelling/Extraction Tests. SPE
Reservoir Engineering 1990, 5(4), 595–600.
Hara, S.K. and Christman, P.G. Investigation of a Cyclic Countercurrent Light-Oil/CO2
Immiscible Process. SPE Advanced Technology Series 1993, 1(1), 159–165.
Holm, L.W. and Josendal, V.A. Effect of Oil Composition on Miscible-Type
Displacement by Carbon Dioxide. SPE Journal 1982, 22(1), 87–98.
Holm L.W. and O’Brien, L.J. Carbon Dioxide Test at the Mead-Strawn Field. Journal of
Petroleum Technology 1971, 23(4), 431–442.
Huang, S.S. and Dyer, S.B. Miscible Displacement in the Weyburn Reservoir: A
Laboratory Study. Paper PETSOC-SS-92-20, presented at the Technical
Meeting/Petroleum Conference of the South Saskatchewan Section, Regina, SK,
October 7–9, 1992.
Huang, D.D. and Honarpour, M.M. Capillary End Effects in Coreflood Calculations.
Paper presented at the International Symposium of the Society of Core Analysis,
Montpellier, France, September 8−10, 1996.
IHS Inc.: AccuMap Oil and Gas Exploration and Evaluation Mapping Software.
Englewood, CO, 2014.
Jacobs, F.A., Donnelly, J.K., and Svrcek, W.Y. Viscosity of Gas-Saturated Bitumen.
Journal of Canadian Petroleum Technology 1980, 19(4), 46–50.
Jarrell, P.M., Fox, C., Stein, M., and Webb, S. Practical Aspects of CO2 Flooding. SPE
Monograph Series, Richardson, TX, 2002.

120
Kisman, K.E. Artificial Lift: A Major Unresolved Issue for SAGD. Journal of Canadian
Petroleum Technology 2003, 42(8), 39–45.
Langhaar, H.L. Dimensional Analysis and Theory of Models. John Wiley and Sons Inc.,
New York City, NY, 1951.
Leverett, M.C. Capillary Behavior in Porous Solids. Transactions of the AIME 1941,
142(1), 152–169.
Leverett, M.C., Lewis, W.B., and True, M.E. Dimensional-model Studies of Oil-field
Behavior. Petroleum Transactions 1942, 146(1), 175–193.
Li, H., Zheng, S., and Yang, D. Enhanced Swelling Effect and Viscosity Reduction of
Solvent(s)/CO2/Heavy-oil Systems. SPE Journal 2013, 18(4), 695–707.
Liu, G., Sorensen, J.A., Braunberger, J.R., Klenner, R., Ge, J., Gorecki, C.D., and
Steadman, E.N. CO2-Based Enhanced Oil Recovery from Unconventional Reservoirs:
A Case Study of the Bakken Formation. Paper SPE 168979, presented at the SPE
Unconventional Resources Conference, The Woodlands, TX, April 1–3, 2014.
Lolon, E., Cipolla, C., Weijers, L., Hesketh, R.E., and Grigg, M.W. Evaluating
Horizontal Well Placement and Hydraulic Fracture Spacing/Conductivity in the
Bakken Formation, North Dakota. Paper SPE 124905, presented at the SPE Annual
Technical Conference and Exhibition, New Orleans, LA, October 4–7, 2009.
Loomis, A.G. and Crowell, D.C. Theory and Application of Dimensional and
Inspectional Analysis to Model Study of Fluid Displacements in Petroleum Reservoirs.
Bureau of Mines, Washington, DC, 1964.

121
Lozada, D. and Farouq Ali, S.M. New Sets of Scaling Criteria for Partial Equilibrium
Immiscible Carbon Dioxide Drive. Paper PETSOC 87-38-23, presented at the
Petroleum Society of CIM Annual Technical Meeting, Calgary, AB, June 7–10, 1987.
Manrique, M., Thomas, C., Ravikiran, R., Izadi, M., Lantz, M., Romero, J., and
Alvarado, V. EOR: Current Status and Opportunities. Paper SPE 130113, presented at
the SPE Improved Oil Recovery Symposium, Tulsa, OK, April 24–28, 2010.
Memon, A.I., Gao, J., Taylor, S.D., Davies, T.L., and Jia, N. A Systematic Workflow
Process for Heavy Oil Characterization: Experimental Techniques and Challenges.
Paper SPE 137006, presented at the SPE Canadian Unconventional Resources and
International Petroleum Conference, Calgary, AB, October 19–21, 2010.
Mohammed-Singh, L.J. and Singhal, A.K. Lessons from Trinidad’s CO2 Immiscible
Pilot Projects. SPE Reservoir Evaluation & Engineering 2005, 8(5), 397–403.
Monger, T.G., Coma, J.M. A Laboratory and Field Evaluation of the CO2 Huff ‘n’ Puff
Process for Light-Oil Recovery. SPE Reservoir Engineering, 1988, 3(4), 1168−1176.
Morsy, S., Sheng, J.J., and Ezewu, R.O. Potential of Waterflooding in Shale Formations.
Paper SPE 167510, presented at the SPE Nigeria Annual International Conference and
Exhibition, Lagos, Nigeria, August 5−7, 2013.
Mulliken, C.A. and Sandler, A.I. The Prediction of CO2 Solubility and Swelling Factors
for Enhanced Oil Recovery. Industrial & Engineering Chemistry Process Design and
Development 1980, 19(4), 709–711.
Mungan, N. Role of Wettability and Interfacial Tension in Water Flooding. SPE Journal
1964, 4(2), 115–123.

122
Nielsen, R.L. and Tek, M.R. Evaluation of Scale-Up Laws for Two-Phase Flow Through
Porous Media. SPE Journal 1963, 3(2), 164–176.
Orr, Jr., F.M., Silva, M.K., Lien, C.L., and Pelletier, M.T. Laboratory Experiments to
Evaluate Field Prospects for CO2 Flooding. Journal of Petroleum Technology 1982,
34(4), 888−898.
Perkins, F.M. and Collins, R.E. Scaling Laws for Laboratory Flow Models of Oil
Reservoirs. Journal of Petroleum Technology 1960, 12(8), 69–71.
Perkins, T.K. and Johnston, O.C. A Review of Diffusion and Dispersion in Porous
Media. SPE Journal 1963, 3(1), 70–84.
Pozzi, A.L. and Blackwell, R.J. Design of Laboratory Models for Study of Miscible
Displacement. SPE Journal 1963, 3(1), 28−40.
Pujol, L. and Boberg, T.C. Scaling Accuracy of Laboratory Steam Flooding Models.
Paper SPE 4191-MS, presented at the SPE California Meeting, Bakersfield, CA,
November 8–10, 1972.
Rapoport, L.A. Scaling Laws for Use in Design and Operation of Water-Oil Flow
Models. Paper SPE 415, presented at the SPE Petroleum Branch Fall Meeting, San
Antonio, TX, October 17–20, 1954.
Ravel, F. and Anterion, F. Numerical Simulation of CO2-Heavy Oil Interaction in
Fractured Medium: An Interfacial Film Concept. Paper SPE 14228, presented at the
SPE Annual Technical Conference and Exhibition, Las Vegas, NV, September 22–26,
1985.

123
Rojas, G.A. Scaled Model Studies of Immiscible Carbon Dioxide Displacement of Heavy
Oil. PhD Dissertation, University of Alberta, Edmonton, AB, Canada, 1985.
Rojas, G.A., and Farouq Ali, S.M. Scaled Model Studies of Carbon Dioxide/Brine
Injection Strategies for Heavy Oil Recovery from Thin Formations. Journal of
Canadian Petroleum Technology 1986, 25(1), 85–94.
Rojas, G.A., Zhu, T., Dyer, S.B., Thomas, S., and Farouq Ali, S.M. Scaled Model
Studies of CO2 Floods. SPE Reservoir Engineering 1991, 6(2), 169–178.
Rosman, A. and Zana, E. Experimental Studies of Low IFT Displacement by CO2
Injection. Paper SPE 6723, presented at the SPE Annual Fall Technical Conference
and Exhibition, Denver, CO, October 9–12, 1977.
Saeedi, A. Experimental Study of Multiphase Flow in Porous Media during CO2 Geo-
Sequestration Processes. PhD Dissertation, Curtin University, Kensington, Australia,
2012.
Sahin, S., Kalfa, U., and Celebloglu, D. Bati Raman Field Immiscible Application––
Status Quo and Future Plans. SPE Reservoir Evaluation & Engineering 2008, 11(4),
778–791.
Schechter, D.S. and Guo, B. Mathematical Modeling of Gravity Drainage after Gas
Injection into Fractured Reservoirs. Paper SPE 35170, presented at the SPE Permian
Basin Oil and Gas Recovery Conference, Midland, TX, March 27–29, 1996.
Sharma, A.P. and Rao, D.N. Scaled Physical Model Experiments to Characterize the
Gas-Assisted Gravity Drainage EOR Process. Paper SPE 113424, presented at the
SPE/DOE Improved Oil Recovery Symposium, Tulsa, OK, April 19–23, 2008.

124
Siagian, W.R. and Grigg, B. The Extraction of Hydrocarbons from Crude Oil by High
Pressure CO2. Paper SPE 39684, presented at the SPE/DOE Improved Oil Recovery
Symposium, Tulsa, OK, April 19–22, 1998.
Song, C. Development of CO2 EOR Techniques for Unlocking Resources in Tight Oil
Formations. MASc Thesis, University of Regina, Regina, SK, Canada, 2013.
Song, C. and Yang, D. Optimization of CO2 Flooding Schemes for Unlocking Resources
from Tight Oil Formations. Paper SPE 162549, presented at the SPE Canadian
Unconventional Resources Conference, Calgary, AB, October 30–November 1, 2012.
Song, L., Kantzas, A., and Bryan, J. Experimental Measurement of Diffusion Coefficient
of Heavy Oil Using X-Ray Computed-Assisted Tomography under Reservoir
Conditions. Paper SPE 137545, presented at the Canadian Unconventional Resources
& International Petroleum Conference, Calgary, AB, October 19–21, 2010.
Srivastava, R.K., Huang, S.S., and Dong, M. Asphaltene Deposition during CO2
Flooding. SPE Production & Facilities 1999, 14(4), 235–245.
Stalkup, F.I. Miscible Displacement. SPE Monograph Series, New York City, NY, 1983.
Stone, H.L. Probability Model for Estimating Three-Phase Relative Permeability.
Journal of Petroleum Technology 1970, 22(2), 214–218.
Thomas, B.R. and Harvey, J.R. Lick Creek Meakin Sand Unit Immiscible CO2/
Waterflood Project. Journal of Petroleum Technology 1981, 33(9), 1723–1729.
Thomas, G.A. and Monger-McClure, T.G. Feasibility of Cyclic CO2 Injection for Light-
oil Recovery. SPE Reservoir Engineering 1991, 6(2), 179–184.

125
U.S. Geological Survey.: 3 to 4.3 Billion Barrels of Technically Recoverable Oil
Assessed in North Dakota and Montana’s Bakken Formation−25 Times More Than
1995 Estimate. Reston, VA, 2008.
Van Daalen, F. and van Domselaar, H.R. Scaled Fluid-Flow Models with Geometry
Differing from That of Prototype. SPE Journal 1972, (3), 220–228.
Wagner, O.R. and Leach, R.O. Effect of Interfacial Tension on Displacement Efficiency.
SPE Journal 1966, 6(4), 335–344.
Wu, Y., Dong, M. and Shirif, E. Study of Alkaline/Polymer Flooding for Heavy-Oil
Recovery Using Channeled Sandpacks. SPE Reservoir Evaluation & Engineering
2011, 14(3), 310−319.
Yang, D., Tontiwachwuthikul, P., and Gu, Y. Interfacial Tension of the Crude Oil +
Reservoir Brine + CO2 Systems at pressure up to 31 MPa and Temperature of 27ºC
and 58ºC. Journal of Chemical & Engineering Data 2005, 50(4), 1242–1249.
Yang, D. and Gu, Y. Determination of Diffusion Coefficients and Interface Mass-
Transfer Coefficients of the Crude Oil-CO2 Systems by Analysis of the Dynamic and
Equilibrium Interfacial Tensions. Industrial & Engineering Chemistry Research 2008,
47(15), 5447–5455.
Yaws, C.L. Yaws’s Handbook of Thermodynamic and Physical Properties of Chemical
Compounds. Knovel Corporation, New York, NY, 2003.
Zekri, A.Y., Almehaideb, R.A., and Shedid, S.A. Displacement Efficiency of
Supercritical CO2 Flooding in Tight Carbon Rocks Under Immiscible and Miscible

126
Conditions. Paper SPE 98911, presented at the SPE EUROPEC/EAGE Annual
Conference and Exhibition, Vienna, Austria, June 12–15, 2006.
Zhang, Y., Song, C., Zheng, S., and Yang, D. Simultaneous Estimation of Relative
Permeability and Capillary Pressure for Tight Formations from Displacement
Experiments. Paper SPE 162663, presented at the SPE Canadian Unconventional
Resources and International Petroleum Conference, Calgary, AB, October 30–
November 1, 2012.
Zheng, S. and Yang, D. Pressure Maintenance and Improving Oil Recovery by Means of
Immiscible Water-Alternating-CO2 Processes in Thin Heavy-Oil Reservoirs. SPE
Reservoir Evaluation & Engineering 2013, 16(1), 60−71.
Zhou D., Fayers, F.J., and Orr, Jr., F.M. Scaling of Multiphase Flow in Simple
Heterogeneous Porous Media. SPE Reservoir Engineering 1997, 12(3), 173–178.

127
APPENDIX: DERIVATION OF THE DIMENSIONLESS
CONTINUITY EQUATIONS
As for the inspectional analysis, the continuity equations of oil, water, and gas phases are
expressed in dimensionless forms by applying normalized parameters. The continuity
equations for the two immiscible phases of oil and water can be written as (Ertekin et al.,
2001):
o o
o o
u S
B t B
[3-2a]
As aforementioned, the derivatives of the reciprocal FVF (i.e., Bo, Bw, and Bg) versus
pressure are not expressed. Thus, Eq. 3-2a is rewritten as
oo
Su
t
[A-1]
In x direction, superficial oil velocity can be expressed as
ox x wx gxv v v v [A-2]
Water velocity vwx equals to the Darcy’s velocity uwx. As such, according to Darcy’s
law
rw wwx
w
kk pv
x
[A-3]
By taking dispersion and diffusion effects on gas phase, the gas velocity vgx can be
expressed as (Rojas et al., 1991)

128
gogx gx gox
Cv u K
x
[A-4]
Substituting Darcy’s velocity into Eq. A-4, we have
rg gogx gox
g
gkk p Cv K
x x
[A-5]
Substituting vwx and vgx into Eq. A-2, vox can be rewritten as
rg g gorw wox x gox
w g
kk p Ckk pv v K
x x x
[A-6]
From Eqs. 3-4a and 3-4b, pressures of water and gas phase can be expressed as
w o cowp p P [A-7a]
g o cgop p P [A-7b]
Substituting Eqs. A-7a and A-7b into Eq. A-6, we have
o cgorg goo cowrwox x gox
w g
p Pkk Cp Pkkv v K
x x x
[A-8]
Rearranging Eq. A-8 with respect to vox, one may have
rg cgo gorw cowox x gox
o w g
1 kk P Ckk Pv v K
F x x x
[A-9a]
where rg orw o
oro w ro g
1kk
Fk k
.
Similarly, voy and voz can be written as

129
rg cgo gorw cowoy y goy
o w g
1 kk P Ckk Pv v K
F y y y
[A-9b]
rg cgo gorw cowoz z goz
o w g
1 kk P Ckk Pv v K
F z z z
[A-9c]
According to the Leverett J-function (Leverett, 1941), capillary pressure can be
described as a function of saturation:
cow ww
ow cos
P S kS
J [A-10a]
for water phase, and
cgo g
gog cos
P S kS
J [A-10b]
for gas phase.
By substituting oil velocities in x, y, and z directions expressed in Eqs. A-9a to A-9c,
and the normalized parameters expressed in Eqs. 3-5a to 3-5d into the continuity
equation of oil phase described in Eq. A-1, the dimensionless form of continuity
equation of oil can be written as:

130
owwn wn wnx y z
wn o w t
2 2
rw wn rw wn rw wn
o wn o wn o wn
rg go rg
g t o
cos1
cos
kS L S L S df f f
x W y H z dS F v L
k d S L k d S L k d S
x F dS x W y F dS y H z F dS z
k k k d
v L x F d
J J J
J2
gn rg gn
gn o gn
2rg gn og rgrw wo rw
o gn t w o t g o
gox go goy
t o
1
S k SL d
S x W y F dS y
k S k g kL d k k g k
H z F dS z v z F v z F
K C KL
Lv x F x W W
J
J
go goz go on
t o t o n
1 1C K CL S
v y F y H Hv z F z t
[3-6a]
Similarly, the dimensionless form of the following continuity equations of water and
gas phase can be derived, respectively.
owwn wn wnx y z
wn w w t
2rg rgw ro wn w ro wn
w o g wn w o g wn
2rgw ro
w o g
cos1 kS L S L S df f f
x W y H z dS F v L
k kk d S L k d S
x F dS x W y F dS y
kL k
H z F
J J
go rg gnwn
wn g t w gn
2 2rg gn rg gn
w gn w gn
rgwo w ro
t w w g o
cosk k Sd S d
dS z v L x F dS x
k S k SL d L d
W y F dS y H z F dS z
kk g k
v z F
J J
J J
og rg gox go
t g w t w
goy go goz go wn
t w t w n
1
1 1
k g k K C
v z F Lv x F x
K C K CL L S
W Wv y F y H Hv z F z t
[3-6b]
for water phase; and

131
wn wn wnx y z
wn g
2
ow rw wn rw wn
w t g wn g wn
2go grw wn
g wn g t
1
cos
cos
S L S L S df f f
x W y H z dS F
k k d S L k d S
v L x F dS x W y F dS y
kL k d S
H z F dS z v L x
J J
J gnro rw
g o w gn
2 2g gn g gnro rw ro rw
g o w gn g o w gn
og gow rw
t w g t g g
Sk k d
F dS x
S SL k k d L k k d
W y F dS y H z F dS z
k gk g k
v z F v z F
J
J J
ro rwgn go on
o w n
k kS C S
t
[3-6c]
for gas phase.