development of photosystem complexduring … will permit identification of the components which are...
TRANSCRIPT

Plant Physiol. (1976) 58, 257-267
Development of Photosystem II Complex during Greening ofChiamydomonas reinhardi y-l
Received for publication January 29, 1976 and in revised form April 26, 1976
DAVID CAHEN' AND SHMUEL MALKINThe Weizmann Institute of Science, Rehovot, Israel
SUSANA SHOCHAT AND ITZHAK OHAD2Department of Biological Chemistry, The Hebrew University ofJerusalem, Jerusalem, Israel
ABSTRACT
The relative content of organized pigment, active centers, and accep-tor pools of photosystem II and their interconnection dunng the devel-opment of the photosynthetic membranes ofChlamydomonas reinhardiy-1 have been measured using the fluorescence induction technique. Thedegree of connectivity and efficiency of the developing system has beenassessed also from measurements of maximal rates, quantum yield, andflash yield of 2,6-dichlorophenolindophenol photoreduction using H20as the electron donor. The results obtained indicate that the process ofmembrane development in this organism consists of two phases: aninitial phase of reorganization and connection between pre-existing com-ponents, and a second phase of actual accumulation of newly formed,complete, and active units. The ratio of active centers to Chl remainspractically constant throughout the process while the degree of connec-tivity between the active center and the plastoquinone pool was doubledduring the early phase of the greening. In addition the degree of connec-tivity between the plastoquinone pool and the rest of the electrontransport chain increases as demonstrated by a 10- to 20-fold rise in thequantum yield and a 10-fold rise in the maximal rate and the flash yield.The ratio of light harvesting Chl to active centers remains apparentlyconstant during the second phase of the greening as indicated by lightsaturation experiments and by the constancy of the apparent photosyn-thetic unit size. Electron donation from H20 seems to develop slowerthan the activity of the rest of the complex as demonstrated by measure-ments of 2,6-dichlorophenolindophenol photoreduction using 1,5-di-phenylcarbazide as the electron donor. The value of all the aboveparameters which remain constant during the second phase of the green-ing are comparable to those obtained with membranes of light-growncells.
The process of chloroplast membrane biogenesis has been thesubject of extensive work carried out in many laboratories. Theresults obtained so far have been reviewed recently (5, 18, 28).The process of assembly of components and membrane develop-ment can be summarized as follows. The chloroplast membranesgrow by progressive insertion of newly formed componentswithin pre-existing membranes. The addition of the new compo-nents can occur simultaneously or stepwise, and in the secondcase can result in continuous rearrangements and organizationalchanges within the membrane, detected at the ultrastructurallevel (17) and accompanied by drastic changes in photosyntheticactivity (12, 27, 37). The stepwise addition of membrane com-
I Max Bogen Research Fellow.2 Recipient of the United States-Israel Science Foundation Grant 184.
ponents in Chlamydomonas reinhardi was so far demonstratedfor two classes of polypeptides (11, 16) associated with thebinding of Chl and the formation of the active centers of bothphotosystems (2, 11, 16). In addition, a developmental se-quence of events related to the formation of P700 and lightharvesting Chl has been described (10).The development of 02 evolution activity during greening of a
dark-grown Chlorella mutant has been described by Herron andMauzerall (15) and measurements of both activation of 02evolution and variable fluorescence during greening of anotherChlorella mutant have been reported by Dubertret and Joliot(7). The data obtained by both groups indicate that in thesemutants active centers connected to the electron transport chainare present in the membrane at the very beginning of the green-ing and additional units are made during the process. It appearsthat in both mutants the photosynthetic unit size increases duringgreening due to addition of Chl b (7) or light harvesting Chl(15). However, the above data give only partial information onthe process of photosystem II development.Herron and Mauzerall (15) measured 02 evolution connected
to CO2 fixation, that is overall photosynthetic activity. On theother hand, Dubertret and Joliot (7) measured only the primaryphotoact of photosynthesis isolated out of the total activity ofPSII. The data reported by the above-mentioned authors havebeen obtained using whole cells. More information on the devel-opment of PSII activity should be expected if isolated mem-branes are used in which different partial reactions can be mea-sured.
Extensive information is now available on the development ofthe photosynthetic membranes of C. reinhardi using either wildtype synchronized cultures (4, 33) or the greening process of they-1 mutant (28). This information includes development of themembrane-bound and soluble proteins (11, 30), phosphoryla-tion (3, 37), synthesis of Chl, carotenes, and membrane lipids(14), electron carriers such as Cytf (30, 34), plastocyanin (10),ferredoxin, CO2 fixation cycle enzymes (30), and the underlyingprocess of control by light of the chloroplast differentiation (28).A detailed analysis of the development of PSII activity in the
y-1 mutant would be useful because of the ability to integrate thedata within the framework of already existing information.The PSII complex of the membrane can be considered to
consist of the water-splitting system, the active center includingthe primary acceptor Q, the light harvesting Chl, and the con-nection via the plastoquinone pool to the rest of the electrontransfer chain (20).
Since one deals with a developing system possessing initiallymembrane remnants (29, 30), one should consider that certaincomponents of the PSII complex might be present, while otherscan be made de novo; some might be unconnected or misassem-bled and become properly organized in the early phase, and
257 www.plantphysiol.orgon September 9, 2018 - Published by Downloaded from Copyright © 1976 American Society of Plant Biologists. All rights reserved.

CAHEN, MALKIN, SHOCHAT, AND OHAD
others might be added only at a later phase of the process.Measurements of the functionality of the whole chain will dis-close only the presence of complete units, while measurementsof partial reactions in combination with measurements of overallactivity will permit identification of the components which arenot yet part of a complete unit. By use of assay systems whichmeasure overlapping partial reactions, it should be possible togain information on both the presence and synthesis of compo-nents and the process of their integration into a complete activeunit. Measurements of overall electron transfer activity fromnatural or artificial donors, intrinsic fluorescence, variable fluo-rescence, relative induction time, quantum yield, and flash yieldcould enable us, when combined simultaneously. to obtain suchinformation (see below).
In the present work, the sequence of events leading to theformation of the active center and the light harvesting system ofPSII and their connection with the electron transfer chain duringthe greening process of Chlamydomonas reinhardi y-1 has beeninvestigated using this approach. The results show that duringthe early phase of the greening (0 to 4 hr) a drastic reorganiza-tion of the membranes occurs, expressed as a sharp decrease inthe apparent size of the photosynthetic unit and an increase inthe efficiency of the system as measured by the quantum yieldand maximal rate of DCIP3 reduction. This indicates an exten-sive connection of existing active centers to electron transferchains which occurs during this phase. In addition a markeddecrease in the relative amount of nonvariable fluoresence isobserved implying organization of Chl into the photosystems.During the remainder of the greening process, complete andactive PSII units are added to the developing membrane.
MATERIALS AND METHODS
Preparation of Cells and Greening Experiments. Chlamydo-monas reinhardi y-1 cells were grown either in the dark or in thelight on a mineral medium containing acetate as a carbon sourceas previously described (29). Cells were harvested in the loga-rithmic phase of growth (1 .5 to 2.5 x 10⁶ cells/ml). For greeningexperiments cells grown in the dark for five to six generationswere used (29). The cells were harvested by centrifugation at3000g for 5 min, washed in fresh growth medium, and resus-pended in the same medium to a final concentration of 0.8 to 1.2x 10⁷ cells/ml. The cell suspension was then exposed to whitefluorescent light (about 104 ergs cm-2 sec-1) as described (29).Samples of cells were taken after different periods of exposure tothe light and a photosynthetic membrane enriched fraction wasprepared as described below. During greening the cell concen-tration remained constant, i.e., no division occurred before 14 to18 hr of illumination (29).
Preparation of Membranes. The cells were washed by centrif-ugation and then resuspended in a medium containing 30 mMtris-HCl buffer, pH 7.5, 10 mm KCI, and 1 mM MgCI2 (TKMbuffer), to a final concentration of 0.5 to 1 x 10⁹ cells/ml. Thecell suspension was then passed twice through an ice-cooledYeda Press operated at 1,400 p.s.i. using argon as the gas phase. Insome cases the cells were broken using a French press operatedat 3,000 p.s.i. (29). The broken cells were centrifuged at 3,000gfor 2 min and the supernatant centrifuged again at 10,000g for10 min in a Sorvall refrigerated centrifuge at 0 C. The pelletobtained was resuspended in the same buffer, stored in ice, andused within 1 to 1.5 hr. The concentration of cells and finalvolume of membrane suspension were chosen in such a way as toobtain when possible about 200 to 500 ,g Chl/ml. The minimumconcentration used at the early phase of greening was 50 ,g/ml.The dark-grown cells contain a relatively high concentration of
3Ahhreviations: DCIP: 2,6-dichlorophenolindophenol; DPC: 1 ,5-di-phenylcarbazide.
starch (29) and thus the membranes prepared from such cells, aswell as those obtained at the beginning of the greening process,were usually contaminated slightly with starch particles. In orderto avoid an unnecessary increase in the turbidity of the sample,and thus render spectrophotometrical measurements difficult, itwas essential to remove the membrane pellet without disturbingthe starch particles, which sedimented as a very tight pelletbelow the membranes.
Tris Treatment of Membranes. For measurements of electrontransfer activity using DPC as an electron donor (36), the mem-brane pellet was resuspended in 0.8 M tris-HCl buffer, pH 8.3,and kept in ice for 3 min. The membranes were then centrifugedfor 10 min at 10,000g. and resuspended in TKM buffer asdescribed above. The concentration of tris required to abolishelectron transfer from H20 while preserving maximal activity ofelectron transfer from DPC was found to be 0.6 M to 0.8 M.Measurements of Photosynthetic Activity. Hill reaction using
DCIP as an electron acceptor was carried out in spectrophoto-metric cells. The reaction mixture consisted of 2 ml TKM buffercontaining 5 AM DCIP and chloroplast membranes to give a finalconcentration of 5 to 10 Ag Chl/ml. In some experiments theHill reaction was measured in tris-HCl buffer without magne-sium (TK) and using 0.2 mm DCIP. The activities measured inthis way were similar to those obtained using the above-men-tioned system. The reduction of DCIP was followed spectropho-tometrically using an Amino-Chance dual wavelength spectro-photometer provided with side illumination and employed in thedouble-beam mode. The difference in absorbance was measuredat 580 to 520 nm (AE = 1.05 x 101 liter-mol-') or 590 - 520nm (AE = 1.2 x 10⁴ liter.mol-1) depending on the turbidity ofthe membrane preparation used. In flash yield experiments thewavelengths used were 625 and 695 nm (AE = 1.45 x 10⁴liter-mol-1).
Excitation light was obtained from a Braun slide projectorequipped with a 500-w tungsten lamp connected to a stabilizedDC power supply. The exciting beam was filtered through a 685nm interference filter (5 nm half-width; Baird Atomic Inc). Formaximal rate measurements excitation was passed through abroad band K-6 Balzer's filter (650 to 690 nm) (Balzer's AktionGesellschaft, Lichtenstein). The light intensity was varied, usingneutral density filters, from 10-11 to 10-8 einsteins cm-2 sec-1.The photomultiplier was protected with two broad band filters(DT green, Balzer's) and one Corning 4-96 filter transmittingbetween 500 and 600 nm. For flash experiments an ILC 268lamp (ILC, Sunnyvale, Calif.) was used with a flash duration of-5 ,usec and at a repetition rate in the range of 5 to 20 flashes/sec.
For calculating quantum yield of the DCIP reduction, thefraction of light absorbed in the reaction mixture was measuredwith an integrating sphere built in this laboratory. Light intensityof the exciting beam was measured with a silicon cell photometerassembled in our laboratory calibrated against a Yellow Springradiometer or directly measured by the second instrument.
Fluorescence induction measurements were done as describedpreviously (24). The apparatus consisted of a photomultiplier at900 angle to the exciting light beam. Exciting light (4 to 6 x 10⁻⁹einsteins cm-2 sec-') was filtered through a 520 to 640 nmbroad band Balzer's filter and a Schott OG-590 cut-off filter.The photomultiplier received light through a 685-nm BairdAtomic interference filter of a very low intrinsic fluoresence.The signal was displayed on a Tektronics 564 oscilloscopeequipped with a memory screen. Far red light was given betweenmeasurements on the same sample using a 726 nm Baird Atomicinterference filter. When DCMU was used it was added after thefar red illumination. The opening time of the shutter was 2 to 3msec. For measurements of the fast and slow phases of fluores-cence induction a time scale of 10 to 20 msec/division and of 0.1to 1 sec/division were used, respectively. All measurements weredone at room temperature.
258 Plant Physiol. Vol. 58, 1976
www.plantphysiol.orgon September 9, 2018 - Published by Downloaded from Copyright © 1976 American Society of Plant Biologists. All rights reserved.

PSII DURING GREENING OF C. REINHARDI Y-1
Chl was quantitated as described by Vernon (35) using a Carymodel 1608 spectrophotometer. Cell concentration was mea-sured with a hemocytometer.
ANALYSIS OF DATA
Active and Inactive Pigments. For the interpretation of thedata we shall distinguish between two kinds of pigment popula-tions: (a) disconnected, photochemically inactive pigments,which are not yet assembled into active reaction centers, and (b)connected, active pigments. Since we consider only the datarelevant to PSII, any pigment which belongs specifically to PSI isclassified as (a). Such a distinction assigns for each Chl ofpopulation (a) a zero probability of excitation transfer to a PSIIreaction center. Similarly, each Chl of population (b) has a highprobability of excitation transfer. Alternatively, to some extentat least, the results may be interpreted in terms of a probabilitydistribution for excitation transfer. For example, if f = [Chla]/[ChltI represents the fraction of active Chl with respect to thetotal Chl, according to the concept of two populations of Chl, itcan also be defined as
N
f p(i)/N
where p(,) is the probability of energy transfer from a Chl mole-cule i to the reaction center and N is the total number of Chlmolecules.
Fluorescence Induction. We adopt the point of view that thefluorescence rise during illumination, of initially dark adaptedmembranes, follows directly the reduction of the primary accep-tor (8, 13). The fluorescence parameters are: Fo, the initial levelafter dark adaptation, Fm, the maximal level, andA, the normal-ized area above the fluorescence curve, which expresses theinduction time (24). The scheme in Figure 1 illustrates a typicalinduction curve. In the presence of DCMU, only a fast phase ofrise exists, reflecting the reduction of Q only. Without DCMU,there is in general a combination of fast and slow rise phases,which may be interpreted as reflecting, respectively, units inwhich Q is disconnected or connected to the plastoquinone pool(25).The parameter F, can be expressed by the constants of the
photosynthetic unit (24):F a _ [Chla] ( kF kF (1)Chl Chl [Chlt] kF + kH kF + kH + kpJ
where a is a geometrical factor of the measuring apparatus(including detector sensitivity), I is the intensity of absorbed
A DCMU
n o ssec-41 secCDrA F, vso
tL I Fv fast
F0 isecU. ~~~~~0.5 sec
T
TIME
FIG. 1. Schematic representation of a typical fluorescence inductioncurve in the absence ( ) and presence (... ) of DCMU. For explana-tion see "Analysis of Data."
light, [Chla]/[Chlt] is the fraction of excitation channeled to thephotosynthetic primary reaction; kp, kH, and kF are rate con-stants for excitation decay by photochemistry, radiationless tran-sition, and fluorescence, respectively. These constants define thebehavior of the pigment system which is connected to an activereaction center, i.e. active pigments; kFIkF + kH is the fluores-cence quantum yield for a "closed" reaction center (correspond-ing to Fm, Fig. 1) and kF/kF + kH + kp is the fluorescencequantum yield for an "open" reaction center (corresponding toFo, Fig. 1). However, we cannot equate the experimental Fo withkFIkF + kH + kp since there is an undefined background fluores-cence, which may come from inactive pigments (26). We believe,and this is further supported by the consistency of the data, thatthe "true" Fo is small compared to the background and thechange of the apparent Fo during development reflects the con-version of the inactive to the active form of the pigments (seealso Clayton [6]).
F, is an extensive parameter, i.e. it depends on the quantity ofmaterial in the measured sample. Therefore, it is normalized to agiven amount of Chl. At the very low Chl concentrations, whichwere used in our experiments, the fraction of light absorbed isproportional to the Chl concentration. For samples obtained atdifferent times during greening it is not evident that the fractionof light absorbed at 520 to 640 nm is the same for the same totalChl concentration, taking into account the changes in the ratio ofChl a to Chl b. We have found that such changes do occur; theabsorption decreases during greening by a factor of 1.5 to 1.8.Since the incident light intensity was kept constant in all experi-ments, it is I/Chl which is affected by this change.The normalized induction area in presence of DCMU (ADCMU)
(Fig. 1) reflects the concentration of PSII active reaction centers(CII). Since Cl, is also an extensive parameter, one has to nor-
malize it for a given amount of Chl. Using the same reasoning asabove we may write:
C,, I
[Chl ] A_Chl Chl [Chlt] kF + kH + kp DCMU (2)
(In this formula [Chla]/[ChltI takes the place of a,, and kplkF +kH + kp replaces 4I in reference 24.)Normal fluorescence induction (without DCMU) reflects the
reduction of both the primary acceptor and the plastoquinonepool, and usually consists of a fast and a slow phase (Fig. 1). Thefast phase reflects the units which are not connected to the pool.They are active with respect to the primary reaction, but inactivewith respect to the electron transfer. The ratio of connected unitsto total units is given by the ratio of extent of the slow phase toextent of the total variable fluorescence (25).The normalized area above the induction curve, A, is propor-
tional to the concentration of the total plastoquinone pool [PQ]connected to and including the electron acceptor Q. The normal-ized [PQ] to Chl ratio ([PQ]I/Chl) will be given by:
[PQ] I [Chla] k_p*_AChl Chl [Chl,] kF + kH + kp (3)
The plastoquinone pool can be detected as soon as there is ameasurable fraction of units connected to the pool. Since severalPQ molecules can be reduced by the same PSII center (25), all ofthe available pool is reduced during induction, even though aconsiderable fraction of reaction centers might not yet be con-nected to the pool.
Actual experimental fluorescence induction curves showedadditional complexity which has not been observed before inother organisms: i.e. DCMU did not abolish completely the slowphase. Even at a very high DCMU concentration a certainadditional slow increase in the fluorescence (10% of the totalextent) always remained. This can be interpreted in two alterna-tive ways: (a) a slow adjustment of the parameters kF, kH, kp to
259Plant Physiol. Vol. 58, 1976
a kp
www.plantphysiol.orgon September 9, 2018 - Published by Downloaded from Copyright © 1976 American Society of Plant Biologists. All rights reserved.

CAHEN, MALKIN, SHOCHAT, AND OHAD Plant Physiol. Vol. 58, 1976
the new conditions formed by the illumination occurs, which inturn changes the parameters Fo and Fm but does not reflect anychange in the reduction state of Q. Such an adjustment mighthappen if for instance the closed reaction centers which areelectrically polarized may influence secondary structures, whichmodify in turn the pigment arrangements. (b) part of the reac-tion centers may be inaccessible to DCMU.
In our analysis of ADCMU we simply disregarded this slowphase, and normalized the extent of the fast phase only. Thiscould introduce an error of about 10 to 15% in the relativeestimation of ADCMU.A very slow phase of additional increase in fluorescence oc-
curs also in absence ofDCMU (10% of the total extent) and maybe explained in a similar way as in a above. This slow phaseintroduces an additional parameter r shown in Figure 1. For thesake of completeness, changes in the value of r will also bereported.
Flash Yield (FY) of DCIP Reduction. This parameter is ob-tained by a variation of the Emerson and Arnold (9) techniquefor the determination of the photosynthetic unit size. It is rea-sonable to assume that only reaction centers connected to anintact electron transport chain (to the point of DCIP entry) cancontribute to the flash yield. Hence:
FY C1l
Chl Chl
1.0
.75
X
0
7;0
.50
.25
(4)
where /8 is the fraction of total reaction centers which cantransfer electrons to DCIP.Quantum Yield (y) of DCIP Reduction. The steady state
quantum yield of DCIP reduction is a product of three factors:(a) the fraction of the light channeled to active centers; (b)inherent quantum yield of the active centers; and (c) the fractionof units connected to an intact electron transport chain. Hence:
@1lox
[Chk,]
[ChltI kF+ kH+ kp x
Maximal Rate. The maximal rate (MR) is a measure of therate-limiting step in the reduction of DCIP. If one assumes a
unimolecular reaction, which includes an electron transport E
chain component, ETC, as a rate-limiting step, then the maximal I:%rate is given by: k [ETC] where k is the rate constant of the rate-limiting step and presumably does not depend on the greening Qprocess (38).The implication that [ETC] = CII- ,3 is not self-evident since
convergence or divergence of electron transfer chains to one ormore PSII centers is an open possibility (22, 24).
A H20 - DCPIP0
o CHL A
1-DPC- DCPIP:
0~~~~~~
1 2 3 A 5
time, hrs
RESULTS
Changes in Photoreduction of DCIP during Greening. Thephotoreduction of DCIP is an overall measure of electron trans-fer activity related to photosystem 11 (21, 31). Measurements ofthis activity close to or at saturating light intensity during thegreening process show that the DCIP photoreduction/cell israther low at the early phase of the greening and increases more
than 10-fold as Chl synthesis proceeds (Fig. 2A). The same
activity was observed also in tris-treated membrane preparationsusing DPC as an electron donor. In this case the activity alsoincreased during greening in a way similar to the normal activity,except at the initial stage of the greening, when the DPC-dependent activity was higher (Fig. 2). The same results withDPC were reproduced at this initial stage even with membranepreparations which were not treated with tris.
Since the rise in activity/cell parallels the rise in Chl content,one could assume that the overall increase in photosyntheticelectron transfer/cell might be due to accumulation of newlyformed photosynthetic membranes having equal and constantspecific activity/Chl. However, when the results are calculated
time, hrs
FIG. 2. Changes in the maximal photoreduction rate of DCIP(DCPIP) during greening using H20 or DPC as electron donors. Theactivity is expressed on a cell basis in A and on a Chl basis in B. The rateof DCIP reduction, using DPC as an electron donor, was the same attime zero when measured with membranes which have been treated withtris, as well as in the absence of tris treatment. The reaction was carriedout in TK buffer; the DCIP concentration was 2 x 10⁻⁴ M. For more
experimental details see "Materials and Methods."
on a Chl basis we find a drastic increase in the activity of electrontransfer from H20 or DPC per Chl (Fig. 2B) indicating that thespecific photosynthetic activity of the membranes increases as
membranes are formed.Changes in Quantum Yield, Maximal Rate, and Flash Yield of
DCIP Reduction during Greening Process. For accurate calcula-tion of the quantum yield it is essential to ensure that themeasurements are carried out in a range of light intensities thatgives a linear response with changes in the exciting photon flux.For measurements of maximal rates one should be sure that lightsaturation is achieved at each time point of the greening process.
260
4
3
700Z'
0
0
0
\1
I
www.plantphysiol.orgon September 9, 2018 - Published by Downloaded from Copyright © 1976 American Society of Plant Biologists. All rights reserved.

PSII DURING GREENING OF C. REINHARDI Y-1
~150 -
E'0I o
_ 100 200 300 400100 ~ ~ 10
*100 labs(Ein/Cfli2.SeC) X 10H
E
x 50 -
10 20 30 40 50
1/Iabs[(Ein/cm2.secY1 x 10-9]FIG. 3. Double reciprocal plot of the rate of DCIP reduction (R) versus light intensity (I.). The plot is expected to be linear according to the
formula R = y MR * I/(yI + MR). The parameters y and I are the same as under "Analysis of Data"; MR, maximal rate. The inset represents the rawdata (rate versus light absorbed). In this particular experiment ([Chl] = 6 ,ug/107 cells) the high light intensity value of fy was 40%. Typically, thisvalue ranged from 20 to 40%.
Measurements of reaction rates versus light intensity havebeen carried out and unexpectedly it was found that the resultingplot shows two linear parts with a break at absorbed lightintensities of about 10-10 einsteins cm-2 sec-1 throughout thegreening process. A typical experimental result is shown inFigure 3. In this particular case one can calculate from the slopethat the photoreduction of DCIP has a higher quantum yield(0.97 e-/hv) at light intensities up to 10-10 einsteins cm-2 - sec-and decreases to 0.43 e-/hv at light intensities above this level.Saturation rates were obtained at values of 1 0-7 to 10-8 einsteinscm-2 sec-1 depending on the time of greening. In all experi-ments in which quantum yield was measured the results werecalculated from the slope of the first part of the plot4 (Fig. 3)which is obtained at light intensities above 10-10 einsteinscm-2 sec-1. The quantum yield was not measured in the lowrange of light intensity, since the activity especially at the earlyphase of greening was too low to be measured accurately. Mem-branes from green cells required lower light intensity to reachsaturation of DCIP reduction. In the later stages of the greeningprocess the saturating intensity remained rather constant whilethe saturated reduction rate increased approximately 20-fold.
Since, technically, it is extremely difficult to perform all thetypes of measurements used in this work on a single culture, oneis compelled to combine the results obtained from differentexperiments performed on different cultures.
Different cultures green at slightly different rates, due to theirprevious history of growth in the dark. Especially the length of
4 One should notice that a break point was obtained qualitatively at alltimes during the greening and was present also in light-grown cells aswell as in isolated lettuce chloroplasts. On the other hand, such abehavior was not found by Sauer and Park (32) using the same range oflight intensities. At the present time we cannot offer an explanation forthis phenomenon. A nonlinearity at low light intensity of a differentnature was observed in Chlorella by Herron and Mauzerall (15).
the lag period during which the rate of Chl synthesis increasesprogressively, varies between 2 and 4 hr (30). Thus, the Chlcontent/cell at a given time of illumination might vary in differ-ent experiments by a value of + 1 ug/l107 cells. The behavior ofthe cells in different experiments could be, generally, correlatedwith their Chl content. Therefore results of several experimentsin which the maximal rate, quantum yield, and flash yield for thephotoreduction of DCIP were measured as a function of the Chlcontent of the cells are shown in Figure 4. The data show a lowvalue for these parameters at Chl levels of 0.5 to 2.0 ,ug/107cells, a sharp rise of up to about 10-fold for the flash yield andmaximal rate and up to 20-fold for the quantum yield at levels of2.5 to 4 ugl107 cells, with no additional changes when the Chlcontent rises further to levels of up to 7 to 8 ,ulg/107 cells or more(Fig. 4). The data in Figure 4 can be compared with thoseobtained in the light-grown wild type cells which show a maximalrate of about 400 to 700 ,teq/mg Chl- hr and a correspondingquantum yield of 20 to 40% indicating that after greening the y-1 mutant indeed regains the wild type behavior.The flash yield/Chl is the reciprocal of the apparent photosyn-
thetic unit size. Measurements of the number of Chl moleculesabsorbing light which participate in the process of one electrontransfer using the flash yield technique are difficult to perform atlow Chl levels because of the low rate of electron transfer.Therefore the spread of data is rather large at a Chl level belowabout 3 ,g Chl/1 07 cells. The typical value is about 5,000 Chl/unit5 (Fig. 5). In several experiments (not shown here) values aslarge as 20,000 Chl/unit or more were calculated at Chl concen-trations of 1 to 1.5 ,ug/107 cells. A fast decrease is obtained inthe apparent size of the photosynthetic unit at levels between 3and 5 ,ug/107 cells and a leveling off afterwards, when the value
5The calculation of the photosynthetic unit size (FY/Chl)-l given hererepresents the apparent value of the unit without taking into considera-tion the fraction of reaction centers which are not connected.
Plant Physiol. Vol. 58, 1976 261
www.plantphysiol.orgon September 9, 2018 - Published by Downloaded from Copyright © 1976 American Society of Plant Biologists. All rights reserved.

CAHEN, MALKIN, SHOCHAT, AND OHAD Plant Physiol. Vol. 58, 1976
6
I0
-
x
x
03
E0*
20 [
0
Nl0
.NG)
10
,fI 0
0
0)
n
x
u
5
0'
maximal rate
0
/a
It
a
a
0- -.A
quantum yield
0 ,
/
/
O/// A-
/
/
Al 0
In/
13 /0-
A
0
f lash yield
0
0
A
a/
10
A
0 ~~A
,-U
'- a a
1 2 3 4 5 6 7
1ug chlorophyll '7celFIG. 4. Changes in maximal rate, quantum yield, and flash yield as a
function of greening. Each curve represents data obtained from severalexperiments. For each measurable the points obtained from the same
experiment are indicated by the same symbol. For additional experimen-tal details see "Materials and Methods."
measured is about 1,000 Chl/unit and remains constant even at aChl level of 14,glg/107 cells (Fig. 5). From these data it is evidentthat the number of units active in electron transport to DCIPrelative to the Chl content of the membranes is very small at theonset of the greening process. However, during the part of theprocess in which most of the new membranes are formed, andthe Chl content rises from about 3 to 14,ug/107 cells, theapparent size of the photosynthetic unit tends to become con-stant and similar to that found in light-grown cells, having a Chlcontent of up to 30,ug/107 cells. According to the analysis ofdata the apparent photosynthetic unit size contains the factor /8and must be corrected by multiplying with the quantum yield y inorder to obtain the effective photosynthetic unit size. This value(about 200 Chl/unit) seems to change relatively little duringmost of the greening period except for the initial phase when itmay reach values of up to 1.500 Chl/unit.Changes in Fluorescence Induction during Greening. Fluores-
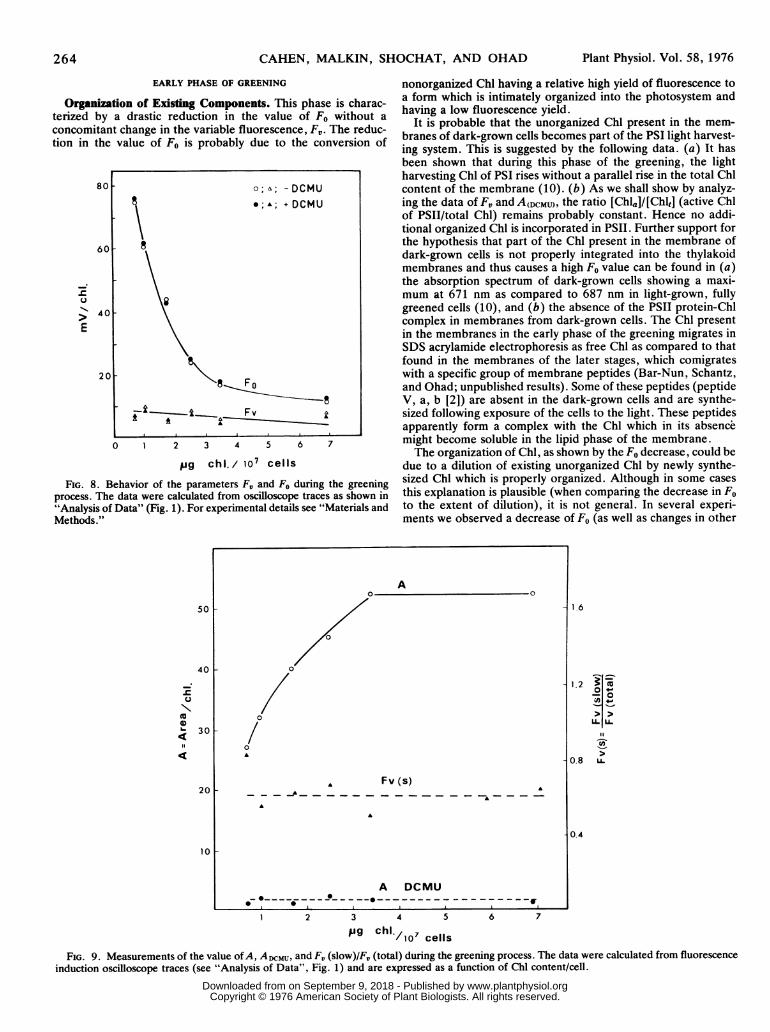
cence induction develops during greening as shown in Figure 6.It is evident that the slow phase of the induction is practicallyabsent at the onset of the greening process; it develops duringthe first 2 to 3 hr of illumination and becomes characteristic ofthat obtained in normal light-grown cells after 4 to 5 hr ofgreening. Typical traces of the fluorescence kinetics obtained atdifferent times are shown in Figure 7. From such traces thevalues of the parameter F1, F0, and A (see "Analysis of Data")were obtained. The results of such measurements are shown inFigures 8 and 9.The value of F,/Chl remains relatively constant throughout the
greening process, indicating that the active PSII Chl/total Chldoes not change significantly at all Chl concentrations/cell. How-ever, the value of F0,/Chl decreases sharply (about 7-fold) whenthe Chl content/cell rises (from 1 to about 4 Ag/107 cells) andremains constant afterward (Fig. 8). As expected F, and F0 arenot affected by the presence of DCMU. Additional informationcan be obtained from the values of Fr (slow phase)/F, (totalextent), A and A I)c-I. The value of ADCMU is very low and thus
difficult to measure accurately. However, it appears that ADCMUis rather constant during the greening process, whereas the valueof A rises 2-fold during the initial greening period and becomesconstant at Chl levels equal to or higher than 3 ,ulg/107 cells (Fig.9).An attempt was also made to measure the parameter r (see
"Analysis of Data"). Its effect on the values of F, is small(-s5%). Accurate measurements of T were difficult to make.However, a definite trend was observed toward an increase in itsvalue at the early phase of greening followed by a decrease andleveling off at around 8 sec toward the end of the process, whenChl content rises to about 4 to 5 ,ug/107 cells.
DISCUSSION
The process of PSII formation in C. reinhardi y-I appears toconsist of two major phases: (a) an initial phase in which compo-nents of the system present in a disorganized state becomeproperly connected and active. In this phase there is relativelylittle synthesis of new Chl compared to the change in the otherparameters. In some experiments the extreme situation wasencountered where changes in the observables were obtainedwithout any accompanying increase of the Chl content/cell. (b)A phase of synthesis and constant accumulation of complete andactive units which are added to the developing membranes.
Obviously the distinction between these two phases is some-what artificial as they do overlap partially in time for any givenbatch of cells, and the degree of overlapping is variable fordifferent cultures. This is evident from the wide spread of data indifferent experiments around the transition point which is de-fined as that of the drastic rise in the maximal rate, quantumyield, flash yield, and relative fluorescence rise time and theonset of rapid Chi synthesis (Figs. 4 and 9).
262
www.plantphysiol.orgon September 9, 2018 - Published by Downloaded from Copyright © 1976 American Society of Plant Biologists. All rights reserved.

PSII DURING GREENING OF C. REINHARDI Y-1
2 4 6 8 10
pg chl./107 cellsFIG. 5. Changes in the apparent size of the photosynthetic unit as a function of the Chl content/cell during the greening process. The reduction of
DCIP using H20 as an electron donor was measured using the flash yield technique.
0 1 2 3 4 5 6
TIME (sec)
FIG. 6. Schematic representation of the changes in fluorescence in-duction curves obtained at different times during the greening process.The curves were taken from actual oscilloscope traces obtained at equallight intensities and were normalized to equal FD/Chl levels; 0,1, 2, 3,and 4 represent different times of the greening process at which the Chlcontent was 0.8, 1.8, 2.3, 3.5, and 6.4 Mg/107 cells, respectively (0, 1.8,2.4, 3.4, and 5 hr, respectively).
The validity of the interpretation for the experimental resultspresented in this work is based on the fact that data obtained bydifferent techniques and measuring independent different pa-rameters concur in supporting the conclusions. Table I summa-rizes the relevant parameters extracted from the experimentalobservables based on the formulae derived under "Analysis ofData." The extensive parameters and observables (i.e. thoseproportional to the quantity of material) are expressed on a Chlbasis. These are FV, F0, ADCMU, A, flash yield, quantum yield,maximal rate, [PQ], [ETC], and CII. Parameters such as /8 or
[Chlu]/[Chlt] are intensive parameters and do not depend on the
A
_~~~~~~~~c
Be D
FIG. 7. Typical fluorescence induction traces obtained during thegreening process of dark-grown y-1 cells. A, time zero (no greening),Chl content, 0.8 j±g/107 cells; 100 mv and 0.1 sec/division. Inset: same
sample, but with base line suppressed, 10 mv and 0.5 sec/division. Attime zero no significant change is observed in the curves upon addition ofDCMU. B, 2 hr greening; Chl content: 2 ,tg/107 cells; 1 sec and 20 mv/division. Inset: same sample with DCMU added to a final concentrationof 10-5 M; 1 sec and 10 mv/division, base line suppressed. C, 5 hrgreening, Chl content: 5.4 ,g/107 cells; upper trace: without addition ofDCMU, 0.5 sec and 50 mv/division; lower trace: with addition of 10-5 MDCMU, 0.5 sec and 50 mv/division. D, 8.3 hr greening, Chl content: 6.9,ug/107 cells; lower trace: without addition of DCMU, 1 sec and 20 mv/division; upper trace with addition of 10-5 M DCMU, 1 sec and 20 mv/division. Vertical scale: mv; horizontal scale: time.
quantity of the material. A specific parameter may appear in theformulae for several observables. A typical example is [Chl.]/[Chk] which appears in the expressions for Fv, QY, A, andADCMU. Because there are more parameters than equations, thisoverlap will help in arriving at some reasonable and consistentconclusions.
7500-
a)
-:5000C.
2500-
0x
x xx
A
0 1 2 14
263Plant Physiol. Vol. 58, 1976
www.plantphysiol.orgon September 9, 2018 - Published by Downloaded from Copyright © 1976 American Society of Plant Biologists. All rights reserved.
264 CAHEN, MALKIN, SHOCHAT, AND OHAD
EARLY PHASE OF GREENING
Organization of Existing Components. This phase is charac-terized by a drastic reduction in the value of Fo without aconcomitant change in the variable fluorescence, F,. The reduc-tion in the value of Fo is probably due to the conversion of
80
601-
E
E40
20 -
2 3 4 5 6 7
pg chi./ 107 cells
FIG. 8. Behavior of the parameters FV and Fo during the greeningprocess. The data were calculated from oscilloscope traces as shown in"Analysis of Data" (Fig. 1). For experimental details see "Materials andMethods."
50 I
40
N.
a1)
4-
41
30
201-
I 0 1
Plant Physiol. Vol. 58, 1976
nonorganized Chl having a relative high yield of fluorescence toa form which is intimately organized into the photosystem andhaving a low fluorescence yield.
It is probable that the unorganized Chl present in the mem-branes of dark-grown cells becomes part of the PSI light harvest-ing system. This is suggested by the following data. (a) It hasbeen shown that during this phase of the greening, the lightharvesting Chl of PSI rises without a parallel rise in the total Chlcontent of the membrane (10). (b) As we shall show by analyz-ing the data of FV and A(DCMU), the ratio [Chla]/[Chlt] (active Chlof PSII/total Chl) remains probably constant. Hence no addi-tional organized Chl is incorporated in PSII. Further support forthe hypothesis that part of the Chl present in the membrane ofdark-grown cells is not properly integrated into the thylakoidmembranes and thus causes a high Fo value can be found in (a)the absorption spectrum of dark-grown cells showing a maxi-mum at 671 nm as compared to 687 nm in light-grown, fullygreened cells (10), and (b) the absence of the PSII protein-Chlcomplex in membranes from dark-grown cells. The Chl presentin the membranes in the early phase of the greening migrates inSDS acrylamide electrophoresis as free Chl as compared to thatfound in the membranes of the later stages, which comigrateswith a specific group of membrane peptides (Bar-Nun, Schantz,and Ohad; unpublished results). Some of these peptides (peptideV, a, b [2]) are absent in the dark-grown cells and are synthe-sized following exposure of the cells to the light. These peptidesapparently form a complex with the Chl which in its absencemight become soluble in the lipid phase of the membrane.The organization of Chl, as shown by the Fo decrease, could be
due to a dilution of existing unorganized Chl by newly synthe-sized Chl which is properly organized. Although in some casesthis explanation is plausible (when comparing the decrease in Foto the extent of dilution), it is not general. In several experi-ments we observed a decrease of F0 (as well as changes in other
4 5 6 7
1 6
1.2 XO 4-
(~-
0. 8 U.
0.4
pg chl./o' cells
FIG. 9. Measurements of the value of A, ADCMU, and F, (slow)IF, (total) during the greening process. The data were calculated from fluorescenceinduction oscilloscope traces (see "Analysis of Data", Fig. 1) and are expressed as a function of Chl content/cell.
O; A; - DCMU
*; ;A + DCMU
F0
I ---i _ Fv .At A
A0 0
0
0
0
/
A Fv (s)_ _ _ _- _ _ _
A DCMU
.
1
I
www.plantphysiol.orgon September 9, 2018 - Published by Downloaded from Copyright © 1976 American Society of Plant Biologists. All rights reserved.

Plant Physiol. Vol. 58, 1976 PSII DURING GREENING OF C. REINHARDI Y-1
Table I. Behavior of Different Parameters Derived from Experimental Measurables during Greening ProcessThe parameters and measurables are the same as described under "Analysis of Data." The early phase and the late phase of the greening are
defined under "Discussion."
Parameter Derived Early phase Late phasefrom (connection) (synthesis andFv accumulation)
[chlal/chlti QY constant constant
(Fraction of chl active Ain PSII relative to ADCMJtotal chl)
a QY increases x constant(Fraction of reaction 10-20centers which can FYtransfer electronsto DCIP)
Cii constant constant(Concentration of PSII FYreaction centers)
[PQ] A increases x 2 constant(Concentration of plasto-quinone connected to PSIIreaction centers)
[ETC] MR increases x 10 constant(Concentration of elec-tron transport chainsconnected to PSII re-action centers)
"Unorganized F decreases x 7 constantchlorophyll" 0
observables) with very little change in the Chl content, accordingto the concept of the initial phase of development (cf. above).According to equation 1, F, (per Chl) is proportional to theproduct of three independent factors: I/Chl, [Chl0]/[Chlt], and a
certain expression of kF, kH, and kp. There is a parallel decreaseof similar magnitude of both F5,/Chl and I/Chl during greening.This implies the constancy of the product of the two remainingfactors, indicating either that these factors change exactly in a
reciprocal way, which seems a very remote possibility indeed, or
that both remain constant. Accepting this last possibility, oneinfers from equation 2 that CII/Chl will vary with the product I/Chl x ADCMU. The results show that ADCMU fluctuates randomlyaround a mean value by +40%, while I/Chl decreases by a factorof 1.5 to 1.8. The rise in the value of ADCMU causes an uncer-
tainty in the estimation of CII, but certainly one can consider it tobe constant within the limits of the change of I/Chl.Changes in Quantum Yield and Flash Yield. The quantum
yield and the flash yield (per Chl) increase on the average by thesame factor (Fig. 4). From the constancy of CII (per Chl) com-
paring equations 4 and 5, and the assumptions of the constancyof [Chla]/[ChltI and kp/kp + kH + kF one arrives at the conclu-sion that 83 is the common factor which changes drasticallyduring the early phase of greening and affects the flash yield andthe quantum yield in the same way. Thus it appears that one ofthe main factors which changes during this phase is /3, the degreeof connectivity of reaction centers to the rest of the electrontransfer chain. However, the ratio of F5, (slow)/F5, (total) whichrepresents the degree of connectivity of reaction centers to theplastoquinone pool remains approximately constant. Hence,very probably /8 is related to a connection between the pool to a
further point in the electron transport chain and not to theconnection of active centers to the pool. This point is furthersupported by the fact that the plastoquinone pool (per Chl)measured by fluorescence induction, increases during this phaseof greening, by a factor of about 1.5 to 2 (Fig. 9 and equation 3)and that a typical inflection (24) appears after a certain period of
greening. This inflection very probably reflects the addition of anundefined second component to the pool (19, 24), which fills a
gap between plastoquinone and the point of entry of DCIP.At this stage we cannot decide whether a pre-existing quinone
pool or a newly formed one is involved. Measurements of therelative contents of Cyt f in greening C. reinhardi y-1 cells haveshown that it is present in the membrane found in dark-growncells in rather large amounts (29, 30). However, this Cyt is notphotoactive unless the cells are exposed to the light from 1 to 3hr (14). Thus, at this phase of the greening, all the Cytf becomesphotoactive indicating its connection to the newly activated PSIIand PSI centers. Also, it has been reported that plastocyanin isfound in excess in the membranes of dark-grown cells (10).Thus, it is attractive to consider that the quinone pool is alsopresent and becomes connected to the active centers and theelectron transport chain during the early phase of the greening.
In addition, the maximal rate increases during greening by thesame factor on the average as the flash yield and the quanturnyield, indicating that /8 is probably the main factor influencingthese observables. More accurate measurements are needed inorder to determine if any changes in the convergence of electrontransport charns and reaction centers occur.Development of Water-splitting System. The measurements
of electron donation from H20 as compared with DPC show thatthe development of the water-splitting activity lags behind thedevelopment of DPC oxidation. Addition of DPC to membranesthat were not tris-treated obtained from dark-grown cells in-creases the extent of the DCIP reduction indicating that a rate-limiting step exists on the donor site of PSII at this point.However, during the second phase of greening the water-split-ting activity increases severalfold, while that of DPC levels off atvalues of about 30% the maximal rate obtained with H20 (Fig.2B). These results indicate that as the membranes become betterorganized and more active the ability of DPC to donate electronsbecomes rate-limiting. In this respect the Chlamydomonas mem-branes appear to differ from some higher plants in which the
265
www.plantphysiol.orgon September 9, 2018 - Published by Downloaded from Copyright © 1976 American Society of Plant Biologists. All rights reserved.

266 CAHEN, MALKIN, SI
activity measured with DPC is equal to, or higher than thatobtained with H20 (1). However, data basically similar to thoseobtained in this work have been reported for barley (N. K.Boardman, personal communication).Measurements of the apparent photosynthetic unit size by the
flash yield technique have been performed in several othersystems. In most of these the unit size was found to be constantduring development, while in others it has been reported toincrease (15). Indeed, during the second phase of the greeningof C. reinhardi, that of actual accumulation of membranes, thesize of the unit remains constant also in this system. The changesobserved during the initial phase apparently are correlated withthe change in 3. It is not clear whether in the other systemsreported so far ,B changes or remains constant.
PHASE OF SYNTHESIS AND ACCUMULATION OF NEW UNITS
This phase is characterized by a tendency toward a constantvalue for all the parameters measured. Such constancy indicatesthat the relative proportion of active centers to light harvestingChl is constant throughout this phase of the greening. That thisindeed might be the case, is also shown by the small variationfound in the requirement for light saturation during this phase.On the other hand, data have been reported showing an increasein the light harvesting Chl/reaction center of PSI in these cells(10). The constancy of the PSII unit during the accumulationphase is also in agreement with the constancy of the quantumyield found at Chl contents above 3 to 4 ,ug/107 cells.The concept that PSII, when present, and active, behaves as a
complete constant entity finds support also in the data reportedby Regitz and Ohad (31), who have measured the sensitivity totrypsin of Chlamydomonas thylakoids at different stages of thegreening process. While rearrangements occur in the membraneas demonstrated by the exposure or protection of peptides to-ward trypsin digestion, the PSII units present, measured byDCIP reduction, behave in the same way at all times during thegreening.
GENERAL CONSIDERATIONS
The ratio F, (slow) (connected active centers) to F, (total)(total active centers) is smaller than unity and remains constant.This can be interpreted as evidence for the existence of a con-stant small proportion of newly formed centers which remainunconnected during the whole greening process. During thegreening of Chlorella mutants a change was reported in thefluorescence induction curve in the presence of DCMU from anexponential to a sigmoidal shape. This change was considered asan indication for the development of energy transfer betweendifferent units (7). In all our experiments such a change was notobserved. However, indications for development of energytransfer between units were found in results of experiments inwhich the flash yield was measured as a function of flash inten-sity (23). Preliminary results show a change from a state of lackof energy transfer toward a state of partial energy transfer duringthe greening process. A more detailed report of these data willbe presented elsewhere. Data obtained from other types ofexperiments corroborate the interpretation of the results pre-sented here. Thus, it has been shown that membrane polypep-tides which can be identified as being part of the PSII activecenters are synthesized during the greening by the chloroplastribosomes (2). Greening of Chlamydomonas y-1 cells in thepresence of chloramphenicol, which inhibits synthesis of chloro-plast-made proteins, results in the formation of nonphotoactivemembranes. Activity can be regained by reactivation of thechloroplast ribosomes (11, 16). Preliminary results show that inthis case F, (total) increases in absence of Chl synthesis asexpected from our interpretation, if new active centers were tobe formed.
H-OCHAT, AND OHAD Plant Physiol. Vol. 58, 1976
The understanding of the mechanism of interaction and theassociation and dissociation between PSI and PSII units relatedto electron and energy transfer between the units is importantfor the understanding of the mechanism of photosynthesis. Thedeveloping system presents obvious advantages for the investiga-tion of these parameters.
LITERATURE CITED
1. AKOYUNOGLOU, G. AND M. MICHELINAKI-MANETA. 1974. Development of photosyntheticactivity in flashed bean leaves. In: M. Avron, ed., Proceedings of the Third InternationalCongress on Photosynthesis. Elsevier Publishing Co., Amsterdam. pp. 1885-1896.
2. BAR-NUN, S. AND 1. OHAD. 1974. Cytoplasmic and chloroplastic origin of chloroplastmembrane proteins associated with PSII and PSI active centers in Chlamydomonasreinhardi y-1. In: M. Avron, ed., Proceedings of the Third International Congress onPhotosynthesis. Elsevier Publishing Co., Amsterdam. pp. 1627-1637.
3. BAR-NUN, S., D. WALLACH, AND I. OHAD. 1972. Changes in the photosynthetic specificactivity and the relationship between the light harvesting system and photosyntheticelectron transfer chain during greening of Chlamvdomonas reinhardi y-I. Biochim. Bio-phys. Acta 267: 138-148.
4. BECK, D. P. AND R. P. LEVINE. 1974. Synthesis of chloroplast membrane polypeptidesduring synchronous growth of Chlamydomonas reinhardi. J. Cell Biol. 63: 759-772.
5. BOARDMAN, N. K., J. M. ANDERSON, A. KAHN, S. W. THORNE, AND E. T. TREFFRY. 1971.Formation of photosynthetic membranes during chloroplast development. In: N. K.Boardman, W. A. Linnane, and R. M. Smillie, eds., Autonomy and Biogenesis ofMitochondria and Chloroplasts. North Holland, Amsterdam. pp. 70-84.
6. CLAYTON, R. K. 1969. Characteristics of prompt and delayed fluorescence from spinachchloroplasts. Biophys. J. 9: 60-76.
7. DUBERTRET, G. AND P. JOLIOT. 1974. Structure and organization of System 11 photosyn-thetic units during the greening of a dark-grown Chlorella mutant. Biochim. Biophys. Acta357: 399-411.
8. DUYSENS, L. N. M. AND H. E. SWEERS. 1963. Mechanism of two photochemical reactionsin algae as studied by means of fluorescence. In: Studies in Microalgae and PhotosyntheticBacteria. Japan Society of Plant Physiology. University of Tokyo Press, Tokyo. pp. 353-372.
9. EMERSON, R. AND W. ARNOLD. 1932. The photochemical reaction in photosynthesis. J.Gen. Physiol. 16: 191-205.
10. EYrAN, G., R. C. JENNINGS, G. FORTI, AND 1. OHAD. 1974. Changes in photosystem Iactivity and membrane organization during degreening and greening of a Chlamydomonasreinhardi mutant y-1. J. Biol. Chem. 249: 738-744.
11. EYrAN, G. AND I. OHAD. 1970. Cooperation between cytoplasmic and chloroplast ribo-somes in the synthesis of photosynthetic lamellar proteins during the greening process in amutant of Chlamydomonas reinhardi y-1. J. Biol. Chem. 245: 4297-4307.
12. EYrAN, G. AND 1. OHAD. 1972. Modulation of chloroplast lamellae composition andfunction induced by discontinuous illumination and inhibition of ribonucleic acid andprotein synthesis during greening of Chlamydomonas reinhardi y-1 mutant cells. J. Biol.Chem. 247: 122-129.
13. FORBUSH, B. AND B. KOK. 1968. Reaction between primary and secondary electronacceptors of photosystem II of photosynthesis. Biochim. Biophys. Acta 162: 243-253.
14. GOLDBERG, 1. AND I. OHAD. 1970. Lipid and pigment changes during synthesis of chloro-plast membranes in a mutant of Chlamydomonas reinhardi y-1. J. Cell Biol. 44: 563-571.
15. HERRON, A. H. AND D. MAUZERALL. 1972. The development of photosynthesis in agreening mutant of Chlorella and an analysis of the light saturation curve. Plant Physiol.50: 141-148.
16. HOOBER, J. K. 1970. Site of synthesis of chloroplast membranes polypeptides in Chlamvdo-monas reinhardi y-1. J. Biol. Chem. 245: 4327-4334.
17. HOOBER, J. K., P. SIEKEVrrZ, AND G. E. PALADE. 1969. Formation of chloroplast mem-branes in Chlamydomonas reinhardi y-1. Effects of inhibitors of protein synthesis. J. Biol.Chem. 244: 2621-2631.
18. KIRK, 0. T. J. 1970. Biochemical aspects of chloroplast development. Annu. Rev. PlantPhysiol. 21: 11-42.
19. KOK, B. AND G. M. CHENIAE. 1966. Kinetics and intermediates of the oxygen evolutionstep in photosynthesis. In: R. Sanadi, ed., Current Topics in Bioenergetics, Vol. 1.Academic Press, New York. pp. 1-47.
20. KOK, B., S. MALKIN, 0. OWENS, AND B. FORBUSH. 1966. Observations on the reducingside of the 0,-evolving photoact. Brookhaven Symp. Biol. 19: 446-459.
21. LUMRY, R. AND J. D. SPIKES. 1957. Chemical-kinetic studies of the Hill reaction. In:Gaffron, G. H., ed., Research in Photosynthesis. Interscience, New York. pp. 373-391.
22. MALKIN, S. 1969. The topological structure of the photosynthetic unit. Kinetic experimentsand considerations. In: H. Metzner, ed., Progression in Photosynthetic Research, Vol. II.H. Laupp, Jr., Tubingen, Germany. pp. 845-856.
23. MALKIN, S. 1974. Energy transfer in the photosynthetic unit. 1. The concept of independentunits for photosystem II analyzed by flash yields for dichlorophenolindophenol reduction.Biophys. Chem. 2: 327-337.
24. MALKINS, S. AND B. KOK. 1966. Fluorescence induction studies in isolated chloroplasts.Number of components involved in the reaction and quantum yields. Biochim. Biophys.Acta 126:413-432.
25. MALKIN, S. AND G. MICHAELI. 1971. Fluorescence induction studies in isolated chloro-plasts. IV. The inhibition of electron transfer from primary to secondary electron carriersof PSII at low temperature and by DCMU. In: G. Forti, M. Avron, and A. Melandri, eds.,Proceedings of the 2nd International Congress on Photosynthesis, Vol. I, Stresa. pp. 149-167.
26. MALKIN, S. AND Y. SIDERER. 1974. The effect of salt concentration on the fluorescenceparameters of isolated chloroplasts. Biochim. Biophys. Acta 368: 422-431.
www.plantphysiol.orgon September 9, 2018 - Published by Downloaded from Copyright © 1976 American Society of Plant Biologists. All rights reserved.

Plant Physiol. Vol. 58, 1976 PSII DURING GREENING OF C. REINHARDI Y-1
27. OHAD, I. 1972. Biogenesis and modulation of chloroplast membranes. In: L. Bolis, R. D.Keynes, and W. Wilbrand, eds. Role of Membranes in Secretory Processes. NorthHolland Publishing Co., Amsterdam. pp. 24-51.
28. OHAD, I. 1975. Biogenesis of chloroplast membranes. In: A. Tzagoloff, ed. MembraneBiogenesis. Plenum Press, New York. pp. 279-350.
29. OHAD, I., P. SsEKEvrrz, AND G. E. PALADE. 1967. I. Plastid differentiation in a dark-grownalgal mutant (Chlamydomonas reinhardi). J. Cell Biol. 35: 521-552.
30. OHAD, I., P. SEEKEvrrz, AND G. E. PAIADE. 1967. II. Plastid differentiation duringgreening of a dark-grown algal mutant (Chlamydomonas reinhardi). J. Cell Biol. 35: 553-584.
31. REGITz, G. AND I. OHAD. 1974. Changes in the protein organization in developing thyla-koids of Chlamydomonas reinhardi. y-l as shown by sensitivity to trypsin. In: M. Avron,ed., Proceedings of the Third International Congress on Photosynthesis. Elsevier Publish-ing Co., Amsterdam. pp. 1615-1626.
32. SAUER, K. AND R. B. PARK. 1965. The Hill reaction of chloroplasts. Action spectra andquantum requirements. Biochemistry 4: 2791-2798.
33. SCHOR, S., P. StElEvrrz, AND G. E. PALADE. 1970. Cyclic changes in thylakoid membranesof synchronized Chlamydomonas reinhardi. Proc. Nat. Acad. Sci. U. S. A. 66: 174-180.
34. SCHULDINER, S. AND I. OHAD. 1969. Light-dependent induction of proton pump activity inwhole cells and its correlation to cytochrome f photooxidation during greening of a
Chlamydomonas reinhardi mutant (y-1). Biochim. Biophys. Acta 180: 165-177.35. VERNON, L. P. 1960. Spectrophotometric determination of chlorophyll and pheophytins in
plant extracts. Anal. Chem. 32: 1144-1150.36. VERNON, L. P. AND E. R. SHAw. 1969. Photoreduction of 2,6-dichlorophenolindophenol
by diphenylcarbazide: a photosystem II reaction catalyzed by tris-washed chloroplasts andsubchloroplast fragments. Plant Physiol. 44: 1645-1649.
37. WALLACH, D., S. BAR-NUN, AND OHAD. I. 1972. Development of photophosphorylationand proton pump activities in greening Chlamydomonas reinhardi y- 1 as measured with an
open-ell preparation. Biochim. Biophys. Acta 267: 125-137.38. WILD, A. 1969. The size of the photosynthetic unit and its variability in yellow mutants. In:
H. Metzner, ed., Progress in Photosynthesis Research, Vol. II. H. Laupp, Jr., Tubingen,Germany. pp. 871-876.
267
www.plantphysiol.orgon September 9, 2018 - Published by Downloaded from Copyright © 1976 American Society of Plant Biologists. All rights reserved.