development of northwest louisiana’s travel demand model … model conversion from a...
TRANSCRIPT

Development of Northwest Louisiana’s Travel Demand Model
… Model Conversion from a
Small/Mid-Size MPO Perspective
Florida Model Task Force Meeting – November 12th – 13th / 2003Chris Petro, AICP
Tran. Plan. Mgr. – NW Louisiana Council of Governments

Presentation Outline
What are we modeling – study area backgroundWhere have we been and where are we going …conversion experience
? ? – Answer submitted technical questions part 1
Static model development – TransCAD (Brief)? ? – Answer submitted technical questions part 2
Model demonstration
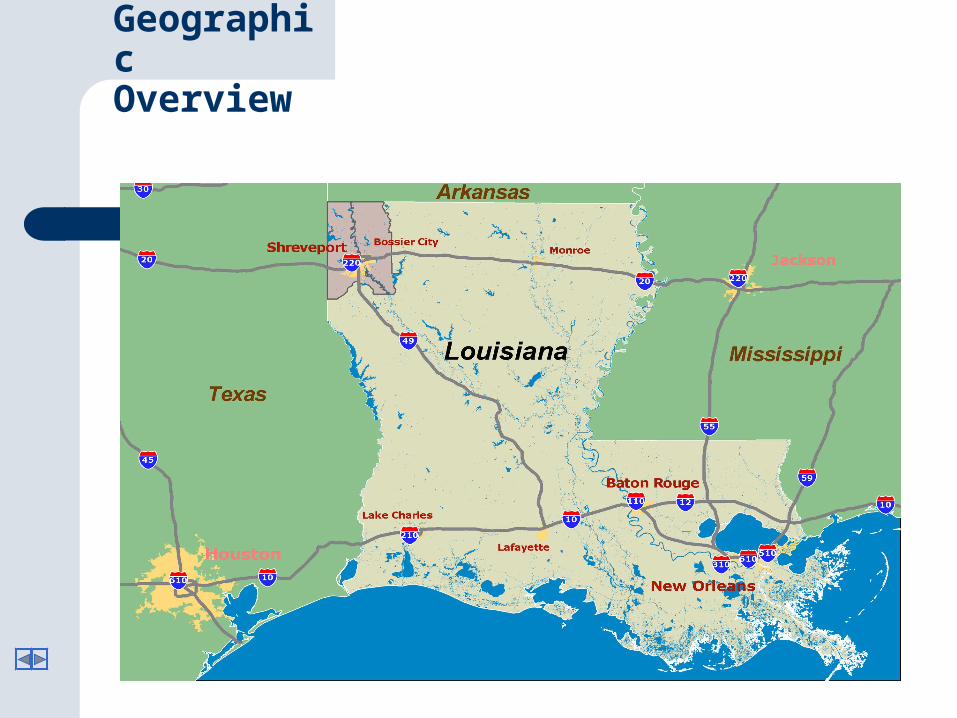
Geographic Overview
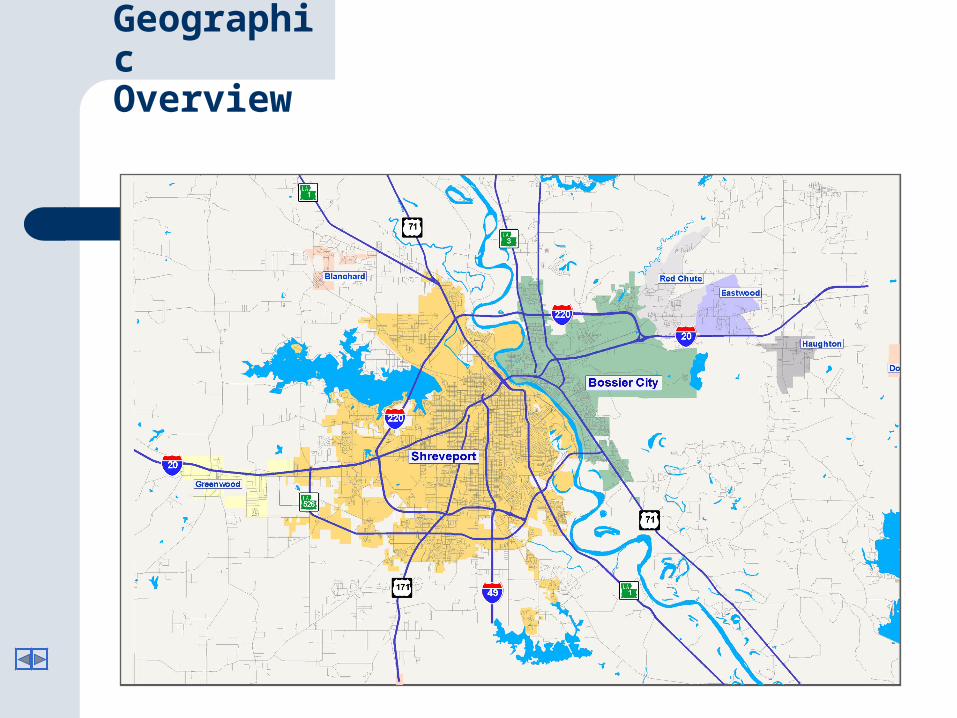
Geographic Overview

Geographic Overview
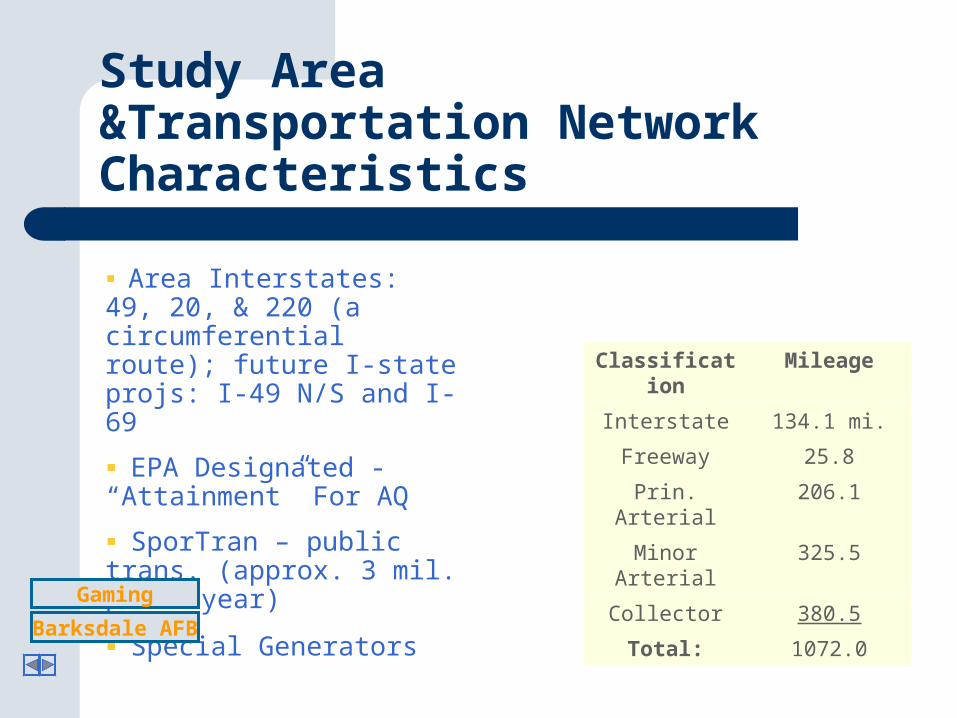
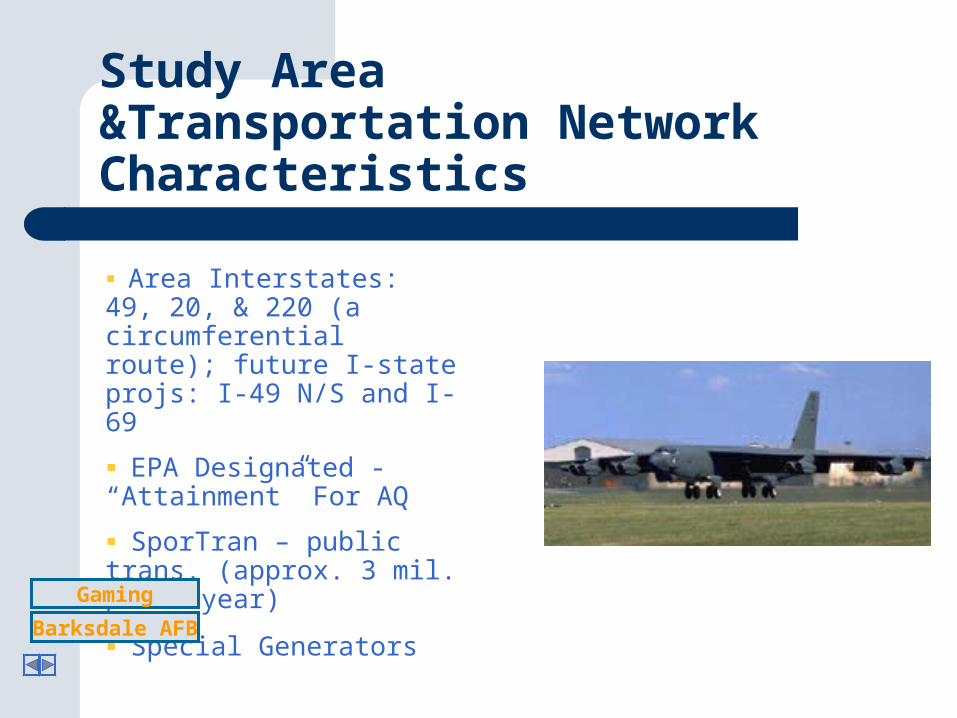
Area Interstates: 49, 20, & 220 (a circumferential route); future I-state projs: I-49 N/S and I-69
EPA Designated - “Attainment” For AQ
SporTran – public trans. (approx. 3 mil. pass./year)
Special Generators
Study Area &Transportation Network Characteristics
Classification Mileage
Interstate 134.1 mi.
Freeway 25.8
Prin. Arterial 206.1
Minor Arterial 325.5
Collector 380.5
Total: 1072.0Gaming
Barksdale AFB
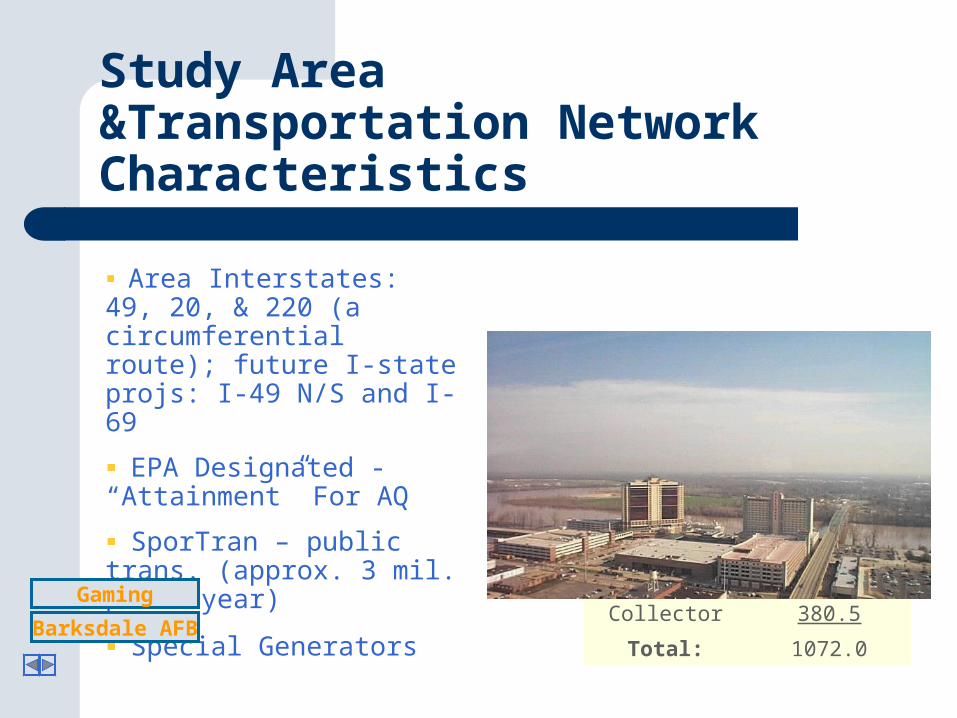
Area Interstates: 49, 20, & 220 (a circumferential route); future I-state projs: I-49 N/S and I-69
EPA Designated - “Attainment” For AQ
SporTran – public trans. (approx. 3 mil. pass./year)
Special Generators
Study Area &Transportation Network Characteristics
Gaming
Barksdale AFB

Model Conversion Experience… Where have we been
1990 Long Range Plan - TRANPLAN based travel demand model200 TAZs – US Census Blk. Group Geography (hardcopy maps)Physical network features were NOT spatially referenced (x-y grid) – were drawn to scale1991 links/TAZs digitized in ATLAS GIS software (1990 TIGER spatial accuracy)
Classification Mileage
IState/Freeway 47.6 mi.
Prin. Arterial 113.1
Minor Arterial 135.5
Collector 399.5
Total: 695.7
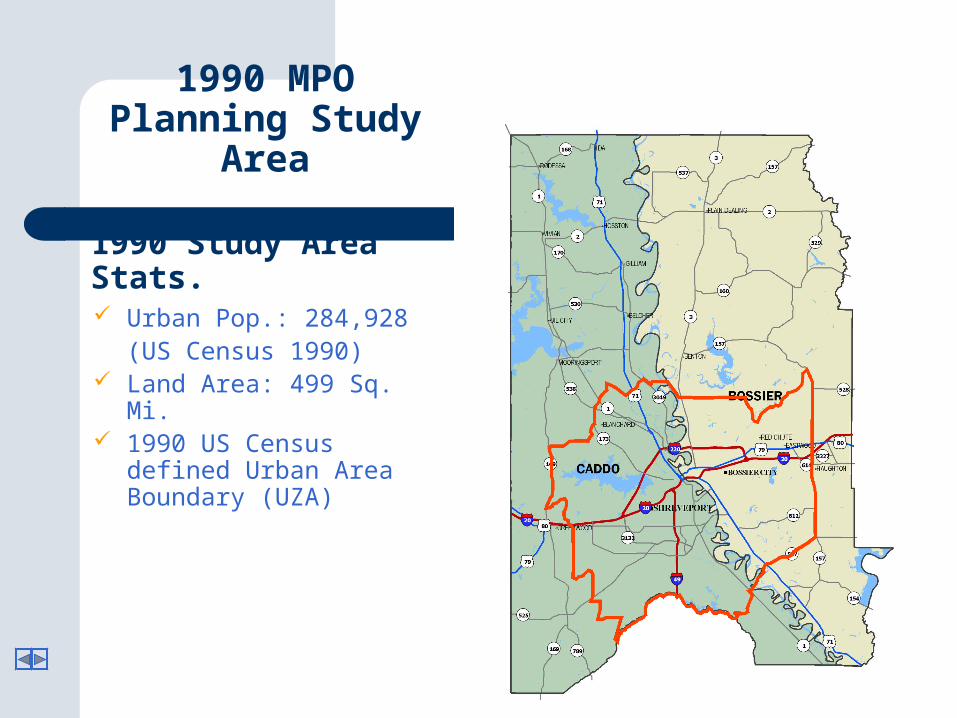
Urban Pop.: 284,928(US Census 1990)
Land Area: 499 Sq. Mi. 1990 US Census defined
Urban Area Boundary (UZA)
1990 MPOPlanning Study Area
1990 Study Area Stats.

Base Year (1990) Socio-Economic Data:1990 US Census (pop. and
housing)Dept. of Labor (employment)
EI and EE trips estimated from multiple regression eq. relating 1989 travel survey data to the 1990 socio-econ. data
Custom Trip Gen model (solve A solve P) “Gravity Model” Equilibrium assignment
technique
TRANPLAN Model Details
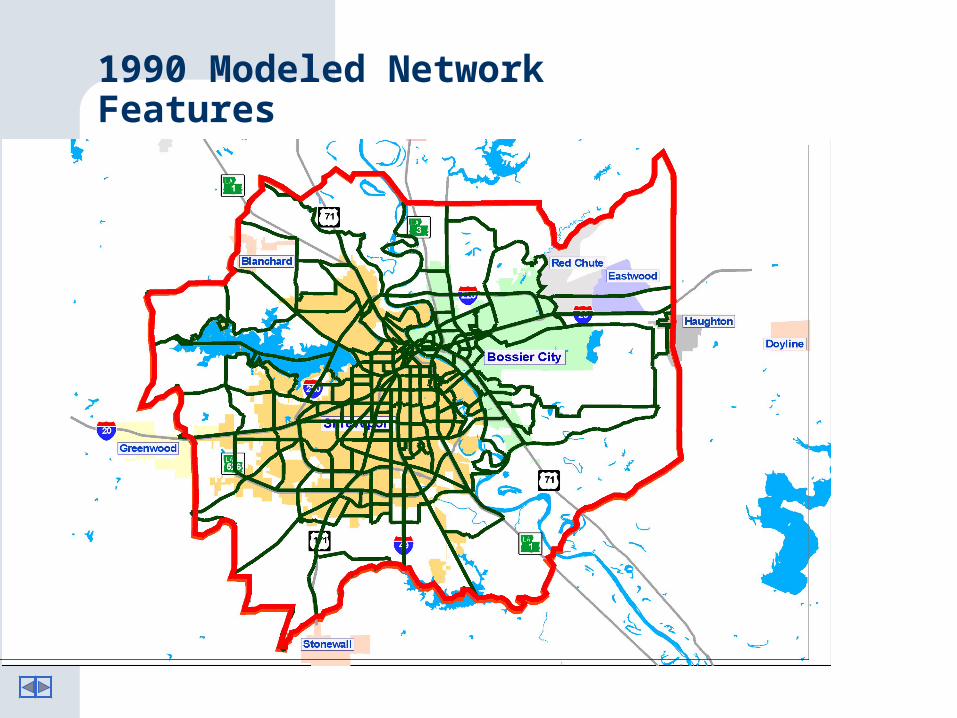
1990 Modeled Network Features

1990 Modeled Network Features

Why Did We Convert? (Internal Justification)
Timing Issues – Long Range Plan Update
TRANPLAN file organization was becoming cumbersome
TransCAD Best At Blending Travel Model Development With GIS (meshed well with our GIS effort)
Conversion and Import/Export Tools
Reasonable “Learning Curve”
Direct Data Access for:
• ESRI Shapefiles• MapInfo TAB files• Oracle Spatial• dBASE/FoxPro/X-base• Text and binary data tables
• Raster files including SPOTView, TIFF, GeoTIFF, Orthophoto, ECW, and MrSID• All ODBC sources (including Access, Btrieve, DB2, INFORMIX, INGRES, Interbase, NetWare, SQLBase, SQL Server, Sybase)
Import/Export Support for:
• ARC/INFO• ArcView• Atlas GIS• AutoCAD DXF• Defense Mapping VPF and ITD• Digital Line Graph
• ETAK MapBase• Excel• Intergraph DGN• MapInfo MIF/MID• Ordnance Survey NTF• TIGER/Line
TransCAD Data Tools

Why Did We Convert? (External Forces)
Louisiana Planning Council (LPC) Through LADOTD Purchased TransCAD For All Urban Area Models (8 MPOs)
LADOTD Initiated Their Long Range Plan – TranCAD Utilized For Their Model Component
Other State DOTs and MPOs Successful Implementation U.S. DOT Endorsement

Salvage Effort (Physical Network)
The 1990 TAZ boundaries were still valid
- Define new TAZs for expanded Study Area
1990 links were scrapped for more geospatially accurate and topologically correct links developed from the Regional GIS centerline features
No 1990 TAZ/External Sta. centroids were salvaged
Bottom line – New link/TAZ features built from existing GIS dataset NOT directly from TRANPLAN
Since we expanded our Study Area… nearly had to start from scratch
Salvage Effort (Network Attributes / Socio-Economic Data)
We associated (tag within distance function) the 1990 link attribute data to the new TransCAD base network, but we utilized the existing1990 link structure that had been already built and referenced in our GIS
Reused the link capacity table (1985 HCM lane capacity by facility type)
Tip: A form of triangulation (3 or more known points) can be used to project unreferenced spatial features – usually through a GIS extension or add-on projection utility
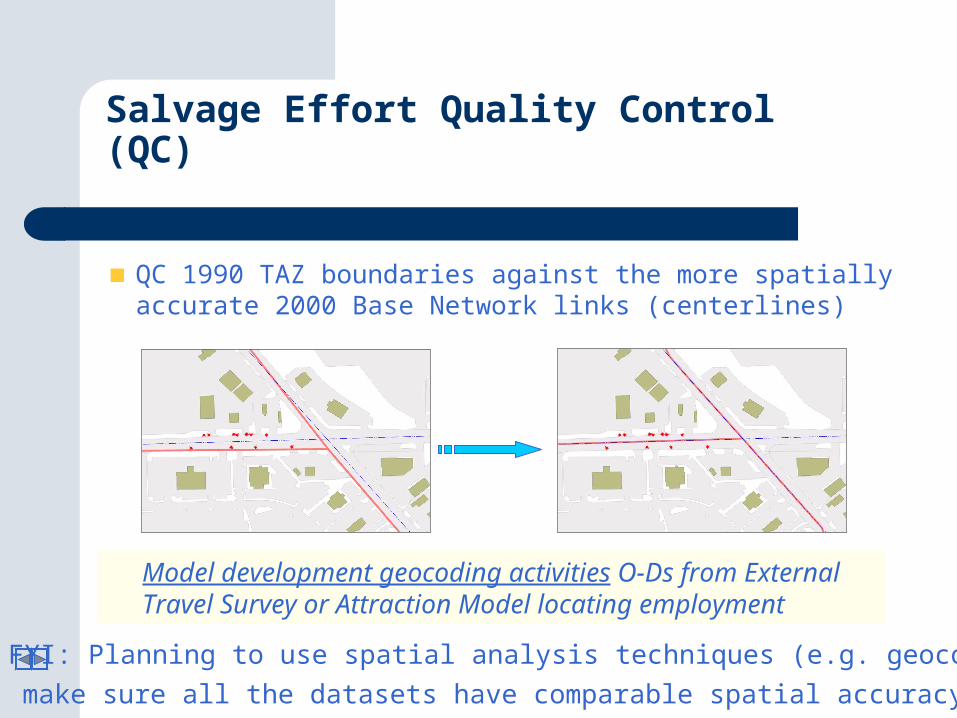
QC 1990 TAZ boundaries against the more spatially accurate 2000 Base Network links (centerlines)
Salvage Effort Quality Control (QC)
Model development geocoding activities O-Ds from External Travel Survey or Attraction Model locating employment
FYI: Planning to use spatial analysis techniques (e.g. geocoding)
make sure all the datasets have comparable spatial accuracy
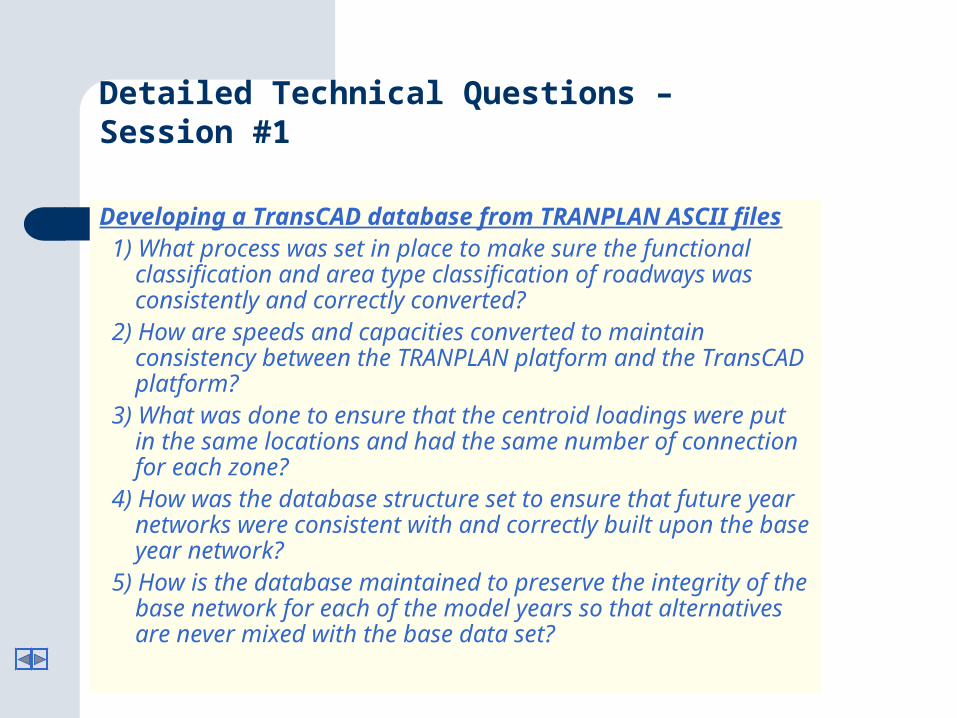
Developing a TransCAD database from TRANPLAN ASCII files 1) What process was set in place to make sure the functional
classification and area type classification of roadways was consistently and correctly converted?
2) How are speeds and capacities converted to maintain consistency between the TRANPLAN platform and the TransCAD platform?
3) What was done to ensure that the centroid loadings were put in the same locations and had the same number of connection for each zone?
4) How was the database structure set to ensure that future year networks were consistent with and correctly built upon the base year network?
5) How is the database maintained to preserve the integrity of the base network for each of the model years so that alternatives are never mixed with the base data set?
Detailed Technical Questions – Session #1
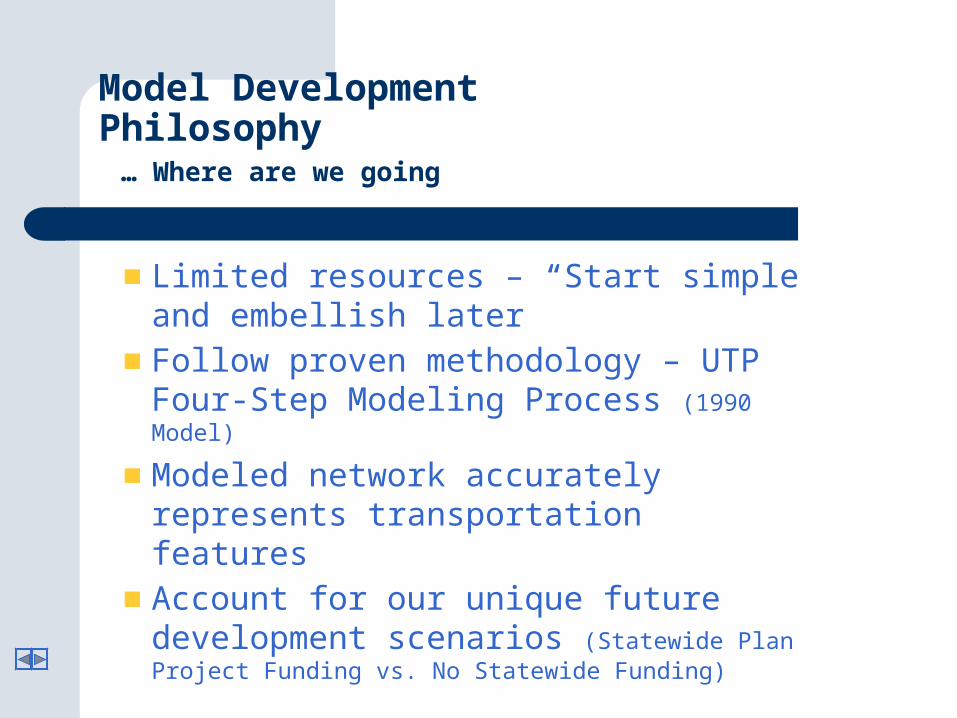
Model Development Philosophy … Where are we going
Limited resources – “Start simple and embellish later”Follow proven methodology – UTP Four-Step Modeling Process (1990 Model)
Modeled network accurately represents transportation featuresAccount for our unique future development scenarios (Statewide Plan Project Funding vs. No Statewide Funding)
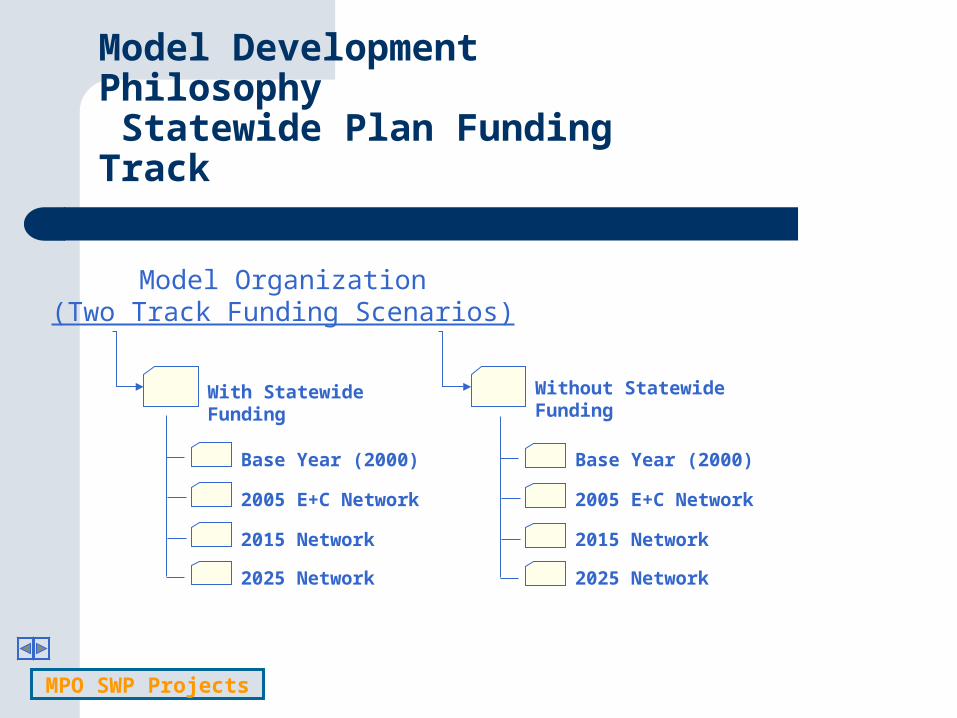
Model Development Philosophy Statewide Plan Funding Track
With Statewide Funding
Model Organization(Two Track Funding Scenarios)
Without Statewide Funding
Base Year (2000)
2005 E+C Network
2015 Network
2025 Network
Base Year (2000)
2005 E+C Network
2015 Network
2025 Network
MPO SWP Projects
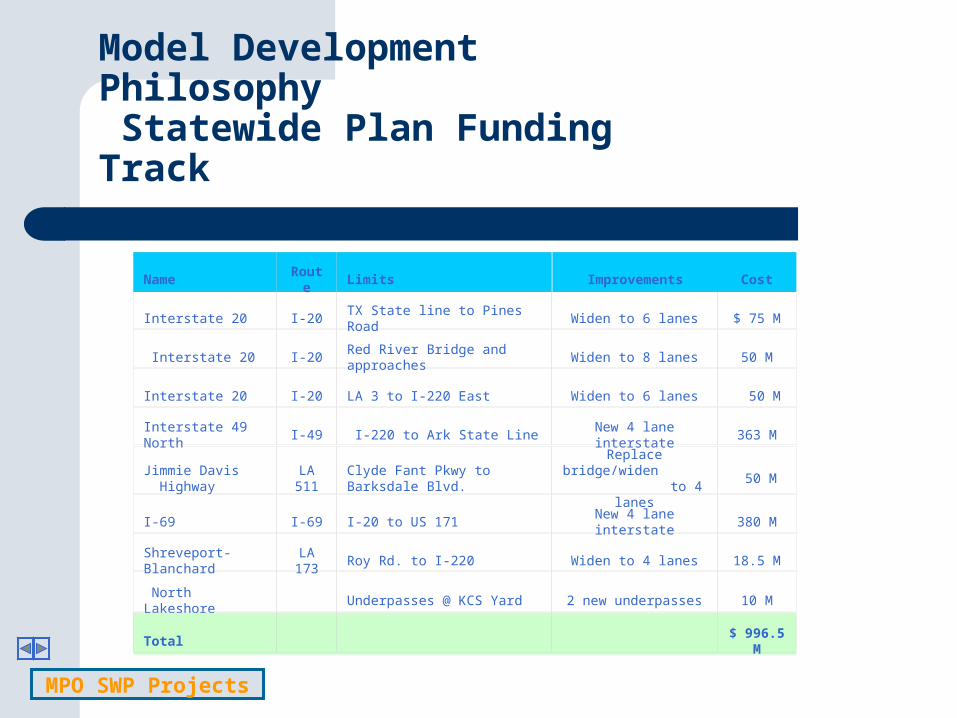
Model Development Philosophy Statewide Plan Funding Track
I-20 Widen to 6 lanes
Improvements
Name Route
Limits Cost
Interstate 20 I-20
TX State line to Pines Road Widen to 6 lanes $ 75 M
Interstate 20 I-20
Red River Bridge and approaches
Widen to 8 lanes
50 M
Interstate 20
LA 3 to I-220 East 50 M
Interstate 49 North I-49 I-220 to Ark State Line New 4 lane interstate 363 M
Jimmie Davis Highway
LA 511
Clyde Fant Pkwy to Barksdale Blvd.
Replace bridge/widen to 4 lanes
50 M
I-69 I-69
I-20 to US 171 New 4 lane interstate 380 M
Shreveport- Blanchard
LA 173
Roy Rd. to I-220 Widen to 4 lanes 18.5 M
North Lakeshore
Underpasses @ KCS Yard 2 new underpasses
10 M
Total
$ 996.5 M
MPO SWP Projects
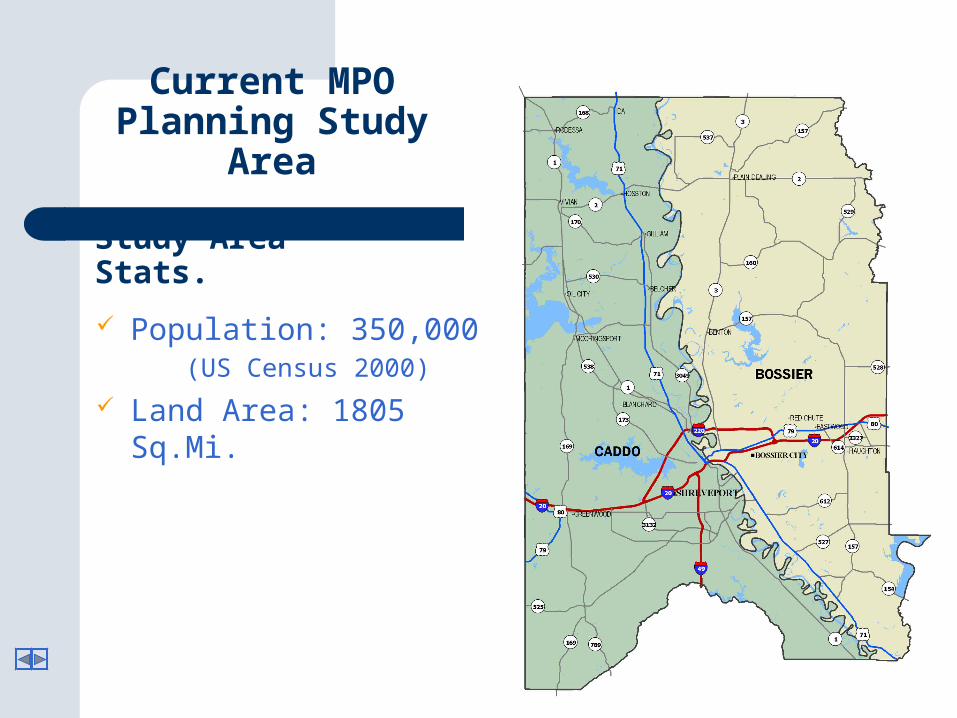
Current MPOPlanning Study Area
Study Area Stats.
Population: 350,000 (US Census 2000)
Land Area: 1805 Sq.Mi.

Zones & Networks
Base Year Data
Future Planning Data
Database
Base Year Future Year
Trip Generation
Estimate Zonal Productions/Attractions
Distribution
Predict Zonal Trip Interchanges
Modal Split
(not applied to this model)
Assignment
Predict Routes Taken between Zones
Evaluation
Base Year Future Year
Valid
ati
on
P
roce
ss
Model Methodology Outline
* Mirrors our 1990 Model Methodology
*
*
*
*

Development: Physical Network
Based Upon Regional GIS Project referenced features imported into TransCAD
Links/Nodes - Topologically Correct (QC link direction and coding)
Expanded 1990 TAZ Structure To 2000 Study Area (TAZUP)
1990 to 2000 Network Comparison
- Additional 376.3 miles
- 36 New TAZs

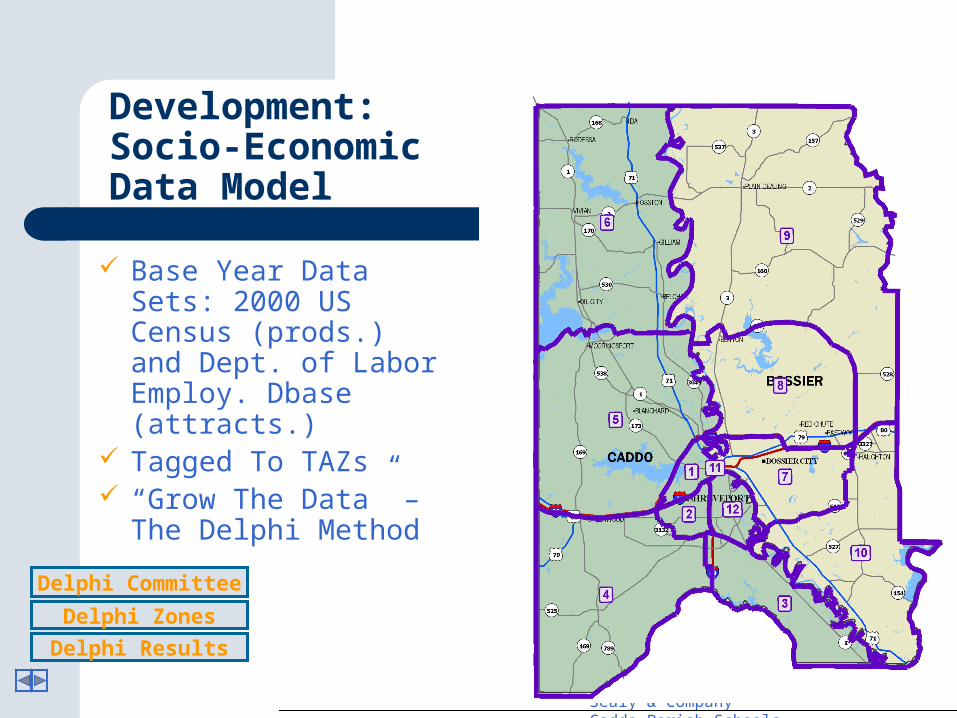
Development: Socio-EconomicData Model
Base Year Data Sets: 2000 US Census (prods.) and Dept. of Labor Employ. Dbase (attracts.)
Tagged To TAZs “Grow The Data” –
The Delphi Method
Delphi RepresentationLADOTDCity of ShreveportCity of Bossier CityShreveport Chamber of CommerceBossier Chamber of CommerceShreveport Metro. Planning CommissionBossier City Metro. Planning CommissionSporTranCommunity Development - Bossier CityCommunity Development - ShreveportCaddo ParishBossier ParishBio Medical Research FoundationLSU Business CenterLSU Department of EconomicsSWEPCOShreveport Bossier PortHibernia BankVintage RealtySealy & CompanyCaddo Parish SchoolsBossier Parish Schools
Delphi Committee
Delphi Zones
Delphi Results

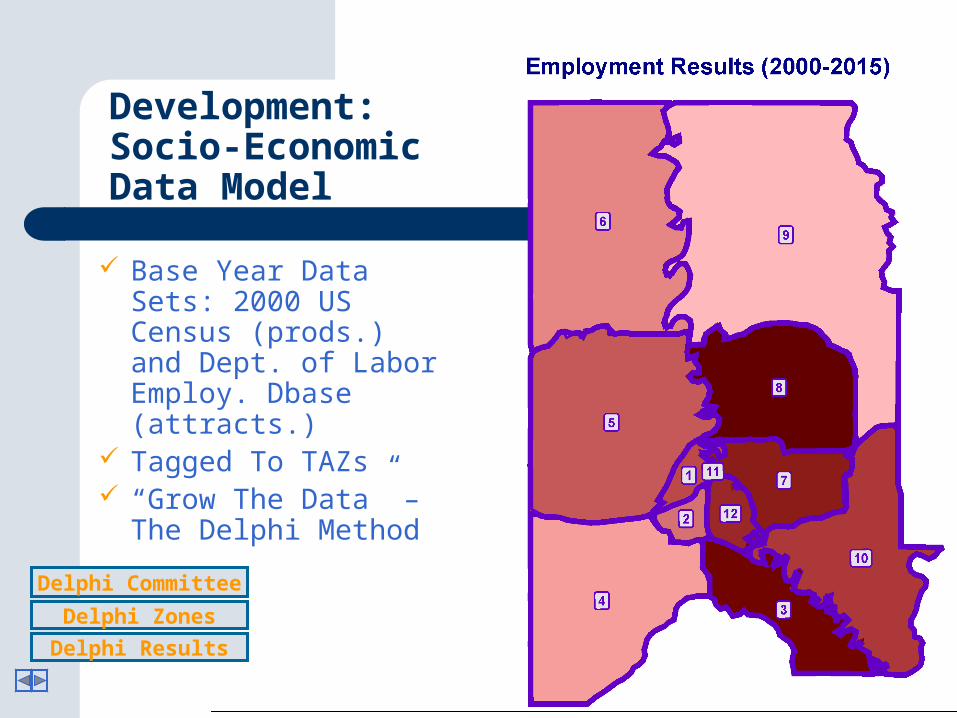
Development: Socio-EconomicData Model
Base Year Data Sets: 2000 US Census (prods.) and Dept. of Labor Employ. Dbase (attracts.)
Tagged To TAZs “Grow The Data” –
The Delphi Method
Delphi Committee
Delphi Zones
Delphi Results
Development: Socio-EconomicData Model
Base Year Data Sets: 2000 US Census (prods.) and Dept. of Labor Employ. Dbase (attracts.)
Tagged To TAZs “Grow The Data” –
The Delphi Method
Delphi Committee
Delphi Zones
Delphi Results

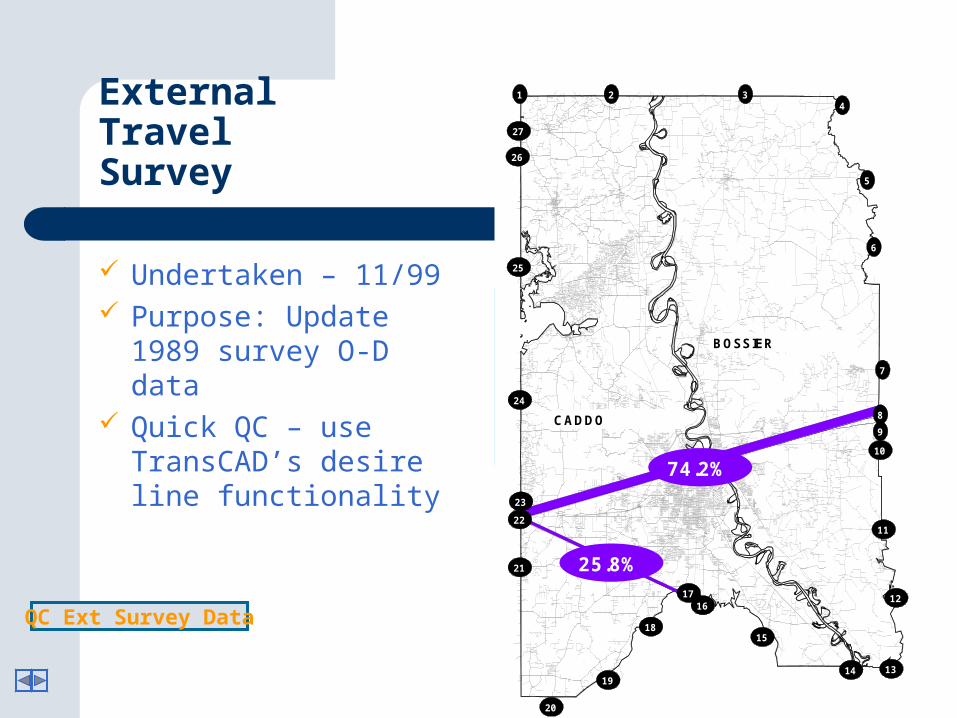
Undertaken – 11/99 Purpose: Update
1989 survey O-D data Quick QC – use
TransCAD’s desire line functionality
Regional Trip O-Ds
External-Internal vehicle trips (EI)
External-External (through veh. trips) (EE)
ExternalTravel Survey
QC Ext Survey Data
Undertaken – 11/99 Purpose: Update
1989 survey O-D data Quick QC – use
TransCAD’s desire line functionality
Regional Trip O-Ds
External-Internal vehicle trips (EI)
External-External (through veh. trips) (EE)
ExternalTravel Survey
$
$
$
$
$
$
$
$
$
$ $
$
$
$
$
$
$
$ $ $
$
$
$
$
$
$
$
CADDO COUNTY
BOSSIER COUNTY
27
26
25
24
23
22
21
20
19
18
1716
15
14 13
12
11
10
9
8
7
6
5
4321
74.2%
25.8%
QC Ext Survey Data
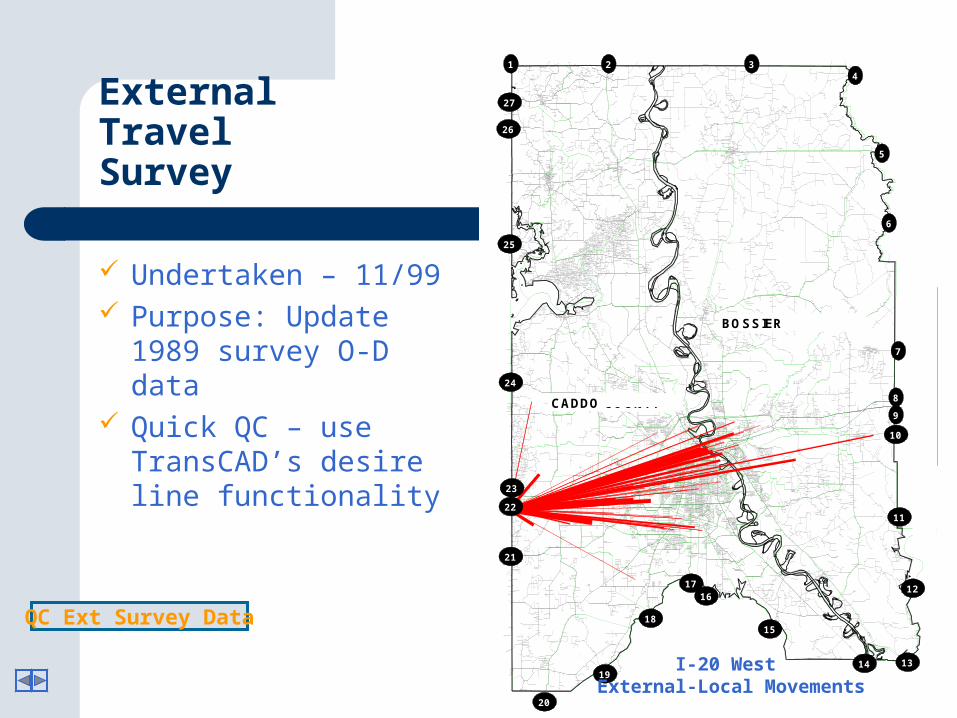
Undertaken – 11/99 Purpose: Update
1989 survey O-D data Quick QC – use
TransCAD’s desire line functionality
Regional Trip O-Ds
External-Internal vehicle trips (EI)
External-External (through veh. trips) (EE)
ExternalTravel Survey
$
$
$
$
$
$
$
$
$
$ $
$
$
$
$
$
$
$ $ $
$
$
$
$
$
$
$
CADDO COUNTY
BOSSIER COUNTY
27
26
25
24
23
22
21
20
19
18
1716
15
14 13
12
11
10
9
8
7
6
5
4321
I-20 West External-Local Movements
QC Ext Survey Data
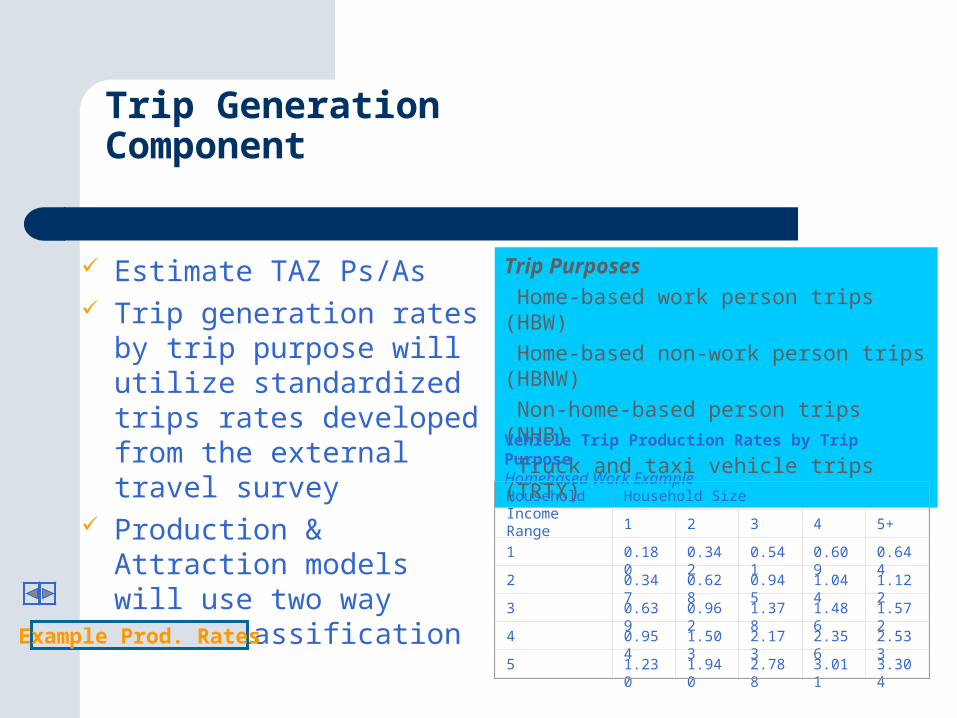
Trip Generation Component
Estimate TAZ Ps/As Trip generation rates by
trip purpose will utilize standardized trips rates developed from the external travel survey
Production & Attraction models will use two way cross-classification
Trip Purposes
Home-based work person trips (HBW)
Home-based non-work person trips (HBNW)
Non-home-based person trips (NHB)
Truck and taxi vehicle trips (TRTX)
Vehicle Trip Production Rates by Trip PurposeHomebased Work Example
Household Income Range
Household Size
1 2 3 4 5+
1 0.180 0.342 0.541 0.609 0.644
2 0.347 0.628 0.945 1.044 1.122
3 0.639 0.962 1.378 1.486 1.572
4 0.954 1.503 2.173 2.356 2.533
5 1.230 1.940 2.788 3.011 3.304
Example Prod. Rates
Trip Distribution Component
Good Ol’ “Gravity Model” Process Factors
– Requires trips from trip generation model
– Requires travel time matrix from defined network
Modal Split Component
Not Applied To Our Model
Transit Trips Account for 0.3% - 0.4%/Year Of Total Trips
Can’t Justify Individual Choice Models (multinomial “Logit”)
Trip Assignment Component
Utilized User Equilibrium Assignment
Process Factors– Requires trip matrices
from trip distribution– Requires a QC’d
network
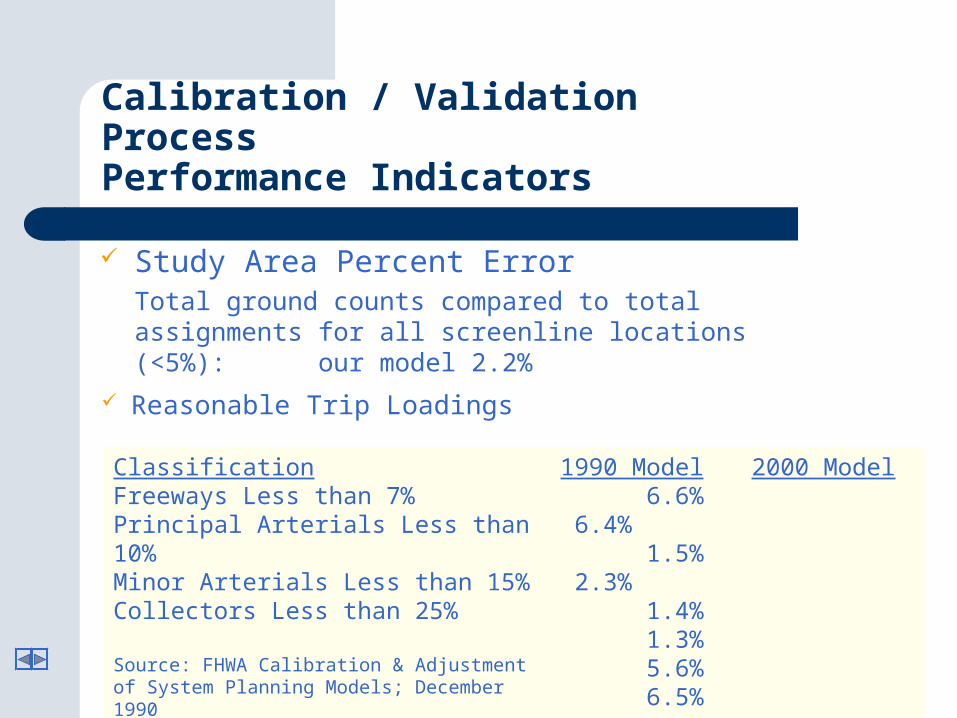
Calibration / Validation ProcessPerformance Indicators
Reasonable Trip Loadings
ClassificationFreeways Less than 7%Principal Arterials Less than 10%Minor Arterials Less than 15%Collectors Less than 25%
Source: FHWA Calibration & Adjustment of System Planning Models; December 1990
Study Area Percent Error Total ground counts compared to total
assignments for all screenline locations (<5%): our model 2.2%
1990 Model 2000 Model 6.6% 6.4% 1.5% 2.3% 1.4% 1.3% 5.6% 6.5%
Source: FHWA Calibration & Adjustment of System Planning Models; December 1990
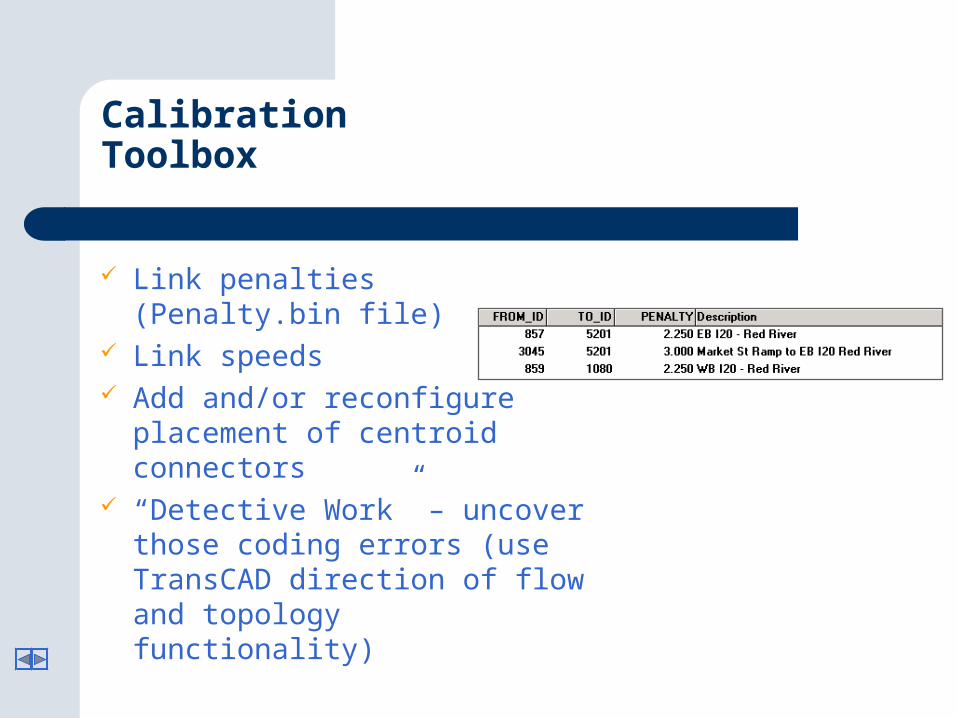
Calibration Toolbox
Link penalties (Penalty.bin file) Link speeds Add and/or reconfigure
placement of centroid connectors
“Detective Work” – uncover those coding errors (use TransCAD direction of flow and topology functionality)
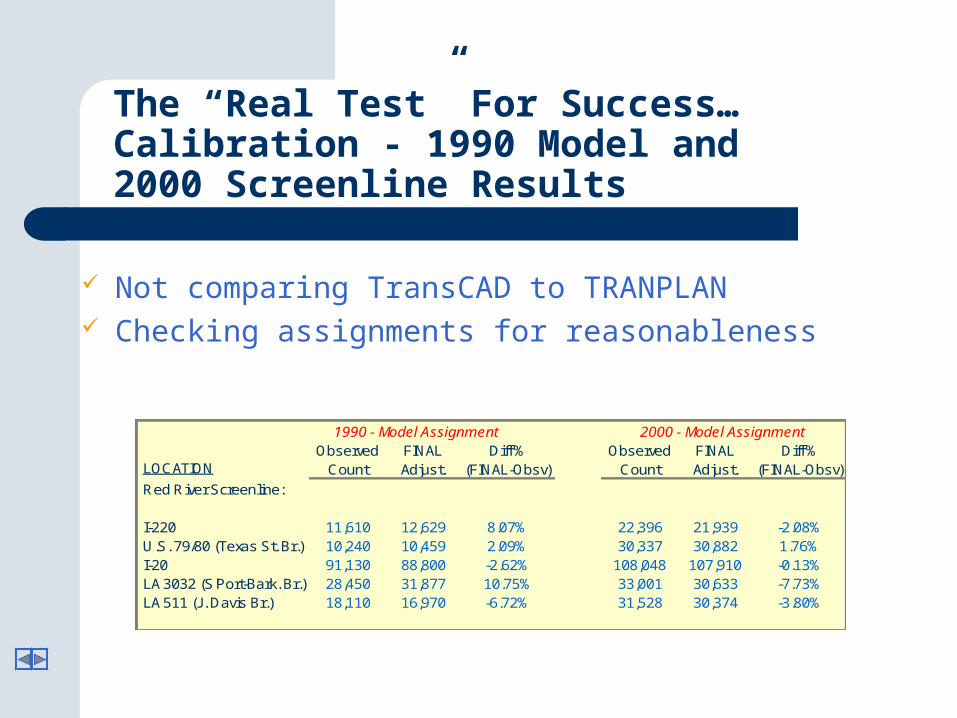
The “Real Test” For Success…Calibration - 1990 Model and 2000 Screenline Results
Not comparing TransCAD to TRANPLAN Checking assignments for reasonableness
1990 - Model Assignment 2000 - Model AssignmentObserved FINAL Diff % Observed FINAL Diff %
LOCATION Count Adjust. (FINAL-Obsv) Count Adjust. (FINAL-Obsv)
Red River Screenline:
I-220 11,610 12,629 8.07% 22,396 21,939 -2.08% U.S. 79/80 (Texas St. Br.) 10,240 10,459 2.09% 30,337 30,882 1.76% I-20 91,130 88,800 -2.62% 108,048 107,910 -0.13% LA 3032 (S'Port-Bark. Br.) 28,450 31,877 10.75% 33,001 30,633 -7.73% LA 511 (J. Davis Br.) 18,110 16,970 -6.72% 31,528 30,374 -3.80%
Performance Measures to Assess Regional Transportation System
–Vehicle miles traveled (VMT)
–Vehicle hours traveled (VHT)
–Average speeds
–Volume to capacity (V/C) ratios
–Screen line analysis
Model Uses in Support of Plan
Model Status
Finalized initial development (operational): 10/2003 Maintained and updated by myself and one other
staff planner Future model development
Conversion Observations Didn’t salvage too much from TRANPLAN – made
QC manageable from a smaller MPO perspective Very positive conversion
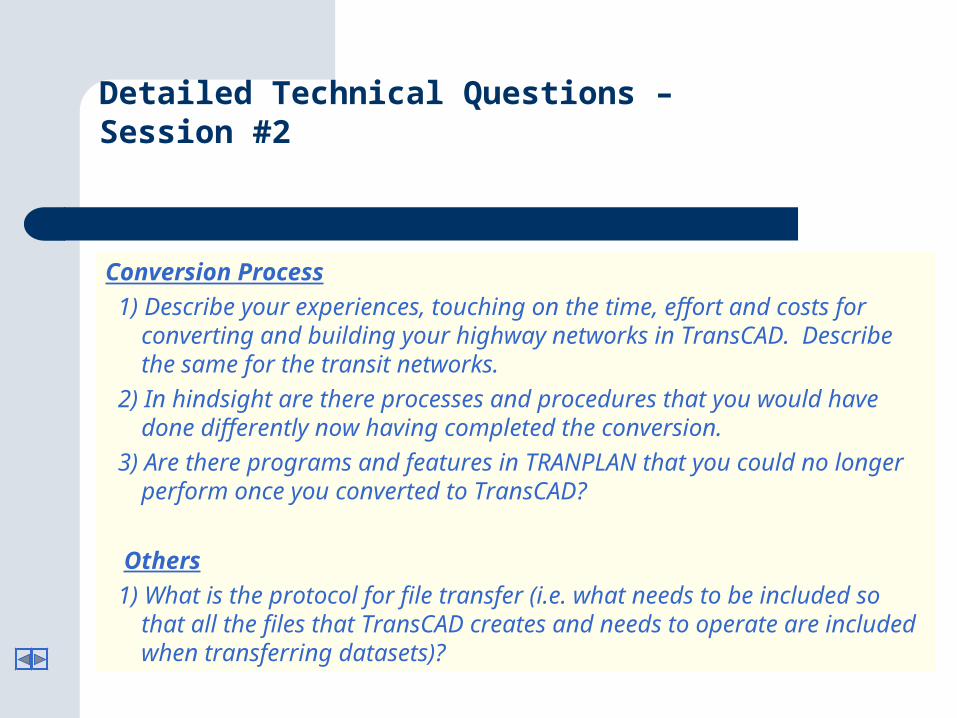
Conversion Process
1) Describe your experiences, touching on the time, effort and costs for converting and building your highway networks in TransCAD. Describe the same for the transit networks.
2) In hindsight are there processes and procedures that you would have done differently now having completed the conversion.
3) Are there programs and features in TRANPLAN that you could no longer perform once you converted to TransCAD?
Others
1) What is the protocol for file transfer (i.e. what needs to be included so that all the files that TransCAD creates and needs to operate are included when transferring datasets)?
Detailed Technical Questions – Session #2