development of multiple big data processing platforms for
TRANSCRIPT

Journal of Information Hiding and Multimedia Signal Processing c©2018 ISSN 2073-4212
Ubiquitous International Volume 9, Number 1, January 2018
Development of Multiple Big Data ProcessingPlatforms for Business Intelligence
Bao-Rong Chang
Department of Computer Science and Information EngineeringNational University of Kaohsiung
700, Kaohsiung University Rd., Nanzih District, Kaohsiung, Taiwan [email protected]
Yo-Ai Wang
Department of Computer Science and Information EngineeringNational University of Kaohsiung
700, Kaohsiung University Rd., Nanzih District, Kaohsiung, Taiwan [email protected]
Received February, 2017; revised October, 2017
Abstract. The crucial problem of the integration of different platforms is how to ad-just the distinct computing features between them with the capability of assigning anappropriate platform to best execute the inquire command. In business intelligence (BI),this paper introduced the integration of RHhadoop and SparkR platforms for the high-performance multiple big data processing platforms to carry out rapid data retrieval anddata analysis with R programming. The goal of this paper is to design the optimizationfor job scheduling as well as to implement the optimized platform selection for highlyimproving the response time of data analysis. Alternatively, we proposed the very simpleand straightforward manner for user to give R commands input instead of Java program-ming or Scala programming to realize the data retrieval or data analysis in the platforms.As a result, although the optimized platform selection can reduce the execution time forthe data retrieval and data analysis significantly, furthermore scheduling optimizationdefinitely increases the system efficiency a lot.Keywords: Big data analytics, Multiple processing platforms, R programming, Opti-mization for job scheduling, Optimized platform selection.
1. Introduction. Big data [1] has been sharply in progress unprecedented in recentyears, and is changing the operation for business as well as the decision–making for theenterprise. The huge amounts of data contain valuable information, such as the growthtrend of system application and the correlation among systems. The undisclosed infor-mation may contain unknown knowledge and application that are discoverable further.However, big data with the features of high volume, high velocity, and high variety aswell as in face of expanding incredible amounts of data, several issues emerging in bigdata such as storage, backup [2], management, processing, search [3], analysis, practicalapplication, and other abilities to deal with the data also face new challenges. Unfor-tunately, those cannot be solved with traditional methods and thus it is worthwhile forus to continue exploring how to extract the valuable information from the huge amountsof data. According to the latest survey reported from American he proCIO magazine,70% of IT operation has done by batch processing in the business, it makes ”Unable
40

Development of Multiple Big Data Processing Platforms for Business Intelligence 41
Figure 1. Data retrieval and data anal-ysis stack.
Figure 2. RHadoopStructure Diagram.
to control processing resources for operation as well as loading” [4] become one of thebiggest challenges for big data application. Through establishing a set of multiple bigdata processing platforms with high efficiency, high availability and high scalability [5],this paper aims to integrate different big data platforms to achieve the compatibility withany existing business intelligence (BI) [6] together with related analysis tools so that theenterprise need not change large amounts of software for such platforms. Therefore, thegoal of this paper is to design the optimization for job scheduling as well as to implementoptimized platform selection, and established platforms support R command to executedata retrieval and data analysis in big data environment. In such a way the upper–leveltools relying on relational database which has stored the original data can run on theintroduced platforms through minor modification or even no modification to gain the ad-vantages of high efficiency, high availability, and high scalability. I/O delay time can beshared through reliable distributed file system to speed-up the reading of a large amountof data. Data retrieval and data analysis stack has layered as shown in Fig. 1.
2. Related Work in Big Data Processing. This paper has introduced data retrievaland data analysis using R programming in conjunction with RHadoop [7]/Hadoop [8] andSparkR [9] /Spark [10] platforms to build a multiple-platform big data analysis system.Furthermore, the use of distributed file system for fast data analysis and data storageto reduce the execution time of processing a huge amount of data. First let aim tounderstand the fundamental knowledge of Hadoop and Spark platforms, and then buildtheir extended systems RHadoop and SparkR for the purpose of fitting all kinds of relativeproblems on big data analytics. This section will introduce their related profiles and keytechnologies for both platforms accordingly.
2.1. Integrated Development Environment for R. Over the past decade, academicsand industry have lifted the limits of the R programming language, becoming one of themost important tools for computing statistics, visualization, and data science. Millionsof statisticians and data scientists use R to solve problems from counting biology toquantitative marketing. R has become the most popular language for the analysis ofscientific data and finance. R is a free software as a programming language and partof the open source, not only free and compact to run on multiple platforms, but alsointegrates analysis and graph plotting functions in one. Though it can install packagesto enhance many functions, which is even similarly comparable to the functionality of
42 B.R. Chang, and Y.A. Wang
Figure 3. SparkRStructure Diagram.
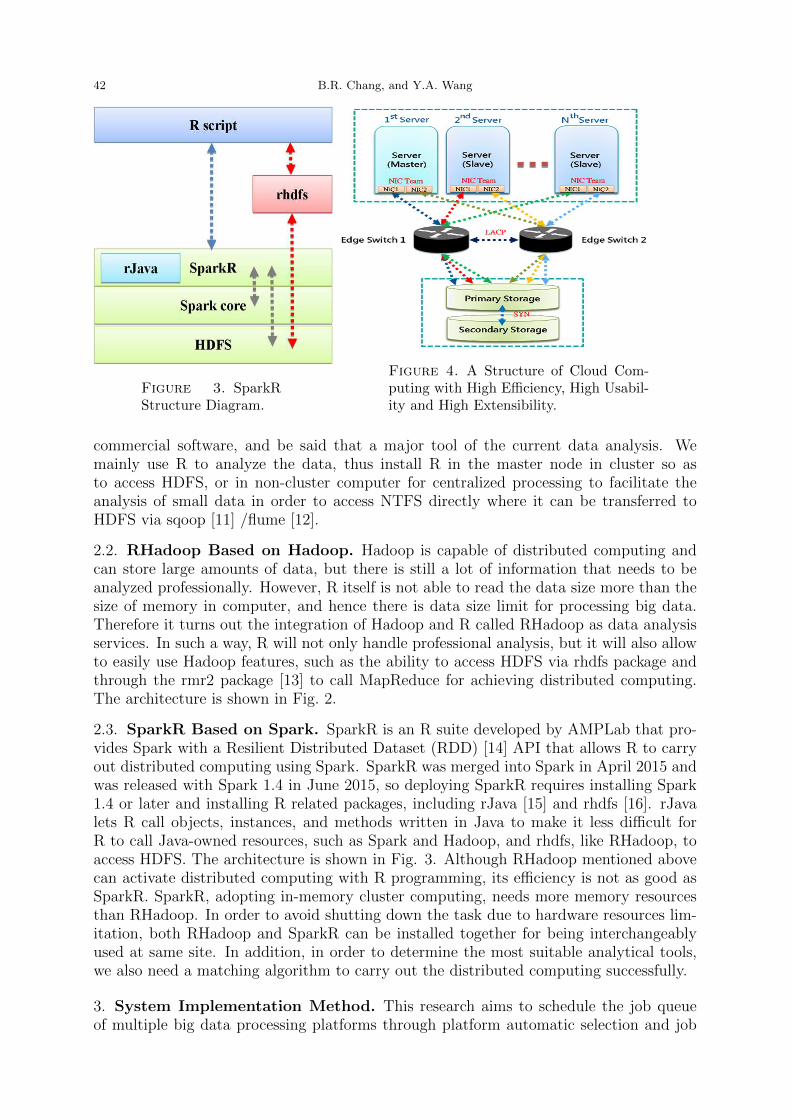
Figure 4. A Structure of Cloud Com-puting with High Efficiency, High Usabil-ity and High Extensibility.
commercial software, and be said that a major tool of the current data analysis. Wemainly use R to analyze the data, thus install R in the master node in cluster so asto access HDFS, or in non-cluster computer for centralized processing to facilitate theanalysis of small data in order to access NTFS directly where it can be transferred toHDFS via sqoop [11] /flume [12].
2.2. RHadoop Based on Hadoop. Hadoop is capable of distributed computing andcan store large amounts of data, but there is still a lot of information that needs to beanalyzed professionally. However, R itself is not able to read the data size more than thesize of memory in computer, and hence there is data size limit for processing big data.Therefore it turns out the integration of Hadoop and R called RHadoop as data analysisservices. In such a way, R will not only handle professional analysis, but it will also allowto easily use Hadoop features, such as the ability to access HDFS via rhdfs package andthrough the rmr2 package [13] to call MapReduce for achieving distributed computing.The architecture is shown in Fig. 2.
2.3. SparkR Based on Spark. SparkR is an R suite developed by AMPLab that pro-vides Spark with a Resilient Distributed Dataset (RDD) [14] API that allows R to carryout distributed computing using Spark. SparkR was merged into Spark in April 2015 andwas released with Spark 1.4 in June 2015, so deploying SparkR requires installing Spark1.4 or later and installing R related packages, including rJava [15] and rhdfs [16]. rJavalets R call objects, instances, and methods written in Java to make it less difficult forR to call Java-owned resources, such as Spark and Hadoop, and rhdfs, like RHadoop, toaccess HDFS. The architecture is shown in Fig. 3. Although RHadoop mentioned abovecan activate distributed computing with R programming, its efficiency is not as good asSparkR. SparkR, adopting in-memory cluster computing, needs more memory resourcesthan RHadoop. In order to avoid shutting down the task due to hardware resources lim-itation, both RHadoop and SparkR can be installed together for being interchangeablyused at same site. In addition, in order to determine the most suitable analytical tools,we also need a matching algorithm to carry out the distributed computing successfully.
3. System Implementation Method. This research aims to schedule the job queueof multiple big data processing platforms through platform automatic selection and job

Development of Multiple Big Data Processing Platforms for Business Intelligence 43
scheduling so as to yield the optimal results. First, build from hardware and virtualizationfoundation, as virtual machine has the feature of hardware resource flexible control, thusit is quite suitable for the experimental data exploration in next section.
3.1. Deploy Virtual Server Environment. Fig. 4 shows the cloud computing envi-ronment [17] built for this program. It is built with machine cabinet clustering structure.Open source management software Proxmox Virtual Environment (PVE) [18] based onKVM is used to implement virtualization server, the state of hardware clustering can beeffectively monitored through virtualization management software, and the resource con-figuration of each virtual machine can be dynamically adjusted [19]. As the performanceof big data analysis platform is closely related with the performance of I/O device, theaccess efficiency of hard disk and network should be ascended in hardware configuration.
3.2. Recipe of Multiple Big Data Platforms. Several packages will be integratedto establish multiple big data platforms in this paper and all of them are open sourcesoftware, which are developed and maintained by different open source communities.Lots of software have complex dependency and compatibility problems. The recipe ofpackages which are fully compatible for stable execution is listed in Table I.
Table I. Stability and Compatibility Version of Each Package
Software Version
Hadoop (including RHadoop) 2.6.0Spark (including SparkR) 1.4.0
R 3.2.2Oracle Java(JDK) 8u66
Scala 2.10.4rJava 0.9.7rhdfs 1.0.8rmr2 3.3.1
3.3. Optimized Platform Selection. The automatic selection platform program as-signs to appropriate big data processing platform according with the available capacityand the size of working data amount of memory cache. The function and property forboth RHadoop and SparkR are identical because they can access the same HDFS andsupport R syntax. Although these two packages are the same function, they are differentin the demand environment and executive manner. The memory size of 20G for eachserver in the experiments is given, and it sets the remaining amount of memory size 0.6Gin cluster as Level 1 (L1) and 15G Level 2 (L2) as the cut-off points. In Fig. 5, theprogram automatically chooses nothing to carry on the task as the remaining amount ofmemory size is less than Level 1, RHadoop is applied as the remaining amount of memorysize lies between Level 1 and Level 2, and SparkR is employed as the remaining amountof memory size is higher than Level 2.
3.4. Optimization for Job Scheduling. Heterogeneous Earliest Finish Time (HEFT) [20]is an exploratory scheduling algorithm, which is used for scheduling the communicationtime of previous set of dependent task of heterogeneous network. HEFT is based on oneof list scheduling algorithms, as their characteristics are to establish a priority list in thefirst step. According to the sorted priority list, HEFT assigns each task to suitable CPUto make the task completed as soon as possible. The pseudo code of HEFT algorithm is

44 B.R. Chang, and Y.A. Wang
Figure 5. Automatic Selection of Suitable Platform.
as shown in Fig. 6. HEFT tries to search for local optimization and eventually makes thewhole optimal. In the test of platform automatic selection, the total of 20 GB memoryis configured, and it is found that these two platforms can be used when the remainingamount of memory is greater than or equal to Level 1; in addition, it is better to useRHadoop in case of being less than Level 2, and SparkR shall be used in case of beinggreater than Level 2. HEFT algorithm is modified to Memory-Sensitive HeterogeneousEarliest Finish Time (MSHEFT), priority is considered first, then work size is consideredas the second filter condition, and finally an extra factor is considered, which is ”Remain-ing Amount of Memory”. Pseudo code of MSHEFT algorithm is as shown in Fig. 7. DataRetrieval Flow Chart is as shown in Fig. 8.
Figure 6. The HEFT algorithm.
Figure 7. The MSHEFT algorithm.

Development of Multiple Big Data Processing Platforms for Business Intelligence 45
Figure 8. Data Retrieval Flow Chart with MSHEFT Algorithm and PlatformSelector.
3.5. Program Structure and Execution Process. The experimental procedure isshown in Fig. 9. The process is to view the status of each node in the server throughthe user interface and MSHEFT algorithm to determine the most appropriate analysisplatform according to the current situation. When the analysis task has finished, theresult will be stored back to HDFS and the whole process will be ended.
Figure 9. Program Execution Flow Chart.
4. Experimental Results and Discussion. This section divides data into two cate-gories for test, the first case (Case 1) is the test data produced randomly with the useof Java program, the second case (Case 2) is the actual data captured from the Internet.Proxmox VE can be used to dynamically adjust the characteristics of resources to set ex-perimental environment for different memory remaining amounts, as is shown in Table II,so as to implement effect tests in view of various platforms.
4.1. Generated Test Data and Design of Experimental Environment. Case 1tests each platform to perform different sizes of test data and R commands with differentcomplexity and set priorities to compare the execution time in face of various environmentss is shown in Table II. R command for test is as shown in Table III. The test platform

46 B.R. Chang, and Y.A. Wang
Table II. Test Environment
Environment Description
Test Environment I Adjust 10GB memory space and give it to virtual machineexecuting big data processing
Test Environment II Configure 20G memory space of virtual machine executing bigdata processing
Table III. Test SQL Command
Command Description
R Command I Only search special fieldR Command II Only search special field, and add comparison conditionsR Command III Search special field, add comparison conditions , and execute the
commands with while or for.
Table IV. Test Platform
Platform Description
RHadoop andSparkR
Use command of enforced R to execute such platform, and theninput Rcommand
PlatformSelection
Directly input R command
JobScheduling
Use command of set to set working quantity, and then input Rcommand
is as shown in Table IV. The test data is generated randomly from Java program, ithas four fields, the first column is the name of the only key string, the second column israndom integer between 0 99, the third column is random integer between 100 199 andthe fourth column is the integer sequence with generated sequence. Test data is as shownin Table V.
Table V. Designated the Size and Priority of Test Data Set
Sequence Priority Data Size Codenamed
1 1 850G A2 3 30G B3 1 400G C4 2 10G D5 5 500G E6 3 630G F7 2 1T G8 4 20G H9 5 100G I10 1 700G J

Development of Multiple Big Data Processing Platforms for Business Intelligence 47
Table VI. Executable Job List in Case 1
PPPPPPPPPPlatformJob
#1 #2 #3 #4 #5 #6 #7 #8 #9 #10
RHadoop, SparkR A B C D E F G H I JPlatform Selection A B C D E F G H I JJob Scheduling C J A D G B F H I E
4.2. Experimental Results in Case 1. As listed below they are the results out oftwo platforms among several test data sets with different priorities, data scales and Rcommands performed in the different conditions. Job Scheduling has been implemented inthe different order of jobs as comparing to the other methods. Comparisons of performanceare shown in Figs. 10, 11, 12, 13, 14, and 15. The average execution time of Job Schedulingis faster than the other methods.4.2.1 Experimental Environment I.
Figure10. Execu-tion Time of RCommand I inCase 1.
Figure11. Execu-tion Time of RCommand II inCase 1.
Figure12. Execu-tion Time of RCommand IIIin Case 1.
4.2.2 Experimental Environment II.
Figure13. Execu-tion Time of RCommand I inCase 1.
Figure14. Execu-tion Time of RCommand II inCase 1.
Figure15. Execu-tion Time of RCommand IIIin Case 1.

48 B.R. Chang, and Y.A. Wang
Figure 16. Execution Time ofExperimental Environment I inCase 2.
Figure 17. Execution Time ofExperimental Environment II inCase 2.
4.3. Data Collection and Design of Experimental Environment. Case 2 shows theactual test data as is shown in Table VI. The corresponding R commands are input tomeasure the average execution time according to the data subject. The test environmentis as shown in Table II. The test platform is as shown in Table III.
Table VII. Designated the Size and Priority of Real Data Set
Sequence Priority Data Size Data Theme Codenamed
1 4 10G World-famous masterpiece WC2 1 250G Load of production machine:Overlaoding OD3 2 250G Load of production machine:Underloading UD4 3 1T Qualified rate of semi-conductor products YR5 1 750G Correlation among temperature and TE
Correlation among temperature and6 4 750G Correlation among rainfall and people’s RE
power utilization7 1 100G Flight information in the airport AP8 5 500G Traffic violation/accidents TA
Table VIII. Executable Job List in Case 2
PPPPPPPPPPlatformJob
#1 #2 #3 #4 #5 #6 #7 #8
RHadoop, SparkR WC OD UD YR TE RE AP TAPlatform Selection WC OD UD YR TE RE AP TAJob Scheduling AP OD TE UD YR WC RE TA
4.4. Experimental Results in Case. Executable job list in Case 2 is shown in Ta-ble VII. Comparisons of performance are shown in Figs. 16 and 17. The experimentalresults show that the average execution time of Job Scheduling can be lower than theother methods under three different conditions.

Development of Multiple Big Data Processing Platforms for Business Intelligence 49
5. Conclusion. This paper found that even the analysis platforms with the same con-figuration and functions still have great performance difference in different experimentalconditions through the establishment of scheduling optimization of multiple big data pro-cessing platforms. The time can be greatly saved by making scheduling optimization ofwork instructions, automatically detecting clustering state and finally choosing the bestplatform for information retrieval. According to the experiments in Case 1 and Case 2,it found that when the remaining amount of memory size is less and the scale of dataset is larger, which much more highlights the importance of scheduling optimization andplatform automatic selection. In addition to the job scheduling and optimal platformselection designed in this research, this system is capable of high scalability, in case of theneed to add new analysis platform and what we need to do is just to add new big dataanalysis tools with R shell to system, without any further other changes.
Acknowledgment. This work is fully supported by the Ministry of Science and Technol-ogy, Taiwan, Republic of China, under grant number MOST 105–2221–E–390–013–MY3and MOST 105-2622-E-390-007-CC3.
REFERENCES
[1] H. C. Chen, R. H. L. Chiang, and V. C. Storey, Business Intelligence and Analytics: From Big Datato Big Impact, MIS Quarterly, vol.36, no.4, pp.1165–1188, 2012.
[2] B. R. Chang, H. F. Tsai, and C. L. Guo, High Performance Remote Cloud Data Center Backupusing NoSQL Database, Journal of Information Hiding and Multimedia Signal Processing, vol.7,no.5, pp.993–1005, 2016.
[3] B. R. Chang, H. F. Tsai, and H. T. Hsu, Secondary Index to Big Data NoSQL Database – Incorpo-rating Solr to HBase Approach, Journal of Information Hiding and Multimedia Signal Processing,vol.7, no. 1, pp.80–89, 2016.
[4] C. D. Wickens, Processing Resources in Attention Dual Task Performance and Workload Assessment,Office of Naval Research Engineering Psychology Program, no.N–000–14–79–C–065, 1981.
[5] B. R. Chang, H. F. Tsai, Y. C. Tsai, and C. F, Kuo, Integration and Optimization of Multiple BigData Processing Platforms, Engineering Computations, vol.33, iss.6, pp.1680–1704, Sept. 2016.
[6] S. Chaudhuri, U. Dayal, and V. Narasayya, An Overview of Business Intelligence Technology, Com-munications of the ACM, vol.54, iss. 8, pp.88–98, 2011.
[7] D. Harish, M. S. Anusha, and K. V. Daya Sagar, Big Data Analysis Using RHadoop, InternationalJournal of Innovative Research in Advanced Engineering, vol.2, iss.4, pp.180–185, 2015.
[8] M. Adnan, M. Afzal, M. Aslam, R. Jan, and A. M. Martinez–Enriquez, Minimizing Big Data Prob-lems Using Cloud Computing Based on Hadoop Architecture, IEEE 2014 11th Annual High–capacityOptical Networks and Emerging/Enabling Technologies, pp.99–103, 2014.
[9] X. Yang, S. Liu, K. Feng, S. Zhou, and X. H. Sun, Visualization and Adaptive Subsetting of EarthScience Data in HDFS: A Novel Data Analysis Strategy with Hadoop and Spark, 2016 IEEE In-ternational Conferences on Big Data and Cloud Computing, Social Computing and Networking,Sustainable Computing and Communications, pp.89–96, 2016.
[10] Apache Spark, https://spark.apache.org/ available in February, 2017.[11] M. S. Aravinth, M. S. Shanmugapriyaa, M. S. Sowmya, and M. E. Arun, An Efficient Hadoop Frame-
works Sqoop and Ambari for Big Data Processing, International Journal for Innovative Research inScience and Technology, vol.1, no.10, pp.252–255, 2015.
[12] S. Hoffman, Apache Flume: Distributed Log Collection for Hadoop, Packt Publishing Ltd, Maha-rashtra, India, 2013.
[13] A. Gahlawat, Big Data Analysis using R and Hadoop, International Journal of ComputationalEngineering and Management, vol.1, no.17, pp.9–14, 2013.
[14] M. Zaharia, M. Chowdhury, T. Das, A. Dave, J. Ma, M. Mccauley, and I. Stoica, Fast and InteractiveAnalytics over Hadoop Data with Spark, USENIX Login, vol.37, no.4, pp.45–51, 2012.
[15] S. Urbanek, M. S. Urbanek, and S. J. JDK, Package ’rJava’, 2016. http://www.rforge.net/rJava/available in February, 2017.
[16] S. Salian and D. G. Harisekaran, Big Data Analytics Predicting Risk of Readmissions of DiabeticPatients, International Journal of Science and Research, vol.4, no.4, pp.534–538, 2015.

50 B.R. Chang, and Y.A. Wang
[17] B. R. Chang, H. F. Tsai, and C. M. Chen, Empirical Analysis of Cloud–Mobile Computing BasedVVoIP with Intelligent Adaptation, Journal of Internet Technology, vol.17, no.5, pp.993–1002, Oct.2016.
[18] Proxmox Virtual Environment, https://p.ve.proxmox.com/ available in February, 2017.[19] B. R. Chang, H. F. Tsai, and Y. C. Tsai, High–Performed Virtualization Services for In-Cloud Enter-
prise Resource Planning System, Journal of Information Hiding and Multimedia Signal Processing,vol.5, no.4, pp.614–624, 2014.
[20] H. Topcuoglu, S. Hariri, and M. Y. Wu, Performance–effective and Low–complexity Task Schedulingfor Heterogeneous Computing, IEEE Transactions on Parallel and Distributed Systems, vol.13, no.3,pp.260–274, 2002.