development of mixed- salt technology for co … library/events/2015...energy and environment center...
TRANSCRIPT

Energy and Environment Center
Session: Post-Combustion Solvent-Based Capture
Development of Mixed-Salt Technology for CO2 Capture from Coal Power Plants
June 23-June 26, 2015 • Sheraton Station Square• Pittsburgh, Pennsylvania
Indira S. Jayaweera
Sr. Staff Scientist and CO2 Program Leader
SRI International

Technology Background
Energy and Environment Center
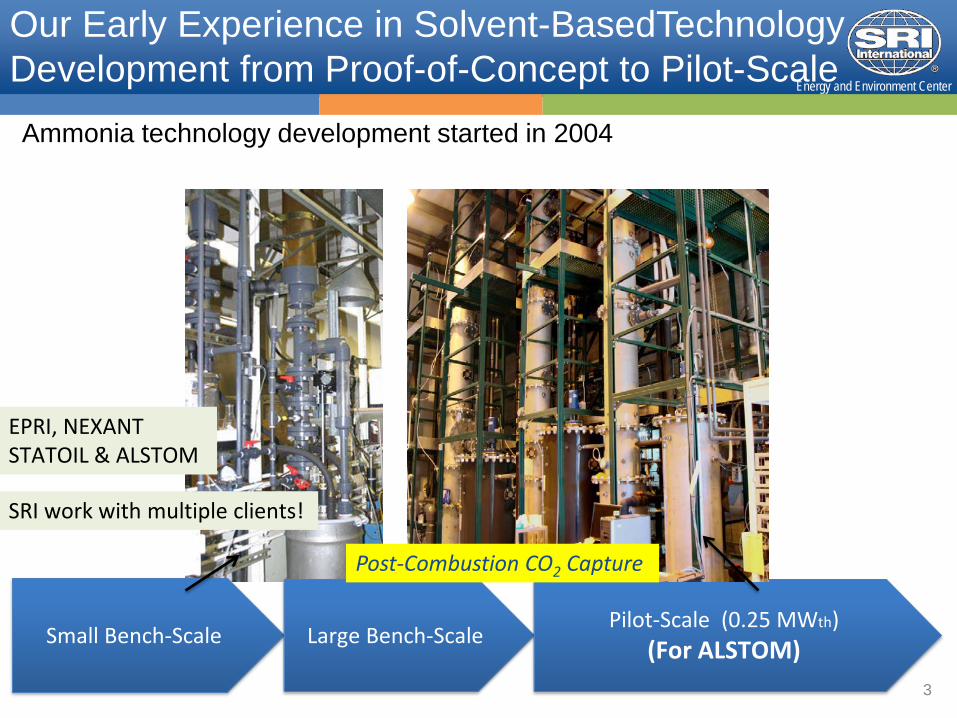
Our Early Experience in Solvent-BasedTechnologyDevelopment from Proof-of-Concept to Pilot-Scale
33
Small Bench-Scale Large Bench-ScalePilot-Scale (0.25 MWth)
(For ALSTOM)
EPRI, NEXANT STATOIL & ALSTOM
SRI work with multiple clients!
Post-Combustion CO2 Capture
Ammonia technology development started in 2004

Energy and Environment Center
Mixed-Salt Process Details
4
How it works:Selected composition of potassium carbonate and ammonium salts
• Overall heat of reaction 35 to 60 kJ/mol (tunable)Absorber operation at 20 - 40o C at 1 atm with 30-40 wt.% mixture of saltsRegenerator operation at 70 - 180o C at 10-20 atm
• Produce high-pressure CO2 stream
High CO2 cycling capacity No Solids
Key benefits:- Reduced ammonia emissions- Enhanced efficiency- Reduced reboiler duty - Reduced CO2 compression energy
A SIGNIFICANT PARASITIC POWER REDUCTION COMPARED TO MEA !
K2CO3–NH3–xCO2–H2O system K2CO3 –NH3–yCO2–H2O systemCO2 Lean CO2 Rich
Energy and Environment Center
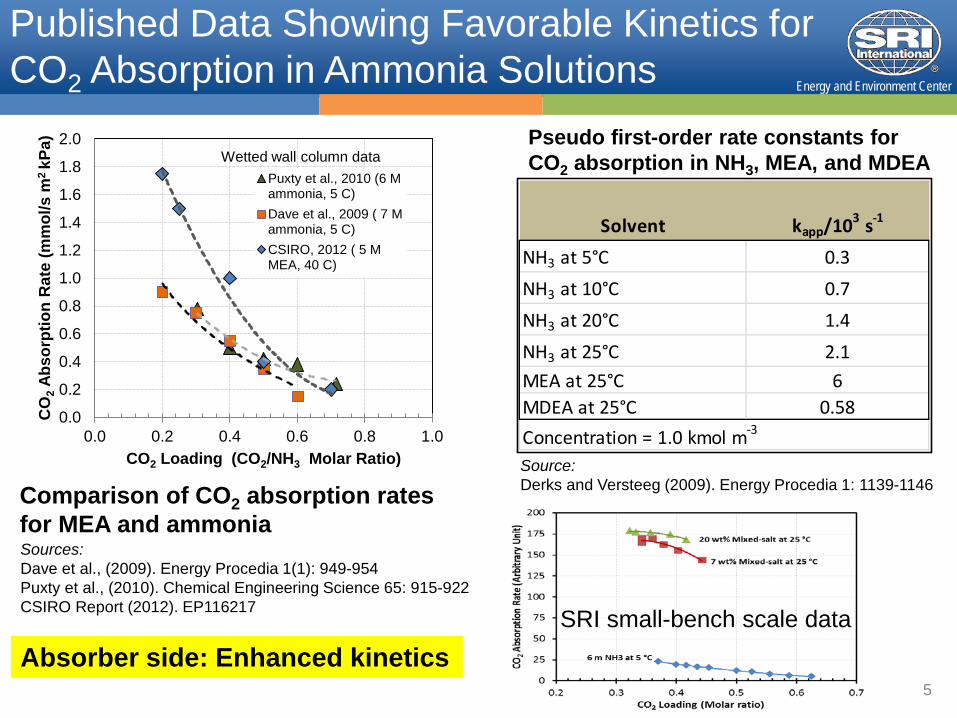
Published Data Showing Favorable Kinetics for CO2 Absorption in Ammonia Solutions
5
Sources:Dave et al., (2009). Energy Procedia 1(1): 949-954Puxty et al., (2010). Chemical Engineering Science 65: 915-922CSIRO Report (2012). EP116217
Comparison of CO2 absorption rates for MEA and ammonia
Pseudo first-order rate constants for CO2 absorption in NH3, MEA, and MDEA
Source:Derks and Versteeg (2009). Energy Procedia 1: 1139-1146
Solvent kapp/103 s-1
NH3 at 5°C 0.3NH3 at 10°C 0.7NH3 at 20°C 1.4NH3 at 25°C 2.1MEA at 25°C 6MDEA at 25°C 0.58Concentration = 1.0 kmol m-3
0.0
0.2
0.4
0.6
0.8
1.0
1.2
1.4
1.6
1.8
2.0
0.0 0.2 0.4 0.6 0.8 1.0
CO
2Ab
sorp
tion
Rat
e (m
mol
/s m
2 kP
a)
CO2 Loading (CO2/NH3 Molar Ratio)
Puxty et al., 2010 (6 Mammonia, 5 C)Dave et al., 2009 ( 7 Mammonia, 5 C)CSIRO, 2012 ( 5 MMEA, 40 C)
Wetted wall column data
Absorber side: Enhanced kineticsSRI small-bench scale data

Energy and Environment Center
Mixed-Salt has a Low Energy Requirement for CO2 Stripping
6
Sources: MEA data: CSIRO report (2012), EP116217K2CO3 data: GHGT-11; Schoon and Van Straelen (2011), TCCS-6Mixed-salt data; SRI modeling
Estimated regenerator heat requirement for mixed-salt system with 0.2 to 0.6 cyclic CO2 loading. Comparison with neat K2CO3 and MEA is shown.
Mixed-salt process requires minimal energy for water stripping
20 bar
High purity CO2 stream
CO2/H2O < 0.02
Regenerator side: Reduced water evaporation
Energy and Environment Center
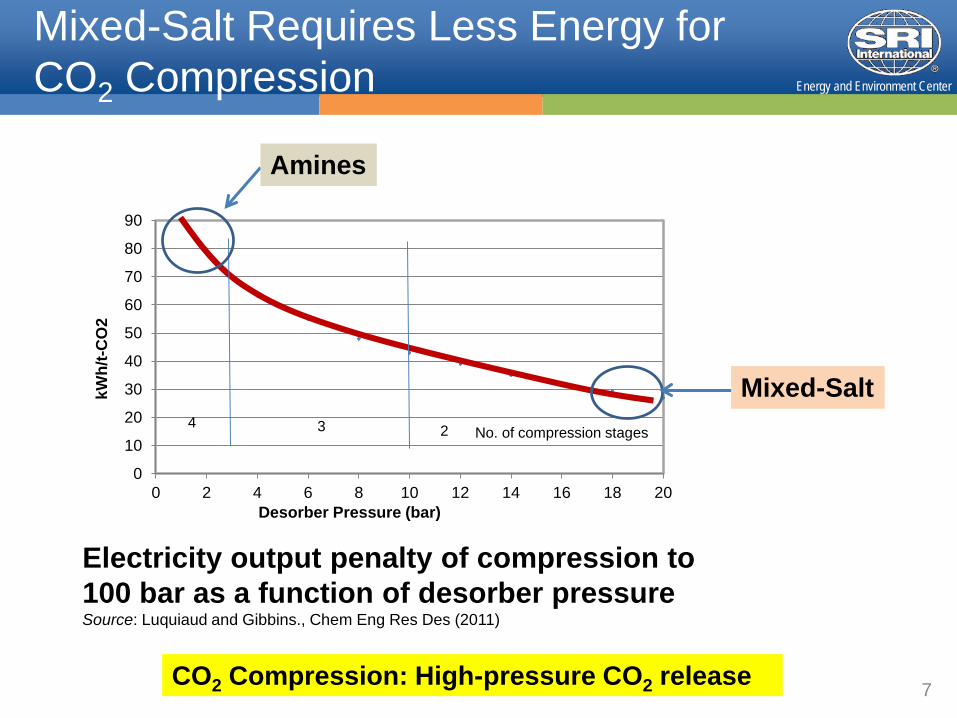
Mixed-Salt Requires Less Energy for CO2 Compression
7
0
10
20
30
40
50
60
70
80
90
0 2 4 6 8 10 12 14 16 18 20Desorber Pressure (bar)
kWh/
t-CO
2
4 3 2 No. of compression stages
Mixed-Salt
Amines
Electricity output penalty of compression to 100 bar as a function of desorber pressureSource: Luquiaud and Gibbins., Chem Eng Res Des (2011)
CO2 Compression: High-pressure CO2 release

Energy and Environment Center
Mixed-Salt Process Flow Diagram
8
Cleaner Exhaust
AB
REGHX1
HX4
HX3
HX5
>99% CO2
HX2
K2CO3 richSalt mixture
NH3 richSalt mixture
+
++
+
Absorber Regenerator
++
+ +
Flue Gas

DOE Project Overview(Large-Bench Scale Testing)

Energy and Environment Center
Project Goals
Budget Period 1: – Demonstrate the absorber and regenerator processes individually with high
efficiency, low NH3 emissions, and reduced water use compared to state-of-the-art ammonia-based technologies
Budget Period 2:– Demonstrate the high-pressure regeneration and integration of the absorber and
the regenerator
– Demonstrate the complete CO2 capture system, optimize system operation, and collect data to perform the detailed techno-economic analysis of CO2-capture process integration to a full-scale power plan
– Conduct EH&S analysis of the process
The overall project objective is to demonstrate that mixed-salt technology can capture CO2 at 90% efficiency and regenerate (95% CO2 purity) at a cost of ≤$40/tonne to meet the DOE program goals.
10

Energy and Environment Center
Project Team and Project Budget
11
Cost share by SRI, OLI Systems, POLIMI, Aqueous Solutions Aps, Stanford University, and IHI Corporation
Budget Period 1 Budget Period 2 Total 10/1/13 - 12/30/14 1/1/15 - 3/31/16 10/1/13-3/31/16
Total Project Cost $1,019,650 $1,278,975 $2,298,626DOE Share $819,534 $1,018,474 $1,838,009Cost Share $200,116 $260,501 $460,617
Project Budget
Project Manager: Mr. Steven Mascaro, NETL
Prime Contractor: SRI International
US Partners: OLI Systems, Stanford University, Dr. Eli Gal
International Partners: Dr. Kaj Thomsen, POLIMI, IHI Corporation

Energy and Environment Center
Project Tasks
12
Start Date End Date Q4 Q1 Q2 Q3 Q4 Q1 Q2 Q3 Q4 Q1 Q2 Q310/1/2013 3/31/201610/1/2013 3/31/2016
10/1/2013 11/30/2014Subtask 2.1 - Test Systems Design and Installation 10/1/2013 4/28/2014Subtask 2.2 - Test Plans 2/1/2013 2/30/2014Subtask 2.3 - Absorber Tests 4/30/2014 11/30/2014Subtask 2.4 - Regenerator Tests 7/1/2014 11/3/2014Subtask 2.5 - Bench-Scale Test Data Analysis 2/28/2014 11/30/2014
3/1/2014 12/15/2014Subtask 3.1 - Process Modeling 3/1/2014 11/30/2014Subtask 3.2 - Preliminary Economic Analysis 8/1/2014 12/15/2014
9/15/2014 9/30/2014Continuation Report Submission 9/15/2014 9/30/2014
1/15/2015 3/31/2016Subtask 5.1 - Design of the Bench-Scale Integrated Test System 1/15/2015 3/31/2015Subtask 5.2 - Installation of the Bench-Scale Continuous, Integrated Test System 1/15/2015 3/31/2015Subtask 5.3 - Bench-Scale Test Plans 1/15/2015 2/15/2015Subtask 5.4 - Bench-Scale Tests and Data Analysis 4/1/2015 3/31/2016
5/1/2015 3/31/2016Subtask 6.1 - Process Modeling 5/1/2015 3/1/2016
Subtask 6.2-Techno-Economic Analysis 8/1/2015 3/30/2016
Subtask 6.3- Technology EH&S Risk Assesment 9/1/2015 3/30/20164/30/2016 5/30/2016
Task 2-0: Individual Absorber and Regenerator Testing in Semi-Continuous mode
Task 3.0 - Preliminary Process Modeling and Techno-Economic Analysis
Task 5.0 - Bench-Scale Integrated System Testing
Task 6.0 - Process Modeling and Techno-Economic Analysis
Final Report Submission
Task 4.0 - Budget Period 2 Continuation Application
Task 1.0 - Project Management and Planning
2014 2015 2016Task
Mixed-Salt BP1 and BP2
Project is on time and on schedule

Work Performed in BP1
Energy and Environment Center
T1
T6
T5
T4
T3
T2
T8
P
P
P T7
Air (0-1000 lpm)
CO2 (0-125 lpm)
MFC
MFC
Cooling water
Electronic flow meter
Visual flow
meter
Pump #1
55 gal
T9
Sampling port
Cooling water
NH3 (ppm)
Gas sampling line
CO2 (%)
Level sensor (%)
Visual flow
meter
Visual flow
meter
Air pump
Metering Valve
Gas flow meter
T10
T14
T11
P
P
P
T13
T12
T15
Cooling water
Electronic flow meter
Cooling waterVisual
flow meter
Pump #2 Pump #3
55 gal
Level sensor (%) T17 T18
Sampling port
Make up solution port
Gas exit
Visual flow
meter
Visual flow
meter
Sampling portSampling port
Gas sampling
line
Air pumpNH3 (ppm)
CO2 (%)
Metering Valve
Gas flow meter
T16
Electronic flow meter
Electronic flow meter
Inlet CO2 (%)
Sampling portBackup pump #1A Backup pump #2A
Make up solution port
Make up solution port
T0
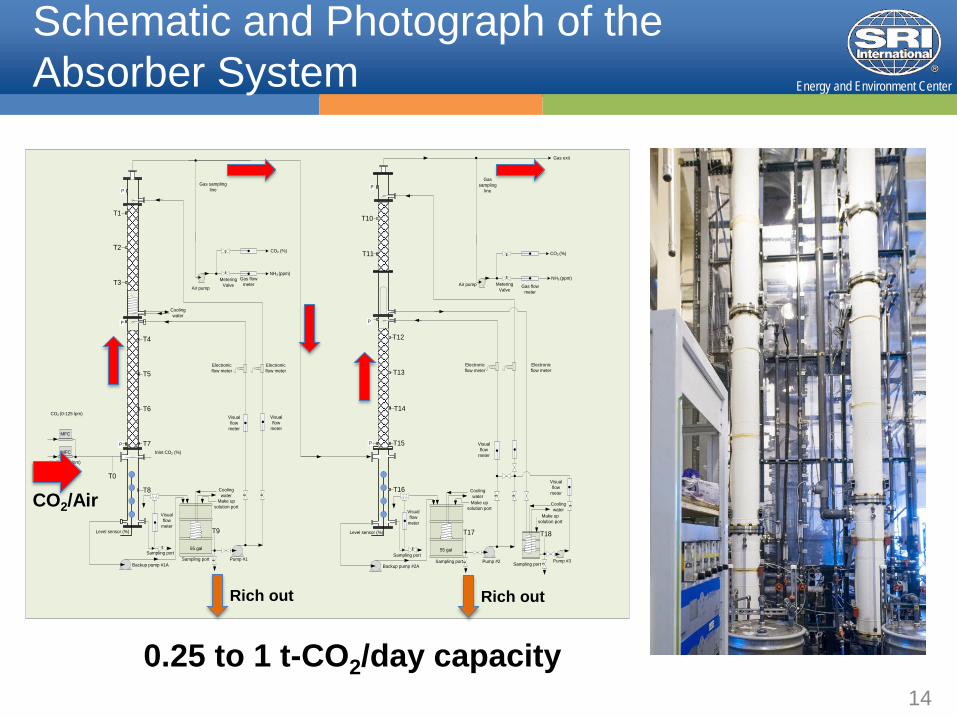
CO2/Air
Rich out Rich out
Schematic and Photograph of the Absorber System
14
0.25 to 1 t-CO2/day capacity

Energy and Environment Center
Bench-Scale Absorber Performance
15
CO2 vapor pressure at the absorber exit under various CO2-loading conditions
Better than 90% efficiency with incoming lean absorption solution and < 0.4 CO2 loading
Modeling and Test DataTest Data
The observed overall rates for CO2 absorption are on the same order as those of MEA-based systems and about 5-7x higher than chilled ammonia systems

Energy and Environment Center
ABS 1 only
ABS 1
NH3 vapor pressure at the Absorber 1 exit under various CO2-loading conditions
NH3 vapor pressure at the Absorber 1 and 2 exits under various CO2-loading conditions
ABS2
Process Ammonia Management
Test Data
16

Energy and Environment Center
Regeneration Operation Modes
17
450 psi
Level sensors
HP pump
RTD
Heat
traced and insulated
Heating fluid
Pack
ing
012
3
45
67
89
1011
Rich Feed
Rich Feed
Lean Out
Warm absorber top
Cold absorber top

Energy and Environment Center
Variation of attainable CO2-lean loading level with temperature for rich loadings of 0.40 to 0.50 at 10-12 bar
The produced lean loading well exceeds that required for > 90% CO2 capture from flue gas streams
Process was demonstrated with cyclic loading from 0.2 to (lean) to 0.5 (rich) at 150° C
Regenerator Performance
18
Test Data Modeling and Test Data
Comparison of measured and modeled attainable CO2-lean loading at 100 to 150 ºC

Energy and Environment Center
Modeling Results: Preliminary Net Power Efficiency
19
Thermodynamic Model
ASPEN Modeling
Mass & Energy Balance
Software package was developed for thermodynamic modeling of mixed-salt system
Process layout with two regeneratoroptions were modeled, regeneratorenergy requirement was in the range 1.8to 2.2 MJ/kg-CO2, lowest energy optionwas chosen for BP2 regenerator design

Progress in BP2

Energy and Environment Center
Ongoing and Planned Activities in BP2
Absorber modification (completed and continuous operation in progress)
Novel regenerator design and fabrication (80% complete)
Integrated system operation (to begin in August)
Complete system modeling in ASPEN (complete)
Complete system modeling with rate-based approach (continuing)
Process technoeconomic analysis (TEA) (to start in August 2015)
Process EH&S analysis (to start in September 2015)
21

Energy and Environment Center
Simplified PFD of the Integrated System
22
Flue Gas20cfm85% N2
15% CO2
Water Wash
Clean Flue Gas
Absorber 1 Absorber 2
Rich Solution 1
Lean Solution 2
Lean Solution 1
Rich Solution 2 Reboiler
RegeneratorPressure 10-20 bar
CO2
160⁰C
120⁰C
1. System is currently in operation with buffer tanks for lean and rich solution storage 2. Continuous operation of the absorber system was smooth and the observed results
were as expected based on the BP1 work

Energy and Environment Center
System Testing in Continuous Mode
23
90% CO2 capture efficiency with 0.19 to 0.40 cyclic CO2 loading in Absorber 1Gas flow rate = 15 acfm
Test Data Modeling and Test Data
Comparison of observed and modeled temperature profiles for Absorber 1
Process Modeling: SRI (ASPEN) and OLI (ESP) Cyclic Loading = 0.18 to 0.58Reboiler Duty ~ 1.8 to 1.9 MJ/kg-CO2Ammonia Emission < 10 ppm

Energy and Environment Center
Mixed-Salt Technology Summary
24
Process Summary• Uses inexpensive, industrially available material
(potassium and ammonium salts)• Requires no feedstream polishing• Does not generate hazardous waste• Has the potential for easy permitting in many localities• Uses known process engineering
•
Demonstrated Benefits• Enhanced CO2 capture efficiency• High CO2-loading capacity• High-pressure release of CO2
Expected Benefits• Reduced energy consumption compared to MEA• Reduced auxiliary electricity loads compared to the
chilled ammonia process• Possible flexible carbon capture operation

Plans for Future Testing and Commercialization

Energy and Environment Center
Bench-scale Technology Development Timeline
Large Bench-Scale Testing
(Component Testing)
Large Bench-Scale Testing
(Integrated Testing)
Budget Period 1 Budget Period 2Scale: 0.25 to 1 ton/dayUp to 20 scfm
Current DOE-funded Project
SRI Project SRI/IHI Project
26

Energy and Environment Center
27
Scale-up Plan of Mixed-Salt Process for CO2 Capture from Coal Power Plants
27
SRI’s Bench-scale System
2013 2015 2020 2025 2030
Pilot Plant1 MW
(Future program)
Validation Stage Plant10-20 MW
Demonstration Plant/Full-scale Plant
100-300 MW
Bench-scale Plant 0.25 to 1 ton-CO2/day (Existing program with DOE)
Development Plan Proposed by IHI Corporation
Energy and Environment Center
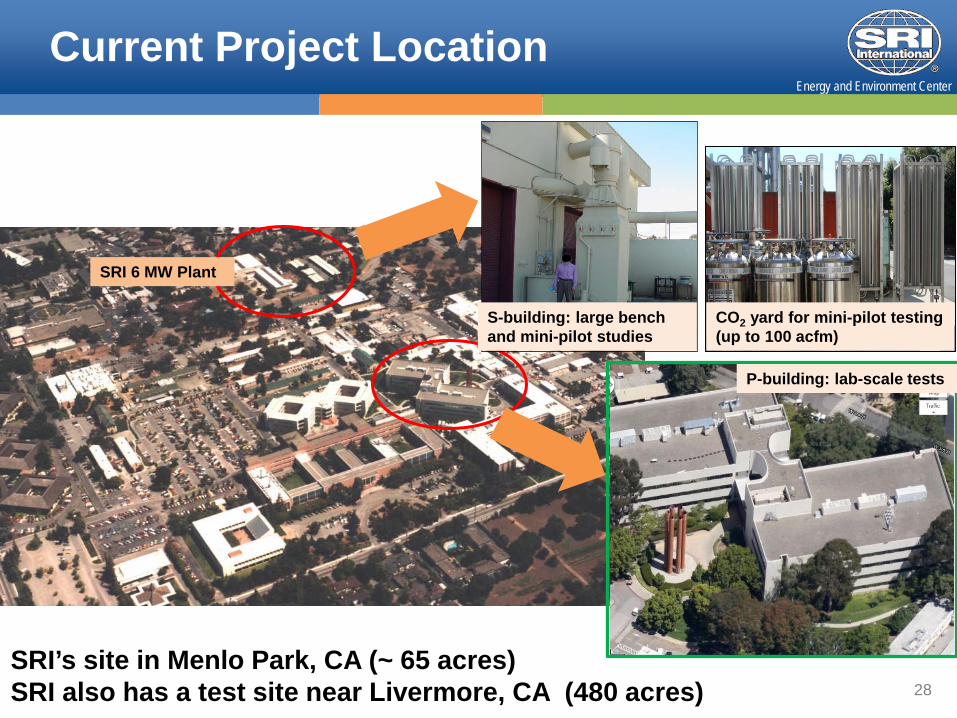
SRI’s site in Menlo Park, CA (~ 65 acres)SRI also has a test site near Livermore, CA (480 acres)
Current Project Location
28
P-building: lab-scale tests
SRI 6 MW Plant
CO2 yard for mini-pilot testing (up to 100 acfm)
S-building: large bench and mini-pilot studies

Energy and Environment Center
Acknowledgements
29
NETL (DOE)
• Mr. Steve Mascaro, Ms. Lynn Bricket, and other NETL staff members
SRI Team
• Dr. Indira Jayaweera, Dr. Palitha Jayaweera, Dr. Jianer Bao, Ms. Regina Elmore, Dr. Srinivas Bhamidi, Mr. Bill Olsen, Dr. Marcy Berding, Dr. Chris Lantman, and Ms. Barbara Heydorn
Collaborators
• OLI Systems (Dr. Prodip Kondu and Dr. Andre Anderko), POLIMI (Dr. Gianluca Valenti and others), Stanford University (Dr. Adam Brant and Mr. Charles Kang), Dr. Eli Gal, and Dr. Kaj Thomsen
Industrial Partner
• IHI Corporation (Mr. Shiko Nakamura, Mr. Okuno Shinya, Dr. Kubota Nabuhiko, Mr. Yuichi Nishiyama, and others)

Energy and Environment Center
This presentation includes an account of work sponsored by an agency of the United States Government. Neither the United States Government nor any agency thereof, nor any of their employees, makes any warranty, express or implied, or assumes any legal liability or responsibility for the accuracy, completeness, or usefulness of any information, apparatus, product, or process disclosed, or represents that its use would not infringe privately owned rights. Reference herein to any specific commercial product, process, or service by trade name, trademark, manufacturer, or otherwise does not necessarily constitute or imply endorsement, recommendation, or favoring by the United States Government or any agency thereof. The views and opinions of authors expressed herein do not necessarily state or reflect those of the United States Government or any agency thereof.
30
Disclaimer

Headquarters: Silicon ValleySRI International333 Ravenswood AvenueMenlo Park, CA 94025-3493650.859.2000
Washington, D.C. SRI International1100 Wilson Blvd., Suite 2800Arlington, VA 22209-3915703.524.2053
Princeton, New JerseySRI International Sarnoff201 Washington RoadPrinceton, NJ 08540609.734.2553
Additional U.S. and international locations
www.sri.comThank You
Contact:
Dr. Indira [email protected]