development of microbial granule using low strength ... · development of microbial granule using...
TRANSCRIPT
Development of Microbial Granule UsingLow Strength Textile Wastewater Under
Influence of Static Magnetic Field
Ahmad Hanis Omara, Khalida Muda∗b,Zaiton Abdul Majid c, Augustine Chioma Affamd,
Nasiman Saparie, Emmanuel Olisaf ,Norelyza Husseing, Normala Hashim h,
Nur Syamimi Zaidi i
a,b,g,h,i Faculty of Civil Engineering, UniversitiTeknologi Malaysia,
81310 UTM Johor Bahru, Johor, Malaysiac,g,h,i Centre for Sustainable and Water Security
(IPASA) UTM,81310 Johor Bahru, Johor, Malaysia
cFaculty of Science, UniversitiTeknologi Malaysia,
81310 UTM Johor Bahru, Johor, MalaysiadCivil Engineering Department, School of Engineering
and Technology,University College of Technology Sarawak,
96000 Sibu, Sarawak, Malaysiae,fCivil Engineering Department, Universiti
Teknologi Petronas,Bandar Seri Iskandar,
31750 Tronoh, Perak, Malaysia*Corresponding Author Email: [email protected]
1
International Journal of Pure and Applied MathematicsVolume 118 No. 24 2018ISSN: 1314-3395 (on-line version)url: http://www.acadpubl.eu/hub/Special Issue http://www.acadpubl.eu/hub/
March 31, 2018
Abstract
Most studies reported on the development of aerobicgranules using high strength wastewater. Low strength wastew-ater however, is reported as type of wastewater which nor-mally not able to support fast development of granulation.Although with such limitation, this study is aimed at form-ing the granules using low strength textile wastewater butwith facilitation of static magnetic field. This study is con-ducted in a single sequencing batch reactor of two-stageanaerobic-aerobic reaction phase under the exposure of mag-netic field. Granules were cultivated using combination oftextile sludge and municipal wastewater treatment plant.From this study, the granules increased to about 0.15± 0.10cm of average size. This had thus increased the settling ve-locity of the granules. Granule strength that is expressedas integrity coefficient was observed to decrease from 26.3± 0.5 to 12.5± 0.5 owing to an increase in the strength ofthe granules. The removal performances of chemical oxy-gen demand (COD), total organic carbon (TOC) and colorwere observed quite high viz. 93.5%, 92.9% and 44.4%,respectively. Generally, the study indicated that granularsludge is potential to be developed even using low strengthwastewater with facilitation of static magnetic field.
Key Words:Low strength wastewater; Textile wastew-ater; Granulation; Static magnetic field.
1 Introduction
The textile industry is one of dominant industry that contributeto generation of effluent wastewater due to high consumption ofwater for various wet processing operations. The effluent wastewa-ter mainly contains chemical compound such as dyes, alkalis, acids,soaps of metals and surfactants dispersing agents (1). Dye suchas aromatic and heterocyclic dyes become hardly to degrade dueto its complicated and stable structure which also exist in textilewastewater and other complex matrix (2). The release of textile in-dustry effluent in the environment without proper treatment may
2
International Journal of Pure and Applied Mathematics Special Issue
cause serious environmental pollution. According to Waghmodeet al. (3), aromatic amines compound may present in wastewaterthat contains azo dye due to reduction of azo bond (-N=N-) underanaerobic condition which in several cases are toxic, mutagenic andcarcinogenic (4). Amongst a variety of physicochemical and biolog-ical treatment, the two-stage biological anaerobic-aerobic system isappropriate for treating azo dye-containing wastewater (5). It isconsidered environmentally friendly as this treatment process canlead to complete mineralization of textile effluent at low cost.
In form of biological treatment, there have been various types ofmicrobes that have been used to decolorize dyes. Microbial strainssuch as Bacillus sp. and Shewanella putrefaciens (6, 7) have beenreported as the successful azo dye decolorization. Some of thesemicrobes can perform decolorization anaerobically while most ofit can normally perform aerobically. Anaerobic azo dye decoloriza-tion usually leads to the formation of aromatic metabolites that canresist further anaerobic degradation. However, under aerobic con-dition complete mineralization of the amines can occurs (8). Dueto such limitation, several studies have employed two-stage reactorsto execute both anaerobic-aerobic phases (9, 10). This execution iscomplex because the anaerobic microbes need to be removed fromthe wastewater before the wastewater can be transferred into aero-bic reactor. Hence, as to enhance this operation, sequencing batchreactor (SBR) was used for these microbes granulation develop-ment, which it is operated under aerobic and anaerobic conditionssimultaneously.
As a matter to enhance the development of microbes granu-lation, various internal factors such as hydrodynamic shear force,hydraulic residence time, substrate composition i.e. feed, organicloading rate (OLR) and settling time have been examined to en-hance secretion of extracellular polymeric substances (EPS). Thesesubstances can help in enhancing the adhesion ability among themicrobes thus, helps in fastening the development of granulationprocess (11). As for external factors, the usage of magnetic field toimprove the performance of biological wastewater treatment gainswide attention lately. The intense magnetic field (more than 1 T)may hinder physical process of organisms (9) whereas Ji et al. (12)observed that slightly weak magnetic field maybe useful for bacte-rial growth. Studies employing static magnetic field in wastewater
3
International Journal of Pure and Applied Mathematics Special Issue

treatment have proven that magnetic field could enhance microbialgrowth, accelerate biodegradation of organic materials (13-16) andincrease nitrification rate (12). Its positive effect on biomass andglutathione production has also been reported (17). Wang et al.(18) also reported the improvement of granules development underthe influence of magnetic field. Initially, development of granuleswas about 41 days in the absence of magnetic field but as 48 mTof magnetic field intensity was applied, the granules developmentperiod was shortened to 25 days. Still until today, studies thatreported on the application of magnetic field specifically on thegranulation are quite minor.
Common studies also highlighted that high strength wastewa-ter that can be indicated by high OLR could efficiently develop thegranules. Very lack of studies was conveyed in terms of using lowOLR to develop the granules. Studies by Tay et al. (19) demon-strated the difficulty of granules cultivation with lower OLR. Thestudy showed that OLR with lower rate than 2 kg COD/m3 illus-trated slow development of aerobic granules and took longer timeto attain stable condition. Hence, the purpose of this study is topresent a potential way to cultivate the granules with feasibility todevelop using low strength wastewater. In order to occupy with thepossible limitation of low OLR, static magnetic field was then usedas the external factor of enhancement.
2 Methodology/Materials
2.1 Configuration of reactor
Magnetic bio-granules reactor system was designed and fabricatedto operate at working volume of 3 L. Internal diameter of the re-actor was 0.08 m with the total height of 1.5 m. The influent wasfed from bottom of the reactor while decanting of the effluent wasdone at 0.4 m from bottom of the reactor’s column. Air supply intothe reactor was done using bubble diffusers. The operating config-uration involving filling, anaerobic-aerobic, settling and decantingsequence phase were shown in Table 1. The bulk permanent mag-nets were arranged around the reactors and the exhibited magneticfield intensity was about 13.9 0.2 mT. The reactor system was op-erated at hydraulic retention time (HRT) of 8 hrs for a period of 24
4
International Journal of Pure and Applied Mathematics Special Issue
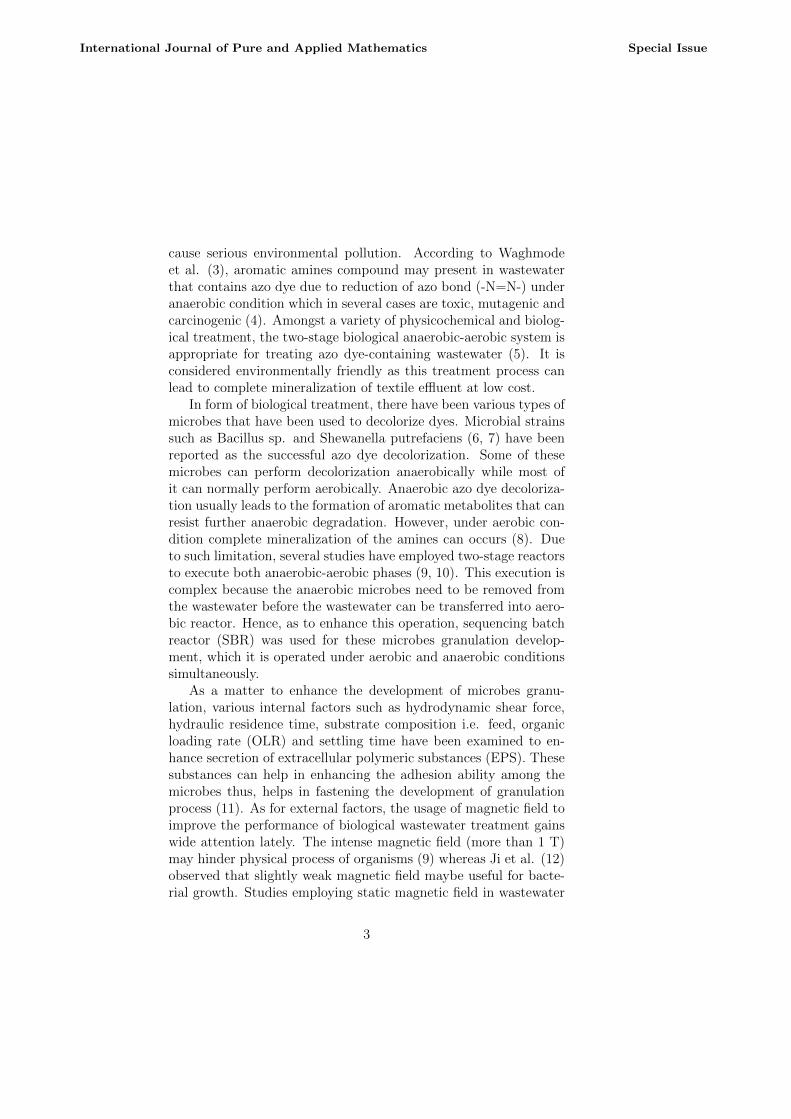
weeks. It was operated until the matured bio-granules were formedin the reactor.
Table 1 Operating conditions of the magnetic bio-granules reactorsystem
2.2 Compositions of wastewater
The wastewater used in this study was a synthetic textile type ofwastewater. The composition of this synthetic wastewater wereKH2PO4 (0.23 g/L), NH4Cl (0.16 g/L), MgSO4.7H2O (0.09 g/L),EDTA (0.02 g/L), trace solution 1 mL/L, CaCl2.2H20 (0.07 g/L)and K2HPO4 0.58 (g/L). Sodium acetate (0.5 g/L), ethanol (0.125g/L) and glucose (0.5 g/L) were used as carbon sources. Mean-while, the trace elements used in this study were based on re-search by Smolder et al. (1995), namely MnCl2.4H2O (0.12 g/L),CuCl2.2H2O (0.03 g/L), FeCl3.4H2O (1.5 g/L), H3BO3 (0.15 g/L),NaMoO4.2H2O (0.06 g/L), CoCl2.6H2O (0.15 g/L), KI 0.03 g/Land ZnCl2 (0.12 g/L). Reactive Black 5, Disperse Orange 1 and Re-active Blue 4 were the dyes used. The wastewater consisted COD of500 ± 100 mg/L, TOC of 205 ± 20 and color 1000 ± 100 AmericanDye Manufacturing Index (ADMI). The pH was fixed at 7.0 0.5before treatment was commenced.
2.3 Analytical methods
Size of the granule was observed by a stereomicroscope with camera(HUVITZ, HSZ-ILST6, Korea). Physical and biological character-istics of the microbial granules were determined. The physical char-acteristics include the settling velocity and granular strength. Thesettling velocity was obtained according to method described byBeun et al.(20). The granular strength was determined according
5
International Journal of Pure and Applied Mathematics Special Issue

to Ghangrekar et al.(21) which was measured as integrity coefficient(IC). Determination of the sludge size was done based on sievingmethod (22). Parameter of chemical oxygen demand (COD), color,total organic carbon (TOC) and biomass concentration were mea-sured based on Standard Methods (23). Other studies conductedinclude FTIR, UV/V is and FESEM analysis.
2.4 Experimental procedure
A 1.5 L synthetic wastewater and 1.5 L sludge from a textile wastew-ater treatment plant which giving a total of 3000 mL for the op-erational volume were mixed. The mixture gave a total sludgeconcentration of 4.8 g/L and organic loading rate (OLR) of 0.83kgCOD/m3.d. Acclimatization of sludge mixture was performedbefore the reactor was operated for 24 weeks with hydraulic reten-tion time (HRT) of 8 hrs. Temperature of the reactor was set at 26± 3◦C.
3 Results and Discussions
3.1 Physical characterization of microbial gran-ules
3.1.1 Microbial granule size
Shear force exerted on the granules due to the superficial up flow airvelocity was 0.015 m/s. This led to microbial granule development,which the growth is about 0.15 ± 0.10 cm of average particle diam-eter size (maximum size up until 0.3 cm). These microbial granuleswere form after undergone a numbers of physical and morphologi-cal changes. Figure 1 shows the microbial granules growth at theearly stage (week 1) until the matured microbial granules form atthe final stage (week 25). After 12 weeks of operation (Figure 1d),small granules with average diameter 0.5 ± 1.0 mm were observed.Afterwards, the number and average diameter of the granules in-creased slowly (Figure 1e) until the matured granules form at thefinal stage. The formation of these granules is very slowing due toused of low strength wastewater and took longer time to reach sta-ble condition. These result showed similarity with studies reported
6
International Journal of Pure and Applied Mathematics Special Issue
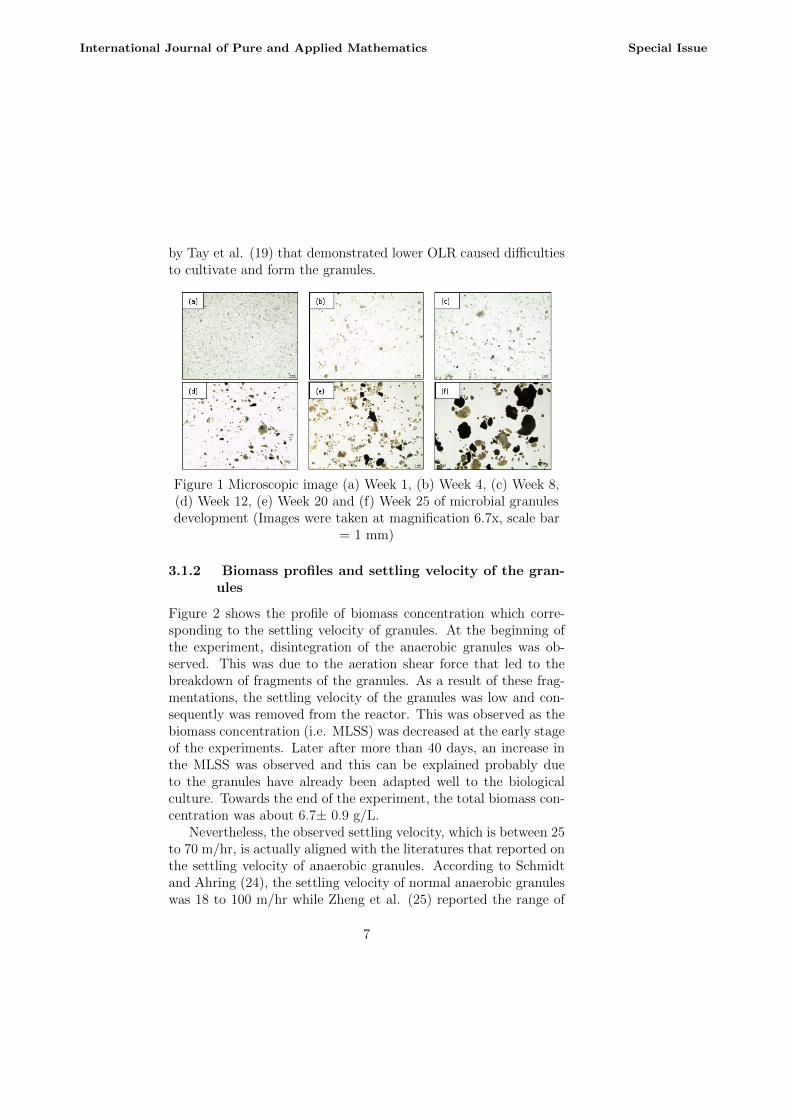
by Tay et al. (19) that demonstrated lower OLR caused difficultiesto cultivate and form the granules.
Figure 1 Microscopic image (a) Week 1, (b) Week 4, (c) Week 8,(d) Week 12, (e) Week 20 and (f) Week 25 of microbial granulesdevelopment (Images were taken at magnification 6.7x, scale bar
= 1 mm)
3.1.2 Biomass profiles and settling velocity of the gran-ules
Figure 2 shows the profile of biomass concentration which corre-sponding to the settling velocity of granules. At the beginning ofthe experiment, disintegration of the anaerobic granules was ob-served. This was due to the aeration shear force that led to thebreakdown of fragments of the granules. As a result of these frag-mentations, the settling velocity of the granules was low and con-sequently was removed from the reactor. This was observed as thebiomass concentration (i.e. MLSS) was decreased at the early stageof the experiments. Later after more than 40 days, an increase inthe MLSS was observed and this can be explained probably dueto the granules have already been adapted well to the biologicalculture. Towards the end of the experiment, the total biomass con-centration was about 6.7± 0.9 g/L.
Nevertheless, the observed settling velocity, which is between 25to 70 m/hr, is actually aligned with the literatures that reported onthe settling velocity of anaerobic granules. According to Schmidtand Ahring (24), the settling velocity of normal anaerobic granuleswas 18 to 100 m/hr while Zheng et al. (25) reported the range of
7
International Journal of Pure and Applied Mathematics Special Issue
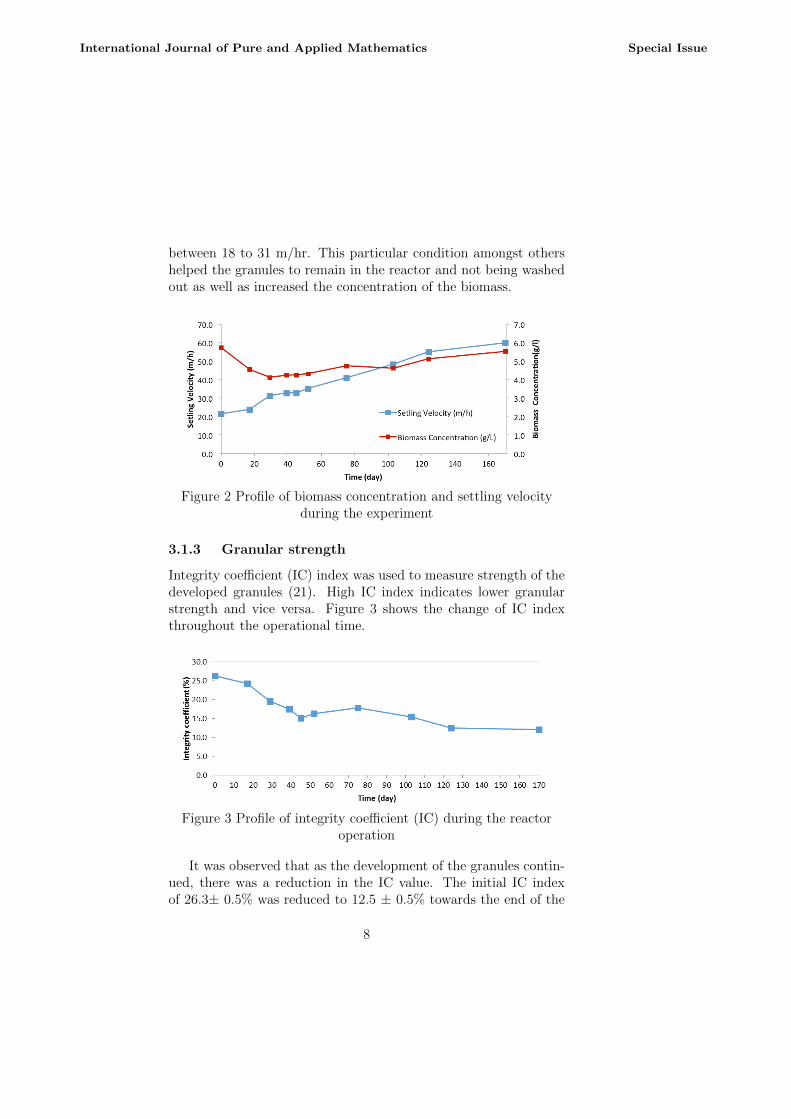
between 18 to 31 m/hr. This particular condition amongst othershelped the granules to remain in the reactor and not being washedout as well as increased the concentration of the biomass.
Figure 2 Profile of biomass concentration and settling velocityduring the experiment
3.1.3 Granular strength
Integrity coefficient (IC) index was used to measure strength of thedeveloped granules (21). High IC index indicates lower granularstrength and vice versa. Figure 3 shows the change of IC indexthroughout the operational time.
Figure 3 Profile of integrity coefficient (IC) during the reactoroperation
It was observed that as the development of the granules contin-ued, there was a reduction in the IC value. The initial IC indexof 26.3± 0.5% was reduced to 12.5 ± 0.5% towards the end of the
8
International Journal of Pure and Applied Mathematics Special Issue
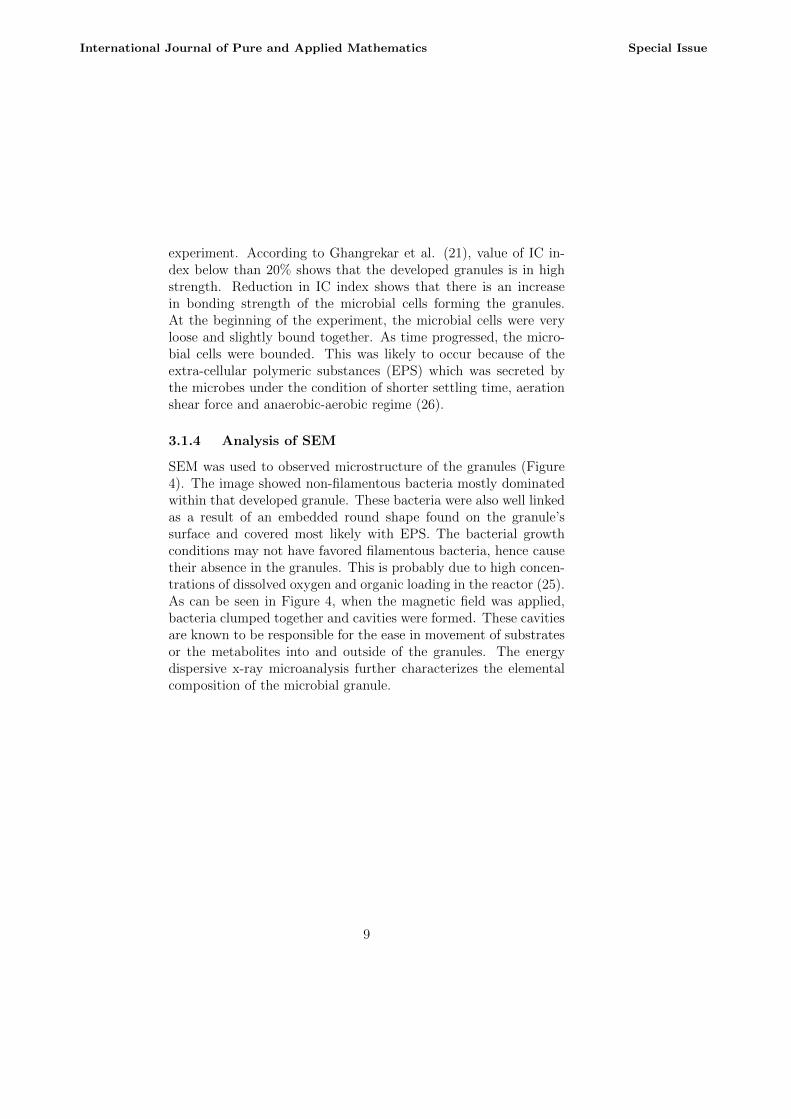
experiment. According to Ghangrekar et al. (21), value of IC in-dex below than 20% shows that the developed granules is in highstrength. Reduction in IC index shows that there is an increasein bonding strength of the microbial cells forming the granules.At the beginning of the experiment, the microbial cells were veryloose and slightly bound together. As time progressed, the micro-bial cells were bounded. This was likely to occur because of theextra-cellular polymeric substances (EPS) which was secreted bythe microbes under the condition of shorter settling time, aerationshear force and anaerobic-aerobic regime (26).
3.1.4 Analysis of SEM
SEM was used to observed microstructure of the granules (Figure4). The image showed non-filamentous bacteria mostly dominatedwithin that developed granule. These bacteria were also well linkedas a result of an embedded round shape found on the granule’ssurface and covered most likely with EPS. The bacterial growthconditions may not have favored filamentous bacteria, hence causetheir absence in the granules. This is probably due to high concen-trations of dissolved oxygen and organic loading in the reactor (25).As can be seen in Figure 4, when the magnetic field was applied,bacteria clumped together and cavities were formed. These cavitiesare known to be responsible for the ease in movement of substratesor the metabolites into and outside of the granules. The energydispersive x-ray microanalysis further characterizes the elementalcomposition of the microbial granule.
9
International Journal of Pure and Applied Mathematics Special Issue

Figure 4 SEM microstructure of the granule. Cavities that presentbetween bacteria are clumped inside the granules which been
exposed with magnetic field (a) sludge after granule development;scale bar = 50 m (b) raw sludge; scale bar = 80 m
3.2 Removal performances of the reactor
3.2.1 COD and TOC removal efficiency
The efficiency of the system during the development of the granulesin terms of COD and TOC removal is given in Figure 5 and 6. Afteracclimatization of the sludge with the wastewater, the reactor wasoperated for several weeks. The COD and TOC removal efficiencywere 93.5% and 92.9%, respectively. The obtained high removalefficiency indicates an increase in the biological activity throughoutthe operational time of the reactor system. According to Li and Liu(27), oxygen in the inner part of the granules was limited whichillustrated the existence of anaerobic microorganisms at the coreof microbial granules. Meanwhile, aerobic microorganisms assist inCOD and TOC removal where these microorganisms may presentat the surface layer of the microbial granules.
10
International Journal of Pure and Applied Mathematics Special Issue
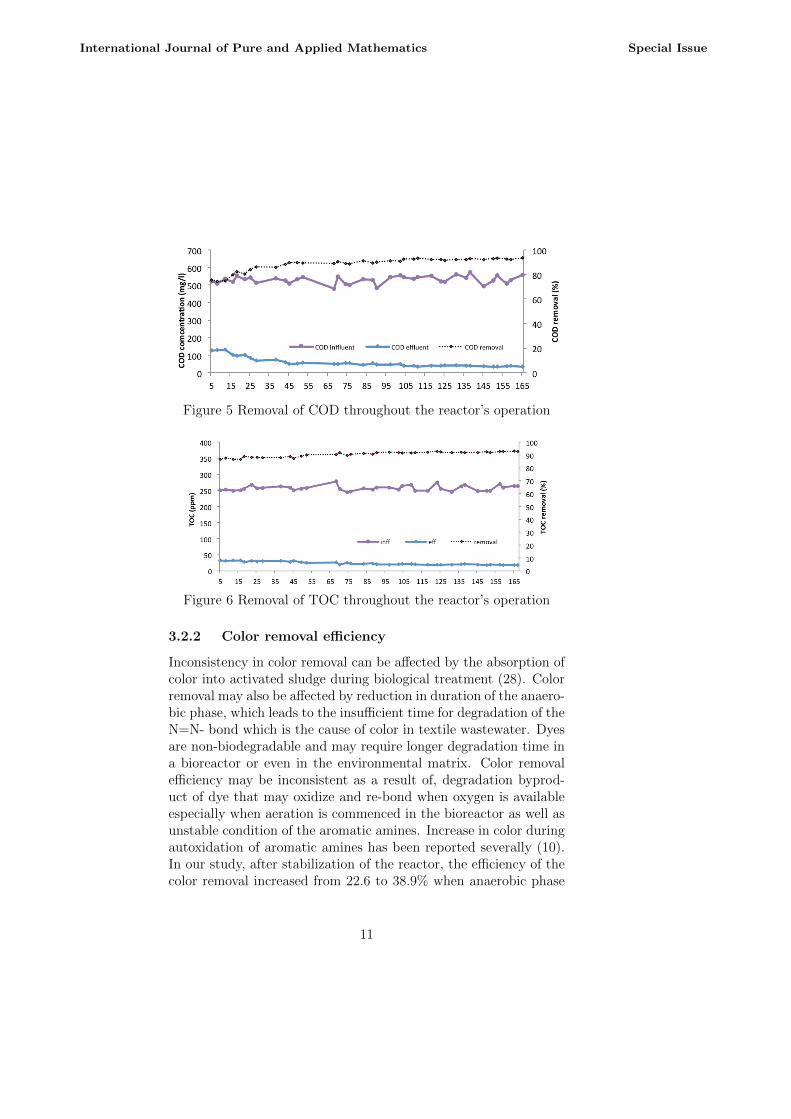
Figure 5 Removal of COD throughout the reactor’s operation
Figure 6 Removal of TOC throughout the reactor’s operation
3.2.2 Color removal efficiency
Inconsistency in color removal can be affected by the absorption ofcolor into activated sludge during biological treatment (28). Colorremoval may also be affected by reduction in duration of the anaero-bic phase, which leads to the insufficient time for degradation of theN=N- bond which is the cause of color in textile wastewater. Dyesare non-biodegradable and may require longer degradation time ina bioreactor or even in the environmental matrix. Color removalefficiency may be inconsistent as a result of, degradation byprod-uct of dye that may oxidize and re-bond when oxygen is availableespecially when aeration is commenced in the bioreactor as well asunstable condition of the aromatic amines. Increase in color duringautoxidation of aromatic amines has been reported severally (10).In our study, after stabilization of the reactor, the efficiency of thecolor removal increased from 22.6 to 38.9% when anaerobic phase
11
International Journal of Pure and Applied Mathematics Special Issue
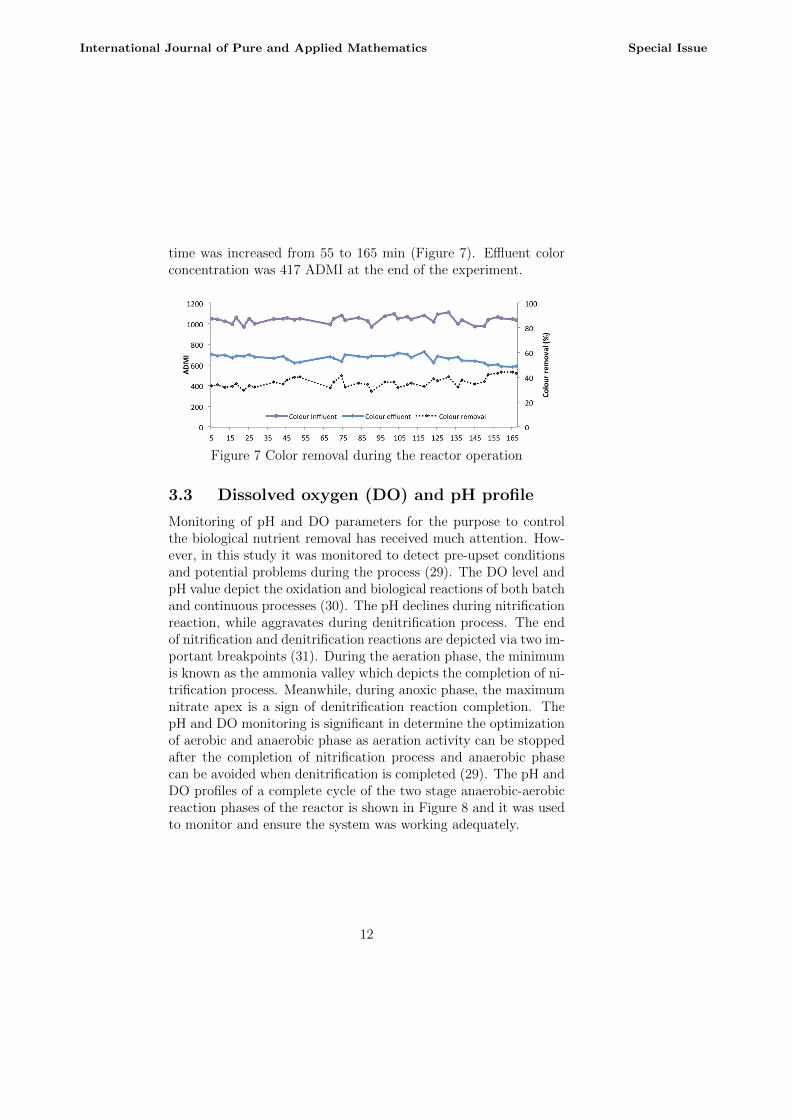
time was increased from 55 to 165 min (Figure 7). Effluent colorconcentration was 417 ADMI at the end of the experiment.
Figure 7 Color removal during the reactor operation
3.3 Dissolved oxygen (DO) and pH profile
Monitoring of pH and DO parameters for the purpose to controlthe biological nutrient removal has received much attention. How-ever, in this study it was monitored to detect pre-upset conditionsand potential problems during the process (29). The DO level andpH value depict the oxidation and biological reactions of both batchand continuous processes (30). The pH declines during nitrificationreaction, while aggravates during denitrification process. The endof nitrification and denitrification reactions are depicted via two im-portant breakpoints (31). During the aeration phase, the minimumis known as the ammonia valley which depicts the completion of ni-trification process. Meanwhile, during anoxic phase, the maximumnitrate apex is a sign of denitrification reaction completion. ThepH and DO monitoring is significant in determine the optimizationof aerobic and anaerobic phase as aeration activity can be stoppedafter the completion of nitrification process and anaerobic phasecan be avoided when denitrification is completed (29). The pH andDO profiles of a complete cycle of the two stage anaerobic-aerobicreaction phases of the reactor is shown in Figure 8 and it was usedto monitor and ensure the system was working adequately.
12
International Journal of Pure and Applied Mathematics Special Issue
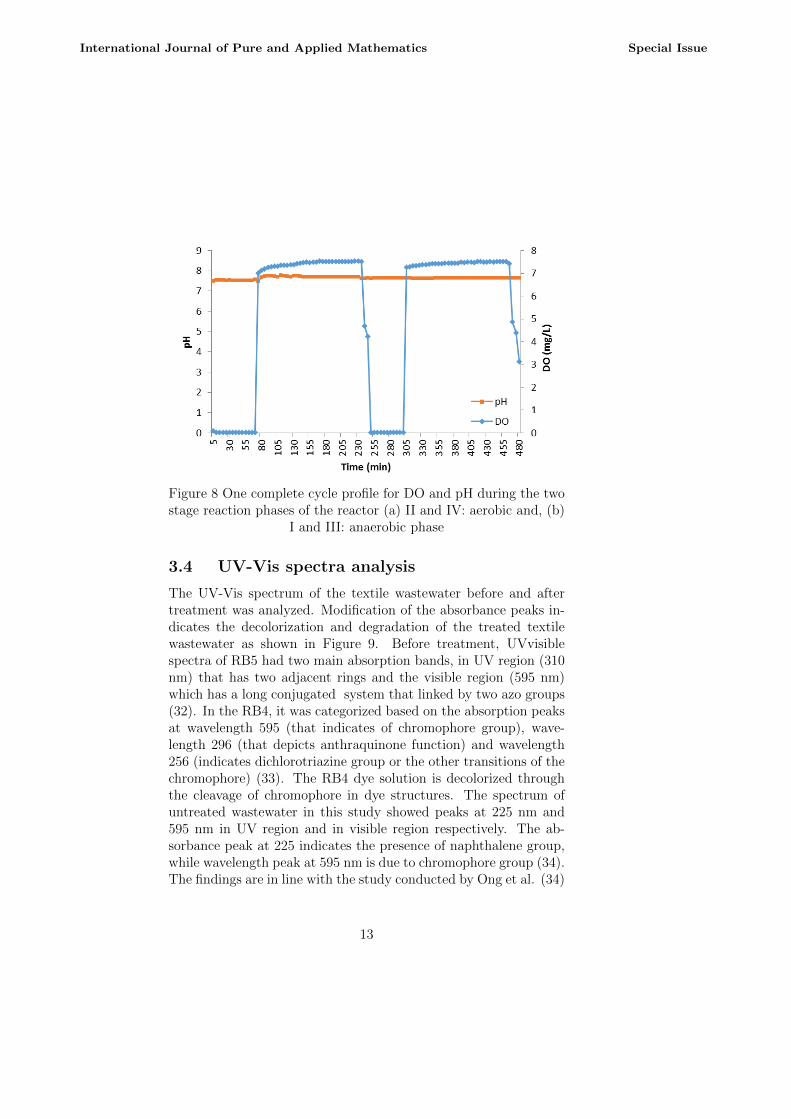
Figure 8 One complete cycle profile for DO and pH during the twostage reaction phases of the reactor (a) II and IV: aerobic and, (b)
I and III: anaerobic phase
3.4 UV-Vis spectra analysis
The UV-Vis spectrum of the textile wastewater before and aftertreatment was analyzed. Modification of the absorbance peaks in-dicates the decolorization and degradation of the treated textilewastewater as shown in Figure 9. Before treatment, UVvisiblespectra of RB5 had two main absorption bands, in UV region (310nm) that has two adjacent rings and the visible region (595 nm)which has a long conjugated system that linked by two azo groups(32). In the RB4, it was categorized based on the absorption peaksat wavelength 595 (that indicates of chromophore group), wave-length 296 (that depicts anthraquinone function) and wavelength256 (indicates dichlorotriazine group or the other transitions of thechromophore) (33). The RB4 dye solution is decolorized throughthe cleavage of chromophore in dye structures. The spectrum ofuntreated wastewater in this study showed peaks at 225 nm and595 nm in UV region and in visible region respectively. The ab-sorbance peak at 225 indicates the presence of naphthalene group,while wavelength peak at 595 nm is due to chromophore group (34).The findings are in line with the study conducted by Ong et al. (34)
13
International Journal of Pure and Applied Mathematics Special Issue
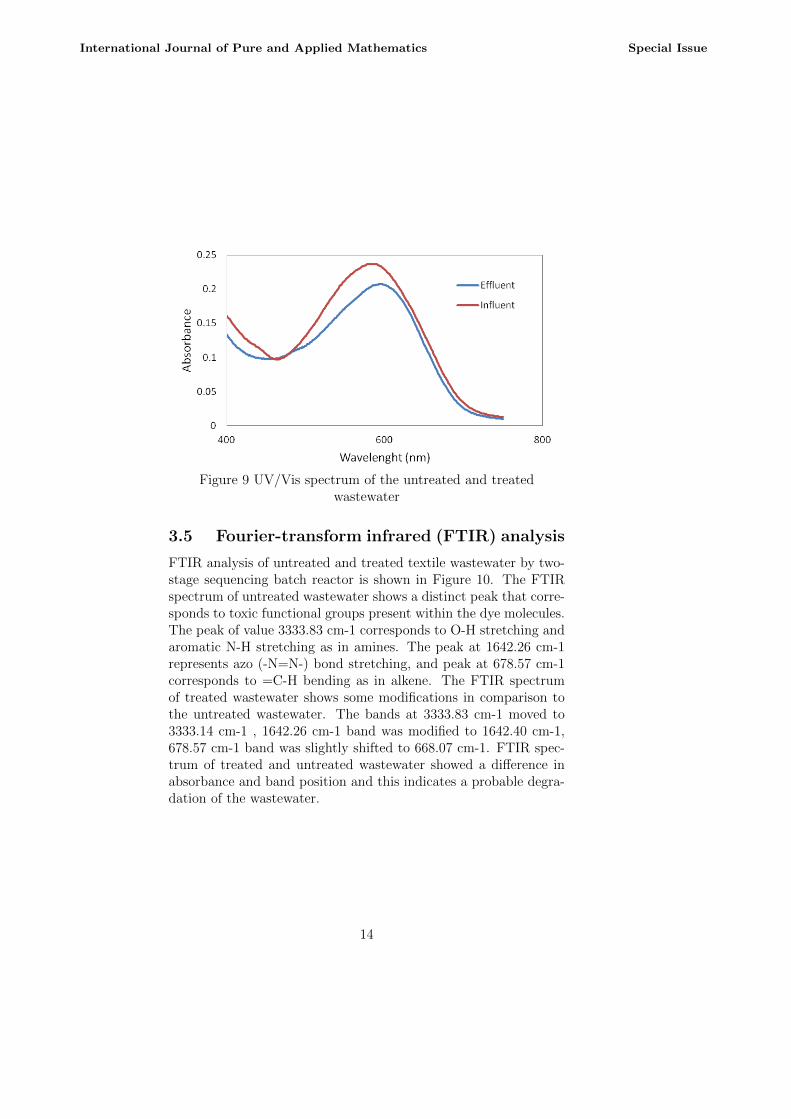
Figure 9 UV/Vis spectrum of the untreated and treatedwastewater
3.5 Fourier-transform infrared (FTIR) analysis
FTIR analysis of untreated and treated textile wastewater by two-stage sequencing batch reactor is shown in Figure 10. The FTIRspectrum of untreated wastewater shows a distinct peak that corre-sponds to toxic functional groups present within the dye molecules.The peak of value 3333.83 cm-1 corresponds to O-H stretching andaromatic N-H stretching as in amines. The peak at 1642.26 cm-1represents azo (-N=N-) bond stretching, and peak at 678.57 cm-1corresponds to =C-H bending as in alkene. The FTIR spectrumof treated wastewater shows some modifications in comparison tothe untreated wastewater. The bands at 3333.83 cm-1 moved to3333.14 cm-1 , 1642.26 cm-1 band was modified to 1642.40 cm-1,678.57 cm-1 band was slightly shifted to 668.07 cm-1. FTIR spec-trum of treated and untreated wastewater showed a difference inabsorbance and band position and this indicates a probable degra-dation of the wastewater.
14
International Journal of Pure and Applied Mathematics Special Issue
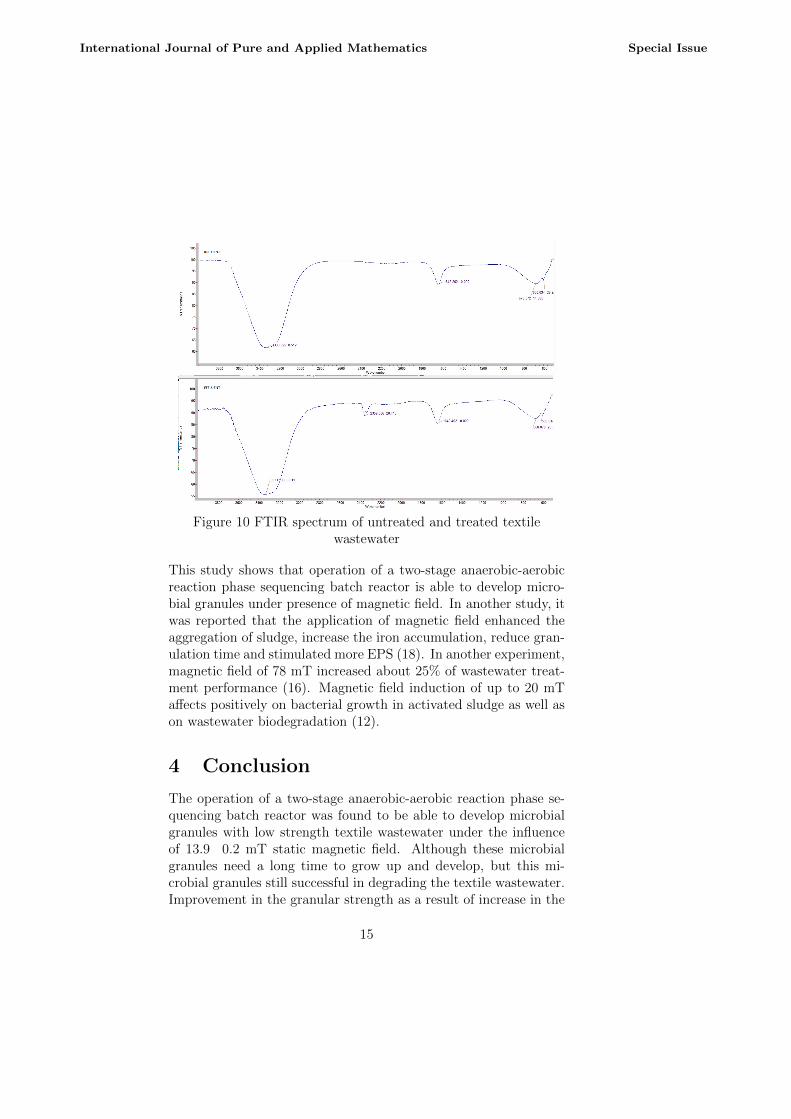
Figure 10 FTIR spectrum of untreated and treated textilewastewater
This study shows that operation of a two-stage anaerobic-aerobicreaction phase sequencing batch reactor is able to develop micro-bial granules under presence of magnetic field. In another study, itwas reported that the application of magnetic field enhanced theaggregation of sludge, increase the iron accumulation, reduce gran-ulation time and stimulated more EPS (18). In another experiment,magnetic field of 78 mT increased about 25% of wastewater treat-ment performance (16). Magnetic field induction of up to 20 mTaffects positively on bacterial growth in activated sludge as well ason wastewater biodegradation (12).
4 Conclusion
The operation of a two-stage anaerobic-aerobic reaction phase se-quencing batch reactor was found to be able to develop microbialgranules with low strength textile wastewater under the influenceof 13.9 0.2 mT static magnetic field. Although these microbialgranules need a long time to grow up and develop, but this mi-crobial granules still successful in degrading the textile wastewater.Improvement in the granular strength as a result of increase in the
15
International Journal of Pure and Applied Mathematics Special Issue
biomass concentration led to an increase in the COD, TOC andcolor removal efficiencies indicating that the process was effective.Modification of characteristic organic bonds of the textile wastewa-ter in the FTIR study indicates that biodegradation occurred. Theresults show that application of anaerobic-aerobic reaction phaseSBR strategy under the influence of magnetic field is feasible. Atthis time, it can be concluded that static magnetic field has a pos-itive effect towards the operation of a biological bioreactor.
Acknowledgements The authors would like to acknowledgethe support from Universiti Teknologi Malaysia, Ministry of Higheducation and Ministry of Science, Technology and Innovation forfinancial grant (Vot No.: 03H91).
References
[1] Paul S, Chavan S, Khambe S. Studies on characterization oftextile industrial waste water in Solapur city. InternationalJournal of Chemical Sciences. 2012;10(2).
[2] Ding H, Li Y, Lu A, Jin S, Quan C, Wang C, et al.Photocatalytically improved azo dye reduction in a micro-bial fuel cell with rutile-cathode. Bioresource technology.2010;101(10):3500-5.
[3] Waghmode TR, Kurade MB, Khandare RV, Govindwar SP.A sequential aerobic/microaerophilic decolorization of sul-fonated mono azo dye Golden Yellow HER by microbial con-sortium GG-BL. International Biodeterioration & Biodegrada-tion. 2011;65(7):1024-34.
[4] van der Zee FP, Villaverde S. Combined anaerobic-aerobictreatment of azo dyes–a short review of bioreactor studies. Wa-ter research. 2005;39(8):1425-40.
[5] Jonstrup M, Kumar N, Murto M, Mattiasson B. Sequentialanaerobicaerobic treatment of azo dyes: decolourisation andamine degradability. Desalination. 2011;280(1):339-46.
[6] Sukumar M, Sivasamy A, Swaminathan G. Decolorization oftextile dye effluent by genetically improved bacterial strains.Applied biochemistry and biotechnology. 2007;136(1):53-62.
16
International Journal of Pure and Applied Mathematics Special Issue
[7] Khalid A, Arshad M, Crowley DE. Decolorization of azo dyesby Shewanella sp. under saline conditions. Applied microbiol-ogy and biotechnology. 2008;79(6):1053-9.
[8] Ulson SMdAG, Bonilla KAS, de Souza AAU. Removal of CODand color from hydrolyzed textile azo dye by combined ozona-tion and biological treatment. Journal of Hazardous Materials.2010;179(1):35-42.
[9] Moosvi S, Madamwar D. An integrated process for the treat-ment of CETP wastewater using coagulation, anaerobic andaerobic process. Bioresource technology. 2007;98(17):3384-92.
[10] Ik M, Sponza DT. Anaerobic/aerobic treatment of a simulatedtextile wastewater. Separation and Purification Technology.2008;60(1):64-72.
[11] Sheng G-P, Yu H-Q, Li X-Y. Extracellular polymeric sub-stances (EPS) of microbial aggregates in biological wastew-ater treatment systems: a review. Biotechnology advances.2010;28(6):882-94.
[12] Ji Y, Wang Y, Sun J, Yan T, Li J, Zhao T, et al. Enhance-ment of biological treatment of wastewater by magnetic field.Bioresour Technol. 2010;101(22):8535-40.
[13] Chen H, Li X. Effect of static magnetic field on synthesis ofpolyhydroxyalkanoates from different short-chain fatty acidsby activated sludge. Bioresource technology. 2008;99(13):5538-44.
[14] Lebkowska M, Rutkowska-Narozniak A, Pajor E, Pochanke Z.Effect of a static magnetic field on formaldehyde biodegra-dation in wastewater by activated sludge. Bioresour Technol.2011;102(19):8777-82.
[15] Tomska A, Janosz-Rajczyk M. The effect of magnetic field onwastewater treatment with activated sludge method. Environ-ment Protection Engineering. 2004(4):155-60.
[16] Lebkowska M. The Influence of Static Magnetic Fields onBiodegradation of Organic Substances. Warsaw University ofTechnology Publications, Poland. 1991:13.
17
International Journal of Pure and Applied Mathematics Special Issue
[17] Santos LO, Alegre RM, Garcia-Diego C, Cuellar J. Effectsof magnetic fields on biomass and glutathione productionby the yeast Saccharomyces cerevisiae. Process Biochemistry.2010;45(8):1362-7.
[18] Wang XH, Diao MH, Yang Y, Shi YJ, Gao MM, Wang SG. En-hanced aerobic nitrifying granulation by static magnetic field.Bioresour Technol. 2012;110:105-10.
[19] Tay J-H, Pan S, He Y, Tay STL. Effect of organic loading rateon aerobic granulation. II: Characteristics of aerobic granules.Journal of environmental engineering. 2004;130(10):1102-9.
[20] Beun J, Hendriks A, Van Loosdrecht M, Morgenroth E,Wilderer P, Heijnen J. Aerobic granulation in a sequencingbatch reactor. Water research. 1999;33(10):2283-90.
[21] Ghangrekar M, Asolekar S, Joshi S. Characteristics ofsludge developed under different loading conditions duringUASB reactor start-up and granulation. Water research.2005;39(6):1123-33.
[22] Laguna A, Ouattara A, Gonzalez R, Baron O, Fama G, ElMamouni R, et al. A simple and low cost technique for deter-mining the granulometry of upflow anaerobic sludge blanketreactor sludge. Water Science and Technology. 1999;40(8):1-8.
[23] Association APH, Association AWW, Federation WPC, Fed-eration WE. Standard methods for the examination of waterand wastewater: American Public Health Association.; 1915.
[24] Schmidt JE, Ahring BK. Granular sludge formation in upflowanaerobic sludge blanket (UASB) reactors. Biotechnology andBioengineering. 1996;49(3):229-46.
[25] Zheng Y-M, Yu H-Q, Sheng G-P. Physical and chemical char-acteristics of granular activated sludge from a sequencing batchairlift reactor. Process Biochemistry. 2005;40(2):645-50.
[26] Qin L, Tay J-H, Liu Y. Selection pressure is a driving forceof aerobic granulation in sequencing batch reactors. ProcessBiochemistry. 2004;39(5):579-84.
18
International Journal of Pure and Applied Mathematics Special Issue
[27] Li Y, Liu Y. Diffusion of substrate and oxygen in aerobic gran-ule. Biochemical engineering journal. 2005;27(1):45-52.
[28] Wang Z, Liu L, Yao J, Cai W. Effects of extracellular polymericsubstances on aerobic granulation in sequencing batch reactors.Chemosphere. 2006;63(10):1728-35.
[29] Andreottola G, Foladori P, Ragazzi M. On-line control of aSBR system for nitrogen removal from industrial wastewater.Water Science and Technology. 2001;43(3):93-100.
[30] Ga C, Ra C. Real-time control of oxic phase using pH (mV)-time profile in swine wastewater treatment. Journal of haz-ardous materials. 2009;172(1):61-7.
[31] Al-Ghusain I, Hao OJ. Use of pH as control parameter foraerobic/anoxic sludge digestion. Journal of environmental en-gineering. 1995;121(3):225-35.
[32] Basseter G, Silverstein R. Spectrophotometric identification oforganic compounds. Wiley, New York. 1992:111.
[33] Zollinger H. Synthesis, properties and applications of organicdyes and pigments. Colour chemistry. New York: John Wiley-VCH Publishers; 2002.
[34] Ong S-A, Toorisaka E, Hirata M, Hano T. Decolorization ofOrange II using an anaerobic sequencing batch reactor withand without co-substrates. Journal of Environmental Sciences.2012;24(2):291-6.
19
International Journal of Pure and Applied Mathematics Special Issue