development of micro air vehicle technology with in-flight
TRANSCRIPT

October 2004
NASA/CR-2004-213271
Development of Micro Air Vehicle Technology
With In-Flight Adaptive-Wing Structure
Sergey Shkarayev, William Null, and Matthew Wagner
University of Arizona
Department of Aerospace and Mechanical Engineering, Tuscon, Arizona

The NASA STI Program Office . . . in Profile
Since its founding, NASA has been dedicated to the
advancement of aeronautics and space science. The
NASA Scientific and Technical Information (STI)
Program Office plays a key part in helping NASA
maintain this important role.
The NASA STI Program Office is operated by
Langley Research Center, the lead center for NASA’s
scientific and technical information. The NASA STI
Program Office provides access to the NASA STI
Database, the largest collection of aeronautical and
space science STI in the world. The Program Office is
also NASA’s institutional mechanism for
disseminating the results of its research and
development activities. These results are published by
NASA in the NASA STI Report Series, which
includes the following report types:
• TECHNICAL PUBLICATION. Reports of
completed research or a major significant phase
of research that present the results of NASA
programs and include extensive data or
theoretical analysis. Includes compilations of
significant scientific and technical data and
information deemed to be of continuing
reference value. NASA counterpart of peer-
reviewed formal professional papers, but having
less stringent limitations on manuscript length
and extent of graphic presentations.
• TECHNICAL MEMORANDUM. Scientific
and technical findings that are preliminary or of
specialized interest, e.g., quick release reports,
working papers, and bibliographies that contain
minimal annotation. Does not contain extensive
analysis.
• CONTRACTOR REPORT. Scientific and
technical findings by NASA-sponsored
contractors and grantees.
• CONFERENCE PUBLICATION. Collected
papers from scientific and technical
conferences, symposia, seminars, or other
meetings sponsored or co-sponsored by NASA.
• SPECIAL PUBLICATION. Scientific,
technical, or historical information from NASA
programs, projects, and missions, often
concerned with subjects having substantial
public interest.
• TECHNICAL TRANSLATION. English-
language translations of foreign scientific and
technical material pertinent to NASA’s mission.
Specialized services that complement the STI
Program Office’s diverse offerings include creating
custom thesauri, building customized databases,
organizing and publishing research results ... even
providing videos.
For more information about the NASA STI Program
Office, see the following:
• Access the NASA STI Program Home Page at
http://www.sti.nasa.gov
• E-mail your question via the Internet to
• Fax your question to the NASA STI Help Desk
at (301) 621-0134
• Phone the NASA STI Help Desk at
(301) 621-0390
• Write to:
NASA STI Help Desk
NASA Center for AeroSpace Information
7121 Standard Drive
Hanover, MD 21076-1320

National Aeronautics and
Space Administration
Langley Research Center Prepared for Langley Research Center
Hampton, Virginia 23681-2199 under Grant NAG1-03045
October 2004
NASA/CR-2004-213271
Development of Micro Air Vehicle Technology
With In-Flight Adaptive-Wing Structure
Sergey Shkarayev, William Null, and Matthew Wagner
University of Arizona
Department of Aerospace and Mechanical Engineering, Tuscon, Arizona

Available from:
NASA Center for AeroSpace Information (CASI) National Technical Information Service (NTIS)
7121 Standard Drive 5285 Port Royal Road
Hanover, MD 21076-1320 Springfield, VA 22161-2171
(301) 621-0390 (703) 605-6000
The use of trademarks or names of manufacturers in the report is for accurate reporting and does not
constitute an official endorsement, either expressed or implied, of such products or manufacturers by the
National Aeronautics and Space Administration.

Table of Contents
Page
Abstract……………………..………………………………………………………………..........3
1. Low Reynolds Number Wind Tunnel Testing of Cambered-Plate Wings……...……………...4
1.1. Airfoil Design for a Variable Camber Wing……………………………………………….4
1.2. MAV Wind Tunnel Model Construction…………………………………………………..6
1.2.1. Mold Construction………………………………………...………………………….6
1.2.2. Wing Construction…………………………………………………………………....9
1.2.3. Fuselage Construction……………………………………………………………….11
1.3. Experimental Setup…………………………………………...…………………...............13
1.4. Test Procedure……………………………………………..….……………......................16
1.5. Test Results………………….…………………………..…….…………..........................16
2. Theoretical Analysis of MAV Performance…………………....…………………………..…21
3. Design of Variable Camber MAV…………………...………………………………………..27
4. Flight Tests…...….…………………………………………………………………………....33
5. Summary…...….…………………………………………………………………………..…..33
6. References……………………………………………………………………………………..35
7. Publications……..……………………………………………………………………………..36

2

3
Abstract
This is a final report on the research studies completed under NASA Grant NAG 1-03045,
“Development of Micro Air Vehicle Technology with In-Flight Adaptrive-Wing Structure.” This
project involved the development of variable-camber technology to achieve efficient design of
micro air vehicles. Specifically, it focused on the following topics:
1) Low Reynolds number wind tunnel testing of cambered-plate wings.
2) Theoretical performance analysis of micro air vehicles.
3) Design of a variable-camber MAV actuated by micro servos.
4) Test flights of a variable-camber MAV.
The results have been disseminated in the form of papers and seminar presentations and 2
master’s theses (see the list of publications). The grant also played an important role in the
organization of the 2004 International Micro Air Vehicle Competition hosted by the University
of Arizona on April 9-10, 2004.

4
1. Low Reynolds Number Wind Tunnel Testing of Cambered-Plate Wings
Four 9-inch micro air vehicle (MAV) wind tunnel models utilizing thin, cambered-plate airfoils
with cambers of 3, 6, 9, and 12% were tested in the Low Speed Wind Tunnel (LSWT, Figure 1)
at the University of Arizona (UA). Test velocities were 5 and 10 m/s, corresponding to Reynolds
Numbers (Re) of 46 10× and 51.2 10× , respectively. Each model was tested for angle of attack,
α, ranging from approximately -10° to 32° (due to the slightly varying geometry of each model,
minimum and maximum angles of attack tested varied slightly).
Figure 1. Low Speed Wind Tunnel at the University of Arizona.
Data recorded for each test consisted of the lift, drag, and pitching moment of the vehicle about
the ¼-chord point. With this raw wind tunnel data in hand, the lift, drag, and pitching moment
coefficients (CL, CD, and CM, respectively) were computed and plotted versus angle of attack.
These plots were later used in a theoretical performance analysis of a MAV.
1.1. Airfoil design for a variable camber wing
The latest airfoil that had been designed for MAV use by the UA is designated the S5010-
TOP24C [1] and is based upon the Selig 5010 flying wing airfoil. The airfoil is a thin, cambered-

5
plate design with 6% camber and features a slight reflex in the trailing edge to reduce the
strength of the inherent, negative pitching moment. It was originally thought that the negative
pitching moment could easily be compensated for by a slight amount of up-elevator deflection on
an actual flying model. However, flight tests of MAVs implementing this airfoil proved
otherwise. The negative pitching moment could be compensated for but it took large up-elevator
deflections to do so. The result was increased drag and a substantially reduced endurance.
To remedy the situation, the reflex in the airfoil was increased using a trial-and-error approach.
A small amount of reflex was added and a flight test was performed to evaluate the flight
characteristics of the modified airfoil. After three successive reflex iterations (all completed
within two days), the proper amount of reflex was found. The result was an MAV that could
attain straight and level flight with minimal, if any, up-elevator deflection and substantially
increased endurance. The modified version of the airfoil is designated S5010-TOP24C-REF
(Figure 2) and has been successfully used on all flying MAVs developed at the UA since 2003.
Figure 2. S5010-TOP24C-REF airfoil with 6% camber.
Airfoils of 3, 6, 9 and 12% camber were employed in the study and the airfoil geometrical data is
presented in Table 1. All of the wind tunnel models tested were based upon the same S5010-
TOP24C-REF airfoil and represented, as close as possible, an accurate model based upon the
mechanics of an actual in-flight adaptive wing MAV. This means that if a 3% cambered-plate
wing was physically deformed to now have 6% camber, the 6% camber wind tunnel model wing
would realistically represent the 3% cambered wing that was deformed into 6% camber. Because
of this, all wind tunnel models had identical wetted areas (the true, wetted surface area of the top

6
surface was 60 in2 for all models) and different projected areas. The difference in projected areas
is due to the decreased chord length seen when an increase in camber is induced.
The process of creating the different cambered airfoil shapes was fairly straightforward and done
using a JAVA-based program called JavaFoil [2]. In this program, airfoil coordinates are entered
and the geometry easily modified by simply entering new parameters (camber, chord, etc.). The
modified airfoil coordinates are then produced; they are easily copied and pasted into Microsoft
Excel for plotting and the subsequent printing of templates.
Camber (%) Chord, c (in) Camber height, δ
(in)
Thickness, t (in)
3 8.187 0.246 0.01
6 8.125 0.487 0.01
9 7.969 0.717 0.01
12 7.750 0.930 0.01
Table 1. Wind tunnel model airfoil data. All models have wetted top surface areas of 60 in2.
1.2. MAV wind tunnel model construction
In this section, the entire process used to construct a wind tunnel model is described in detail. It
includes the mold, wing, and fuselage construction process.
1.2.1. Mold construction
The physical construction of the MAV wind tunnel models started with the design and
construction of the molds for the different cambered wings. To construct a mold, a full-sized
paper template of the airfoil was created, printed, cut out, and then traced onto 1/64-inch birch
plywood. The airfoil shape was then cut out of the plywood, sanded smooth, and two holes were
drilled into it to aid in the subsequent foam mold cutting process (Figure 3). Two such plywood
templates were produced for each camber.

7
Figure 3. Plywood airfoil template (6% camber) used for wing and fuselage mold
construction.
Then, a 12 12 12× × -inch piece of high-density “pink foam” (extruded polyethylene) was cut
from a larger block and the two plywood airfoil templates were secured to opposite sides of the
block of pink foam using spray-on adhesive and small self-tapping screws (Figure 4).
Figure 4. Plywood airfoil template secured to hi-density foam used to make
wing/fuselage molds.
At this point the block of foam is secured to the cutting table with tape so that it does not move
or slip during the cutting process. Then, a foam-cutting hotwire was used to cut the airfoil shape
into the pink foam mold. To do this, a DC voltage is fed to the hotwire and, as a result, it heats
up. The voltage is adjusted so that the wire cuts the foam easily without being so hot that the
foam burns and smokes during the cutting process. With the wire at the proper temperature, it
was placed into the foam and carefully guided along the plywood airfoil templates (Figure 5)
until the entire airfoil was cut out and the foam block was cut completely in half.

8
Figure 5. Cutting of foam mold with hotwire.
With this process complete, male and female molds of each camber are obtained (Figure 6).
Slight imperfections in the molds due to the hotwire cutting process were then sanded out using
100-grit sandpaper.
Figure 6. Male and female wing molds produced from the hotwire cutting process.

9
1.2.2. Wing Construction
The wings of the MAV wind tunnel models are made from one sheet of 6 oz/yd2 bi-directional
carbon-fiber cloth laminated with epoxy resin and are constructed using the female airfoil mold.
Either the female or male mold could have been used, but the female mold was selected because
it results in a smooth surface on the top of the finished wing. The wing construction process
begins with the cutting of an approximately 10 10× -inch sheet of the carbon fiber cloth. Also, a
piece of vacuum-bag plastic is affixed to the mold using spray adhesive so that the epoxy resin
does not stick to the foam, making the wing easy to remove from the mold when cured. With
these two steps complete, the epoxy resin and hardener are mixed and the piece of carbon-fiber
cloth is laid into the mold and laminated with the epoxy using a small plastic squeegee. Care is
taken at this time to remove any excess resin from the carbon cloth so that the wing is as thin,
smooth, and clean as possible when it has finished curing.
At this point a piece of porous “peel ply” is placed over the laminated (yet still uncured) wing
and paper towels are placed on top of the peel ply. With this system, any excess epoxy in the
wing is squeezed out through the peel ply during the vacuum-bagging process and is absorbed by
the paper towels, resulting in a thin, clean and lightweight wing (extremely important for an
actual flying model). Then the mold and laminated wing are wrapped in a layer of breather cloth
and placed into the vacuum bag. The breather cloth allows air to circulate over and around the
mold evenly so that an even pressure is applied to the wing in all places during the curing
process. With the wing and the mold in the bag, the vacuum pump is turned on and the ends of
the bag are sealed. The vacuum in the bag is set to approximately 6-7 lb/in2 and the wing is
allowed to cure at least 6 hours. At a vacuum setting of 6-7 lb/in2, the wing is sufficiently and
evenly compressed into the mold and the foam mold is safe from crushing or deforming under
the pressure (Figure 7).

10
Figure 7. Mold and laminated wing are put into a vacuum bag and allowed to cure for a
period of at least 6 hours under 6-7 psi of vacuum.
When the wing has finished curing, the mold is removed from the vacuum bag and all of the
excess layers of material (peel ply, paper towels, and breather cloth) are peeled off of the wing.
With the wing blank still affixed to the mold, a paper planform template is placed over the
carbon material and is traced onto it. Then the carbon is removed from the mold and the wing
planform is cut from the blank using a pair of scissors. At this point the basic wing is complete
(Figure 8).
Figure 8. Carbon fiber wing after it has been removed from the vacuum bag and cut out
into proper planform shape.

11
1.2.3. Fuselage Construction
The fuselage of the MAV wind tunnel models are constructed out of the same carbon fiber cloth
that the wings are made from, and begins with the construction of a male fuselage “plug” mold
that is carved and sanded out of balsa wood (Figure 9). The construction of the balsa fuselage
mold is a labor-intensive job but once complete, the same mold can be used over and over again
in the fuselage construction process. When sanding the balsa fuselage mold, extreme care and
precision is used so that all surfaces are smooth and aerodynamic as well as straight and even.
Figure 9. Hand-carved and sanded balsa wood fuselage plug.
Once the fuselage mold is complete, it is coated with an extremely thin layer of release agent (a
paste wax) and allowed to dry. When dry the wax is buffed-out with a cloth (similar to waxing
an automobile) so that it is smooth and even. At this point the fuselage mold is placed on the
same female wing mold that was used to construct the wing. Proper placement of the balsa
fuselage mold on the wing mold is very important so that the fuselage-to-wing mating surface
exactly matches the curvature of the wing at the proper position near the leading edge. With this
step complete, a piece of carbon fiber cloth is cut out (approximately 6 6× -inch) and is
laminated on a non-stick smooth surface such as on a piece of vacuum bag material placed on a
table. In a similar fashion as the wing construction process, any excess resin is removed from the
material using a plastic squeegee. At this point the piece of laminated carbon is placed over the
balsa fuselage mold and is carefully molded to the balsa plug and wing mold (Figure 10).

12
Figure 10. Carbon-fiber laminated to balsa fuselage plug.
Same as the wing, the fuselage is allowed to cure for a time period of at least 6 hours. At the end
of the curing process, the formed fuselage is removed from the wing mold, and the balsa fuselage
mold is carefully pried from the carbon fuselage shell. At this point any excess material is cut off
from the fuselage, making the basic fuselage complete (Figure 11).
Figure 11. Completed carbon fiber fuselage.
At this time all that remains is assembling the wing and fuselage pieces together utilizing a
unique carbon rod-and-tube hinge, as well as building a small wooden pylon mount (Figure 12)
and attaching the carbon fiber stinger to make the entire wind tunnel model complete.

13
Figure 12. Completed wind tunnel model showing wooden pylon mount and hinge-
mounted fuselage.
1.3. Experimental setup
The LSWT is a suction-based design, with the fan at the end of the diffuser, capable of
producing velocities up to approximately 50 meters per second, and has a 3 ft. by 4 ft. test
section. A schematic of the tunnel is seen in Figure 13. It is a low-turbulence wind tunnel rated at
a 0.3% turbulence level in the axial direction.
Figure 13. Suction-based design of the LSWT.

14
Wind tunnel models are mounted to a pylon that protrudes from the floor of the wind tunnel test
section, which is subsequently connected to a precision force-balance system located underneath
the tunnel itself. Angles of attack can be varied either by manual means or by an electronically
operated pitch control rod that connects to the rear of the wind tunnel model (Figure 14).
Figure 14. From left to right: mounting pylon, force balance, and pitch rod of the LSWT.
The force-balance system contains six precision strain gauges: three in the vertical direction
(measuring lift and pitching moments), two in the spanwise direction (measuring side forces and
rolling moments), and one in the flow direction (measuring thrust and drag). At this time the two
strain gauges in the spanwise direction were not used in this sequence of tests.
The data acquisition system (DAQ) utilizes a National Instruments low-noise SCXI-1000 chassis
that is capable of sampling rates up to 333,000 samples per second for each DAQ device. The
acquisition devices themselves are two National Instruments SCXI-1321 terminal blocks (Figure
15). National Instruments LabView 6.0 software provides the user interface and is used for
sampling the data from the DAQ devices and permanently writing the sampled data to a
Microsoft Excel spreadsheet for later aerodynamic analysis.

15
Figure 15. National Instruments data acquisition hardware.
For this series of tests, MAV models were mounted to the pylon at the ¼-chord point of the
vehicle. A 1/8-inch diameter carbon-fiber tube was attached to the rear of the model to act as a
“stinger” for the pitch rod attachment. In this way, the angle of attack of the vehicle could be
electronically controlled to facilitate the testing procedure. A completed wind tunnel model
mounted in the tunnel is seen in Figure 16.
Figure 16. 12%-camber wind tunnel model mounted and ready to test.

16
1.4. Test procedure
After the MAV model was mounted in the tunnel, the pitch rod was placed in its “home”
position, that is, at it uppermost limit of travel. In this position, the MAV model was in its most
negative angle of attack. At this point the initial angle of attack was measured using a precision
bubble-level and recorded. At this point the test section was sealed up and the testing sequence
began.
At first tares were taken on all DAQ channels (zeroed) for a period of 10 seconds so that the
model weight and any other associated forces present in the equipment would not be associated
with forces produced by the model during testing. With the tares taken, the tunnel was started
and the tunnel velocity was brought up to the testing velocity of either 5 or 10 m/s depending
upon which test was being run at the time. When the tunnel velocity had stabilized, the data
acquisition process was initiated by clicking on a virtual LabView button designated for the data
taking process. During the data acquisition process, each channel was sampled at a rate of 1000
samples per second for a period of 10 seconds, and the forces were averaged and recorded. At
the end of the 10-second sampling period, the angle of attack of the model was increased by 1.3°,
corresponding to two “clicks” of the electronically-actuated pitch rod mechanism. The sampling
process was then repeated for each angle of attack until the pitch rod mechanism had reached the
limit of its travel. When the last measurement had taken place, the test was completed by
clicking on a virtual LabView button designated for the task, and at his point the data was
automatically written to a Microsoft Excel spreadsheet for later computations and analysis. It
should be noted that during the entire testing sequence the dynamic pressure was closely
monitored so that it could be kept extremely constant with the hand-operated fan RPM control
unit. This identical testing sequence was performed on each of the four different cambers at
velocities of both 5 and 10 m/s, corresponding to Reynolds Numbers of 6x10⁴ and 1.2x10⁵,
respectively.
1.5. Test results
Using the raw wind tunnel data (including the dynamic pressure) as well as the model geometry,
the lift, drag, and pitching moment coefficients about the ¼-chord point were computed for each
camber and for each Re:

17
20.5L
LC
V Sρ= (1)
20.5D
DC
V Sρ= (2)
20.5M
MC
V Scρ= (3)
where c is the mean aerodynamic chord measured along the longitudinal axis of the wing.
The plots can be seen in Figure 17. Looking at the plots, it is immediately noticeable that the 10
m/s data, for all cambers, is cleaner than the data taken at 5 m/s. The reason for this is likely one
of strain gauge sensitivity. At a velocity of 5 m/s the aerodynamic forces produced by a vehicle
of this size are very small and are not as easily resolved than at 10 m/s. But, even though the data
is somewhat scattered in the 5 m/s plots, the overall trends are visible and much useful and
insightful information can be gained from them.
It is also noticeable that the 3% camber model did not reach the stall angle of attack during this
test sequence. As mentioned previously, due to the slight geometry differences between each
different cambered model, the angle of attacks tested for each camber were not completely
uniform. Again, for analysis purposes (particularly for high-speed flight and endurance analysis)
it is not imperative that the stall angle of attack be reached. Also seen from the data is that the
3% and 6% airfoils exhibited substantially higher maximum lift coefficients when tested at the
higher Re compared to the lower velocity. But it is interesting to note that the 9% and 12%
cambers had very similar maximum lift coefficients at the two different Reynolds numbers. This
may imply that the higher cambers are more efficient at the lower velocities.
18
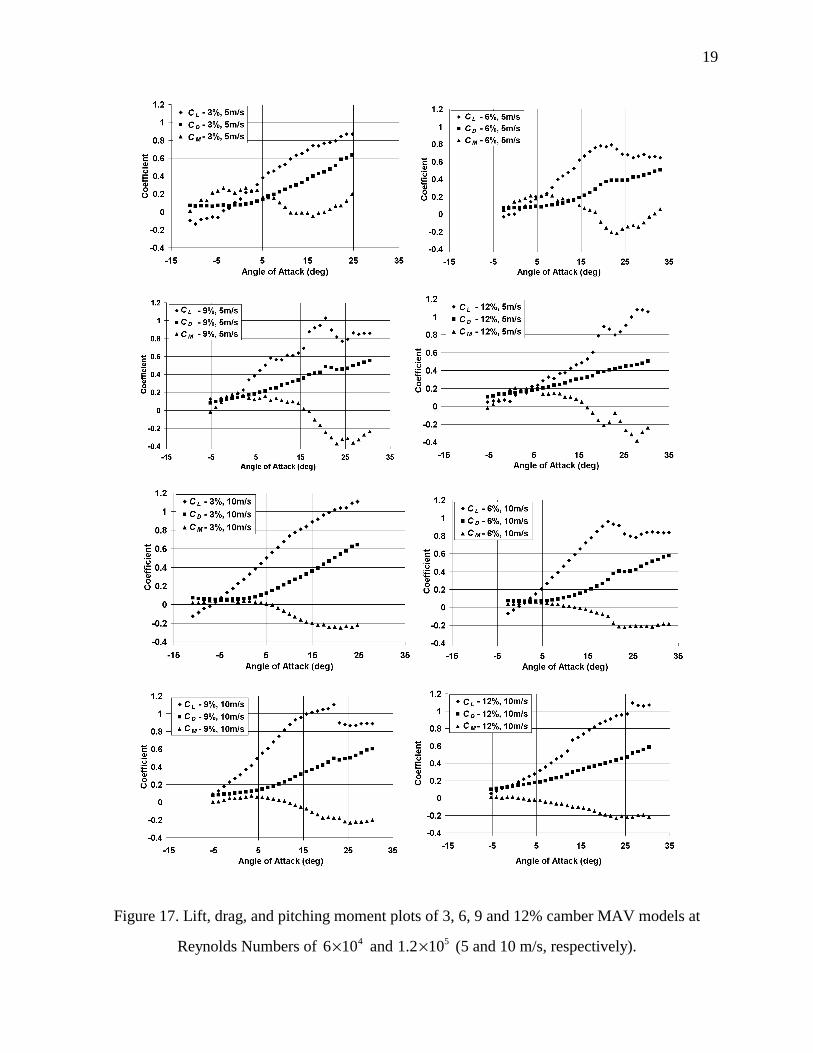
Also of interest is the behavior of the pitching moment coefficient about the ¼-chord point,
particularly for the 5 m/s data for the 9 and 12% cambers. It can be seen that at high angles of
attack the pitching moment is quite strong in the negative, nose-down direction for the two
higher cambers. In relation to an adaptive wing micro air vehicle, this phenomenon could be
quite useful for recovery from stall or near stall situations. For example, if an adaptive wing
MAV was flying at a camber setting of 6% and a wind gust rapidly increased the angle of attack
to stall or near stall levels, a rapid increase of wing camber (to say 9 or 12%) would induce a
large nose-down pitching moment to the aircraft. This increased negative pitching moment
would tend to “nose over” the MAV and help it recover from the stall situation. However, the
dynamic behavior of an adaptive wing MAV has not yet been studied, and the effectiveness of
this theoretical stall recovery technique has not been validated. To do so, dynamic wind tunnel
testing will need to be completed as well as actual adaptive wing MAV flight tests. Flight tests
would involve bringing the MAV up to the stall point while at a lower camber setting and
inducing a rapid increase of wing camber. Both land-based and onboard MAV camera footage
would be analyzed for the camber change effectiveness. In addition, pilot control inputs during
the stall and stall recovery operation would be recorded on laptop computer for later analysis.
19
Figure 17. Lift, drag, and pitching moment plots of 3, 6, 9 and 12% camber MAV models at
Reynolds Numbers of 46 10× and 51.2 10× (5 and 10 m/s, respectively).

20
The lift-to-drag ratios of each camber were also plotted and analyzed. From the plots (Figure 18)
it is seen that at the higher Re the 3% camber wing performs the best. At the lower Re the 6%
camber was the best performer.
Figure 18. Lift-to-drag ratios of the four cambers.
Upon close inspection of the L/D plots an interesting trend can be seen. At low angles of attack
the 3% camber has the best L/D. At intermediate angles of attack the 6% camber is best, and so
on. At the lower test velocity it can be seen that the 12% camber model has a much better L/D
than the other cambers at angles of attack near the stall point.
Another interesting note is that the 9% camber wing does not seem to be showing the same trend
in the L/D curves. It never has the highest lift-to-drag ratio at any angle of attack or at either Re.
Notice that at both Reynolds numbers the highest L/D of the 9% camber is at approximately 7°

21
α. That angle of attack is between the angle of attack at the point of highest L/D for the 3% and
6% camber wings. It seems that if the 9% camber model behaved as “expected” that its highest
L/D would be somewhere near 17° of α. At this point it is unclear what is causing these results or
if they are normal. More testing is needed to help clarify what is truly happening.
2. Theoretical analysis of MAV performance
With the aerodynamic data from the wind tunnel tests, both for the wing/fuselage combination
and the motor/propeller combination (from a previous test1), a model of the performance
characteristics of various cambered micro air vehicles can be obtained.
The first step in the analysis was to describe, in closest approximation, the lift and drag
characteristics of the vehicle. From Figure 17, it can be seen that the lift curve slopes, LCα
, up to
the stall points are approximately constant. Using linear approximations of the aerodynamic data
in Figure 17, formulas were obtained for the lift curve slopes and intercepts of the different
cambers up to the stall angles of attack for each camber.
To describe the drag characteristics, 2nd-order polynomials were fit to the drag data seen in
Figure 16. Coefficients of these approximations for the 5 and 10 m/s data are presented in Tables
2 and 3, respectively.
2nd Order Coefficient 1st Order Coefficient Intercept
Lift Curve 3% n/a 0.0318 0.1745
Lift Curve 6% n/a 0.0395 0.0141
Lift Curve 9% n/a 0.0360 0.2119
Lift Curve 12% n/a 0.0319 0.0886
Drag Curve 3% 0.00006 0.0088 0.0935
Drag Curve 6% 0.00008 -0.0026 0.0703
Drag Curve 9% 0.00030 0.0100 0.1318
Drag Curve 12% 0.00010 0.0088 0.1466
Table 2. Coefficients used in lift and drag curve approximations for 5 m/s data. Lift curve slopes
were only approximated up to the stall angles of attack for each camber.

22
2nd Order Coefficient 1st Order Coefficient Intercept
Lift Curve 3% n/a 0.0374 0.2868
Lift Curve 6% n/a 0.0484 0.0078
Lift Curve 9% n/a 0.0408 0.3093
Lift Curve 12% n/a 0.0324 0.1789
Drag Curve 3% 0.00006 0.0085 0.0780
Drag Curve 6% 0.00008 -0.0035 0.0666
Drag Curve 9% 0.00050 0.0065 0.0994
Drag Curve 12% 0.00020 0.0086 0.1384
Table 3. Coefficients used in lift and drag curve approximations for 10 m/s data. Lift curve
slopes were only approximated up to the stall angles of attack for each camber.
Then, a determination of the amount of propulsive lift available was needed. Since in the actual
flight vehicle, the motor is mounted so that the thrust line is parallel to the chord line, the amount
of propulsive lift acting is directly related to the dynamic thrust available at a specified velocity
and the angle of attack of the airframe by the equation
sinprop dynL T α= (4)
where Lprop is the propulsive lift, Tdyn is the dynamic thrust, and α is the angle of attack (Fig. 19).
Likewise, it is seen in Figure 19 that the propulsive thrust, Tprop, is found from
cosprop dynT T α= (5)
With the dynamic thrust separated into its axial and normal components, it is possible to develop
two equations for the MAV during steady, level flight. Again referencing Figure 19, equating
forces in the axial direction, the following equation results:

23
propT D= (6)
where D is the total drag acting on the MAV (airframe plus motor and propeller drag). Equating
forces in the normal direction yields
wing propL L W+ = (7)
where Lwing is the aerodynamic lift and W is the weight. Since the dynamic thrust Tdyn,
aerodynamic lift Lwing, and the total drag D all depend upon the flight velocity V∞ an iterative
process was used to find the flight velocity that would satisfy equations (4) and (5)
simultaneously. With the flight velocity at each angle of attack established, power required and
power available curves can be constructed with the help of the following:
reqP DV= (8)
and
avail propP T V= (9)
where Preq and Pavail are the required and available power, respectively.
Figure 19. Force vector model of MAV during steady, level flight.

24
For all aircraft, and particularly for the typically short-endurance MAV, it is desirable to
minimize power consumption during all stages in the flight in order to maximize the endurance
of the aircraft. To do this, the flight speed corresponding to minimal power consumption is
found. At this optimum flight speed, the power available and power required curves will be
tangent to each other. To determine this speed, the thrusts versus velocity equations determined
previously1 were used in conjunction with a varying static thrust. The idea was to decrease the
amount of static thrust until the power available and required curves were tangent. This process
was completed for the four different cambers, and plots were constructed (Fig. 20).
It was found that at a nearly constant static thrust setting (corresponding to a fixed motor throttle
position and fixed power consumption), that flight speed could be reduced from nearly 6.5 to 4.5
m/s (near stall), simply by increasing the camber from 6 to 12% (Figure 20). This is a 30%
reduction in flight speed that could be attained from a simple, in-flight camber change from 6 to
12%.
25
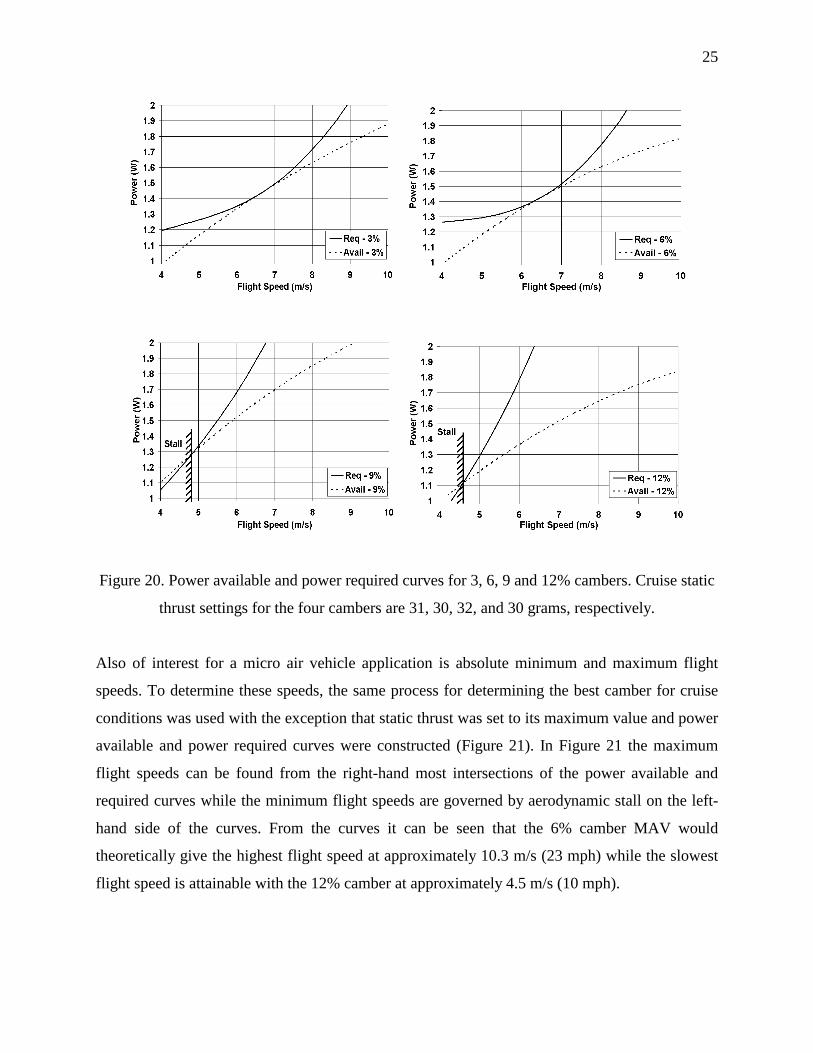
Figure 20. Power available and power required curves for 3, 6, 9 and 12% cambers. Cruise static
thrust settings for the four cambers are 31, 30, 32, and 30 grams, respectively.
Also of interest for a micro air vehicle application is absolute minimum and maximum flight
speeds. To determine these speeds, the same process for determining the best camber for cruise
conditions was used with the exception that static thrust was set to its maximum value and power
available and power required curves were constructed (Figure 21). In Figure 21 the maximum
flight speeds can be found from the right-hand most intersections of the power available and
required curves while the minimum flight speeds are governed by aerodynamic stall on the left-
hand side of the curves. From the curves it can be seen that the 6% camber MAV would
theoretically give the highest flight speed at approximately 10.3 m/s (23 mph) while the slowest
flight speed is attainable with the 12% camber at approximately 4.5 m/s (10 mph).

26
It is interesting to note that even though the 3% camber wing (tested at 10 m/s) had the highest
lift-to-drag ratio, it does not exhibit the highest overall flight speed. The reason for this can be
explained by examining Figure 18 a little more closely. Note in Figure 18 that the 3% camber
wing (in the 10 m/s data) has its maximum L/D at a very low angle of attack of only 2 or 3
degrees. Because of this low angle of attack, the lift coefficient at this point is also quite low
(only about 0.3). This low lift coefficient naturally translates into a higher required flight velocity
but this higher velocity is not the most optimum for the motor/propeller combination under
examination. The propeller used on this combination has a relatively low pitch and is not well
suited for high-speed use. To make use of the higher lift-to-drag ratio of the 3% camber wing, a
custom designed propeller with a higher pitch would have to be implemented. Doing so though
would result in an MAV with a higher overall flight speed. However, low-speed flight would
suffer accordingly.
Figure 21. Minimum and maximum flight speeds at full thrust (100% input power). Fastest speed
attainable is approximately 10.4 m/s (23 mph) with the 6% camber wing. Minimum speed is
approximately 4.5 m/s (10 mph) with the 12% camber wing.

27
3. Design of a Variable Camber MAV
This section will outline the design of a variable camber MAV. Basic conclusions about
performance changes due to camber changes are drawn from test flight data. The variable
camber MAV is shown in Figure 22.
Figure 22. The variable-camber MAV.
While the MAV provided the basic platform from which to work with, it would need to be
modified in order to perform the camber changing operations. The basic premise was to modify
the existing design to create an MAV capable of changing its camber in-flight from 3% to 9% of
chord. Much of the MAV’s look and characteristics would be identical to the MAV after the
switch to a camber-changing wing; however, several issues would have to be addressed to
integrate the changes into a successful flying machine.
Addition of a third servo is the means by which the MAV’s camber is changed during flight. It
is mounted on the underside of the MAV’s wing (Figure 22). The camber change control horn is
attached to the inflection point of the wing’s airfoil. This causes the camber change to be
tailored so that the wing’s maximum camber point remains close to 24% of chord rather than

28
simply deflecting the trailing edge of the wing down. Strictly pulling down the trailing edge
results in a large nose-down pitching moment, which is undesirable. Carbon braces prevent
bending over the middle of the wing and encourage the maximum camber to occur at the desired
point. Reflex in the airfoil must also then be increased to avoid large increases in pitching
moment.
To combat increasing pitching moment during camber increase, the elevator compensates by
adding reflex to the wing. The elevator’s control rod is fixed in length. Since the elevator servo
is attached to the wing as well, when the camber servo contracts the wing the control rod pushes
the elevator upwards (Figure 23). The aircraft has just the right amount of reflex at its 3% and
9% camber modes by virtue of mixing accomplished in the digital Futaba T6XA transmitter.
While the elevator depends on the camber change for adjusting its reflex, it is essential that the
rudder does not deflect when the camber of the wing is adjusted in flight. Therefore, the rudder
servo and the vertical tail were attached to the fuselage. This ensures that their functions are
independent of any camber increase in the wing (Figures 24-26). The geometry of the vertical
tail is such that it can accommodate an increase in camber of up to 9%.

29
Figure 23. Close-up view of MAV components.
Figure 24. MAV at 3% and 9% camber

30
Figure 25. Opened Variable Camber MAV
If the camber of the MAV’s wing had been changed during flight, a large, drag-inducing gap
would have formed between the wing and the fuselage. This was removed by employing a two-
layer fuselage (Figure 25). The outer layer, a complete fuselage, was molded at the maximum
camber to which the wing would be deflected, 9%. The inner fuselage serves as a flap that
closes the gap that opens when the wing is contracted. The inner layer was the bottom 0.75-inch
portion of a fuselage, also molded at 9%. The inner layer had two slits cut in each side of it at
regular intervals, and was then spread out and attached to a 3% wing that was still attached to the
mold. This was done so that when the 3% wing was deflected to 9% camber, the slits in the
inner fuselage would close up, reducing drag (Figure 26). This is a simple, yet effective method
of solving the geometry problem of a wing that changes shape that is attached to a fixed-
geometry fuselage.

31
Figure 26. Inner fuselage flap function.
The construction methods and components used to create the variable camber MAV are
presented in the Table 4.
Component Description Mass (g)
Engine and propeller Maxon Re-10 w/ Union-80 11.5
2 lithium polymer prismatic batteries Kokam KOK-145 11.0
3 micro servos Hitec HS-50 sub-micro 8.7
R/C receiver Skyhooks & Rigging RX-72 3.0
Structure/fuselage/connectors/etc. 38.6
Total 72.8
Table 4. Components of the variable camber MAV.

32
Figure 27. Three-Views of a Variable Camber MAV.
A significant increase in structural weight for a 9-inch MAV is present due to the presence of the
inner fuselage and devices for tailoring of the camber change in the wing. The placement of

33
MAV components is found in Figure 27. The variable camber MAV weighs more than its closely
related predecessor, however its wing loading is such that the aircraft remains flyable. Future
iterations will benefit from the past experience of the builders, leading to lighter incarnations of
the design. For now, the current MAV was tested for flight velocity differences due to varying
camber during flight.
4. Flight Tests
Flight tests were conducted in an outdoor park. The aircraft was flown at minimum and
maximum cambers between two flags, 60 feet apart. Velocity was determined by noting the time
it took to fly between the flags on a digital video camera. Readings were backed up by use of a
K-band radar gun. Due to wind gusts in open air, however, flight speeds at each camber varied
and led to inconclusive results. Speed differences between the maximum and minimum cambers
are thought to be only a few miles per hour. Since wind gusts varied in speed over this
magnitude, results were affected adversely. Future tests should be conducted in a controlled
environment, such as a large gymnasium, or through the averaging of numerous consecutive
flights in a similar variable-wind speed environment.
The current variable camber MAV should be copied and another iteration built. This MAV
should be made lighter and incorporate the lessons learned in the building and testing of the first
aircraft. This will reduce the wing loading and give it more controllable flight characteristics.
The flight-testing methods should also be re-evaluated to ensure a controlled environment in
which to fully demonstrate the varying of airspeed due to changing of camber in flight.
Employing these items will then effectively demonstrate the usefulness of a variable camber
MAV.
5. Summary
Micro Air Vehicles (MAVs) have evolved swiftly in the past few years. Through much iteration,
a common design for the typical successful MAV emerged as a disc-like wing that maximizes
wing area for a given linear dimension with a fuselage and vertical tail mounted on the wing’s
underside. Since MAVs must have a low wing loading to be able to fly slow enough to remain
controllable, the MAV must be designed with the maximum wing area for the aircraft weight.

34
While component weights continue to decrease, the issue that MAVs have mission segments
with conflicting design requirements remains to be effectively addressed. Most MAVs are
envisioned for use in surveillance applications. It follows that the aircraft should travel to the
target as quickly as possible, loiter at slow speeds, and return to the point of origin quickly as
well. One method of slowing an aircraft for loitering is to increase the angle of attack and
increase the power to the engine to avoid losing altitude. Since MAVs are power-limited, such a
maneuver would result in a near-stall situation. An intelligent solution is to change the shape of
the wing in mid-flight to increase the coefficient of lift. This will allow the MAV to continue to
generate the same amount of lift while flying at a slower speed.
Four 9” micro air vehicle wind tunnel models utilizing thin, cambered-plate wings of 3, 6, 9 and
12% were tested in the Low Speed Wind Tunnel at the University of Arizona at speeds of 5 and
10 m/s, corresponding to Reynolds numbers of 6x10⁴ and 1.2x10⁵, respectively. Angle of attack
ranged from approximately –10 to 32°. It was found that the highest L/D was for the 10 m/s data
was obtained with the 3% camber, while the highest L/D for the 5 m/s data was obtained with the
6% camber.
A theoretical MAV performance analysis to determine the best cambers for maximum endurance
as well as overall maximum and minimum flight speeds were completed with the help of
previous results of motor and propeller thrust and drag testing. For maximum endurance and
high-speed flight it was found that the 6% camber wing provided the best results, while for
minimum flight speed the 12% camber wing was best suited. Maximum flight speed of the 6%
camber MAV was determined to be approximately 10.3 m/s (23 mph) and minimum flight speed
of the 12% camber MAV was determined to be approximately 4.5 m/s (10 mph) near the stall
point of the aircraft. For maximum endurance on the 6% camber MAV a static thrust of
approximately 30 grams is needed.
An extra servo has been added to affect camber changes in the wing. A large increase in
structural weight for a 9-inch MAV is present due to the presence of the inner fuselage and
devices for tailoring of the camber change in the wing.

35
Flight tests were conducted in an outdoor park. The aircraft was flown at minimum and
maximum cambers between two flags, 60 feet apart. Velocity was determined by noting the time
it took to fly between the flags on a digital video camera. Readings were backed up by use of a
K-band radar gun. Due to wind gusts in open air, however, flight speeds at each camber varied
and led to inconclusive results.
6. References
[1] W. Null, M. Wagner, S. Shkarayev, W. Jouse, and K. Brock, “Utilizing Adaptive Wing
Technology in the Control of a Micro Air Vehicle”, in Smart Structures and Materials 2002:
Industrial and Commercial Applications of Smart Structures Technologies, Anna-Maria R.
McGowan, Editor, Proceedings of SPIE Vol. 4698, pp. 112-120 (2002).
[2] M. Hepperle, “JavaFoil – Analysis of Airfoils”, 1986-2003, URL: http://www.mh-
aerotools.de/airfoils/javafoil.htm.

36
7. Publications
W. Null, and S. Shkarayev, “Effect of Camber on the Aerodynamics of Adaptive Wing Micro
Air Vehicles,” 2nd AIAA Flow Control Conference, Portland, Oregon, AIAA 2004-2694, 10 p.,
28 Jun - 1 Jul 2004.
S. Shkarayev, Adaptive Wing Micro Air Vehicles, 2003 Bioflight Workshop, NASA Langley,
August 7-8, 2003.
W. Null, The Design and Development of an Adaptive Wing Micro Air Vehicle, Master of
Science Thesis, The University of Arizona, 2003, 126 p.
M. Wagner, Design and Performance Analysis of Micro Air Vehicle, Master of Science Thesis,
The University of Arizona, 2003, 129 p.

REPORT DOCUMENTATION PAGE Form ApprovedOMB No. 0704-0188
2. REPORT TYPE
Contractor Report 4. TITLE AND SUBTITLE
Development of Micro Air Vehicle Technology With In-FlightAdaptive-Wing Structure
5a. CONTRACT NUMBER
6. AUTHOR(S)
Shkarayev, Sergey; Null, William; and Wagner, Matthew
7. PERFORMING ORGANIZATION NAME(S) AND ADDRESS(ES)
NASA Langley Research Center The University of ArizonaHampton, VA 23681-2199 Department of Aerospace and Mechanical Engineering Tuscon, AZ 85721
9. SPONSORING/MONITORING AGENCY NAME(S) AND ADDRESS(ES)
National Aeronautics and Space AdministrationWashington, DC 20546-0001
8. PERFORMING ORGANIZATION REPORT NUMBER
10. SPONSOR/MONITOR'S ACRONYM(S)
NASA
13. SUPPLEMENTARY NOTESLangley Technical Monitor: Martin R. WaszakAn electronic version can be found at http://techreports.larc.nasa.gov/ltrs/ or http://ntrs.nasa.gov
12. DISTRIBUTION/AVAILABILITY STATEMENTUnclassified - UnlimitedSubject Category 05Availability: NASA CASI (301) 621-0390 Distribution: Nonstandard
19a. NAME OF RESPONSIBLE PERSON
STI Help Desk (email: [email protected])
14. ABSTRACT
This is a final report on the research studies completed under NASA Grant NAG 1-03045, “Development of Micro Air Vehicle Technology with In-Flight Adaptrive-Wing Structure.” This project involved the development of variable-camber technology to achieve efficient design of micro air vehicles. Specifically, it focused on the following topics: 1) Low Reynolds
number wind tunnel testing of cambered-plate wings. 2) Theoretical performance analysis of micro air vehicles. 3) Design of a
variable-camber MAV actuated by micro servos. 4) Test flights of a variable-camber MAV.
15. SUBJECT TERMS
Micro air vehicle; Adaptive structures; Aircraft morphing; Low reynolds number aerodynamics; Variable camber wing
18. NUMBER OF PAGES
41
19b. TELEPHONE NUMBER (Include area code)
(301) 621-0390
a. REPORT
U
c. THIS PAGE
U
b. ABSTRACT
U
17. LIMITATION OF ABSTRACT
UU
Prescribed by ANSI Std. Z39.18Standard Form 298 (Rev. 8-98)
3. DATES COVERED (From - To)
5b. GRANT NUMBER
NAG1-030455c. PROGRAM ELEMENT NUMBER
5d. PROJECT NUMBER
5e. TASK NUMBER
5f. WORK UNIT NUMBER
23-762-65-A
11. SPONSOR/MONITOR'S REPORT NUMBER(S)
NASA/CR-2004-213271
16. SECURITY CLASSIFICATION OF:
The public reporting burden for this collection of information is estimated to average 1 hour per response, including the time for reviewing instructions, searching existing data sources, gathering and maintaining the data needed, and completing and reviewing the collection of information. Send comments regarding this burden estimate or any other aspect of this collection of information, including suggestions for reducing this burden, to Department of Defense, Washington Headquarters Services, Directorate for Information Operations and Reports (0704-0188), 1215 Jefferson Davis Highway, Suite 1204, Arlington, VA 22202-4302. Respondents should be aware that notwithstanding any other provision of law, no person shall be subject to any penalty for failing to comply with a collection of information if it does not display a currently valid OMB control number.PLEASE DO NOT RETURN YOUR FORM TO THE ABOVE ADDRESS.
1. REPORT DATE (DD-MM-YYYY)
10 - 200401-