development of load rating procedures for railroad
TRANSCRIPT
DEVELOPMENT OF LOAD RATING PROCEDURES FOR
RAILROAD FLATCARS FOR USE AS HIGHWAY
BRIDGES BASED ON EXPERIMENTAL AND
NUMERICAL STUDIES
PHASE III FINAL REPORT-
Prepared for The Indiana Local Technical Assistance Program (LTAP)
Prepared by
Kadir C. Sener,
Teresa L. Washeleski
Robert J. Connor
October 12, 2015
Purdue University School of Civil Engineering
West Lafayette, Indiana

2

3
Table of Contents 1 Introduction ............................................................................................................................. 6
2 Background ............................................................................................................................. 6
3 Objective ................................................................................................................................. 7
4 Summary of Experimental Tests on RRFC Bridge................................................................. 7
4.1 RRFC Bridge Details ....................................................................................................... 7
4.2 Instrumentation................................................................................................................. 8
4.3 Testing Method ................................................................................................................ 9
5 Finite Element Modeling of RRFC ....................................................................................... 11
5.1 Model Part Details .......................................................................................................... 11
5.2 Material Properties ......................................................................................................... 12
5.3 Benchmarking of 3D Finite Element Model to RRFC Test Results .............................. 13
5.4 Evaluating Effective Width of Composite Girders ........................................................ 24
5.5 Calculated and Measured Moment and Distribution Factor Comparison ...................... 26
6 Parametric Study on Load Rating Guidelines ....................................................................... 27
Stiffness Magnification Factors for Relative Flexural Stiffness Calculations ...................... 29
6.1 Distribution Factor (DF) Parametric Study Results ....................................................... 30
6.2 Car Distribution Factor (CDF) Parametric Study Results .............................................. 33
6.3 Summary of Parametric Studies ..................................................................................... 35
7 Finite Element Modeling of Fractured RRFC ...................................................................... 35
7.1 Redistribution of Locked-in Forces using FEM Analysis .............................................. 38
7.2 Redistribution of Live Loads using FEM Analysis ........................................................ 40
7.3 Summary of FEM Analysis Results for Fractured RRFC .............................................. 43
8 Conclusions ........................................................................................................................... 43
9 References ............................................................................................................................. 45
Appendix A : Calculation of Relative Flexural Stiffness for FE Models ..................................... 46
Appendix B : Car Distribution Factor (CDF) Parametric Study Results for Different Relative Flexural Stiffness Values .............................................................................................................. 48
Appendix C : FE Analysis Results for Fractured Bridge : Redistribution of Locked-in Loads ... 51
Appendix D : Proposed Ratings Procedures for RRFCs .............................................................. 55

4
List of Tables Table 1 – RRFC Bridge Load Tests .............................................................................................. 10 Table 2 – RRFC Load test comparison of stresses caused by single patch load test 1 (no deck) 15 Table 3 – Comparison of Stresses by Single Patch Load - Test 5, Composite Deck ................... 19 Table 4 – Comparison of Stresses Caused by Axle Load - Test 6, Composite Deck ................... 19 Table 5 – Total Moment near Mid-span to Determine Effective Section..................................... 26 Table 6 – Member Moment and Distribution Factor Comparison for Test 6 ............................... 27 Table 7 – Member Moment and Distribution Factor Comparison for Test 10 ............................. 27 Table 8 – Relative Flexural Stiffness Values for Parametric Study ............................................. 28 Table 9 – Distance Between Flatcars for Parametric Study ......................................................... 29 Table 10 – Truck Wheel Locations for Parametric Study ............................................................ 29 Table 11 – Distribution Factor for Calculating Live Load Stress for Single Lane Loaded .......... 32 Table 12 – Distribution Factor for Calculating Live Load Stress for Two Lanes Loaded ........... 32 Table 13 – Car Distribution Factor Results for Calculating Live Load Stress ............................. 34 Table 14 – Member Moments Due to Dead Load (before fracture) ............................................. 39 Table 15 – Member Moments Due to Dead Load (after fracture) ................................................ 39 Table 16 – Member Moment Difference Due to Dead Load (after fracture) ............................... 40 Table 17 – Member Moments Due to Live Load (after fracture) ................................................. 40 Table 18 – Member Moment Due to Live Load (no fracture) ...................................................... 41 Table 19 – Member Moment Comparison Between Intact and Fractured Flatcars ...................... 41 Table 20 – Percentage of Moment Remaining in the Fractured Flatcar for Dead and Live Load 42 Table 21 – Fractured Flatcar Car Distribution Factor (CDF) for Dead and Live Load Cases ..... 42 Table 22 – Non-Fractured Car Distribution Factor (CDF) for Dead and Live Load Cases ......... 42 Table 23 – Member Moments Due to Dead Load (before & after fracture) for DIST 1 .............. 52 Table 24 – Member Moments Due to Live Load (before & after fracture) for DIST 1 ............... 52 Table 25 – Member Moments Due to Dead Load (before & after fracture) for DIST 5 .............. 53 Table 26 – Member Moments Due to Live Load (before & after fracture) for DIST 5 ............... 53 Table 27 – Member Moments Due to Dead Load (before & after fracture) for DIST 7 .............. 54 Table 28 – Member Moments Due to Live Load (before & after fracture) for DIST 7 ............... 54

5
List of Figures Figure 1 – Section Cut Drawing of RRFC Bridge .......................................................................... 9 Figure 2 – Idealized Stress-Strain Curve for Steel........................................................................ 13 Figure 3 – Placement of RRFCs in laboratory .............................................................................. 14 Figure 4 – Test 1 - Load test with no deck ................................................................................... 15 Figure 5 – Test 1 - Top Strain Gauge Comparisons ..................................................................... 16 Figure 6 – Test 1 - Bottom Strain Gauge Comparisons ................................................................ 16 Figure 7 – Deck Placement - Bottom Strain Gauge Comparisons................................................ 17 Figure 8 – Deck Placement - Displacement Comparison ............................................................. 17 Figure 9 – Load Test 6 with Composite Concrete Deck ............................................................... 18 Figure 10 – Test 5 - Top Strain Gauge Comparisons ................................................................... 20 Figure 11 – Test 5 - Bottom Strain Gauge Comparisons .............................................................. 20 Figure 12 – Test 5 - Displacement Comparison ........................................................................... 21 Figure 13 – Test 6 - Top Strain Gauge Comparisons ................................................................... 21 Figure 14 – Test 6 - Bottom Strain Gauge Comparisons .............................................................. 22 Figure 15 – Test 6 - Displacement Comparison ........................................................................... 22 Figure 16 – Test 10 - Top Strain Gauge Comparisons ................................................................. 23 Figure 17 – Test 10 - Bottom Strain Gauge Comparisons ............................................................ 23 Figure 18 – Test 10 - Displacement Comparison ......................................................................... 24 Figure 19 – Girder Moment Obtained from FE Analysis ............................................................. 25 Figure 20 – Schematic for Clear Distance and Load Location ..................................................... 28 Figure 21 – Parametric Study on Distribution Factors for the Loaded Car .................................. 31 Figure 22 – Distribution Factor Error using Equation 1 ............................................................... 31 Figure 23 – Loading Locations for Two Lane Loading Case ....................................................... 33 Figure 24 – Car Distribution Factors for R1 ................................................................................. 34 Figure 25 – Fracture Test 1 - Top Flange Locked-in Stress Comparisons ................................... 36 Figure 26 – Fracture Test 1 - Bottom Flange Locked-in Stress Comparisons .............................. 37 Figure 27 – Fracture Test 1 - Top Flange 75 kips Stress Comparisons ........................................ 37 Figure 28 – Fracture Test 1 - Bottom Flange 75 kips Stress Comparisons .................................. 38 Figure 29 – Fracture Test 1 -75 kips Displacement Comparison ................................................. 38 Figure 30 – Car Distribution Factors for R2 ................................................................................. 49 Figure 31 – Car Distribution Factors for R3 ................................................................................. 49 Figure 32 – Car Distribution Factors for R4 ................................................................................. 50 Figure 33 – Car Distribution Factors for R5 ................................................................................. 50

6
1 Introduction
The objective of this report is to develop finite element models to conduct parametric studies for developing load rating guidelines for railroad flatcar (RRFC) bridges constructed with fully composite reinforced concrete decks. The models for conducting the parametric studies were benchmarked to experimental tests that were conducted on a previous research project presented in the report by Washeleski et al. (2013). The experimental research evaluated the behavior of both intact and fractured flatcar bridges subjected to high loads to develop load rating guidelines. The experimental research focused on the load distribution and level of system redundancy in the tested RRFC bridge before and after failure of one or both main girders. This report presents the result of finite element analysis of laboratory testing of a RRFC bridge in which several parameters were varied including the (i) spacing between flatcars, (ii) load position, and (iii) member relative stiffness. The results were used to improve previously proposed load rating guidelines developed for RRFC bridges constructed with composite concrete decks.
2 Background
Railroad flatcars (RRFCs) are an attractive option to replace existing deteriorating bridge structures on low-volume roads. They are typically used as the bridge superstructure by placing two or more flatcars side-by-side to achieve the desired roadway width. Utilizing RRFCs as a bridge allows for rapid construction by normal highway maintenance personnel using readily available equipment compared to traditional practices (Provines et al. 2014a). These benefits make them an attractive solution for rural communities.
The unique superstructure of RRFCs creates a challenge when attempting to load rate these types of bridges. Unfortunately, there is no guidance in existing AASHTO Specifications on load rating RRFC bridges, often resulting in overly conservative load postings. Utilizing the results of the previous work from other studies (Wipf et al. 1999, Wipf et al. 2007a, Wipf et al. 2007b, Provines et al. 2014b), proposed load rating guidelines were developed.
Although the research by Provines et al. (2014b) resulted in reasonable rating procedures, some uncertainty remained regarding the response under higher loads than could be easily and safely achieved in the field with test trucks and the effects of a fully composite concrete deck. In addition, the rating procedures developed by Provines et al. (2014b) did not directly include provisions for calculating ratings for shear. During the research described herein, laboratory testing of a RRFC bridge with two flatcars placed side-by-side allowed for experimental testing under higher loads, as well as increased amounts of instrumentation to better understand the behavior of the RRFCs. The two RRFCs that were acquired for testing are classified as “typical” RRFCs. A “typical” flatcar consists of one main box girder, two exterior channel girders on either side of the main girder, and three to four stringers between the main girder and each exterior girder. Following the experimental program, a detailed finite-element (FE) modeling was developed and benchmarked using the experimental data. Once benchmarked, a comprehensive parametric study on the behavior of the RRFC bridge with a composite deck was performed by varying the spacing between flatcars, load position, and member relative stiffness.

7
3 Objective
The main objective of this project was to revise the proposed load rating guidelines as needed for RRFCs with fully composite decks developed by Provines et al. (2014b) and Washeleski et al. (2013). This research resulted in improvements to the load rating provisions developed in the first two phases of work. The revised rating procedures are included in Appendix D.
FE analysis research objectives are as follows:
1. Develop an FE model of the laboratory RRFC bridge and benchmark the model using data from experimental testing.
2. Perform a parametric study by varying the spacing between flatcars, load position, and member relative stiffness to aid in understanding the behavior of RRFC bridges and revising the previous load rating guidelines developed by Provines et al. (2014b) as needed.
4 Summary of Experimental Tests on RRFC Bridge
4.1 RRFC Bridge Details The experimental research included testing of a full-scale bridge consisting of two identical railroad flatcars and a reinforced concrete slab connecting the flatcars. The bridge was subjected to several loading conditions in the laboratory. The RRFCs were built as a simply-supported, single-span bridge, with a span length of 47 feet – 4 ¾ inches and a total bridge width of 21 feet – 4 ¾ inches. The width included the two 9 feet – 4 ¼ inch wide RRFCs transversely spaced 12 feet on center, creating a 2 feet – 8 ¼ inch gap between the flatcars. Pin and roller supports placed on concrete blocks were used to simulate simply-supported conditions. Each RRFC had one pin support at the North end and one roller support at the South end, located at the RRFC wheel truck locations.
Section cut view at mid-span of the RRFC bridge is shown in Figure 1. Each flatcar consisted of one main box girder and two shallower exterior girders on each side of the main girder made from channel sections. The main box girder tapers near the quarter points of the flatcar into a shallower section near the supports. The system also included smaller I-beam stringers in the longitudinal direction and transverse to floor beams. Four I-beam stringers were located between main and exterior girders and resting on the transverse members. All connections in the RRFCs were welded. Material tests performed on the bottom girder indicated a yield strength of 48 ksi and an ultimate tensile strength of 72 ksi.
A fully composite reinforced concrete deck was designed based on AASHTO LRFD Bridge Design Specifications (2012). The concrete deck thickness was 6.5 in. over the main girders, exterior girders, and between the RRFCs, and 9 in. over the stringers, as the stringers were 2.5 in. below the main girder. Shear connectors were used to ensure composite action between the steel structure of the flatcars and the concrete deck. A pitch of 6 in. was used for the pairs of shear connectors on the main girders. Single shear connectors were installed on all exterior girders with a pitch of 12 in. The shear connectors were installed and designed per the AASHTO Specifications (2012). The

8
simple steel reinforcement design for the concrete deck consisted of #5 longitudinal bars spaced at 12 in. and #5 transverse bars spaced at 10 in. on the top and bottom layers. Indiana Department of Transportation (INDOT) Class C concrete was used for the RRFC bridge deck. The 28-day concrete compressive strength was an average of 5700 psi between the four concrete trucks used.
4.2 Instrumentation Instrumentation included uniaxial strain gauges, rectangular rosette strain gauges and displacement sensors. Detailed instrumentation plans that show the exact location of all instrumentation can be found in the final project report (Washeleski et al. 2013).
A total of 94 uniaxial strain gauges were installed on the bridge. The East RRFC was more heavily instrumented to determine if there was symmetrical behavior within the single RRFC and to better quantify the load distribution within a given car. All strain gauge locations on the West RRFC matched with those on the East RRFC to determine if the RRFCs behaved the same when loaded individually.
The main focus during load testing was to determine the response of the longitudinal members. Strain gauges were installed at the extreme fibers on the top flanges of the main girders, exterior girders, and stingers.
Five cross sections on the East RRFC and three cross sections on the West RRFC were selected for instrumentation. These cross sections were located near mid-span and on either side of the tapered sections of the main girder. The location of the applied load during testing was at mid-span; therefore, the mid-span instrumented cross section was offset 1 ft. – 7.5 in. from exact mid-span to avoid local effects and damage from the load spreader beam.
Displacement sensors were initially placed on the main girder at mid-span, at the quarter points, and near the supports on each RRFC. A total of five displacement sensors were used on each RRFC. Recording the displacement at mid-span allowed for the maximum deflections to be obtained when the load was applied at mid-span. Placing displacement sensors at the quarter points of each main girder helped to determine if there was symmetric behavior within the RRFC. Finally, displacement sensors at the supports were used to measure any settlement or uplift at this location.
The displacement sensor layout was modified after the concrete deck was installed. Displacement sensors at the quarter points were moved to the exterior girders at mid-span and at the supports. These locations allowed comparison between the deflection of the main girder and exterior girders to better understand the behavior of the two RRFCs working as a system.

9
Figure 1 – Section Cut Drawing of RRFC Bridge
4.3 Testing Method The experimental behavior of the RRFC bridge has been evaluated at the Bowen Laboratory at Purdue University. The geometry details and material properties can be found in the report by Washeleski et al. (2013). A number of load tests were performed to investigate the load distribution of the RRFC bridge at high loads. The load distribution was evaluated (i) between the flatcars and (ii) within each flatcar. Details pertaining to each load test discussed herein are summarized in Table 1. The “single patch load” in the load configuration column refers to a load contact surface that was 24 in. (wide) by 16 in. (long). The dimensions of this load configuration were based on the width of the main girder flange and the width of the load spreader beam flange. The “axle load” was used to simulate a truck axle and refers to two-wheel patch loads, each 20 in. (wide) by 10 in. (long), with a center-to-center spacing of 6 ft. These dimensions were based on the AASTHO tire contact area defined for the design truck (AASHTO 2012). The load was slowly applied in increments of 25 to 50 kips until the desired maximum load was reached. All load tests were repeated three or more times for each load configuration to ensure the data were repeatable and linear.

10
Table 1 – RRFC Bridge Load Tests
Test Load Location Load Configuration Max. Load (kips) Deck Type
Test 1 Main girder of East RRFC Mid-span Single patch load 150 No deck
Test 5 Centered over East RRFC Mid-span Single patch load 225 Composite concrete
deck
Test 6 Centered over East RRFC Mid-span Axle load 225 Composite concrete
deck
Test 10 Centered over RRFC Bridge Mid-span Axle load 225 Composite concrete
deck
Load distribution was evaluated using measured stresses in the longitudinal members. The stress values were obtained from the strain gauges installed on the main girders, exterior girders and stringers. The point loading applied at the mid-span is expected to generate large bending moments in the longitudinal members. Therefore, the strain gauges were attached to the extreme tension and compression faces of the flanges at same cross-section. These strain values were converted to stress values using the steel elastic modulus (29000 ksi).
The first load test (Test 1) was conducted on the identical flatcars without the concrete deck. Each flatcar was tested individually and demonstrated similar response to the loading. These tests were at mid-span of the RRFCs with a single patch loading. The remaining tests were conducted by constructing a fully composite reinforced concrete deck to form the RRFC bridge. Two loading configurations were evaluated, including single patch and axle load tests. Both loading configurations were used to develop benchmark models of the bridge.
Two additional tests were performed to address the issue of classifying RRFC bridges as containing fracture critical members. This issue arises due to the RRFC bridge being viewed as having only two primary load carrying members (i.e. the main box). The goal of the fracture tests was to simulate a fracture in a main girder to investigate the ability of the bridge to redistribute loads and perform as a system after fracture. The composite concrete deck previously mentioned was in place during these tests. The tests were performed after introducing separate brittle fractures in the main girders of each flatcar. The goal of the fracture tests was to eliminate a member in one or both of the flatcars and evaluate the load redistribution between the flatcars and within the members.
The first test consisted of introducing a brittle fracture in the East RRFC main girder, with the West RRFC main girder and all other bridge members intact. In the second test, as a worst case scenario, a brittle fracture was introduced in the main girder of the second flatcar and the remaining capacity was evaluated. The load during the first test was a single patch load centered over the East RRFC main girder. An initial center “crack” of 10.5 inches was cut into the bottom flange of the main girder, located about 2 feet north of mid-span. The second fracture test simulated a worst case scenario with the main girder of each RRFC fractured. This scenario, although highly unlikely, could occur if one main girder fractured, but was not detected before the other main

11
girder fractured. Therefore, a fracture was simulated in the West RRFC main girder, with the East RRFC main girder still fractured (i.e., no repair splice). The load configuration during this test was a single patch load centered over the West RRFC main girder.
The results of the experimental program are presented in the report by Washeleski et al. (2013) in detail. The summary of the experimental research is listed below.
1. When loaded individually (i.e. without a deck), both railroad flatcars displayed similar behavior when subjected to the same applied point load. The main box girder carried the majority of the moment during these tests of individual RRFCs without a deck.
2. The composite concrete deck added considerable stiffness, increased live load capacity, and provided excellent load distribution within a single RRFC and between adjacent RRFCs.
3. The main girders and exterior girders were determined to be primary members of RRFC bridges constructed with a composite concrete deck, as long as the members are made fully composite with the deck.
The experimental data was used to benchmark the numerical models for use in further studies which are presented in the next section.
5 Finite Element Modeling of RRFC
The objective of the finite element analysis is to: (i) gain more insights into the behavior of the tested RRFCs constructed with fully composite concrete decks, (ii) conduct a parametric study to determine distribution and car distribution factors for fully composite RRFC bridges, (iii) perform further finite element analysis on the fractured RRFC bridge to determine distribution and car distribution factors, (iv) evaluate and improve the load rating guidelines developed from experimental testing presented by Washeleski et al. (2013).
The finite element models were built using ABAQUS (Dassault, 2013), which is a general-purpose commercial finite element analysis program. The FE models were developed in 3D consisting of solid, shell, beam and connector elements. In the FE models, a global element size of 5 in. was used based on the mesh sensitivity studies which demonstrated sufficient number of elements and consistency throughout the models. The models were initially benchmarked to the experimental tests that were presented in the previous sections and then were further used for conducting parametric study. The parameters included in the parametric study were the: (i) relative flexural stiffness ratio of the exterior girders, (ii) clear distance between flatcars, and (iii) transverse location of the axle truck wheels. Details of the FE models to simulate the experimental behavior and conduct the parametric study are presented in the following subsections.
5.1 Model Part Details Concrete Deck The concrete deck that connects the RRFCs was modeled using twenty-node solid elements with full integration (C3D20). The C3D20 element is preferred for performing nonlinear inelastic analysis involving inelastic strains, or cracking at the integration points. These elements also
12
provide best results for local loading conditions where stress concentrations are expected, e.g. under load points. The primary role of the concrete deck was to form a composite section with steel girders and distribute the load among the longitudinal members of the bridge. Concrete cracking was observed in the experiments at high load levels; however, it did not play a significant role on the observed behavior. The concrete deck had two elements through the thickness to ensure sufficient elements through the thickness to properly capture the behavior.
Steel Sections The steel plates that formed the girders were modeled using shell elements, since the thickness of plates are significantly smaller in comparison to the width and length. The plates of these girders were then tied to each other to form the girder sections. The reduced integration element (S4R) was selected for this study. The S4R element is a linear, finite-membrane-strain, quadrilateral shell element and is suitable for either thick or thin plate type problems. Having one integration point also enables to simply understand the strains associated with the finite element.
Shear Studs and Rebars The shear studs and reinforced concrete rebar were modeled using beam elements. These beams elements were embedded into the concrete deck to model the interaction with concrete elements. The shear studs were connected to steel girders using connector (spring) elements, which can be used to model the mechanical connection between any two nodes in the finite element mesh by specifying the force-displacement relationships for the connected degrees-of-freedoms. The connector elements were defined between coinciding nodes of the steel faceplate and the shear stud elements at the locations of the shear studs of the RRFC.
5.2 Material Properties Concrete Material Model The concrete model is defined with the following parameters: elastic modulus, Poisson’s ratio, uniaxial stress-strain behavior in compression, and uniaxial stress-strain behavior in tension. The concrete damaged plasticity model uses a compression yield surface that is used for representing the complex behavior of concrete in compression as well as tension. It uses a pressure dependent multi-axial plasticity model with non-associated flow in compression, and a brittle fracture model with oriented damaged elasticity concepts to model smeared cracking in tension. In tension, it uses damaged elasticity concepts to model smeared cracking. The CDP concrete model has isotropic damage rules, and it can be used for monotonic, cyclic and dynamic analyses.
Steel Material Model The steel material model used multi-axial plasticity theory with: (i) von Mises yield surface, (ii) associated flow rule, and (iii) isotropic hardening. The uniaxial stress-strain (σ−ε) curve is idealized for analysis as shown in Figure 2, based on the recommendations of Varma (2000). The uniaxial stress-strain curve consists of a linear elastic portion, post-yield plateau region, and strain-hardening region. The parameters used to define the idealized stress-strain curve are: (i) elastic modulus E, (ii) yield stress σy, (iii) yield strain εy (iv) yield plateau length mεy, (v) strain corresponding to onset of strain hardening εsh, (vi) ultimate stress σu, and (vii) strain corresponding to ultimate stress εu. Equation shown in Figure 2 defines the stress-strain behavior in the strain

13
hardening region of the response. The exponent n controls the rate of strain hardening of the material. Typical values of n range from 3 to 6. An appropriate value of n can be selected by reviewing or comparing with the strain-hardening portion of the experimentally measured stress-strain curve.
Figure 2 – Idealized Stress-Strain Curve for Steel
Shear Stud Connector Model The shear stud connectors are modeled to transmit forces in the in-plane direction (parallel to the steel plate surface). The connectors follow an empirical force vs. slip equation derived by Ollgaard et al. (1971). This model has been used to obtain the relationship by specifying the diameter of the stud and the concrete compressive strength. The shear stud connector elements are defined between coinciding steel plate and shear stud nodes.
5.3 Benchmarking of 3D Finite Element Model to RRFC Test Results The 3D finite element model was benchmarked to the experimental test results presented in previous sections. The benchmarking approach included stress and displacement comparisons for several test results from; (i) single flatcar without deck loaded at mid-span (Test 1), (ii) flatcars during concrete casting, (iii) flatcars with composite deck loaded with single patch load at mid-span (Test 5), (iv) flatcars with composite deck loaded with axle load at mid-span of the east flatcar (Test 6), (v) flatcars with composite deck loaded with axle load at mid-span of bridge (Test 10).
Test 1 - Flatcar Loaded at Mid-span – No deck The first load test was conducted without a deck installed and no connection between the adjacent RRFC, as each flatcar is seen in Figure 3. This permitted each flatcar to be tested individually. The objectives of these tests were to understand the load distribution within one railroad flatcar and to determine if both RRFCs behaved the same under the same applied load. The experimental data

14
collected without a deck installed were also very useful in benchmarking the FE model prior to including the composite deck.
The flatcars were loaded at their mid-span up to 150 kips. Measured stresses at the maximum load level from the gauges installed on the top and bottom flanges of the main, exterior girders and stringers were used for comparisons. The load location on the flatcar and strain gauge locations on the members for Test 1 are shown in Figure 4. The measured stress levels at Section C (near mid-span) are compared with the analysis results in Figure 5 and Figure 6 for strain gauges installed to top and bottom flanges, respectively. The comparisons indicate excellent agreement between the test and analysis results. Measured stresses for the gauges on the bottom flange of the main girders and exterior girders. The results are summarized in Table 2 for an applied load of 75 kips.
The test indicated symmetric load distribution within a single cross section. The structure remained linear elastic throughout the tests. Due to the large bending moment at the mid-span, the main girder and exterior girders exhibited compression at the top and tension at the bottom of the members. All the stringers were under compression, indicating that the neutral axis was located below these members. This same behavior was also observed in the other instrumented cross sections. Both flatcars responded identically as expected when individually tested, as reported by Washeleski et al. (2013). Since the response of each flatcar was the same, the FE model used identical flatcars in the composite bridge model.
Figure 3 – Placement of RRFCs in laboratory
WEST
EAST

15
Table 2 – RRFC Load test comparison of stresses caused by single patch load test 1 (no deck)
Channel 75 kips
Experimental test (ksi) FE analysis (ksi)
Ratio
21 -11.2 -11.5 0.97 22 9.3 8.7 1.07 23 -7.0 -7.1 0.99 24 -3.2 -4.0 0.80 29 -9.2 -9.4 0.98 30 -4.5 -6.2 0.73 31 -16.4 -16.9 0.97 32 20.3 20.9 0.97 33 -16.8 -16.9 0.99 34 21.5 20.9 1.03 35 -8.7 -9.4 0.93 36 -4.5 -6.2 0.73 41 -6.7 -7.1 0.94 42 N/A -4.0 N/A 43 -11.4 -11.5 0.99 44 8.5 8.7 0.97
See Figure 4 for Channel locations
Figure 4 – Test 1 - Load test with no deck

16
Figure 5 – Test 1 - Top Strain Gauge Comparisons
Figure 6 – Test 1 - Bottom Strain Gauge Comparisons
Concrete Deck Placement The flatcars were connected with a concrete deck to form the bridge. Measurements were collected during placement of concrete for the bridge deck. This data provided stress and displacement measurements due to the dead load of the wet concrete. Stresses were measured by the strain gauges installed on the bottom flange of the main and exterior girders after all of the concrete was placed. The measured stress and displacements at Section C (near mid-span) are compared with the analysis results in Figure 7 and Figure 8. The stress and displacement comparisons indicate that similar response is obtained between experiment and analysis results.

17
Figure 7 – Deck Placement - Bottom Strain Gauge Comparisons
Figure 8 – Deck Placement - Displacement Comparison
RRFC Bridge Load Tests As stated earlier, the overall goal of the research was to study the behavior of RRFCs with composite concrete decks. Figure 9 shows the load configuration for Test 6 with an axle load (two patch loads) that are 6 feet apart located at mid-span of the East RRFC (Test 5 was at the same location but consisted of a “single patch load”). As shown previously in Table 1, the maximum applied load for Test 5 and Test 6 was increased by 75 kips from Test 1, in order to obtain similar maximum tension flange live load stresses. This increase in applied load was required due to the addition of the composite concrete deck and the stiffness contribution from the West RRFC.

18
Figure 9 – Load Test 6 with Composite Concrete Deck
The measured stresses are summarized in Table 3 and Table 4 for Test 5 and Test 6, respectively, for a total single patch or axle load of 75 kips. In the tables, the West RRFC (unloaded flatcar) channel numbers and measurements are given in parenthesis and presented with corresponding symmetric channels on the East RRFC (loaded flatcar). As expected, the top flanges of the main girders and exterior girders are in compression and the bottom flanges are in tension. The bottom flanges of the stringers were in tension and the top flanges were close to zero in the East RRFC. This indicates that the neutral axis shifted upward and approached the top flange of the stringers, as a result of composite action between the RRFC superstructure and the composite concrete deck.
Load Tests 10 was performed with an axle load (two patch loads) that are 6 feet apart located at mid-span of the RRFC bridge. The maximum applied load for all three tests was 225 kips with the RRFC bridge demonstrating linear-elastic behavior. The measured stresses and displacements at Section C and Section I (near mid-span) are compared with the analysis results at applied load of 150 kips for Test 5 in Figure 10, Figure 11 and Figure 12, for Test 6 in Figure 13, Figure 14 and Figure 15, and for Test 10 in Figure 16, Figure 17 and Figure 18.
The stress and displacement values shown in the figures do not include the contribution of concrete pouring. The stress and displacement comparisons indicate very similar measurements in the members between the tests and analyses results. The top flange stress comparisons for the bridge Tests 5 and 6 indicated some discrepancy due to the presence of the concrete deck. The main reason for the discrepancy was due to having the neutral axis of the composite deck near these strain gauges (Washeleski, 2013), which is susceptible to higher error due to high stress gradients at these regions. However, the stress magnitudes measured at these gauges were negligibly low and did not control the overall behavior. The tensile stresses measured on the bottom flanges of the main and exterior girders, where the majority of the load is resisted, were accurately predicted by the analysis results. The overall response of the bridge was also captured favorably by the analysis results as demonstrated by the displacement comparisons given in the comparison tables.

19
Table 3 – Comparison of Stresses by Single Patch Load - Test 5, Composite Deck
Channel Load = 75 kips Displacement
Transducer
Load = 75 kips Experimental
test (ksi) FE analysis
(ksi) Experimental
Test (in.) FE analysis
(in.) 21 (93) N/A (-0.4) -0.5 (-0.2) D108 -0.01 0 22 (94) 2.9 (1.7) 2.8 (1.6) D109 -0.16 -0.15 23 (91) -0.0 (-0.1) 0.2 (-0.1) D110 -0.24 -0.24 24 (92) 0.4 (0.2) 0.7 (0.3) D111 -0.16 -0.15 29 (89) -0.3 (0.0) -0.4 (-0.2) D112 -0.01 0 30 (90) 0.9 (0.1) 0.4 (0.0) D113 0 0 31 (87) -1.0 (N/A) -1.0 (-0.3) D114 -0.05 -0.05 32 (88) 6.9 (0.8) 7.1 (0.8) D115 -0.07 -0.07 33 (85) -1.0 (-0.1) -1.2 (-0.1) D116 -0.05 -0.05 34 (86) 6.2 (1.9) 6.1 (1.8) D117 -0.01 0 35 (83) -0.3 (0.0) -0.6 (0.0) 36 (84) 0.7 (0.1) 0.2 (0.1) 41 (81) -0.2 (0.1) 0.1 (0.0) 42 (82) N/A (0.1) 1.1 (0.0) 43 (79) -1.0 (0.1) -0.8 (0.1) 44 (80) 4.0 (0.0) 4.6 (-0.1)
See Figure 9 for Channel locations.
Table 4 – Comparison of Stresses Caused by Axle Load - Test 6, Composite Deck
Channel Load = 75 kips Load = 75 kips
Experimental test (ksi)
FE analysis (ksi)
Displacement Transducer
Experimental Test (in.)
FE analysis (in.)
21 (93) N/A (-0.4) -0.3 (-0.2) D108 -0.01 0 22 (94) 3.3 (1.9) 3.0 (1.8) D109 -0.16 -0.15 23 (91) -0.4 (-0.1) 0.7 (0.0) D110 -0.24 -0.24 24 (92) 0.8 (0.3) 1.3 (0.5) D111 -0.13 -0.15 29 (89) -0.3 (0.0) -0.4 (-0.2) D112 -0.01 0 30 (90) 0.8 (0.1) 0.4 (0.0) D113 0 0 31 (87) -0.8 (N/A) -1.0 (-0.3) D114 -0.05 -0.05 32 (88) 6.7 (0.8) 7.1 (0.8) D115 -0.07 -0.07 33 (85) -0.9 (-0.1) -1.2 (-0.1) D116 -0.05 -0.05 34 (86) 6.0 (2.0) 5.7 (1.9) D117 -0.01 0 35 (83) -0.4 (0.0) -0.6 (0.0) 36 (84) 0.7 (0.1) 0.3 (0.1) 41 (81) -0.1 (0.1) 0.7 (0.0) 42 (82) 1.2 (0.1) 1.7 (0.0) 43 (79) N/A (0.1) -0.6 (0.1) 44 (80) 4.6 (0.0) 5.6 (-0.1)
See Figure 9 for Channel locations.

20
Figure 10 – Test 5 - Top Strain Gauge Comparisons
Figure 11 – Test 5 - Bottom Strain Gauge Comparisons

21
Figure 12 – Test 5 - Displacement Comparison
Figure 13 – Test 6 - Top Strain Gauge Comparisons

22
Figure 14 – Test 6 - Bottom Strain Gauge Comparisons
Figure 15 – Test 6 - Displacement Comparison

23
Figure 16 – Test 10 - Top Strain Gauge Comparisons
Figure 17 – Test 10 - Bottom Strain Gauge Comparisons

24
Figure 18 – Test 10 - Displacement Comparison
5.4 Evaluating Effective Width of Composite Girders The effective width of the composite section to resist live load bending effects for each primary member was developed based on measurements from controlled load tests and compared to existing AASHTO guidance (2012). The measured top flange stresses were near zero, indicating that the neutral axis of the composite section was very near the top flange. Using data from the top flange area is not always meaningful when the measured stresses are near zero since small variations can result in significant changes in the effective width estimate. Therefore, measured stresses obtained from the bottom flanges of the main girders and exterior girders were used in determining the appropriate effective section.
Based on the measurements, an effective width was calculated such that it would result in the neutral axis being located at a depth that would be consistent with the measured location. This width was compared to that which would be predicted using the AASHTO LRFD Bridge Design Specifications (2012). Both were found to be in good agreement. The recommended approach therefore is to utilize the approach found in the AASHTO specifications since it greatly simplifies the development rating procedures. It was also found that the stringers were so close to the neutral axis of the cross section they did not provide a substantial contribution to the cross section in terms of resisting the bending moment. The same observation was made when reviewing the data from the FE models. Hence, it is recommended the stringers be ignored in the calculation of effective section properties, which is conservative. The concrete portion was transformed using a modular ratio of 7 to compute the section properties of the composite section.
The girder moments from the FE analysis were obtained using the calculated effective widths of the composite sections described above. Extraction of the member moments from the analysis results is illustrated in Figure 19. Also shown in Table 5, these moments were in excellent
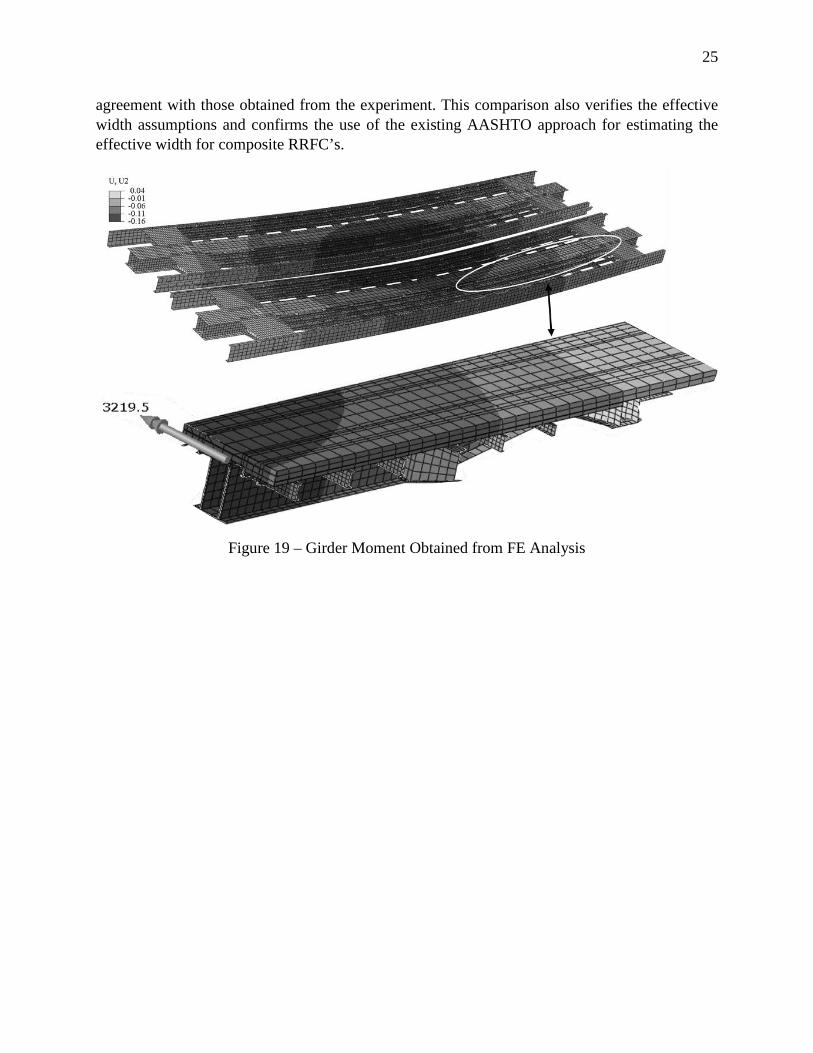
25
agreement with those obtained from the experiment. This comparison also verifies the effective width assumptions and confirms the use of the existing AASHTO approach for estimating the effective width for composite RRFC’s.
Figure 19 – Girder Moment Obtained from FE Analysis

26
Table 5 – Total Moment near Mid-span to Determine Effective Section
Member I (in4) ybot (in)
Test 5 Test 6
Bottom Flange Stress (ksi)
Member Moment
(k-ft)
FE Analysis Member Moment
(k-ft)
Bottom Flange Stress (MPa)
Member Moment
(k-ft)
FE Analysis Member Moment
(k-ft) Ext.
Girder CH_44
1732 17.1 4 33.7 35.2 4.6 39.2 43.5
Main Girder CH_32
& CH_34
31602 28.6 6.5 602 609.8 6.3 583.6 589.7
Ext. Girder CH_22
1985 18.2 2.9 26 25.1 3.3 30.4 27.6
Ext. Girder CH_94
1985 18.2 1.7 15 12.8 1.9 17 15.1
Main Girder CH_86
& CH_88
31602 28.6 1.4 125 119.8 1.4 130.1 125.7
Ext. Girder CH_80
1732 17.1 -0.01 -0.1 -0.1 -0.03 -0.2 -0.2
Total Moment (k-ft) 802 803 800 801 Theoretical Moment (k-ft) 825 825 825 825
See Figure 9 for Channel locations.
5.5 Calculated and Measured Moment and Distribution Factor Comparison This part of the study focuses on the results from the tested load cases and compares the distribution factors obtained from FEM analysis, and a simple beam line approach.
A simple numerical approach to determine the distribution factors has been developed using the previous work by Akinci et al. (2013). This simple approach formed by assuming a beam line model of the bridge and computing the maximum live load moment due to the design truck. The live load moment was further distributed to each flatcar by using a distribution factor. The moment within each flatcar is then distributed to each primary member by the car distribution factor. Finally, this moment is resisted by an effective section, which in this case, is the composite section of the member. The simple numerical approach was performed using SAP2000 structural analysis

27
program. Similar to the simple beam line approach, the effective section width of composite sections to obtain member moments were calculated based on the discussion presented in the previous section for the finite element analysis results.
Test 6 and Test 10 – Truck Axle Loads Load Test 6 (L2-R1-D3) and Load Test 10 (L6-R1-D3) were both performed with an axle load (two patch loads) that are 6 feet apart located at mid-span on the East RRFC and RRFC bridge, respectively. The stress and displacement results and comparisons for these tests were presented in the previous sections. Table 6 and Table 7 show the comparisons of member moments obtained using each numerical approach for Load Tests 6 and 10, respectively. The results indicate reasonable and accurate comparison between each member moment and this confirms that the effective section width assumption is valid to capture the member and total moment of the bridge. The results show that all three approach results in very similar distribution factors between the flatcars and also within each flatcar.
Table 6 – Member Moment and Distribution Factor Comparison for Test 6
Table 7 – Member Moment and Distribution Factor Comparison for Test 10
6 Parametric Study on Load Rating Guidelines
A comprehensive parametric study on the behavior of the RRFC bridge with a composite deck was performed by using the benchmarked finite element models. The parameters included in the study
RRFC Member Member Moment DF CDF Member Moment DF CDF Model DF Model CDFOuter Exterior Girder (CH44) 39.2 0.06 43.5 0.07 0.05
Main Girder (CH32-34) 583.6 0.89 589.7 0.89 0.89Inner Exterior Girder (CH22) 30.4 0.05 27.6 0.04 0.06Inner Exterior Girder (CH94) 17.0 0.12 15.1 0.11 0.06
Main Girder (CH86-88) 130.1 0.89 125.7 0.89 0.94Outer Exterior Girder (CH80) -0.2 0.00 -0.2 0.00 0.00
Theoretical Bridge Moment
Test 6 FE Result - LOC 2, REL1, DIST 3
825 825800 801
West RRFC 0.18 0.170.18
Total Bridge Moment
SAP Analysis
East RRFC 0.82 0.820.82
RRFC Member Member Moment DF CDF Member Moment DF CDF Model DF Model CDFOuter Exterior Girder (CH44) 5.6 0.01 9.6 0.02 0.04
Main Girder (CH32-34) 360.5 0.89 353.9 0.89 0.90Inner Exterior Girder (CH22) 39.4 0.10 35.7 0.09 0.06Inner Exterior Girder (CH94) 41.0 0.10 35.1 0.09 0.06
Main Girder (CH86-88) 364.2 0.89 354.3 0.89 0.90Outer Exterior Girder (CH80) 5.8 0.01 9.9 0.02 0.04
Theoretical Bridge Moment 825 825
West RRFC 0.50 0.50 0.49
Total Bridge Moment 817 798
Test 10 FE Result - LOC 6, REL1, DIST 3 SAP Analysis
East RRFC 0.50 0.50 0.49

28
were: (1) the relative flexural stiffness ratio of the exterior girders, (2) the clear distance between flatcars, and (3) the transverse location of the axle loads (truck wheels).
The report includes two distribution factors; (i) the portion of the total live load moment shared by each flatcar by using distribution factors, (ii) the live load moment that is allocated to each primary member within each flatcar by using car distribution factors.
During this study, refined procedures were developed for the rating of RRFCs based on the experimental findings and finite element analysis parametric studies. The guidelines are intended for the primary members of bridges constructed from typical RRFCs with a fully composite concrete deck. A “typical” RRFC is defined as a flatcar with one main box girder and an exterior girder on either side of the main girder.
The benchmarked FE model was used to conduct several parametric studies on distribution factors (DF) and car distribution factors (CDF). The parameters included in this study were: (i) five different relative flexural stiffness ratio of the exterior girders (R1, R2, R3, R4, R5), (ii) four different flatcar clear distance (D1, D3, D5, D7) and (iii) six different transverse load locations (L1, L2, L3, L4, L5, L6), of the truck axle wheels. The parameters included in this study are presented in Table 8, Table 9, and Table 10. The clear distance and load location used in the parametric study of the flatcars is illustrated in Figure 20.
Figure 20 – Schematic for Clear Distance and Load Location
Table 8 – Relative Flexural Stiffness Values for Parametric Study
Relative Flexural Stiffness Member R1* R2 R3 R4 R5
Exteriorouter 0.055 0.15 0.25 0.5 0.75 Main Girder 1 1 1 1 1 Exteriorinner 0.063 0.15 0.25 0.5 0.75
*Corresponds to Load Test 6

29
Table 9 – Distance Between Flatcars for Parametric Study
Distance Between RRFCs Clear Distance - SRRFC (in.)
DIST 1 18.0 DIST 3* 32.3 DIST 5 57.2 DIST 7 75.9
*Corresponds to Load Test 6
Table 10 – Truck Wheel Locations for Parametric Study
Truck Locations Absolute Distance (in.) x1 (in.) x2 (in.)
LOC 1 7.9 79.9 LOC 2* 18.1 90.1 LOC 3 30.1 102.1 LOC 4 42.1 114.1 LOC 5 66.1 138.1 LOC 6^ 90.4 162.4
*Corresponds to Load Test 6 ^ Corresponds to Load Test 10
Stiffness Magnification Factors for Relative Flexural Stiffness Calculations The parametric study was conducted using five different relative flexural stiffness values as given in Table 8. The relative flexural stiffness values of exterior and main girders that corresponds to the member sizes used in the laboratory experiment were designated as R1. The relative flexural stiffness values were calculated by including the concrete composite deck using the effective width calculated based on the discussion presented previously. The relative stiffness values of the remaining four cases (R2, R3, R4, R5) were obtained by magnifying the elastic modulus of the steel portions of the exterior girders in the finite element models. A sample calculation is demonstrated in Appendix A for relative flexural stiffness case R2. As shown in the calculation, the steel elastic modulus of the outer exterior girders was magnified by 4.57 and inner exterior girders was magnified by 3.36 to increase the relative flexural stiffness to 0.15 from 0.055 and 0.063, respectively. Magnification factors used for each relative flexural stiffness cases are listed in the calculation sheet in Appendix A.
In the next section, the parametric study results are presented using the benchmarked FE models presented in previous sections. The results from these parametric studies were used to provide tables and equations to obtain the load distributions shared by each flatcar (distribution factors), and also among the main members within the flatcars (car distribution factors). The results from the FEM analyses results were used to improve the tables that were developed based on the experimental results and simple beam line model presented in the report by Washeleski et al. (2013).

30
6.1 Distribution Factor (DF) Parametric Study Results The parametric study results indicated that the distribution factors were dependent on all three parameters (relative flexural stiffness ratio, flatcar clear distance, and transverse load location). Figure 21 shows the results for the parametric study results consisting of 120 FE analysis. The parametric study results indicated that the most critical parameters influencing distribution factors were the load location and distance between flatcars. As expected, having both axles on the same flatcar (L1-L2-L3) resulted in the maximum distribution factors. Having one wheel on the loaded flatcar and one outside (L4-L5-L6) results in distribution factors where the other parameters (flatcar distance and relative stiffness) have negligible effects.
In order to ensure simple rating procedures would be available to county engineers, it was decided to assimilate the results of the parametric study into a table format. This avoids the need for the engineer to perform any sophisticated calculations. The proposed table captures the load distribution factors among the flatcars for various relative stiffness, load location and flatcar distance combinations, effectively and conservatively.
Based on the envelopes of the analysis results, the distribution factors shown in Table 11 are proposed. The load location was categorized as; (i) both axle wheels on single flatcar (L1-L2-L3), (ii) one wheel on a flatcar and the other wheel in between flatcars (L4), (iii) axle wheels shared by each flatcar (L5-L6). The flatcar clear distance was categorized under three different ranges, as Figure 20 illustrates the parameter definitions. The relative flexural stiffness ratios indicated a minor influence on the distribution factor results; therefore, Table 11 encompasses the relative stiffness ratios (R1-R5) considered in the parametric study.
Equations are also provided to more accurately estimate the distribution factors (DF) than originally proposed by Provines et al. (2014b) for cases where the engineer has found the tabular values are overly conservative. The proposed equations were developed by performing multi-linear regression analysis on the entire parametric study results. The equations for calculating distribution factors are given in Equations 1 and 2 for the loaded and unloaded flatcars, respectively. In Equation 1; R is the relative flexural stiffness ratio between the exterior and interior girders, D is the distance between flatcars in inches, and L is the distance from the edge of the loaded flatcar to the nearest wheel of the axle loading in inches. The error using Equation 2 is less than 6% and always provides conservative results for the loaded car as provided in Figure 22. The smaller of the distribution factors obtained from the equation or the table is recommended to designers for estimating distribution factors accurately and conservatively.
𝐷𝐷𝐷𝐷𝐿𝐿𝐿𝐿𝐿𝐿𝐿𝐿𝐿𝐿𝐿𝐿 = 0.85 + 0.027 ∙ 𝑅𝑅 + 0.002 ∙ 𝐷𝐷 − 0.0045 ∙ 𝐿𝐿 (Eq. 1)
𝐷𝐷𝐷𝐷𝑈𝑈𝑈𝑈𝑈𝑈𝐿𝐿𝐿𝐿𝐿𝐿𝐿𝐿𝐿𝐿 = 1 − 𝐷𝐷𝐷𝐷𝐿𝐿𝐿𝐿𝐿𝐿𝐿𝐿𝐿𝐿𝐿𝐿 (Eq. 2)

31
Figure 21 – Parametric Study on Distribution Factors for the Loaded Car
Figure 22 – Distribution Factor Error using Equation 1

32
Table 11 – Distribution Factor for Calculating Live Load Stress for Single Lane Loaded
Moment Proportion, MP
SRRFC ≤ 18 in. 18 in.< SRRFC ≤ 32 in. 32 in.< SRRFC ≤ 76 in.
Loaded RRFC
Unloaded RRFC
Loaded RRFC
Unloaded RRFC
Loaded RRFC
Unloaded RRFC
Both Wheels on
Loaded RRFC
(x<LRRFC)
0.85 0.25 0.90 0.225 0.95 0.20
One Wheel in Between RRFC
(LRRFC<x<LRRFC+ SRRFC)
0.825 0.40 0.825 0.40 0.825 0.40
Wheels shared on
Two RRFC
(LRRFC+ SRRFC<x)
0.60 0.50 0.60 0.50 0.60 0.50
Table 12 was developed to be used to determine the distribution factors for two lanes loaded. These values were determined by combining worst case scenarios of the single lane loaded data. Depending on distance between flatcars, the total load on one flatcar was obtained by summing the distribution factors for the most extreme load locations (L1 + L4 or L5 or L6). For example, for a flatcar spacing less than 18 inches, the worst loading scenario occurs when both trucks are located closest to the outer edge of one of the loaded flatcars, as illustrated in Figure 23 for the loading case L1 + L4. Therefore, each flatcar would have a superimposed distribution factor of 1.25 (0.85 + 0.40). In the calculations, the distance between two trucks were assumed to be not less than 2 feet. Each flatcar is considered “loaded” in the two lanes loaded situation.
Table 12 – Distribution Factor for Calculating Live Load Stress for Two Lanes Loaded
Moment Proportion, MP
SRRFC ≤ 18 in. 18 in. < SRRFC ≤ 32.3 in. 32.3 in. < SRRFC ≤ 76 in.
Loaded RRFC Loaded RRFC Loaded RRFC 1.25 1.35 1.45

33
Figure 23 – Loading Locations for Two Lane Loading Case
6.2 Car Distribution Factor (CDF) Parametric Study Results The FE analysis results were used to evaluate car distribution factors (CDF) in order to accurately estimate the bending moment distribution within the loaded and unloaded flatcars. The parametric study consisting of the 120 cases (five different relative flexural stiffness, six different loading locations, and four different flatcar clear distances) were used to evaluate car distribution factors. The results indicate that the primary parameter that influences car distribution factors is the relative flexural stiffness of the girders. Figure 24 shows the parametric study results for the relative flexural stiffness case R1 (24 different load and car distance case). The figures for other relative flexural stiffness ratio cases are given in Appendix B.
Using the car distribution results from the parametric study, a table has been created to conservatively distribute the total flatcar moment to the main and exterior girders for different relative flexural stiffness ratios. Increasing the flexural stiffness ratio of main girders has shown to increase the flatcar moment allocated to these girders. Table 13 provides the car distribution factors (CDF) categorized for five different flexural stiffness ratio ranges. The proposed car distribution factors for the main and exterior girders are indicated with straight lines in Figure 24 for the relative flexural stiffness case R1. The loaded flatcar resists most of the bridge moment (ranging from 60% to 95%) based on the distribution factor (DF) parametric study results summarized in Table 11; therefore, girders of the loaded flatcars were taken into consideration for determining the car distribution factors.

34
Figure 24 – Car Distribution Factors for R1
Table 13 – Car Distribution Factor Results for Calculating Live Load Stress
Car Distribution Factor (CDF)
Stiffness Ratio Main Girder
Exterior Girder(s)
Iext/Imain ≤ 5% 0.90 0.10
5% < Iext/Imain ≤ 15% 0.80 0.20
15% < Iext/Imain ≤ 25% 0.70 0.30
25% < Iext/Imain ≤ 50% 0.55 0.40
50% < Iext/Imain ≤ 75% 0.45 0.50

35
6.3 Summary of Parametric Studies In this report, development of existing load rating guidelines for RRFC bridges constructed with a fully composite concrete deck have been presented. The guidelines developed herein were based from a series of load tests conducted in the laboratory along with an FE analysis of the flatcar bridge. Similar to the development of the proposed guidelines Provines et al. (2014b), those developed herein are user-friendly procedures that more accurately load rate RRFC bridges with fully composite concrete decks.
The guidelines that were presented by Washeleski et al. (2013) were based on the spring analogy method. The parametric study that was conducted based on the spring analogy approach were limited and covered less number of loading locations. Therefore, a more detailed analysis using finite element method was conducted.
Experimental and analytical studies of the RRFC bridge resulted in the following key conclusions:
1. The main girders and exterior girders were determined to be primary members of RRFC bridges constructed with a composite concrete deck, as long as the members are made fully composite with the deck.
2. Parametric studies were conducted using the finite element model benchmarked to the experiment results. The parametric studies included 120 FE analysis results including parameters of; (i) relative flexural stiffness of main and exterior girders, (ii) truck axle locations, and (iii) flatcar clear distance. The parametric study results were used to provide moment distributions between cars (distribution factors) and within each car (car distribution factors) are presented in tables and equations for designers to be utilized in simple and conservative designs.
3. The results from the spring analogy method compared reasonably well with the 3D finite element model considering the simplicity of this approach and is recommended for usage in similar evaluations.
7 Finite Element Modeling of Fractured RRFC
The report by Washeleski et al. (2013) also included two tests with fractured main girder/girders. The first fracture test involved fracturing the East RRFC main girder near mid-span. Data from this fracture test was used to develop procedures to evaluate the remaining capacity of the RRFC bridge after fracture occurs in one main girder. Two types of loads were considered when developing the procedures to check the bridge capacity after fracture occurred. The first loading was due to redistribution of locked-in stresses immediately after fracture occurred. Locked-in stresses include stress due to dead load and residual stresses “locked-in” a given member. The second loading was due to live load and determining how the bridge system carries the applied load with a fractured primary member. A study has been conducted using the benchmarked 3D finite element method model to evaluate the redistribution moments of both locked-in and live load moments.
The locked-in stresses, or loads, were assumed to be the dead load carried by the fractured member and residual stresses. Residual stresses may be due to manufacturing and welding to create the

36
build-up main member. The FEM analysis can only capture the dead load portion of the locked-in loads since fabrication imperfections cannot be quantified or incorporated into the FEM model. The FEM analysis consisted of three loading phases where; (i) dead load of the bridge was applied to the intact bridge, (ii) the dead load is redistributed by introducing a fracture in the model by removing elements from the bottom flange and web of the East main girder, (iii) behavior under live load is investigated by applying a patch load of 75 kips at the mid-span of the east main girder.
The FEM analysis results are compared with the test results in the figures below. Figure 25 and Figure 26 compare the top and bottom flange stresses measured on the steel members (see Figure 9 for channel locations). Channels 32 and 34 were on the bottom flange of the fractured main girder; therefore, the stress level after redistribution of the locked-in stresses is equal to zero. Some difference was observed in the stress comparisons, where member stresses obtained from the experimental members indicated higher stress than the analysis results. The underestimation of the FEM results is attributed to the locked in stresses due to residual or fabrication stresses which the FEM model cannot account for.
Figure 27 and Figure 28 compare the top and bottom flange stresses measured on the steel members after being subjected to 75 kips single patch load. These stress measurements were obtained by subtracting from the stresses after redistribution of the locked-in forces due to the fracture. The comparisons indicate very similar stress response in the member responses. Figure 29 shows the displacement comparisons measured at a cross section near mid-span when the applied load was equal to 75 kips. Displacement transducers D110 and D111 were on the fractured main girder and did not record any data during the test. Mid-span displacements measured on the rest of the members indicated a reasonable comparison.
Figure 25 – Fracture Test 1 - Top Flange Locked-in Stress Comparisons

37
Figure 26 – Fracture Test 1 - Bottom Flange Locked-in Stress Comparisons
Figure 27 – Fracture Test 1 - Top Flange 75 kips Stress Comparisons

38
Figure 28 – Fracture Test 1 - Bottom Flange 75 kips Stress Comparisons
Figure 29 – Fracture Test 1 -75 kips Displacement Comparison
7.1 Redistribution of Locked-in Forces using FEM Analysis Using the benchmarked 3D finite element model another parametric study was conducted to evaluate the system level redundancy of the fractured RRFC bridge. The study was performed on different flatcar distances DIST1, DIST3, DIST5 and DIST7. The results and discussion for
39
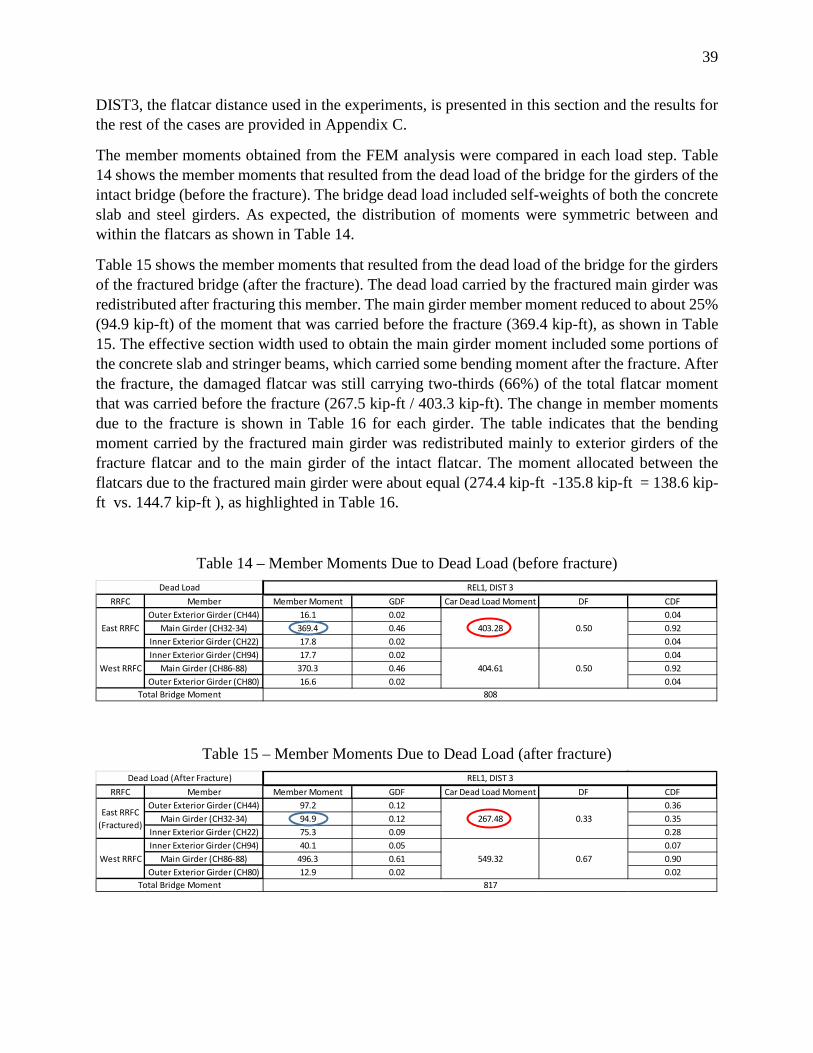
DIST3, the flatcar distance used in the experiments, is presented in this section and the results for the rest of the cases are provided in Appendix C.
The member moments obtained from the FEM analysis were compared in each load step. Table 14 shows the member moments that resulted from the dead load of the bridge for the girders of the intact bridge (before the fracture). The bridge dead load included self-weights of both the concrete slab and steel girders. As expected, the distribution of moments were symmetric between and within the flatcars as shown in Table 14.
Table 15 shows the member moments that resulted from the dead load of the bridge for the girders of the fractured bridge (after the fracture). The dead load carried by the fractured main girder was redistributed after fracturing this member. The main girder member moment reduced to about 25% (94.9 kip-ft) of the moment that was carried before the fracture (369.4 kip-ft), as shown in Table 15. The effective section width used to obtain the main girder moment included some portions of the concrete slab and stringer beams, which carried some bending moment after the fracture. After the fracture, the damaged flatcar was still carrying two-thirds (66%) of the total flatcar moment that was carried before the fracture (267.5 kip-ft / 403.3 kip-ft). The change in member moments due to the fracture is shown in Table 16 for each girder. The table indicates that the bending moment carried by the fractured main girder was redistributed mainly to exterior girders of the fracture flatcar and to the main girder of the intact flatcar. The moment allocated between the flatcars due to the fractured main girder were about equal (274.4 kip-ft -135.8 kip-ft = 138.6 kip-ft vs. 144.7 kip-ft ), as highlighted in Table 16.
Table 14 – Member Moments Due to Dead Load (before fracture)
Table 15 – Member Moments Due to Dead Load (after fracture)
RRFC Member Member Moment GDF Car Dead Load Moment DF CDFOuter Exterior Girder (CH44) 16.1 0.02 0.04
Main Girder (CH32-34) 369.4 0.46 0.92Inner Exterior Girder (CH22) 17.8 0.02 0.04Inner Exterior Girder (CH94) 17.7 0.02 0.04
Main Girder (CH86-88) 370.3 0.46 0.92Outer Exterior Girder (CH80) 16.6 0.02 0.04
REL1, DIST 3
Total Bridge Moment 808
Dead Load
East RRFC 403.28 0.50
West RRFC 404.61 0.50
RRFC Member Member Moment GDF Car Dead Load Moment DF CDFOuter Exterior Girder (CH44) 97.2 0.12 0.36
Main Girder (CH32-34) 94.9 0.12 0.35Inner Exterior Girder (CH22) 75.3 0.09 0.28Inner Exterior Girder (CH94) 40.1 0.05 0.07
Main Girder (CH86-88) 496.3 0.61 0.90Outer Exterior Girder (CH80) 12.9 0.02 0.02
Dead Load (After Fracture) REL1, DIST 3
East RRFC (Fractured)
267.48 0.33
West RRFC 549.32 0.67
Total Bridge Moment 817

40
Table 16 – Member Moment Difference Due to Dead Load (after fracture)
7.2 Redistribution of Live Loads using FEM Analysis The FEM models were used to study the response in the member moments due to a patch live load of 75 kips on the fractured main girder. Table 17 shows the member moments of the fractured bridge that resulted from the 75 kips point load. As shown in the table, although the applied load was at the mid-span of the fractured main girder, the total moment of the bridge was equally resisted among the flatcars by having both flatcars 50% distribution factors. The fractured main girder also contributed to the bending moment resistance of the bridge by carrying 24% of the moment in the fractured flatcar (CDF = 0.24) or 12% of the total bridge moment (GDF = 0.12) due to the reasons explained earlier.
Table 18 shows the member moments for the case of intact bridge with no fracture loaded to 75 kips, and it demonstrates the influence of the main girder fracture on the moment distribution factors. By comparison, it is observed that 61% of the total flatcar moment remained in the fractured flatcar (411.9 kip-ft / 670.1 kip-ft). The live load carried by the fractured main girder was redistributed to other members in the bridge, including the unloaded flatcar members. The member moment difference between the intact and fractured bridge is shown in Table 19. The table indicates that the moment redistribution due to the fractured main girder was about equal among the flatcars (510.1 kip-ft - 258.2 kip-ft = 259.3 kip-ft vs. 275.7 kip-ft), which was also observed for the dead load case.
Table 17 – Member Moments Due to Live Load (after fracture)
RRFC Member Member Moment Car Live Load MomentOuter Exterior Girder (CH44) 81.1
Main Girder (CH32-34) -274.4Inner Exterior Girder (CH22) 57.5Inner Exterior Girder (CH94) 22.5
Main Girder (CH86-88) 125.9Outer Exterior Girder (CH80) -3.7
0k Redistribution REL1, DIST 3
East RRFC (Fractured)
-135.81
West RRFC 144.71
Total Bridge Moment 9
RRFC Member Member Moment GDF Car Live Load Moment DF CDFOuter Exterior Girder (CH44) 190.5 0.23 0.46
Main Girder (CH32-34) 99.7 0.12 0.24Inner Exterior Girder (CH22) 121.6 0.15 0.30Inner Exterior Girder (CH94) 50.6 0.06 0.12
Main Girder (CH86-88) 365.0 0.45 0.89Outer Exterior Girder (CH80) -7.3 -0.01 -0.02
411.89
408.23
820825Theoretical Bridge Moment
Total Bridge Moment
REL1, DIST 375k
East RRFC (Fractured)
0.50
West RRFC 0.50

41
Table 18 – Member Moment Due to Live Load (no fracture)
Table 19 – Member Moment Comparison Between Intact and Fractured Flatcars
The results for the other three flatcar clear distance cases, DIST1, DIST5 and DIST7, indicated similar response due to the fractured main girder and the corresponding tables are presented in Appendix C. As the clear distance between flatcars increased (for DIST5 and DIST7 cases), the portion of the load remained in the fractured flatcar increased. This was vice versa for the opposite condition with shorter clear distance between flatcars as observed for DIST1, where more moment was distributed to the unloaded flatcar.
For the dead load case with lowest stiffness ratio (R1), 72% and 74% of the total moment remained in the fractured flatcars for DIST5 and DIST7, respectively. This ratio was reduced to 64% for the case with shortest clear distance between flatcars (DIST1). For the live load case, 67% and 68% of the total moment remained in the fractured flatcars for DIST5 and DIST7, respectively. This ratio was reduced to 58% for DIST1. Table 20 summarizes the distribution factors obtained from the parametric study for the fractured RRFC bridge. The results included the extreme cases of having shortest and largest flatcar distance (DIST 1 and DIST 7), and also smallest and largest relative flexural stiffness ratio of exterior-to-main girders (R1 and R5). For the applied live load, both point and axle loading was evaluated to obtain the most extreme case, designated with P and L1 respectively. The results indicate that with increasing relative stiffness and flatcar clear distance, the fractured flatcar resisted more load for both dead and live load cases.
Table 21 presents the dead and live load car distribution factors (CDF) for the fractured flatcar of the fractured RRFC bridge, where only the exterior girders were intact. The CDF results for the fractured flatcar indicate that the outer girder resists more moment which ranges from 50% to 60% depending on the relative stiffness ratio (R) and clear distance between flatcars (DIST). Table 22
RRFC Member Member Moment GDF Car Live Load Moment DF CDFOuter Exterior Girder (CH44) 35.2 0.04 0.05
Main Girder (CH32-34) 609.8 0.76 0.91Inner Exterior Girder (CH22) 25.1 0.03 0.04Inner Exterior Girder (CH94) 12.8 0.02 0.10
Main Girder (CH86-88) 119.8 0.15 0.90Outer Exterior Girder (CH80) -0.1 0.00 0.00
75k (no fracture) REL1, DIST 3
East RRFC 670.09 0.83
Theoretical Bridge Moment 825
West RRFC 132.53 0.17
Total Bridge Moment 803
RRFC Member Member Moment Car Live Load MomentOuter Exterior Girder (CH44) 155.3
Main Girder (CH32-34) -510.1Inner Exterior Girder (CH22) 96.5Inner Exterior Girder (CH94) 37.8
Main Girder (CH86-88) 245.2Outer Exterior Girder (CH80) -7.3
West RRFC 275.70
Total Bridge Moment 18
75k (redistribution) REL1, DIST 3
East RRFC (Fractured)
-258.20

42
presents the dead and live load car distribution factors (CDF) for the non-fractured flatcar of the fractured RRFC bridge. The CDF results for the non-fractured flatcar indicate that the distribution factors closely follow the car distribution factors presented for the intact RRFCs, presented in Section 6.2.
Table 20 – Percentage of Moment Remaining in the Fractured Flatcar for Dead and Live Load
Table 21 – Fractured Flatcar Car Distribution Factor (CDF) for Dead and Live Load Cases
Table 22 – Non-Fractured Car Distribution Factor (CDF) for Dead and Live Load Cases
Dead LoadR1-D1-F1R1-D3-F1R1-D5-F1R1-D7-F1R5-D1-F1R5-D7-F1
95%99%
72%74%
Fractured Car
66%64%
( ) gLive Load
R1-D1-F1-PR1-D1-F1-L1R1-D3-F1-P
R1-D3-F1-L1R1-D5-F1-PR1-D7-F1-P
R5-D1-F1-L1R5-D7-F1-L1 77%
61%63%67%68%
Fractured Car
58%59%
76%
Dead Load Live LoadR1-D1-F1 R1-D1-F1-PR1-D3-F1 R1-D1-F1-L1R1-D5-F1 R1-D3-F1-PR1-D7-F1 R1-D3-F1-L1R5-D1-F1 R1-D5-F1-PR5-D7-F1 R1-D7-F1-P
R5-D1-F1-L1R5-D7-F1-L1
Outer Exterior G.0.580.580.540.540.580.53
Car Distribution Factor (CDF) - Fractured CarOuter Exterior G. Inner Exterior G.
0.61 0.39
0.420.47
Car Distribution Factor (CDF) - Fractured CarInner Exterior G.
0.420.420.460.46
0.51 0.49
0.58 0.420.58 0.420.51 0.49
0.64 0.360.61 0.390.64 0.36
Dead LoadR1-D1-F1R1-D3-F1R1-D5-F1R1-D7-F1R5-D1-F1R5-D7-F1
Inner Exterior G. Outer Exterior G.0.16 -0.020.16 -0.030.13 -0.020.13 -0.020.57 -0.110.63
0.540.50
Car Distribution Factor (CDF) - Non-Fractured CarMain Girder
0.860.870.890.89
-0.13
Live LoadR1-D1-F1-P
R1-D1-F1-L1R1-D3-F1-P
R1-D3-F1-L1R1-D5-F1-PR1-D7-F1-P
R5-D1-F1-L1R5-D7-F1-L1
Car Distribution Factor (CDF) - Non-Fractured CarInner Exterior G. Main Girder Outer Exterior G.
0.12 0.90 -0.02
0.13 0.90 -0.020.13 0.89 -0.02
0.13 0.89
0.63 0.50 -0.13
0.13 0.89 -0.020.57 0.54 -0.11
-0.020.12 0.89 -0.02

43
7.3 Summary of FEM Analysis Results for Fractured RRFC A parametric study was conducted using the 3D finite element model benchmarked to the test data. The parametric study consisted of four analyses with different flatcar distances. The goal was to determine the moment distribution between and within the flatcars after a fracture in one of the main girders.
• The results indicated that at least 64% of the total flatcar moment due to dead load remained in the fractured flatcar. This result confirmed the findings in the report by Washeleski et al. (2013), where it was stated that approximately 60% of the moment due to dead load carried before the fracture remained in the fractured flatcar. The percentage of dead load remained in the fractured flatcar increased with higher relative stiffness ratio and larger flatcar clear distance.
• The results indicated that at least 58% of the total flatcar moment due to live load remained in the fractured flatcar. This result was similar to the findings in the report by Washeleski et al. (2013). The results indicate that approximately 60% of the moment due to live load carried before the fracture remained in the fractured flatcar. The percentage of live load remained in the fractured flatcar increased with higher relative stiffness ratio and larger flatcar clear distance.
• The car distribution factor (CDF) results for the fractured flatcar indicated that the outer exterior girder resisted more moment than the inner exterior girder depending on the relative stiffness ratio (R) and distance between flatcars (DIST), ranging from 51% to 64%. Considering practical bridge geometry used in the field, it can be assumed that approximately 60% of the fractured flatcar moment is resisted by the outer exterior girder.
• The car distribution factor (CDF) results for the non-fractured flatcar of the fractured RRFC indicated that the girder moment distribution closely follows the CDF trend of the intact flatcar study presented in Section 6.2.
8 Conclusions
This report has presented the improvement of existing load rating guidelines for RRFC bridges constructed with a fully composite concrete deck using results from finite element method models. The guidelines developed herein were based from a series of load tests conducted in the laboratory along with an FEM analysis of the flatcar bridge. The previous guidelines that were based simpler analysis methods and using FEM a more sophisticated models have been developed and analyzed.
The developed FEM models were benchmarked to experimental tests that were conducted on a previous research project presented in the report by Washeleski et al. (2013). The experimental research focused on the load distribution and level of system redundancy in the tested RRFC bridge before and after failure of one or both main girders. Numerical parametric studies were conducted using the benchmarked finite element models. The parametric studies consisted of 120 FE analysis and had several parameters including the (i) spacing between flatcars, (ii) load position, and (iii)

44
member relative stiffness. The guidelines developed herein were user-friendly procedures that more accurately load rate RRFC bridges with fully composite concrete decks.
The main girders and exterior girders were determined to be primary members of RRFC bridges constructed with a composite concrete deck, as long as the members are made fully composite with the deck. The parametric study results were used to provide moment distributions between cars (distribution factors) and within each car (car distribution factors) are presented in tables and equations for designers to be utilized in simple and conservative designs.
Another parametric study was conducted to determine the moment distribution between and within the flatcars after a fracture in one of the main girders. The results indicated that approximately 60% of the total flatcar moment due to dead and live remained in the fractured flatcar which is in-line with the experimental evaluations reported by Washeleski et al. (2013). The car distribution factors for the fractured RRFC bridge were also discussed and the results were presented in tables.

45
9 References
AASHTO. (2011). “The Manual for Bridge Evaluation,” Second Edition. American Association of State Highway and Transportation Officials. 2011.
AASHTO. (2012). “LRFD Bridge Design Specifications,” Sixth Edition. American Association of State Highway and Transportation Officials. 2012.
Akinci, N. O., Liu, J., & Bowman, M. D. (2013). “Spring analogy to predict the 3-D live load response of slab-on-girder bridges,” Engineering Structures, Vol. 26, pp. 1049-1057. 2013.
Dassault, (2013). ABAQUS Analysis User’s Manual, Version 6.13.” Providence, RI: Dassault Systèmes Simulia Corp.
Ollgaard, J.G., Slutter, R.G., Fisher, J.W. (1971). “Shear strength of stud connectors in lightweight and normal-weight concrete”, AISC Engineering Journal, Vol. 8, pp. 55–64
Provines, J., Connor, R., and Sherman, R. (2014a). “Development of Load Rating Procedure for Railroad Flatcar Bridges through Use of Field Instrumentation. I: Data Collection and Analysis.” J. Bridge Eng., 19(5), 04013025.
Provines, J., Connor, R., and Sherman, R. (2014b). “Development of Load Rating Procedure for Railroad Flatcar Bridges through Use of Field Instrumentation. II: Procedure Development.” J. Bridge Eng., 19(5), 04013026.
Varma, A.H. (2000). “Seismic behavior, analysis, and design of high strength square concrete filled steel tube (CFT) columns.” Ph.D. dissertation, Dept. of Civil and Environmental Engineering, Lehigh Univ., Bethlehem, Pa.
Washeleski, T., Connor, R., & Lloyd, J. (2013). “Laboratory Testing of Railroad Flatcars for Use as Highway Bridges on Low-Volume Roads to Determine Ultimate Strength and Redundancy,” Indiana Local Technical Assistance Program. Final Report. Purdue University. December 2013.
Wipf, T.J., F.W. Klaiber, J. Witt, and T.L. Threadgold. (1999). “Use of Railroad Flatcars for Low-Volume Road Bridges.” Iowa Department of Transportation Project TR-421.
Wipf, T.J., F.W. Klaiber, J.D. Doornink. (2003). “Demonstration Project Using Railroad Flatcars for Low-Volume Road Bridges.” Iowa Department of Transportation Project TR-444.
Wipf, T.J., F. Wayne Klaiber, Holly A. Boomsma, and Kristine S. Palmer (2007a). “Field Testing of Railroad Flatcar Bridges Volume I: Single Spans.” Iowa Department of Transportation Project TR-498.
Wipf, T.J., F. Wayne Klaiber, Josh J. Massa, Brian Keierleber, and Jim Witt (2007b). “Field Testing of Railroad Flatcar Bridges Volume II: Multiple Spans.” Iowa Department of Transportation Project TR-498.

46
Appendix A : Calculation of Relative Flexural Stiffness for FE Models
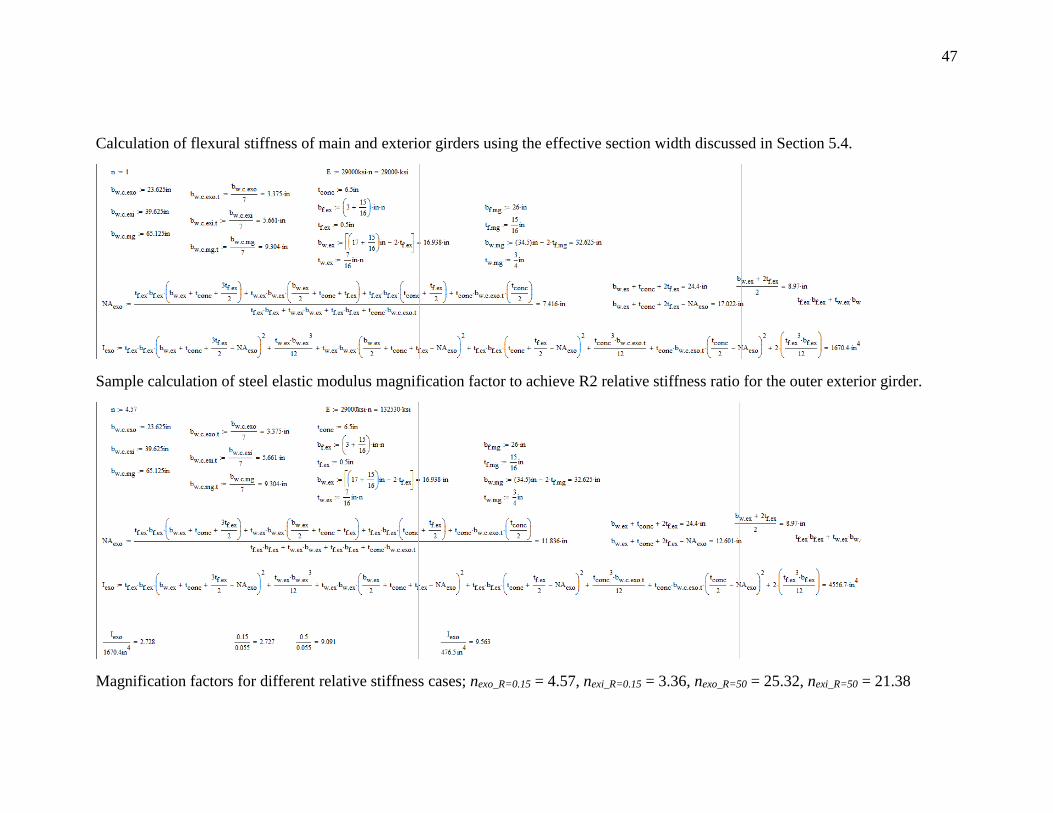
47
Calculation of flexural stiffness of main and exterior girders using the effective section width discussed in Section 5.4.
Sample calculation of steel elastic modulus magnification factor to achieve R2 relative stiffness ratio for the outer exterior girder.
Magnification factors for different relative stiffness cases; nexo_R=0.15 = 4.57, nexi_R=0.15 = 3.36, nexo_R=50 = 25.32, nexi_R=50 = 21.38

48
Appendix B : Car Distribution Factor (CDF) Parametric Study Results for Different Relative Flexural Stiffness Values

49
Figure 30 – Car Distribution Factors for R2
Figure 31 – Car Distribution Factors for R3

50
Figure 32 – Car Distribution Factors for R4
Figure 33 – Car Distribution Factors for R5

51
Appendix C : FE Analysis Results for Fractured Bridge : Redistribution of Locked-in Loads

52
Table 23 – Member Moments Due to Dead Load (before & after fracture) for DIST 1
Table 24 – Member Moments Due to Live Load (before & after fracture) for DIST 1

53
Table 25 – Member Moments Due to Dead Load (before & after fracture) for DIST 5
Table 26 – Member Moments Due to Live Load (before & after fracture) for DIST 5

54
Table 27 – Member Moments Due to Dead Load (before & after fracture) for DIST 7
Table 28 – Member Moments Due to Live Load (before & after fracture) for DIST 7

55
Appendix D : Proposed Ratings Procedures for RRFCs

1 Proposed Guidelines for Load Rating Bridges Constructed from Railroad Flatcars
October 2016
1–INTRODUCTION 1.1–General
These guidelines describe a procedure for determining the stresses due to live load moment when performing a load rating of the longitudinal flexural members of railroad flatcar (RRFC) bridges. The dead load bending stress may be calculated using traditional structural analysis techniques. Shear stresses to be used for rating may also be determined through the use of traditional structural analysis techniques.
C1 C1.1
Retired railroad flatcars are commonly used as
bridges on low-volume roads in rural areas. The objective of these guidelines is to provide conservative but reasonable methods to rate these types of structures. The procedures are heavily based on data obtain from field instrumentation of several RRFC bridges and laboratory testing.
Laboratory testing showed that it is reasonable and conservative to assume that the webs of the main girders carry all of the shear force (Washeleski, 2013).
All references to the AASHTO LRFD Bridge Design Specifications and the AASHTO Manual for Bridge Evaluation are assumed to be the most current version.
1.2–Scope
These guidelines are intended to be used for simply supported, single span RRFC bridges. Deck types which may be included consist of steel plate, timber, or composite reinforced concrete.
The procedures described herein shall be used to determine the maximum live load bending stresses in primary and secondary longitudinal members.
Primary members are defined as the main load carrying elements of a RRFC bridge. These consist of the main box girder(s) for a typical RRFC. For RRFC bridges constructed from boxcars and RRFC bridges constructed with a fully composite concrete deck, the main box girder and exterior longitudinal girders may be considered primary members.
Secondary members are defined as the structural elements which transfer load to the primary members of RRFC bridges. These consist of the exterior girders, stringers, and transverse members for RRFCs except as described above.
The maximum positive live load bending stress for primary members shall be determined based on global bending of the structure. For secondary members, the maximum positive live load bending stress shall be determined based on local bending of the element. The local bending stress shall then be added to the global stress to determine the total stress at a particular location.
Typical RRFCs are defined as those constructed with either one or two main box girders, and generally contain one exterior girder on either
C1.2
Bridges in which the RRFC was cast in place with the abutment (i.e., integral abutments) can be considered simply supported for these guidelines.
Research suggests that composite action under
service loads may be assumed when the main longitudinal members are built-up riveted members (Provines, 2011). For welded built up members or rolled shapes, shear studs must be present.
The exterior girders of typical RRFCs are
generally constructed with channels, while the stringers are generally constructed with inverted T-shapes, I-shapes, or Z-shapes. Although these are

2 Proposed Guidelines for Load Rating Bridges Constructed from Railroad Flatcars
October 2016
side of the flatcar. There is typically a system of three or four longitudinal stringers located between the main girder and exterior girders, found on each side of the main girder.
These guidelines are intended to be applicable
for RRFCs utilizing all types of longitudinal connections. A longitudinal connection is defined as the connection between side by side RRFCs.
Figure 1.1 provides an example of railroad cars which are meant to be included within the scope of these guidelines. The figure also provides examples of which elements are defined as primary members or secondary members. Examples presented in the figure are not meant to be an all-inclusive list of railroad car types for which these guidelines are eligible, but are simply presented to provide engineers with additional guidance for load rating RRFC bridges.
typical features, the exterior girders and stringers are often constructed using different structural shapes.
The cross section and behavior of bridges built using a boxcar differs from other RRFCs. Instead of a box girder, the main longitudinal member typically consists of two Z-shapes facing opposite directions with their top flanges welded together. Therefore these rating procedures differentiate between RRFCs constructed from boxcars and other cross sections.
Boxcars have been used as bridges after their sides and tops have been removed. These types of cars have also been referred to as “car haulers.” The two Z-shapes used to form the main girder generally contain a steel plate welded to the top flanges of each shape.
It is not recommended boxcars be used as bridges.
Typically RRFC bridges are constructed by placing two (or more) RRFCs side by side. The exterior girders of adjacent RRFCs are commonly cut to form the longitudinal connection. This connection typically extends longitudinally along the length of the bridge.
Based on field studies of RRFC bridges (Provines, 2011; Wipf et. al. 2007a; Wipf et. al. 2007b), there is a wide range of longitudinal connections used to connect adjacent flatcars. Particular longitudinal connection types were generally seen to be consistent within a particular area or county.

3 Proposed Guidelines for Load Rating Bridges Constructed from Railroad Flatcars
October 2016
Figure 1.1: Examples of railroad cars included in scope & member definitions
1.2.1–Material Properties
The elastic modulus of a steel RRFC may be assumed to be 29,000 ksi.
The yield strength (Fy) and ultimate strength
(Fu) of a steel RRFC shall be determined using one of the following methods:
Recorded from the structural plans of the RRFC
Material testing of sample taken from RRFC
C1.2.1
Based on coupon tests from multiple types of RRFCs (Wipf et. al. 2007a; Wipf et. al. 2007b), 29,000 ksi is an acceptable assumed elastic modulus value to be used when performing a load rating on a RRFC bridge.
Based on discussions with several railroad companies and railroad car manufacturers (Provines, 2011), the main structural elements of RRFCs have been constructed with high-strength low-alloy steels with yield strengths ranging from 50-70 ksi since the 1970’s. However before the 1970’s, RRFC were most likely constructed with steels with a yield strength of either 36 or 50 ksi.

4 Proposed Guidelines for Load Rating Bridges Constructed from Railroad Flatcars
October 2016
Assumed values of Fy = 36 ksi & Fu = 58 ksi
The elastic modulus of concrete, if used as
bridge deck, shall be determined based on The AASHTO Manual for Bridge Evaluation.
Therefore an assumption of a yield strength of 36 ksi is conservative. Coupon tests from multiple types of RRFCs (Wipf et. al. 2007a; Wipf et. al. 2007b), confirmed that 36 ksi is an acceptable assumed yield strength value.
1.2.2–Dynamic Load Allowance
The static effects of the live loads shall be increased by 33 percent to account for the dynamic effects due to moving vehicles.
C1.2.2
Based on field instrumentation studies investigating the dynamic behavior of RRFC bridges (Wipf et. al. 2007a; Wipf et. al. 2007b), a 33 percent increase in the static bending stress provided conservative estimates for the dynamic bending stress. Although the measured dynamic impact factor varied between different RRFC bridges, a value of 33 percent was chosen to be consistent with current load rating procedures in The AASHTO Manual for Bridge Evaluation.
1.2.3–Fatigue & Fracture Provisions
The fatigue limit state of a RRFC bridge need not be explicitly evaluated if the ADTT (or heavy vehicle traffic) is such that road can be classified as low-volume road over the life of the bridge. Sound engineering judgment shall be used when determining whether or not the RRFC bridge can be considered low-volume.
If fatigue cracks are found in the RRFC during
routine inspections, the fatigue life shall not be considered sufficient and a fatigue evaluation shall be performed to determine the cause of the cracking and to develop a mitigation strategy.
C1.2.3
The stress ranges and number of cycles a RRFC experiences during its railroad service life are most likely much greater than those experienced during its life as a low volume road bridge. Flatcars are typically designed for heavy loads, sometimes up to 70-110 tons as discussed in Article C2.1.2, which are much greater than the majority of vehicles crossing a typical RRFC bridge. In a study investigating the use of RRFCs as low-volume road bridges (Wipf et. al. 1999), many agencies which use RRFC bridges were contacted and all of which verified that fatigue had not ever been an issue.
If there are concerns regarding the susceptibility of fracture, Charpy V-Notch (CVN) tests may be performed on a material sample from the appropriate component of the RRFC. The CVN results can be correlated to fracture toughness, which provides a measure of a material’s resistance to fracture. However, in lieu of a full fitness-for-service (FFS) assessment, the CVN data may be compared to existing requirements for bridge steels.
1.3–Approach
The maximum positive live load bending stress determined by these guidelines are intended to be
C1.3 These guidelines are not applicable to the load
and resistance factor rating (LRFR) or the load

5 Proposed Guidelines for Load Rating Bridges Constructed from Railroad Flatcars
October 2016
used in conjunction with the AASHTO Manual for Bridge Evaluation. These guidelines are intended to be applicable for the allowable stress load rating procedures found in the AASHTO Manual for Bridge Evaluation. Other checks, (e.g., local buckling) shall be performed per the The AASHTO Manual for Bridge Evaluation.
factor rating (LFR) because load and resistance factors were not developed. Further research is required if either of these two procedures is to be used.
2–BRIDGES CONSTRUCTED FROM TYPICAL RRFCs
The following sections describe the procedures to be used for determining the maximum positive live load bending stress in bridges constructed from typical RRFCs.
The provisions in this section apply to RRFC with all deck types except those with a composite concrete deck. RRFCs with composite concrete decks are addressed in Article 4.
C2
Research has shown (Washeleski, 2013) that
RRFCs which utilize a composite concrete deck possess superior load distribution characteristics than timber or thin steel plate decks. Hence, these structures are evaluated with separate provisions.
2.1–Determination of Maximum Positive Live Load Bending Stress in Primary Members
This section describes the procedures which shall be used for determining the maximum positive live load bending stress in primary members.
C2.1
As stated in Article 1.2, the primary members of typical RRFCs consist of the main box girder(s) located near the center of a flatcar.
2.1.1–General Equation
The following general expression shall be used in determining the maximum positive live load bending stress:
𝜎𝐿𝐿 = (𝛼) (𝐶𝐷𝐹)(𝐷𝐹) 𝑀𝐿𝐿
𝑆𝑒𝑓𝑓 (2.1.1-1)
where:
𝜎𝐿𝐿 = Maximum positive live load bending stress 𝛼 = Stress modification factor as specified in Article 2.1.1.5 𝐶𝐷𝐹 = Car distribution factor as specified in Article 2.1.1.3 𝐷𝐹 = Distribution factor as specified in Article 2.1.1.2 𝑀𝐿𝐿 = Maximum positive live load moment as specified in Article 2.1.1.1
a C2.1.1
The general equation for the determination of the maximum positive live load bending stress was developed through field instrumentation and controlled load testing of several RRFC bridges (Provines, 2011).

6 Proposed Guidelines for Load Rating Bridges Constructed from Railroad Flatcars
October 2016
𝑆𝑒𝑓𝑓 = Effective section modulus as specified in
Article 2.1.1.4 2.1.1.1–Maximum Positive Live Load Moment
The maximum positive live load moment (𝑀𝐿𝐿)
shall be determined using procedures described in The AASHTO Manual for Bridge Evaluation.
C2.1.1.1
2.1.1.2–Distribution Factor The following expression shall be used in
determining the distribution factor (DF):
𝐷𝐹 = 𝑀𝑃 ≤ 1.0 (2.1.1.2-1)
where: 𝐷𝐹 = Distribution factor 𝑀𝑃 = Moment proportion as specified in Article 2.1.1.2.1
C2.1.1.2 The distribution factor is intended to represent
load distribution between flatcars. It is differentiated from the car distribution factor, which is intended to represent load distribution within a flatcar.
The distribution factor, as determined by Eq. 2.1.1.2-1, was developed based on field instrumentation results in which RRFC bridges were loaded with one tandem axle test truck (Provines, 2011). Even if a bridge was loaded with two trucks, the data suggested that the moment proportion described in Article 2.1.1.2.1 would provide a conservative distribution factor.
2.1.1.2.1–Moment Proportion
The moment proportion (MP) shall be
determined based on the lever rule, as described in the AASHTO LRFD Bridge Design Specifications. The lever rule shall be used to distribute the live load moment to each of the RRFCs. The reactions used when computing the lever rule shall be located at the centerline of each RRFC. The moment proportion shall be determined as follows:
If the longitudinal connection between RRFCs can be considered a rigid connection:
𝑀𝑃 = Result from lever rule
C2.1.1.2.1
The load tests which resulted in the development of Eq. 2.1.1.2-1 were performed on bridges which were constructed of two RRFCs connected side-by-side (Provines, 2011). It is reasonable to believe the lever rule provides conservative results for bridges with either less than two or more than two RRFCs in the cross section. For instance, if a bridge was constructed of a single RRFC, the lever rule result would be equal to 1.0. The lever rule should also be conservative if used on a bridge constructed with three RRFCs side-by-side. If a truck was located on one of the outside flatcars, according to the lever rule the flatcar on the opposite side would carry zero load provided the truck did not cross the centerline of the middle flatcar. The lever rule, and Eq. 2.1.1.2-1, were used to predict stresses in multiple RRFC bridges in which field instrumentation was used (Wipf et. al. 2003; Wipf et. al. 2007a). Good correlation was found to exist between the calculated and field measured stresses.
The lever rule is based on the assumption of a rigid deck. This assumption is violated if the longitudinal connection is not stiff enough in the transverse direction to be considered rigid, therefore no load can be transferred from one

7 Proposed Guidelines for Load Rating Bridges Constructed from Railroad Flatcars
October 2016
If the longitudinal connection between RRFCs cannot be considered a rigid connection or if there is no longitudinal connection:
𝑀𝑃 = 1.0
RRFC to the other. The evaluation of whether or not a longitudinal
connection is sufficiently stiff to transfer moment from one RRFC to another should be determined through analysis and engineering judgment.
2.1.1.3–Car Distribution Factor
The car distribution factor (𝐶𝐷𝐹) shall be determined as follows:
For RRFCs with one main box girder:
𝐶𝐷𝐹 = 1.0
For RRFCs with two main box girders:
𝐶𝐷𝐹 = 3
4
C2.1.1.3
Based on field instrumentation results for
RRFCs with only one main box girder, the main girder carries the entire global live load moment (Provines, 2011). In other words, it is not distributed to any other members (i.e., the exterior girders) within the flatcar.
No RRFCs with two main box girders were field tested in the study (Provines, 2011). However, based on stress results from the single box girder RRFCs and boxcars, it seems reasonably conservative to assign a car distribution factor of 3/4 for RRFCs with two main box girders.
2.1.1.4–Effective Section
The effective section modulus (𝑆𝑒𝑓𝑓) for bridges
with RRFCs containing one main box girder shall be determined based on the following effective sections:
For bridges which are constructed with RRFCs containing large exterior girders, the effective section shall consist of the entire RRFC, including the main girder, exterior girders, and any other structural longitudinal elements. Large exterior girders are defined as those which have a moment of inertia of at least 15% of the moment of inertia of the main girder.
For bridges which are constructed with RRFCs containing small exterior girders, the effective section shall consist of the main box girder and two stringers on each side of the main girder. Small exterior girders are defined as those which have a moment of inertia of less than 15% of the
C2.1.1.4
Results from field instrumentation of RRFC
bridges with large exterior girders (Provines, 2011) showed it is conservative to assume the entire flatcar participates in global bending. Results from other field instrumentation studies confirmed this assumption to be reasonably conservative (Wipf et. al. 2003; Wipf et. al. 2007a).
Results from a field instrumentation study
showed it is conservative to assume only two stringers on either side of the main girder participate in global bending of RRFCs with smaller exterior girders (Provines, 2011).

8 Proposed Guidelines for Load Rating Bridges Constructed from Railroad Flatcars
October 2016
moment of inertia of the main girder.
The 𝑆𝑒𝑓𝑓 for bridges with RRFCs containing two
main box girders shall be determined based on the shaded effective section shown in Figure 2.1. The effective section shall include any longitudinal structural elements within the section and shall have a minimum section of at least the box girder.
Although no RRFCs with two main box girders
were tested, it is reasonable to believe the effective section for these types of cars is similar to RRFCs with one box girder. For RRFCs with one box girder, two stringers on each side represents roughly half the distance between the edge of the main girder and the edge of the flatcar. The effective section shown in the figure is based on the idea that half the distance between the main girder and the edge of the flatcar is participating in global bending.
Figure 2.1: Effective section for typical 2-box girder RRFC
The dimensions used for determining the effective section shall be obtained through field measurements or as-built drawings. Any deterioration, such corrosion or cracks, in structural members shall be considered in these dimensions.
2.1.1.5–Stress Modification Factor The stress modification factor (α) shall be taken
equal to 0.75
C2.1.1.5
The stress modification factor was developed based on the field instrumentation test results to more accurately, but still conservatively, match stresses calculated using Eq.2.1.1-1 with those measured during field testing (Provines, 2011). The stress modification factor of 0.75 was also verified through the results of previous field instrumentation studies of RRFC bridges (Wipf et. al. 2003; Wipf et. al. 2007a). Although no bridges with RRFCs containing two box girders were tested in the field instrumentation study, it is reasonable to assume stress modification factor of 0.75 would be conservative for these types of structures.

9 Proposed Guidelines for Load Rating Bridges Constructed from Railroad Flatcars
October 2016
2.1.2–Alternative Load Rating Procedure
An acceptable alternative approach to load rating the primary members of RRFC bridges is to ensure the maximum live load on the bridge is always less than the original design live load limit of the flatcar while it was in use on the railroad. For this to be an acceptable load rating approach, the RRFC shall be supported on its wheel trucks, which are defined as the locations where the original wheels attached to the flatcar (shown in Figure 2.2). The RRFC shall be in good condition and the original design live load limit shall be properly documented. The RRFC shall also have been designed after 1964.
C2.1.2
The design live load of a RRFC is called the live load limit. The live load limit is stenciled onto some RRFCs.
RRFCs are designed to be supported at the wheel trucks, thus their performance is better when they are supported at these locations. The specifications stated in Article 2.1.2 imply that flatcars which have been cut to fit a particular span length are ineligible for the alternative load rating procedure.
There was no standard loading for RRFCs prior to 1964, when the Association of American Railroads (AAR) Design Specifications were issued. Currently (AAR 2007) there are three major classifications of design live loads for RRFCs, which can be seen in Table C1.
Table C1: Design live loads for RRFCs
Live Load Limit
kips (tons)
Gross Rail Load
kips (tons)
140 (70) 220 (110)
200 (100) 263 (131.5)
220 (110) 286 (143)
In Table C1, the live load limit refers to the
maximum live load that can be applied to the flatcar while the gross rail load refers to the maximum vertical load on the flatcar, including the live load plus the self weight of the flatcar.
The live load values presented in Table C1 can be applied to a RRFC in a number of different load cases, as per AAR Manual of Standards and Recommended Practices Section C – Part II (AAR 2007).
In a literature review performed regarding the use of RRFCs as low-volume road bridges (Provines, 2011), it was not confirmed if the values in Table C1 date back to 1964 or if they were issued in a newer Specification; therefore the design loads for each particular RRFC must be known and documented when using the alternative load rating approach as specified in Article 2.1.2.

10 Proposed Guidelines for Load Rating Bridges Constructed from Railroad Flatcars
October 2016
Figure 2.2: Location of wheel trucks on typical RRFC
2.2–Determination of Maximum Positive Live Load Bending Stress in Secondary Members
This section describes the procedures which shall be used for determining the maximum positive live load bending stress in secondary members. The local bending stress shall then be added to the global stress to determine the total stress at a particular location.
C2.2
As stated in Article 1.2, the secondary members of typical RRFCs consist of the exterior girders and stringers.
2.2.1–RRFCs With Two Box Girders
The following methods shall be acceptable for determining the maximum positive live load bending stress in secondary members of RRFCs with two box girders:
Orthotropic plate theory equations found in the AASHTO LRFD Bridge Design Specifications
Finite element analysis
Field instrumentation and testing
Any reasonable and accepted engineering method
C2.2.1
No bridges constructed with RRFCs consisting of two box girders were tested through the use of field instrumentation (Provines, 2011). Due to their large difference in geometry, it was not reasonable to presume the methods developed for RRFCs with one box girder would produce conservative stress results for RRFCs constructed with two box girders.
Engineering judgment should be practiced when performing one of the four methods listed in Article 2.2.2.
2.2.2–General Equation For RRFCs With One Box Girder
The following general expression shall be used in determining the maximum positive live load bending stress in secondary members of RRFCs with one box girder:
𝜎𝐿𝐿 = (𝐷𝐹) 𝑀𝐿𝐿
𝑆𝑒𝑓𝑓 (2.2.2-1)
C2.2.2
The general equation for the determination of
the maximum positive live load bending stress in secondary members was developed through field instrumentation and controlled load testing of several RRFC bridges (Provines, 2011).

11 Proposed Guidelines for Load Rating Bridges Constructed from Railroad Flatcars
October 2016
where:
𝜎𝐿𝐿 = Maximum positive live load bending stress 𝐷𝐹 = Distribution factor as specified in Article 2.2.2.2 𝑀𝐿𝐿 = Maximum positive live load moment as specified in Article 2.2.2.1 𝑆𝑒𝑓𝑓 = Effective section modulus as specified in
Article 2.2.2.3.
2.2.2.1–Maximum Positive Live Load Moment
If the center-to-center span of the secondary member between adjacent transverse members is five feet or less, the following expression shall be used when determining the maximum positive live load moment:
𝑀𝐿𝐿 =𝑃𝐿
4 (2.2.2-1)
where: 𝑃 = Weight of single rear axle wheel load 𝐿 = Center to center span of secondary member between adjacent transverse members
If the center-to-center span of the secondary member between consecutive transverse members is greater than five feet, the tandem and single axle wheel loads shall be positioned to establish the maximum positive live load moment. Moment equations for simply supported spans shall be used.
C2.2.2.1 Based on field measurements of RRFCs
(Provines, 2011), the simply supported moment equation yielded conservative, but reasonable stresses in secondary members.
The weight of a single rear axle wheel load can be determined by taking the weight of a rear axle of a design truck and dividing it by 4. The axle weight is divided by 2 because the rear axles (32 kip in HS-20 truck) in the AASHTO design trucks represent a pair of tandem axles. It has been shown through field testing that the presence of each individual axle causes local bending of secondary members. The single axle weight can then be divided by 2 again to represent the weight of each wheel load.
Although all of the RRFC bridges tested through the use of field instrumentation had secondary members with spans of less than five feet, it is reasonable to use the simply supported moment equations for determining moments on secondary members with greater span lengths.
Eq. 2.2.2-1 cannot be used for spans greater than five feet because the entire tandem can be located on the span.
2.2.2.2–Distribution Factor
The distribution factor (𝐷𝐹) for secondary members shall be calculated as follows:
If 𝐼1
𝐼2 ≥ 3:
𝐷𝐹 = 1
C2.2.2.2
Field instrumentation test results (Provines, 2011) showed if one secondary member was at least three times as stiff any other secondary member in the group, it could attract all of the live load moment. The results also showed that if the secondary members of a group were of relatively similar stiffness (e.g., less than two times as stiff), the maximum portion of the live load moment any

12 Proposed Guidelines for Load Rating Bridges Constructed from Railroad Flatcars
October 2016
If 3 > 𝐼1
𝐼2 ≥ 2:
𝐷𝐹 = 4
5
If 𝐼1
𝐼2 < 2:
𝐷𝐹 = 3
5
where: 𝐼1 = moment of inertia of secondary member being rated 𝐼2 = largest moment of inertia of secondary member within group not being rated
A group of secondary members shall be defined as those on one side of the main girder.
The moment of inertia shall be determined
based on the effective sections prescribed in Article 2.2.2.3.
stringer experienced was 3/5. A linear interpolation between these two results was found to be acceptable for secondary members with a relative stiffness between 2 and 3.
A group of secondary members typically consists of one exterior girder, which may be cut if it is used to form the longitudinal connection, and three stringers.
2.2.2.3–Effective Section
The effective section modulus (𝑆𝑒𝑓𝑓) shall be
determined based on whether the secondary member has been cut and whether it is rigidly attached to a steel deck. A “cut” secondary member is defined as one which has had a portion of its structural shape removed. The effective section modulus shall be determined based on the following effective sections:
For exterior girders which are not cut and are rigidly attached to a steel deck, the effective section shall consist of the structural shape of the exterior girder.
For exterior girders which have been cut and are rigidly attached to a steel deck, the effective section shall consist of the remaining portion of the structural shape and a portion of the steel deck with a width equal to the width of the bottom flange of the structural shape of the exterior girder.
C2.2.2.3
Many exterior girders which are located on the inside of the bridge, adjacent to another RRFC, are cut in the field in order to form a longitudinal connection between RRFCs.
Field testing results (Provines, 2011) showed
portions of the steel deck participated in local bending if the secondary member was rigidly connected to the deck.

13 Proposed Guidelines for Load Rating Bridges Constructed from Railroad Flatcars
October 2016
For exterior girders which are not rigidly attached to a steel deck, the effective section shall consist of the structural shape of the exterior girder.
For stringers which are rigidly attached to a steel deck, the effective section shall consist of the structural shape and a portion of the steel deck with a width equal to the width of the bottom flange of the structural shape of the stringer.
For stringers, which are not rigidly attached to a steel deck, the effective section shall consist of the structural shape of the stringer.
3–BRIDGES CONSTRUCTED FROM BOXCARS
The following sections describe the procedures which shall be used for determining the maximum positive live load bending stress in bridges constructed from boxcars.
C3
3.1–Determination of Maximum Positive Live Load Bending Stress in Primary Members
This section describes the procedures which shall be used for determining the maximum positive live load bending stress in primary members. The local bending stress shall then be added to the global stress to determine the total stress at a particular location.
C3.1
As stated in Article 1.2, the primary members of boxcars consist of the main girder and the two exterior girders.
3.1.1–General Equation
The following general expression shall be used in determining the maximum positive live load bending stress:
𝜎𝐿𝐿 = (𝛼)(𝐶𝐷𝐹) (𝐷𝐹) 𝑀𝐿𝐿
𝑆𝑒𝑓𝑓 (3.1.1-1)
where: 𝜎𝐿𝐿 = Maximum positive live load bending stress 𝛼 = Stress modification factor as specified in Article 3.1.1.5 𝐶𝐷𝐹 = Car distribution factor as specified in Article 3.1.1.3
C3.1.1
The general equation for the determination of the maximum positive live load bending stress was developed through field instrumentation and controlled load testing of a bridge constructed of boxcars (Provines, 2011).

14 Proposed Guidelines for Load Rating Bridges Constructed from Railroad Flatcars
October 2016
𝐷𝐹 = Distribution factor as specified in Article 3.1.1.2 𝑀𝐿𝐿 = Maximum positive live load moment as specified in Article 3.1.1.1 𝑆𝑒𝑓𝑓 = Effective section modulus as specified in
Article 3.1.1.4 3.1.1.1–Maximum Positive Live Load Moment
The maximum positive live load moment (𝑀𝐿𝐿)
shall be determined using procedures described in The AASHTO Manual for Bridge Evaluation.
C3.1.1.1
3.1.1.2–Distribution Factor
The following expression shall be used in determining the distribution factor (DF):
𝐷𝐹 = 𝑀𝑃 ≤ 1.0 (3.1.1.2-1)
where: 𝐷𝐹 = Distribution factor 𝑀𝑃 = Moment proportion as specified in Article 3.1.1.2.1
C3.1.1.2
The distribution factor is intended to represent load distribution between boxcars. It is differentiated from the car distribution factor, which is intended to represent load distribution within a boxcar.
3.1.1.2.1–Moment Proportion
The moment proportion (MP) shall be determined based on the lever rule, as described in the AASHTO LRFD Bridge Design Specifications. The lever rule shall be used to distribute the live load moment to each of the boxcars. The reactions used for when computing the lever rule shall be located at the centerline of each boxcar. The moment proportion shall be determined as follows:
If the longitudinal connection between boxcars can be considered a rigid connection:
C3.1.1.2.1
The load tests which resulted in the development of Eq. 3.1.1.2-1 were performed on a bridge which was constructed of two boxcars connected side-by-side. It is reasonable to believe the lever rule provides conservative results for bridges using either less than two or more than two boxcars in the cross section. For instance, if a bridge was constructed of a single boxcar, the lever rule result would be equal to 1.0. The lever rule would be conservative if used on a bridge constructed with three boxcars side-by-side. If a truck was located on one of the outside boxcars, according to the lever rule the boxcar on the opposite side would carry zero load provided the truck did not cross the centerline of the middle boxcar.
The lever rule is based on the assumption of a rigid deck. This assumption is violated if the longitudinal connection is not stiff enough in the transverse direction to be considered rigid,
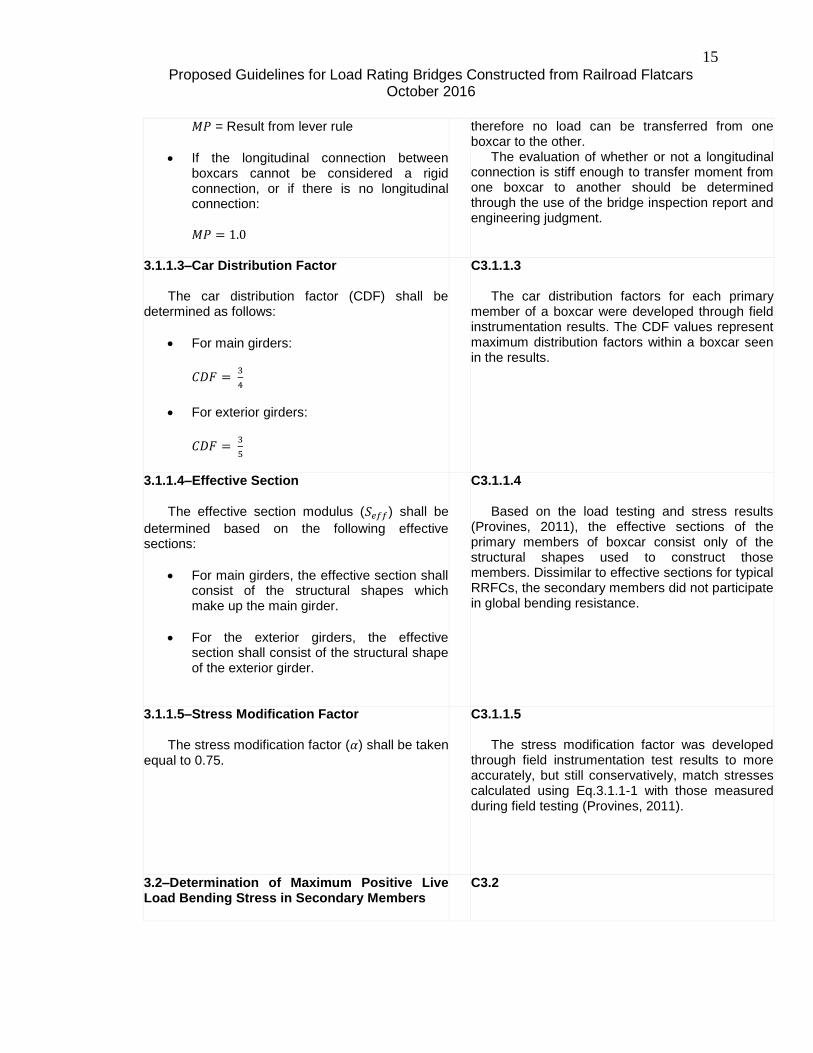
15 Proposed Guidelines for Load Rating Bridges Constructed from Railroad Flatcars
October 2016
𝑀𝑃 = Result from lever rule
If the longitudinal connection between boxcars cannot be considered a rigid connection, or if there is no longitudinal connection:
𝑀𝑃 = 1.0
therefore no load can be transferred from one boxcar to the other.
The evaluation of whether or not a longitudinal connection is stiff enough to transfer moment from one boxcar to another should be determined through the use of the bridge inspection report and engineering judgment.
3.1.1.3–Car Distribution Factor
The car distribution factor (CDF) shall be determined as follows:
For main girders:
𝐶𝐷𝐹 = 3
4
For exterior girders:
𝐶𝐷𝐹 = 3
5
C3.1.1.3
The car distribution factors for each primary member of a boxcar were developed through field instrumentation results. The CDF values represent maximum distribution factors within a boxcar seen in the results.
3.1.1.4–Effective Section The effective section modulus (𝑆𝑒𝑓𝑓) shall be
determined based on the following effective sections:
For main girders, the effective section shall consist of the structural shapes which make up the main girder.
For the exterior girders, the effective section shall consist of the structural shape of the exterior girder.
C3.1.1.4 Based on the load testing and stress results
(Provines, 2011), the effective sections of the primary members of boxcar consist only of the structural shapes used to construct those members. Dissimilar to effective sections for typical RRFCs, the secondary members did not participate in global bending resistance.
3.1.1.5–Stress Modification Factor
The stress modification factor (𝛼) shall be taken equal to 0.75.
C3.1.1.5
The stress modification factor was developed through field instrumentation test results to more accurately, but still conservatively, match stresses calculated using Eq.3.1.1-1 with those measured during field testing (Provines, 2011).
3.2–Determination of Maximum Positive Live Load Bending Stress in Secondary Members
C3.2

16 Proposed Guidelines for Load Rating Bridges Constructed from Railroad Flatcars
October 2016
The following methods shall be acceptable for determining the maximum positive live load bending stress in secondary members of boxcars:
Orthotropic plate theory equations found in the AASHTO LRFD Bridge Design Specifications
Finite element analysis
Field instrumentation and testing
Any reasonable and accepted engineering method
Based on the limited field testing data from a
single boxcar bridge, no conclusive specific methods for determining bending stress in secondary members were developed.
4–BRIDGES CONSTRUCTED FROM TYPICAL RRFCS WITH A COMPOSITE CONCRETE DECK
The following sections describe the procedures to be used for determining the maximum positive live load bending stress in bridges constructed from typical RRFCs with a fully composite concrete deck.
C4
4.1–Determination of Maximum Positive Live Load Bending Stress in Primary Members
The following conditions must be satisfied to use the procedures in Article 4.1:
The primary members of a bridge constructed with typical RRFCs and a fully composite concrete deck include the main box girder and the two exterior girders;
The primary members shall be fully composite with the concrete deck;
The concrete deck shall have the ability to transfer load within a single flatcar; and
The concrete deck shall have the ability to transfer load between flatcars;
C4.1
Research has demonstrated that the main box
girder and the two exterior girders function as primary load carrying members when a composite concrete deck is present (Washeleski, 2013). If the exterior members are altered during installation, this assumption may not be valid and further evaluation should be performed.
Laboratory testing showed that composite action between the flatcar member and the concrete deck was achieved when shear connectors were designed using procedures provided in the AASHTO LRFD Bridge Design Specifications (Washeleski, 2013).
Exterior girders that were altered, or cut, are not assumed to be capable of achieving composite action.
Composite action can be achieved through the use of shear studs, rivet heads extending from built-up members into the concrete deck, or other acceptable means of transferring load from the concrete deck to the RRFC.
Field instrumentation results from a bridge constructed of a flatcar with riveted built-up members showed composite action with its concrete deck (Provines, 2011).
4.1.1–General Equation
C4.1.1

17 Proposed Guidelines for Load Rating Bridges Constructed from Railroad Flatcars
October 2016
The following general expression shall be used in determining the maximum positive live load bending stress:
𝜎𝐿𝐿 = (𝛼) (𝐶𝐷𝐹)(𝐷𝐹) 𝑀𝐿𝐿
𝑆𝑒𝑓𝑓 (4.1.1-1)
where:
𝜎𝐿𝐿 = Maximum positive live load bending stress 𝛼 = Stress modification factor as specified in Article 4.1.1.5 𝐶𝐷𝐹 = Car distribution factor as specified in Article 4.1.1.3 𝐷𝐹 = Distribution factor as specified in Article 4.1.1.2 𝑀𝐿𝐿 = Maximum positive live load moment for one lane loaded as specified in Article 4.1.1.1 𝑆𝑒𝑓𝑓 = Effective section modulus as specified in
Article 4.1.1.4
The general equation for the determination of the maximum positive live load bending stress was developed through field instrumentation and controlled load testing of several RRFC bridges (Provines, 2011).
The application of this equation for RRFC bridges with a fully composite concrete deck was refined through instrumentation and controlled load testing of a full-scale RRFC bridge in the laboratory (Washeleski, 2013) and verified by detailed finite element analysis of the tested bridge (Sener et al., 2015).
4.1.1.1–Maximum Positive Live Load Moment
The maximum positive live load moment for a single lane loaded (𝑀𝐿𝐿) shall be determined using procedures described in The AASHTO Manual for Bridge Evaluation.
C4.1.1.1
4.1.1.2–Distribution Factor
The following expression shall be used in determining the distribution factor (DF):
𝐷𝐹 = 𝑀𝑃 ≤ 1.0 (4.1.1.2-1)
where: 𝐷𝐹 = Distribution factor 𝑀𝑃 = Moment proportion as specified in Article 4.1.1.2.1
C4.1.1.2
The distribution factor is intended to represent load distribution between flatcars. It is differentiated from the car distribution factor, which is intended to represent load distribution within a flatcar.
4.1.1.2.1–Moment Proportion
The moment proportion (MP) shall be determined using the smaller of the proportion
C4.1.1.2.1
The lever rule to determine the moment proportion may still be used in this application;

18 Proposed Guidelines for Load Rating Bridges Constructed from Railroad Flatcars
October 2016
obtained from Equation 4.1.1.2.1-1 or Table 4.1 for one lane loaded, schematically shown in Figure 4.1. Table 4.2 shall be used for two lanes loaded.
𝐷𝐹 = 0.85 + 0.027𝑅 + 0.002𝐷 − 0.0045𝐿 (4.1.1.2-2)
where: 𝑅 = Relative flexural stiffness ratio of exterior and interior (main) girders in flatcar 𝐷 = 𝑆𝑅𝑅𝐹𝐶 Clear distance between flatcars in inches 𝐿 = Distance from outside face of loaded flatcar to location of outside wheel of truck axle in inches
however, laboratory testing showed it provides overly conservative results (Washeleski 2013).
The moment proportion equation was obtained for the loaded flatcar by performing a finite element analysis parametric study (Sener et al., 2015). The finite element model was benchmarked using the experimental data collected during laboratory testing on a RRFC bridge constructed with two typical RRFCs and a fully composite concrete deck (Washeleski, 2013). Equation 4.1.1.2-2 was developed by performing multi-linear regression analysis on the parametric study results (Sener et al., 2015).
Equation 4.1.1.2-2 provides more accurate estimates for distribution factors (DF) than Table 4.1. The moment proportions provided in Table 4.1 are moment envelopes obtained through the parametric study using the finite element analysis results (Sener et al., 2015). Hence, the proportions do not always sum to 1.0.
The parametric study was performed for bridges constructed of two RRFCs connected side-by-side. The lever rule may be used for bridges with either less than two or more than two RRFCs in the cross section, as described in Article C2.1.1.2.1.
The application of the moment proportion equation and tables are based on the assumption of a properly designed and constructed concrete deck to transfer load between the flatcars. The application is also based on the assumption that the main girders and exterior girders are fully composite with the concrete deck, as described in Article 4.1.
Table 4.1: Moment proportion for one lane loaded
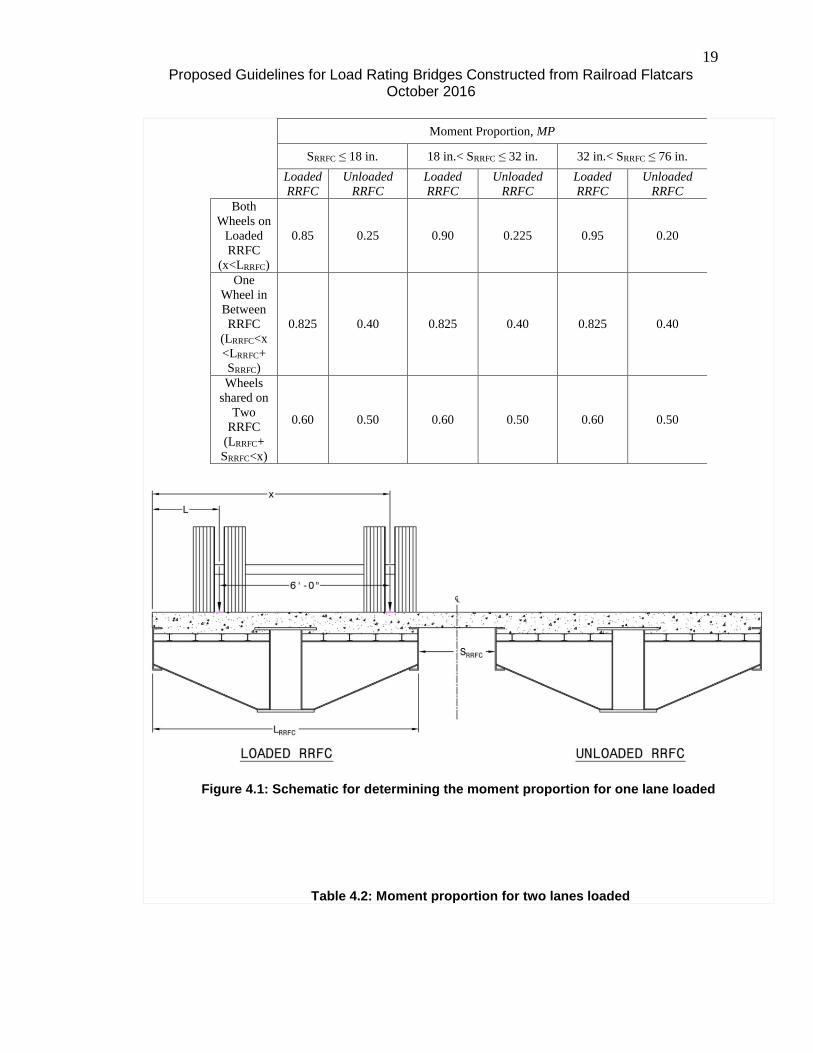
19 Proposed Guidelines for Load Rating Bridges Constructed from Railroad Flatcars
October 2016
Figure 4.1: Schematic for determining the moment proportion for one lane loaded
Table 4.2: Moment proportion for two lanes loaded
Moment Proportion, MP
SRRFC ≤ 18 in. 18 in.< SRRFC ≤ 32 in. 32 in.< SRRFC ≤ 76 in.
Loaded
RRFC
Unloaded
RRFC
Loaded
RRFC
Unloaded
RRFC
Loaded
RRFC
Unloaded
RRFC
Both
Wheels on
Loaded
RRFC
(x<LRRFC)
0.85 0.25 0.90 0.225 0.95 0.20
One
Wheel in
Between
RRFC
(LRRFC<x
<LRRFC+
SRRFC)
0.825 0.40 0.825 0.40 0.825 0.40
Wheels
shared on
Two
RRFC
(LRRFC+
SRRFC<x)
0.60 0.50 0.60 0.50 0.60 0.50

20 Proposed Guidelines for Load Rating Bridges Constructed from Railroad Flatcars
October 2016
where: 𝐿𝑅𝑅𝐹𝐶 = Section width of loaded flatcar 𝑆𝑅𝑅𝐹𝐶 = Clear distance between flatcars 𝑥 = Distance from outside face of loaded flatcar to location of inside wheel of truck axle
4.1.1.3–Car Distribution Factor
The car distribution factor (CDF) shall be determined as specified in Table 4.3.
Table 4.3: Car distribution factor
where:
𝐼𝑒𝑥𝑡 = Moment of inertia about the strong axis of the exterior girder composite section 𝐼𝑚𝑎𝑖𝑛 = Moment of inertia about the strong axis of the main girder composite section
C.4.1.1.3 Based on laboratory test results for a bridge
constructed with two RRFCs and a fully composite concrete deck, the main girder and exterior girders within a flatcar were found to carry the entire “global” live load moment (Washeleski, 2013). The CDF represents the distribution of the moment within a flatcar between the primary members.
The CDFs were developed using laboratory test data and through an analytical parametric study by modeling the tested bridge using finite element analysis (Sener et al., 2015).
The application of the CDF provided in the table is based on the assumption of a properly designed and constructed concrete deck to transfer load within the flatcars. The application is also based on the assumption that the main girders and exterior girders are fully composite with the concrete deck, as described in Article 4.1.
4.1.1.4–Effective Section C.4.1.1.4
Moment Proportion, MP
SRRFC ≤ 18 in. 18 in. < SRRFC ≤ 32.3 in. 32.3 in. < SRRFC ≤ 76 in.
Loaded RRFC Loaded RRFC Loaded RRFC
1.25 1.35 1.45
Car Distribution Factor (CDF)
Stiffness Ratio Main
Girder
Exterior
Girder(s)
Iext/Imain ≤ 5% 0.90 0.10
5% < Iext/Imain ≤ 15% 0.80 0.20
15% < Iext/Imain ≤ 25% 0.70 0.30
25% < Iext/Imain ≤ 50% 0.55 0.40
50% < Iext/Imain ≤ 75% 0.45 0.50

21 Proposed Guidelines for Load Rating Bridges Constructed from Railroad Flatcars
October 2016
The effective section modulus (𝑆𝑒𝑓𝑓) shall
consist of the structural shape of the member and its effective flange width of the concrete deck slab, as described in the AASHTO LRFD Bridge Design Specifications.
Results from laboratory testing of a bridge
constructed with typical RRFCs and a fully composite concrete deck showed it is reasonable to assume the structural shape of the flatcar member and its effective width of the concrete deck slab as the effective section of the longitudinal member, presuming the member is composite with the concrete deck (Washeleski, 2013). Numerical studies performed on the tested bridge also verified and confirmed the effective width assumptions (Sener et al., 2015)
.
4.1.1.5–Stress Modification Factor The stress modification factor (α) shall be taken
equal to 1.0.
C4.1.1.5
The stress modification factor described in Article 2.1.1.5 was developed based on the field instrumentation test results to more accurately, but still conservatively, match stresses calculated using Eq.2.1.1-1 with those measured during field testing (Provines, 2011).
The stress modification factor is to be taken as 1.0 for the application of a bridge constructed with typical RRFCs and a fully composite concrete deck. Since considerably more instrumentation was installed in the laboratory and more rigorous analytical modeling of load distribution was developed, the provisions provided herein for RRFC bridges constructed with a composite concrete deck yield more accurate estimates of the actual stress in the members. Hence, no adjustment factor is needed when using the distribution factors provided in Tables 4.1, 4.2, and 4.3.
If the lever rule is used to determine the distribution factor, the stress modification factor may be taken as 0.75.
4.2–Determination of Maximum Positive Live Load Bending Stress in Secondary Members
The local bending stresses in secondary members (e.g., stringers) of RRFC bridges with concrete decks may be neglected.
C4.2
It has been shown through field and laboratory testing that when a concrete deck is present, the local bending effects of secondary members, such as stringers, are negligible (Provines, 2011, Washeleski, 2013)).
4.3–Determination of Available Capacity After Fracture of a Main Girder
C4.3

22 Proposed Guidelines for Load Rating Bridges Constructed from Railroad Flatcars
October 2016
This section describes the procedures which may be used for determining if a typical RRFC with a composite concrete deck has adequate remaining capacity if fracture of a main girder were to occur. These provisions are intended to be utilized to rationally establish if members of a RRFC should be classified as a fracture critical member and hence subjected to more rigorous field inspection.
The conditions listed in Article 4.1 must be
satisfied to use the following procedure. The provisions may be applied for RRFCs with
bearing to bearing span lengths of up to 60 feet. No provisions are required for evaluation of
fracture of an exterior girder as these members do not carry the major proportion of the dead or live load moments as do the main girders. Hence, fracture of the main girder is the only critical scenario.
The stress in the remaining primary members shall not exceed 0.75𝐹𝑦 under any of the load
conditions investigated
The procedures in this section were developed from laboratory testing of a bridge constructed with typical RRFCs and a fully composite concrete deck. The laboratory research conducted a controlled fracture of the tension flange of one main girder (Washeleski, 2013).
Laboratory testing showed that the composite concrete deck played a significant role in transferring load to the remaining primary members after fracture occurred (Washeleski, 2013). It is not recommended to use the following procedures if the conditions in Article 4.1 are not satisfied.
The simplified procedures for evaluating fracture recommended herein were developed based on a RRFC with a bearing to bearing span of nearly 48 feet. The results are believed to be applicable up to bearing to bearing span lengths of up to 60 feet. For clear span lengths greater than 60 feet, additional analysis should be performed. The approach simply determines if the stress in the remaining members remains below an acceptable level under various load conditions in the faulted state.
Failure of an exterior member, such as a typical channel beam that is often utilized was not found to be a critical failure mechanism. If the structure possess sufficient capacity when a main girder fails, it is clear failure of an exterior beam would not be a critical case.
Since this is considered an extreme event, the limit of 0.75𝐹𝑦 was selected to be a reasonable
upper bound stress in the steel components. The procedures and distribution factors
recommended herein are intended to provide simple, yet reasonably conservative estimates of the proportion of the moments distributed to the remaining intact members. RRFC’s which meet the provisions of Article 4 need not be classified as FCMs.
4.3.1–Redistribution of Dead Load
This section describes the procedures for determining the redistribution of dead loads to the remaining primary members after fracture occurs in the tension flange of a primary member.
C4.3.1
Locked in stresses include both dead load stresses, fabrication stresses, and other residual stresses. The redistribution of these stresses is in addition to the original gravity load stresses in the member under consideration. Obviously, it is not possible to quantify fabrication and residual stresses for in-service bridges. The laboratory testing showed those effects were relatively small compared to those associated with applied dead load stress due to the self-weight of the car and concrete (Washeleski, 2013).
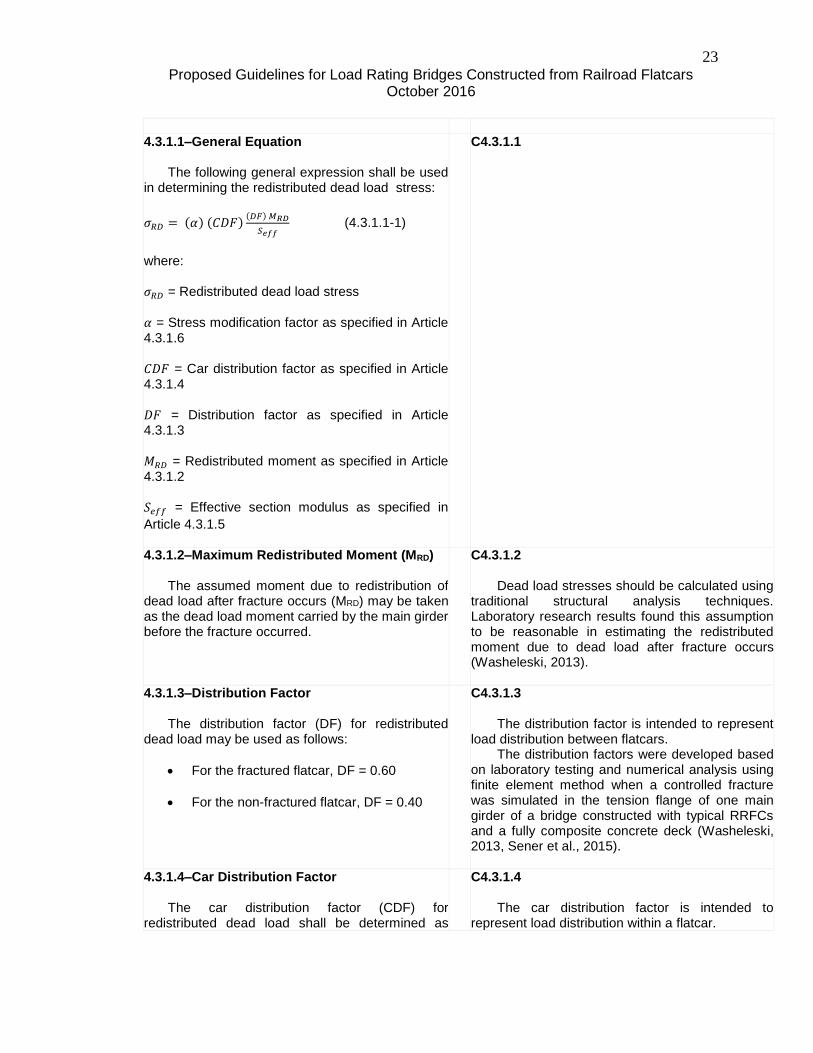
23 Proposed Guidelines for Load Rating Bridges Constructed from Railroad Flatcars
October 2016
4.3.1.1–General Equation
The following general expression shall be used in determining the redistributed dead load stress:
𝜎𝑅𝐷 = (𝛼) (𝐶𝐷𝐹)(𝐷𝐹) 𝑀𝑅𝐷
𝑆𝑒𝑓𝑓 (4.3.1.1-1)
where:
𝜎𝑅𝐷 = Redistributed dead load stress 𝛼 = Stress modification factor as specified in Article 4.3.1.6 𝐶𝐷𝐹 = Car distribution factor as specified in Article 4.3.1.4 𝐷𝐹 = Distribution factor as specified in Article 4.3.1.3 𝑀𝑅𝐷 = Redistributed moment as specified in Article 4.3.1.2 𝑆𝑒𝑓𝑓 = Effective section modulus as specified in
Article 4.3.1.5
C4.3.1.1
4.3.1.2–Maximum Redistributed Moment (MRD) The assumed moment due to redistribution of
dead load after fracture occurs (MRD) may be taken as the dead load moment carried by the main girder before the fracture occurred.
C4.3.1.2
Dead load stresses should be calculated using traditional structural analysis techniques. Laboratory research results found this assumption to be reasonable in estimating the redistributed moment due to dead load after fracture occurs (Washeleski, 2013).
4.3.1.3–Distribution Factor
The distribution factor (DF) for redistributed dead load may be used as follows:
For the fractured flatcar, DF = 0.60
For the non-fractured flatcar, DF = 0.40
C4.3.1.3
The distribution factor is intended to represent load distribution between flatcars.
The distribution factors were developed based on laboratory testing and numerical analysis using finite element method when a controlled fracture was simulated in the tension flange of one main girder of a bridge constructed with typical RRFCs and a fully composite concrete deck (Washeleski, 2013, Sener et al., 2015).
4.3.1.4–Car Distribution Factor
The car distribution factor (CDF) for redistributed dead load shall be determined as
C4.3.1.4
The car distribution factor is intended to represent load distribution within a flatcar.

24 Proposed Guidelines for Load Rating Bridges Constructed from Railroad Flatcars
October 2016
follows:
For the outer exterior girder of the fractured flatcar, CDF = 0.60
For the non-fractured flatcar, CDF values in Article 4.1.1.3
The car distribution factor for the remaining
primary members in the fractured flatcar is based on the assumption that the remaining members are the inner and outer exterior girders.
The car distribution factors were developed based on laboratory testing and numerical analysis using finite element method (Washeleski, 2013, Sener et al., 2015). The numerical parametric study results indicated that the outer exterior girder contributes approximately 60% of the total moment in the fractured flatcar resulting from dead load.
4.3.1.5 –Effective Section
The effective section modulus (𝑆𝑒𝑓𝑓) for
determining the redistributed dead load in a specified member shall consist of the structural shape of the member and its effective flange width of the concrete deck slab, as described in the AASHTO LRFD Bridge Design Specifications.
C4.3.1.5
4.3.1.6–Stress Modification Factor The stress modification factor (α) for
determining the redistributed dead load shall be taken equal to 1.0.
C4.3.1.6
4.3.2–Determination of Maximum Positive Live Load Bending Stress in Remaining Primary Members
Eq. 4.1.1-1 shall be used to determine the maximum positive live load bending stress in the remaining primary members after fracture occurs in the tension flange of a primary member.
C4.3.2
4.3.2.1–Maximum Positive Live Load Moment
The maximum positive live load moment for a single lane loaded (𝑀𝐿𝐿) shall be determined using procedures described in The AASHTO Manual for Bridge Evaluation.
C4.3.2.1
4.3.2.2–Distribution Factor
The distribution factor (DF) for determining the live load stress shall be used as follows for one lane loaded:
C4.3.2.2
The distribution factor is intended to represent load distribution between flatcars.
Based on experimental and numerical
investigations, when the fractured flatcar was
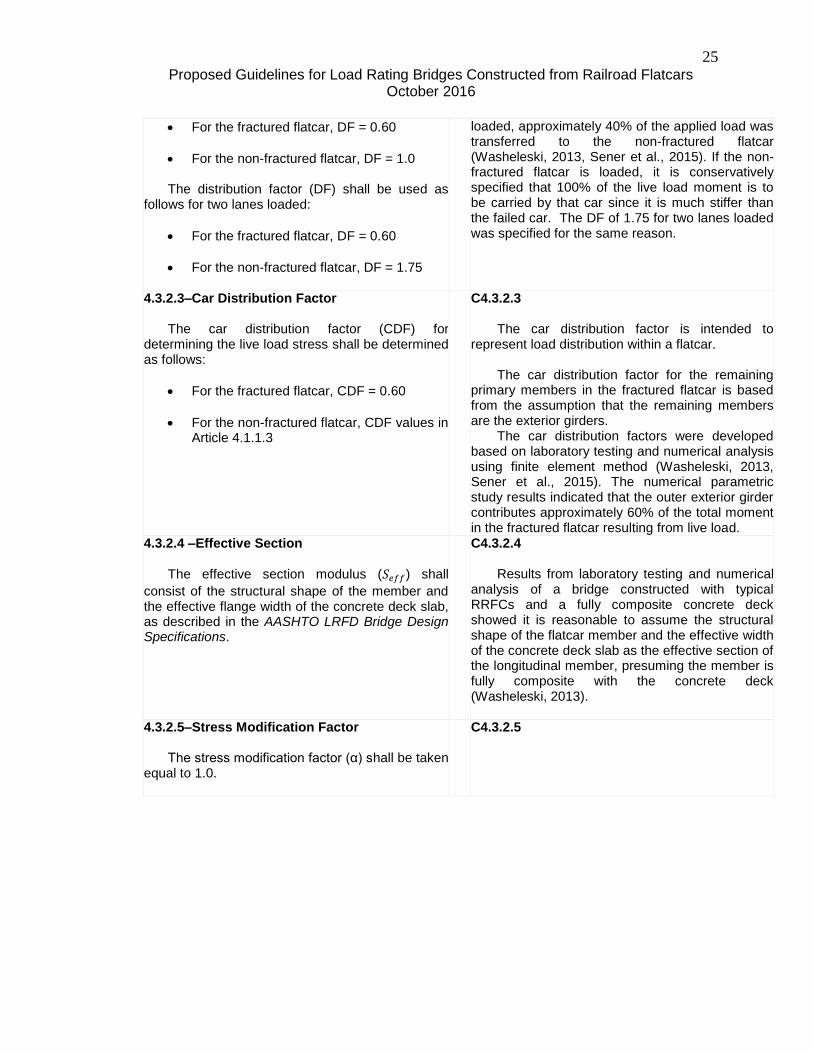
25 Proposed Guidelines for Load Rating Bridges Constructed from Railroad Flatcars
October 2016
For the fractured flatcar, DF = 0.60
For the non-fractured flatcar, DF = 1.0
The distribution factor (DF) shall be used as follows for two lanes loaded:
For the fractured flatcar, DF = 0.60
For the non-fractured flatcar, DF = 1.75
loaded, approximately 40% of the applied load was transferred to the non-fractured flatcar (Washeleski, 2013, Sener et al., 2015). If the non-fractured flatcar is loaded, it is conservatively specified that 100% of the live load moment is to be carried by that car since it is much stiffer than the failed car. The DF of 1.75 for two lanes loaded was specified for the same reason.
4.3.2.3–Car Distribution Factor
The car distribution factor (CDF) for determining the live load stress shall be determined as follows:
For the fractured flatcar, CDF = 0.60
For the non-fractured flatcar, CDF values in Article 4.1.1.3
C4.3.2.3
The car distribution factor is intended to represent load distribution within a flatcar.
The car distribution factor for the remaining primary members in the fractured flatcar is based from the assumption that the remaining members are the exterior girders.
The car distribution factors were developed based on laboratory testing and numerical analysis using finite element method (Washeleski, 2013, Sener et al., 2015). The numerical parametric study results indicated that the outer exterior girder contributes approximately 60% of the total moment in the fractured flatcar resulting from live load.
4.3.2.4 –Effective Section
The effective section modulus (𝑆𝑒𝑓𝑓) shall
consist of the structural shape of the member and the effective flange width of the concrete deck slab, as described in the AASHTO LRFD Bridge Design Specifications.
C4.3.2.4
Results from laboratory testing and numerical analysis of a bridge constructed with typical RRFCs and a fully composite concrete deck showed it is reasonable to assume the structural shape of the flatcar member and the effective width of the concrete deck slab as the effective section of the longitudinal member, presuming the member is fully composite with the concrete deck (Washeleski, 2013).
4.3.2.5–Stress Modification Factor The stress modification factor (α) shall be taken
equal to 1.0.
C4.3.2.5