development of experimental methods for … · development of experimental methods for measurements...
TRANSCRIPT

Development of experimental methodsfor measurements of vaporization
enthalpies of Ionic Liquids
Dissertation
zur
Erlangung des akademischen Grades
doctor rerum naturalium (Dr. rer. nat.)
der Matematisch-Natürwissenschaftlsichen Fakultät
der Universität Rostock
vorgelegt von
Ricardas Ralys,
geboren am 26.08.1982 in Kazachstan
Rostock, Februar 2011
1

Contents
1 Introduction 4
2 Methods of determination of pressures of low volatile compounds 7
2.1 Classi�cation of methods. . . . . . . . . . . . . . . . . . . . . . . . . . 8
2.2 Static methods . . . . . . . . . . . . . . . . . . . . . . . . . . . . . . . 9
2.3 Boiling point method (ebulliometry) . . . . . . . . . . . . . . . . . . . 9
2.4 Transpiration method . . . . . . . . . . . . . . . . . . . . . . . . . . . . 10
2.5 Langmuir method . . . . . . . . . . . . . . . . . . . . . . . . . . . . . . 12
2.6 Knudsen e�usion method . . . . . . . . . . . . . . . . . . . . . . . . . . 14
2.7 Chromatographic method . . . . . . . . . . . . . . . . . . . . . . . . . 16
2.8 Calorimetric methods . . . . . . . . . . . . . . . . . . . . . . . . . . . . 17
3 Development of the screening thermogravimetric method for a quick
appraisal of enthalpies of vaporisation of ILs 18
3.1 State of the Art . . . . . . . . . . . . . . . . . . . . . . . . . . . . . . . 18
3.2 Experimental section . . . . . . . . . . . . . . . . . . . . . . . . . . . . 27
3.2.1 Materials and chemicals . . . . . . . . . . . . . . . . . . . . . . 27
3.2.2 TGA � Measurements of Vaporization Enthalpy . . . . . . . . . 28
3.3 Results . . . . . . . . . . . . . . . . . . . . . . . . . . . . . . . . . . . . 33
3.3.1 Test-measurements of vaporization enthalpies of the reference
Molecular Liquids . . . . . . . . . . . . . . . . . . . . . . . . . . 33
3.3.2 Data treatment of the TGA-measurements of molecular liquids . 33
3.3.3 Test-measurements of vaporization enthalpies of Ionic Liquids . 35
3.3.4 Data treatment of the TGA-measurements of ionic liquids . . . 37
3.4 Discussion . . . . . . . . . . . . . . . . . . . . . . . . . . . . . . . . . . 39
3.4.1 TGA studies of 1-alkyl-3-methylimidazolium bis (tri�uoromethane-
sulfonyl) imides . . . . . . . . . . . . . . . . . . . . . . . . . . . 39
3.4.2 Validation of TGA vaporization enthalpies 1-alkyl-3-methylimidazolium
bis (tri�uoromethanesulfonyl) imides with Langmuir Quartz Mi-
crobalance Method . . . . . . . . . . . . . . . . . . . . . . . . . 48
3.4.3 TGA studies of 1-alkyl-3-methylimidazolium halides . . . . . . . 50
3.4.4 Determination of the Vaporization
Enthalpy of [C2mim]2[Co(NCS)4] . . . . . . . . . . . . . . . . 53
3.4.5 TGA - outlook and conclusions . . . . . . . . . . . . . . . . . . 56
4 Introduction to reaction di�erential scanning calorimetry 57
4.1 Experimental section . . . . . . . . . . . . . . . . . . . . . . . . . . . . 58
2

4.1.1 Materials and chemicals . . . . . . . . . . . . . . . . . . . . . . 58
4.1.2 Di�erential Scanning Calorimetry � Measurements of Reaction
Enthalpy . . . . . . . . . . . . . . . . . . . . . . . . . . . . . . . 58
4.1.3 Computations . . . . . . . . . . . . . . . . . . . . . . . . . . . . 65
4.2 Results and discussion . . . . . . . . . . . . . . . . . . . . . . . . . . . 66
4.2.1 State of the Art . . . . . . . . . . . . . . . . . . . . . . . . . . . 66
4.2.2 Molar Enthalpies of Formation of ILs from DSC-Measurements . 70
4.2.3 Indirect Determination of Molar Enthalpies of Vaporization of ILs 73
4.2.4 Vaporization Enthalpy from Enthalpies of Formation ∆fH0liq (IL) 74
4.2.5 Vaporization Enthalpy from DSC Enthalpies of Reaction, ∆rH0m 75
4.3 Structure � property relationships for thermodynamic properties of ionic
liquids. Correlation with the number of C-atoms in the cation alkyl chain 78
4.3.1 Enthalpy of IL synthesis reaction, ∆rH0m . . . . . . . . . . . . . 80
4.3.2 Enthalpies of vaporization of IL, ∆vapH298 . . . . . . . . . . . . 81
4.3.3 Enthalpies of formation of ILs in the liquid state, ∆fH0m,liq . . . 86
4.3.4 Enthalpies of formation of ILs in the gaseous state, ∆fH0m,g,298 . 87
4.4 Calculation of the Gas Phase Enthalpies of Reaction and Formation.
Quantum Chemical Calculations. . . . . . . . . . . . . . . . . . . . . . 88
4.4.1 Enthalpy of formation ∆fH0m,g,298 - improvement of the atomiza-
tion procedure . . . . . . . . . . . . . . . . . . . . . . . . . . . . 89
4.4.2 Quantum chemical calculations for degree of dissociation of the
ion pair . . . . . . . . . . . . . . . . . . . . . . . . . . . . . . . 96
4.4.3 Quantum chemical calculations for degree of conversion of the IL
synthesis reaction . . . . . . . . . . . . . . . . . . . . . . . . . . 98
4.4.4 Enthalpy of the IL synthesis reaction. Composite Methods . . . 98
4.5 DSC - conclusion . . . . . . . . . . . . . . . . . . . . . . . . . . . . . . 99
5 Outlook and conclusion of the work 100
References 102
3

1 Introduction
Ionic liquids (ILs) are the salts with the melting point being conventionally below
100°C. Due to such low melting temperature they are liquid under the room conditions
in the most cases (so called room temperature ILs - RTILs). In contrast to molecular
solvents ILs consist entirely of cations and anions in liquid state, and they can be
considered as solvents..
ILs are formed mostly of an organic aliphatic or heterocyclic cation and organic
or inorganic anion. Since ILs are prepared by coupling relatively large ions, it is
possible to create novel functionalities by changing the structure of component ions
[1]. Thus, properties of ILs may be varied in di�erent ways. One way is to se-
lect suitable cation. Possible cations are as follows: 1,3-di - alkylimidazolium, 1 -
alkylpyridinium, 1,1-di - alkylpiperidinium, 1,1-di - alkylpyrrolidinium, tetra - alky-
lammonium, tetra - alkylphosphonium, etc. Variation of alkyl chain length may also
be used for modi�cation of cation. Another way of properties adjustment is to chose
an appropriate anion. Anions usually used for ILs are halogenes, alkylsulfonates, alkyl-
sulfates, tetra�uoroborate, hexa�uoroborate, dicianamide, nitrate, tri�uoromethansul-
fonate (tri�ate, [OTf−]), bis(tri�uoromethylsulfonyl)imides (bistri�amide [NTf−2 ]), and
tris (tri�uoromethylsulfonyl) methanide ([CTf−3 ]). List of the ILs relevant to this work
given in the table 1.1.
Table 1.1: The list of ILs investigated in this work
Anion[NTf2] [Cl ] [Br ] [EtSO4] [Co (SCN)4]
2−Cation
[Cnmim] n = 2÷ 16 n = 2÷ 8 n = 2÷ 8 n = 2 �[C2mim]2+2 � � � �
√
Consisting of large or/and asymmetric cation ILs have low melting point in con-
trast to inorganic salts. The reasons for that are low symmetry, weak intermolecular
interactions and good distribution of charge. Low symmetry of the consistuting ions
prevents compact packing of molecules and consequently leads to low energy of the
lattice and to the low melting point. The di�erence in crystalline lattice of inorganic
solid salts and ILs is depicted on the �g. 1.1.
Selected properties, such as thermal stability and miscibility, mainly depend on
the anion, while others, such as viscosity, surface tension and density, depend on the
length of the alkyl chain in the cation and/or shape or symmetry [2]. The combination
of the cited di�erent anions and cations has expanded considerably the number of
possible low temperature melting salts and more than two thousands ILs are known
4

Figure 1.1: Comparison of crystalline lattice of inorganic salt and IL.
today. Beside their low melting point, they have a wide range of solubility, viscosity
or density [3]. The extremely low vapor pressure of most ILs is the main reason that
makes them useful in green chemistry. In chemical processes, they are easily recyclable
and produce minimum pollution by volatile organic compounds if no organic solvent
are used to recycle them. IL vapor pressure is most often non-measurable at room
temperature. The extremely low volatility of ILs renders them little �ammable so they
could candidate to replace organic pollutant solvents [4]. ILs were quickly considered
as benign or green solvents when full toxicity studies are not completed. It seems that
many ILs have a signi�cant ecotoxicity [5]. For example, the slow hydrolysis of the
hexa�uorophosphate anions released in water produces free toxic �uoride anions [6].
Low volatility has garnered them much recent attention as potential solvents to
replace volatile organic solvents in a wide variety of chemical reaction, separation,
and manufacturing processes. For example, ILs have been considered as solvents for
reactions, as absorption media for gas separations, as the separating agent in extractive
distillation, as heat transfer �uids, for processing biomass, and as the working �uid in
a variety of electrochemical applications (batteries, solar cells, etc.) [7].
Understanding basic thermophysical properties of ILs is vital for design and eval-
uation. For instance, melting points, glass-transition temperatures, and thermal de-
composition temperatures are needed to set the feasible temperature operating range
for a particular �uid. Density (as a function of temperature) is needed for equipment
sizing. Heat capacities are needed to estimate heating and cooling requirements as well
as heat-storage capacity.
One of the main barriers for the development of ionic liquids for industrial applica-
tions is the scarce knowledge of their thermophysical properties [8], both for pure and
mixed �uids, in the wide pressure and temperature ranges required for process design
5

purposes. Some recent works have shown the most relevant aspects of thermophysical
properties for ionic liquids [9]. The possible number of ionic liquids may be as large as
1018 (including binary and ternary ionic liquids) according to some authors [10], but a
detailed analysis of the literature shows that basic properties have been measured only
for a very limited number of ionic liquids [11].
It was claimed for a long time that one of the main characteristics of ionic liquids
is that they are not volatile �uids, and thus, they would not show measurable vapor
pressure, hence, they could not be distilled. Nevertheless, the possible volatility of ionic
liquids was �rst explored by Rebelo et al. [12] and Paulechka et al. [13]. Although the
pioneering work of Earle et al. [14] showed for the �rst time that ionic liquids could be
distilled under reduced pressure at high temperatures, meanwhile at temperatures close
to ambient conditions vapor pressure of ILs remains almost negligible. Moreover, the
measurement of vapor-liquid equilibria properties was shown to be extremely di�cult.
The competing e�ects of �uids decomposition leads to the impossibility of measuring
properties such as critical values. Likewise, the ionic character of these �uids leads to
large vaporization enthalpies, ∆vapH , (in the 120-200 kJ mol−1 range [15, 16], but not
as large as 300 kJ−1 mol as reported in some studies [12]), which are remarkably larger
than for common organic �uids. A recent review by Esperanca et al. [17] analyzed
in detail the available information on the volatility of aprotic ionic liquids, the main
conclusions of the work were (i) at present, it may not be possible to measure the vapor
pressures and/or the enthalpies of vaporization of any particular ionic liquid., and most
methods present systematic errors related to the extreme experimental conditions of
high temperatures that are not far from the decomposition temperatures of the ILs, and
(ii) accurate measurement of enthalpies of vaporisation for a su�ciently comprehensive
set of ionic liquids will help researchers to re�ne force �elds employed in molecular
simulations as well as stringently test other theoretical models; these are absolutely
essential tasks considering the enormous number of potentially available liquid salts.
In the present work development of express experimental methods (ThermoGravimetric
Analysis - TGA and Di�erential Scanning Calorimetry - DSC) for studying of enthalpies
of vaporisation ILs was conducted. TGA is the technique allowing to derive enthalpy
of vaporisation directly from thermogravimetric data related to vapor pressure. In
order to establish TGA for proper determination of ∆vapH measurements with the ref-
erence substances were performed. With the use of these measurements experimental
conditions indispensable for correct employment of TGA were found out.
Enthalpy of vaporisation can be determined not only via vapor pressure or related
to it values (like in TGA method), it can be obtained from enthalpies of formation of
liquid and gaseous phases:
6
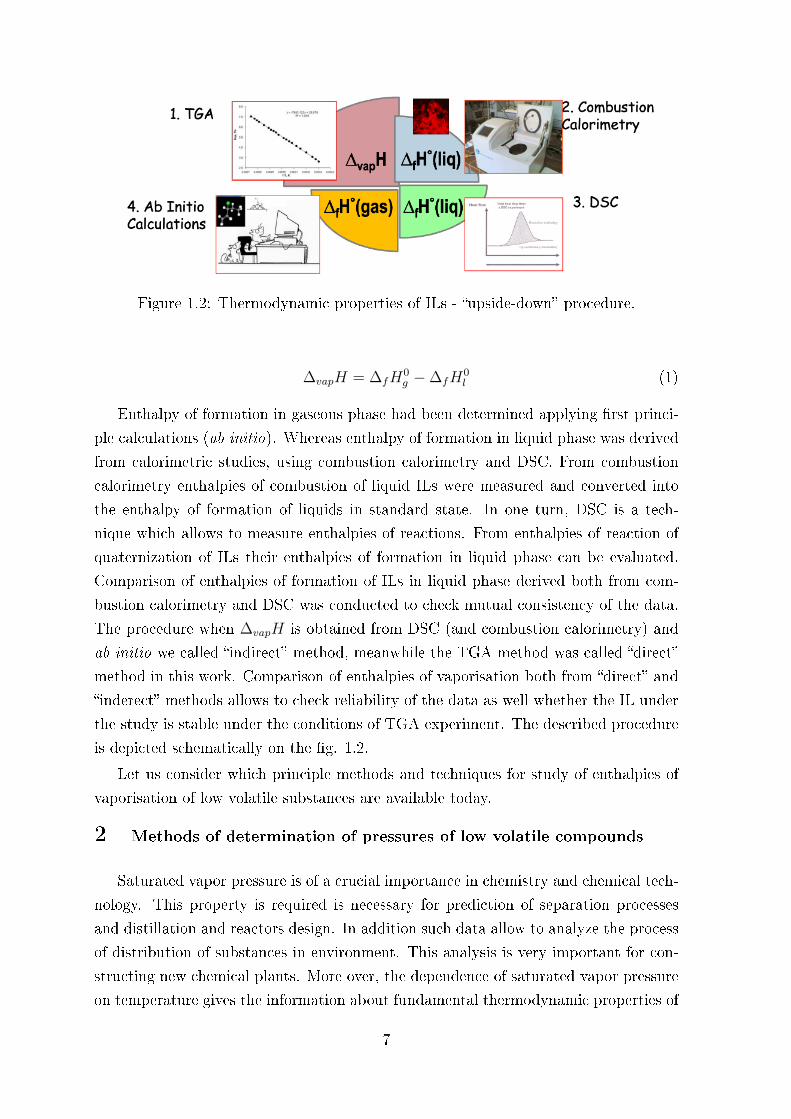
Figure 1.2: Thermodynamic properties of ILs - �upside-down� procedure.
∆vapH = ∆fH0g −∆fH
0l (1)
Enthalpy of formation in gaseous phase had been determined applying �rst princi-
ple calculations (ab initio). Whereas enthalpy of formation in liquid phase was derived
from calorimetric studies, using combustion calorimetry and DSC. From combustion
calorimetry enthalpies of combustion of liquid ILs were measured and converted into
the enthalpy of formation of liquids in standard state. In one turn, DSC is a tech-
nique which allows to measure enthalpies of reactions. From enthalpies of reaction of
quaternization of ILs their enthalpies of formation in liquid phase can be evaluated.
Comparison of enthalpies of formation of ILs in liquid phase derived both from com-
bustion calorimetry and DSC was conducted to check mutual consistency of the data.
The procedure when ∆vapH is obtained from DSC (and combustion calorimetry) and
ab initio we called �indirect� method, meanwhile the TGA method was called �direct�
method in this work. Comparison of enthalpies of vaporisation both from �direct� and
�inderect� methods allows to check reliability of the data as well whether the IL under
the study is stable under the conditions of TGA experiment. The described procedure
is depicted schematically on the �g. 1.2.
Let us consider which principle methods and techniques for study of enthalpies of
vaporisation of low volatile substances are available today.
2 Methods of determination of pressures of low volatile compounds
Saturated vapor pressure is of a crucial importance in chemistry and chemical tech-
nology. This property is required is necessary for prediction of separation processes
and distillation and reactors design. In addition such data allow to analyze the process
of distribution of substances in environment. This analysis is very important for con-
structing new chemical plants. More over, the dependence of saturated vapor pressure
on temperature gives the information about fundamental thermodynamic properties of
7
a substance, which are related to its structure (e.g. enthalpy and entropy of vaporisa-
tion).
2.1 Classi�cation of methods.
Experimental methods can be classi�ed in di�erent ways. One of possible ap-
proaches is to classify them according to construction of experimental set up of speci�c
method. According to this approach it is possible to de�ne the following techniques,
which are broadly used for investigation of organic compounds [18]:
1. Static methods. In these methods closed and evacuated vessels are used under
isothermal conditions.
2. Boiling point method (ebulliometry). In this group of methods the condition
of boiling of substances is applied: p0 = P , where p0 is saturated vapor pres-
sure, which should be measured, and P is the pressure in the vessel. When this
condition is met the boiling of the liquid appears. The temperature of boiling
corresponds to the saturated vapor pressure.
3. Transpiration method (or gas saturation method). In this method the mass of
the vaporising substance caught by a gas �ow is measured. Than the obtained
mass is converted to vapor pressure with the application of the equation of state
of ideal gases.
4. Langmuir method and its modi�cations. The process of vaporisation occurs from
free surface and the relation between the rate of mass loss and the value of vapor
pressure (Langmuir equation) is applied in this method.
5. Knudsen e�usion method and its modi�cations. The process of vaporisation
occurs from the cell with the small ori�ce. The rate of e�usion of the gas from
the cell is related to the value of vapor pressure.
6. Chromatographic method. The experimental set up is the same as for classic
chromatographic analysis. Generally speaking, the di�erence between such anal-
ysis and vapor pressure determination is based on the application of the retention
volume of the substance which is treated with the equation of state of ideal gas
combined with Rault's law.
7. Calorimetric methods. This group of methods allows to measure only the en-
thalpy of vaporisation which is derived from the temperature dependence of vapor
pressure.
8
Let us consider all these methods in more detail.
2.2 Static methods
The main part of static method is a closed vessel �lled with a sample, than the vessel
is evacuated and the temperature is held constant within a time interval to reach the
equilibrium between the condensed and vapor phases. The sample is carefully degassed
prior to begin of the measurement. Pressure at equilibrium is determined with the aid of
any measuring instrument. Many kinds of pressure gauges have been used, including
mercury manometers, dead weight piston gauges, Bourdon tubes, and capacitance
pressure transducers. In modern measurements of pressure high-precision manometers
are commercially available (MKS, Ruska etc.), and di�erent home-made gauges with
sophisticated set up which are described earlier [19, 20] are out of use.
Despite its high sensitivity to volatile impurities and large time of experiment, static
method provides us with the ability to measure pressures over a wide range of tempera-
tures (200 K) with accurate temperature determination (±0.002 K) [21]. High-accuracy
instruments are now commercial available and numerous of sophisticated homemade
devices described in earlier compilations [22, 23, 24] became only of historical inter-
est. Several e�ects, however, may limit the accuracy of static methods, especially for
systems at low pressures or at extreme temperatures. A perfectly air tight appara-
tus is di�cult to obtain. It is not easy to remove adsorption and desorption e�ects
inside tubing connections. Impurities, decomposition products, dissolved or desorbed
gases can easily mask vapor pressures of compound under study. The liquid and va-
por phases of a sample may not be in equilibrium. Equipment, such as temperature
and pressure gauges, may not be properly calibrated. If proper precautions are not
taken, di�erential pressure indicator hysteresis or special transport phenomena such as
thermal transpiration or molecular �ow can obscure low-pressure results.
Since the sensitivity of static methods is limited by the pressure value of ∼0.01 Pa,their application to ILs investigation is possible only at elevated temperature range,
where the vapor pressure of ILs becomes prominent. This may cause errors in deter-
mination of ∆vapH due to potential decomposition at higher temperatures. Also, large
actual times of experiment may lead to degradation of the sample.
2.3 Boiling point method (ebulliometry)
The main part of any ebulliometric apparatus is ebulliometer. The general idea of
the ebulliometer is similar to the one of an ordinary open boiler operating at atmo-
spheric pressure. Since ebulliometry is a relatively old technique, a lot of experimental
units have been developed. As accurate determination of the temperature of boiling is
9
the key point of the measurement, it is necessary to provide smooth boiling and absence
of overheating. Certain construction of the ebulliometer depends on how the measure-
ment is carried out. Two principle measuring schemes are possible in this method [22].
The �rst one is a slow varying of external pressure under constant temperature and
the second one is a slow varying of the temperature under constant pressure. In both
cases it is necessary to detect the boiling point and corresponding pressure and tem-
perature. The second scheme is possible in two main modi�cations: the modi�cation
based on Cotrell pump, circulating both liquid and vapor phases [23, 24, 25], and the
modi�cation with open re�ux boiler without a Cotrell pump [26], with diverse facilities
reducing overheating and bumping of the boiling liquid are elaborated.
Operation of ebulliometric equipment is possible in the pressures range of 2 kPa and
higher. Ebulliometry is a method of very high reliability, when the conditions provide
correctness of determination of the boiling point. For investigation of ILs ebulliometry
is not suitable in most cases, since it requires boiling of the sample at pressures that
are hardly possible to reach for this class of compounds.
2.4 Transpiration method
The method was proposed �rst by Regnault in 1845 [27]. The application of this
method was restricted till the invention of automated chromatographic techniques in
1970s. During the long time method led to erroneous measurements due to insu�cient
saturation of carrier gas and invalid extrapolation of the data to zero rate of gas
�ow [28]. Despite all these di�culties this method has strong advantages, e.g. the
in�uence of small amounts of volatile impurities is minimal, it is possible to carry out
the measurements within relatively short time, besides, the method allows to change
the atmosphere by switching the purge gas. The temperature range of measurements is
close to ambient temperature and is very wide, vapor pressures can be measured from
approximately 3 kPa and downwards[18].
The main part of the measurement system in this technique is saturator, where the
investigated substance is held under controlled temperature. Through the saturator
either inert or reactive gas is passed with su�ciently low rate to allow the equilibrium
pressure of the substance to be established. Than the carrier gas is trapped by sorbents
or cryogenic traps, vaporised substance is collected and its mass is determined.
Assuming that the purge gas is saturated su�ciently and the mixture obeys ideal
gas behavior (under the common conditions of the method the assumption of ideality is
valid) Dalton's law and ideal gas law are applicable. This gives the following expression
for the vapor pressure:
pi =miRTaMiV
(2)
10
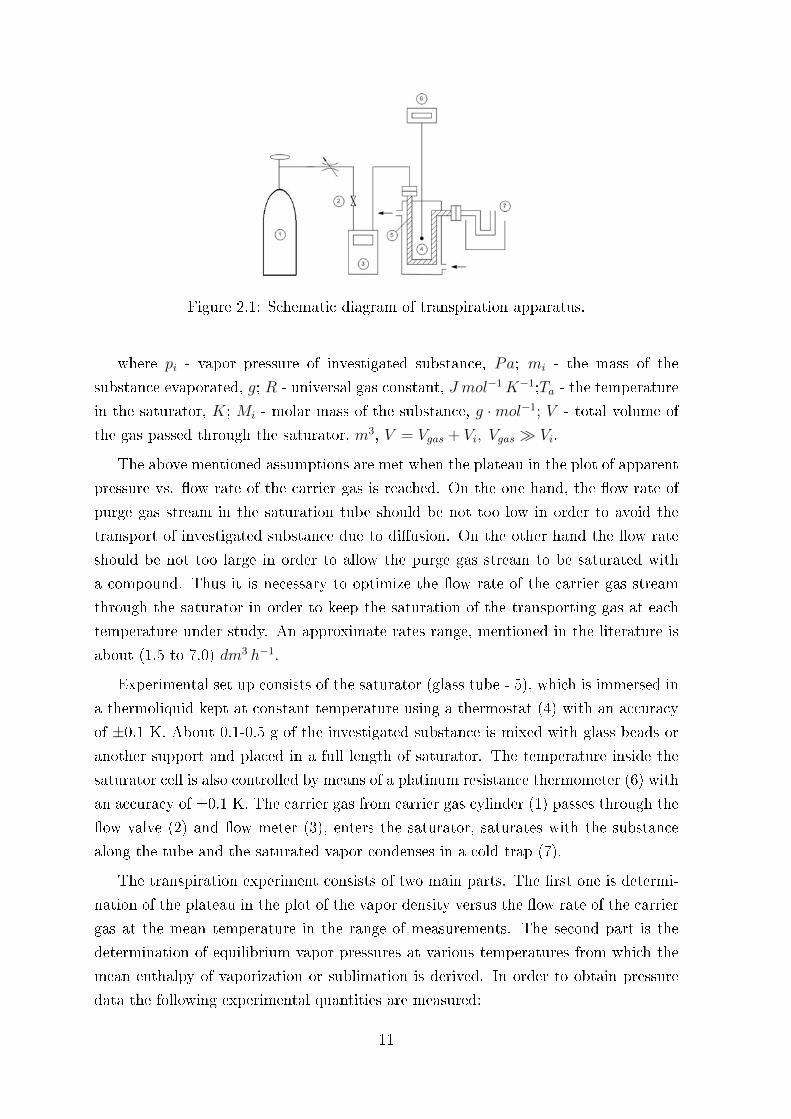
Figure 2.1: Schematic diagram of transpiration apparatus.
where pi - vapor pressure of investigated substance, Pa; mi - the mass of the
substance evaporated, g; R - universal gas constant, J mol−1K−1;Ta - the temperature
in the saturator, K; Mi - molar mass of the substance, g ·mol−1; V - total volume of
the gas passed through the saturator, m3, V = Vgas + Vi, Vgas � Vi.
The above mentioned assumptions are met when the plateau in the plot of apparent
pressure vs. �ow rate of the carrier gas is reached. On the one hand, the �ow rate of
purge gas stream in the saturation tube should be not too low in order to avoid the
transport of investigated substance due to di�usion. On the other hand the �ow rate
should be not too large in order to allow the purge gas stream to be saturated with
a compound. Thus it is necessary to optimize the �ow rate of the carrier gas stream
through the saturator in order to keep the saturation of the transporting gas at each
temperature under study. An approximate rates range, mentioned in the literature is
about (1.5 to 7.0) dm3 h−1.
Experimental set up consists of the saturator (glass tube - 5), which is immersed in
a thermoliquid kept at constant temperature using a thermostat (4) with an accuracy
of ±0.1 K. About 0.1-0.5 g of the investigated substance is mixed with glass beads or
another support and placed in a full length of saturator. The temperature inside the
saturator cell is also controlled by means of a platinum resistance thermometer (6) with
an accuracy of ±0.1 K. The carrier gas from carrier gas cylinder (1) passes through the
�ow valve (2) and �ow meter (3), enters the saturator, saturates with the substance
along the tube and the saturated vapor condenses in a cold trap (7).
The transpiration experiment consists of two main parts. The �rst one is determi-
nation of the plateau in the plot of the vapor density versus the �ow rate of the carrier
gas at the mean temperature in the range of measurements. The second part is the
determination of equilibrium vapor pressures at various temperatures from which the
mean enthalpy of vaporization or sublimation is derived. In order to obtain pressure
data the following experimental quantities are measured:
11
� mass of the sample transported by the carrier gas at the particular temperature.
This quantity can be measured by chemical analysis of the condensate in the
trap. Such approach provides the most accurate information, despite being quite
time consuming. Several analytical methods can be applied for this kind of mea-
surement, e.g. gas or high performance liquid chromatography, UV spectrometry,
oxidation of condensate with IR analysis of produced carbon dioxide.
� �ow rate of the carrier gas over the sample and the total time of sample condensa-
tion, from which the total volume of the gas swept over the sample is calculated;
commercially available digital �ow meters allow to reach high accuracy of such
measurements.
� The temperature at which the transpiration experiment is performed.
� The ambient temperature at which the volume of the carrier gas is measured.
The accuracy of measurement of these quantities de�nes the accuracy of the results
obtained.
In some recent works transpiration experiments combined with TG-method are
described. In this case the loss of mass is measured directly by means of thermobalance
and vapor pressure is evaluated [29, 30].
Despite this method requires a small amount of sample, and gives highly repro-
ducible result (0.2÷0.4 kJ ·mol−1for vaporisation enthalpy), it has serious drawback
particularly for investigation of ILs. Large actual time may be required to catch valu-
able amount of substance, and this may lead to thermal degradation of ILs.
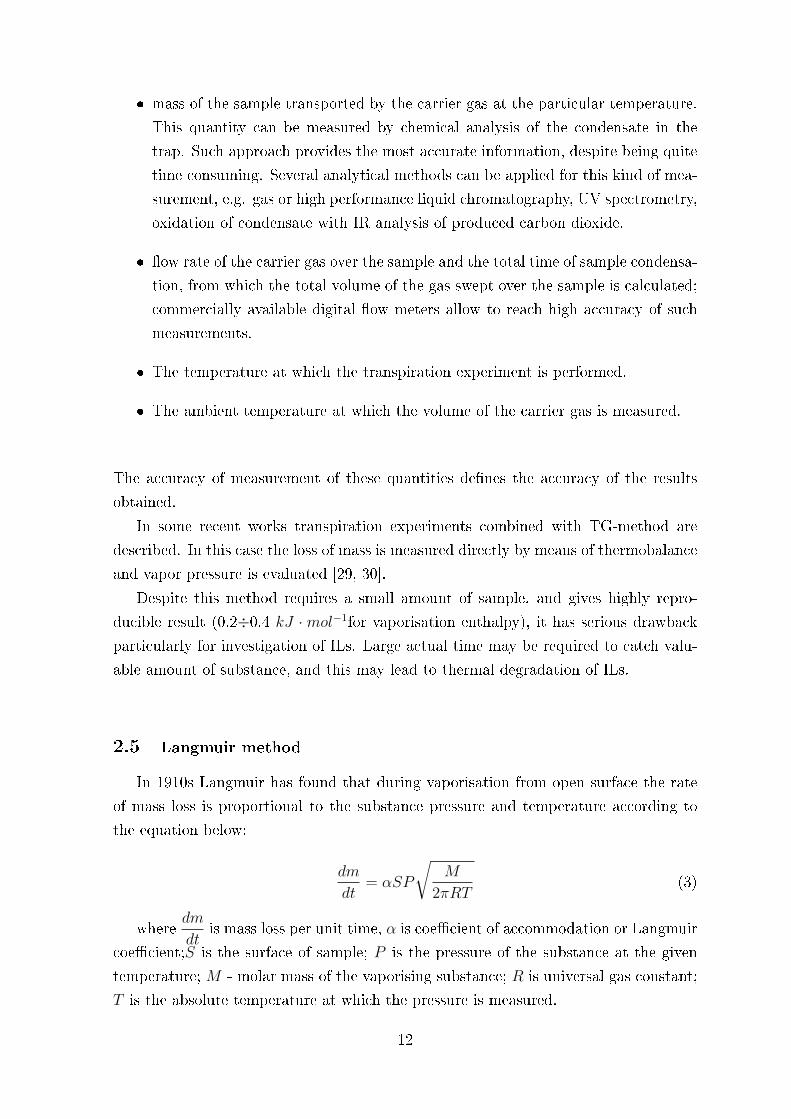
2.5 Langmuir method
In 1910s Langmuir has found that during vaporisation from open surface the rate
of mass loss is proportional to the substance pressure and temperature according to
the equation below:
dm
dt= αSP
√M
2πRT(3)
wheredm
dtis mass loss per unit time, α is coe�cient of accommodation or Langmuir
coe�cient;S is the surface of sample; P is the pressure of the substance at the given
temperature; M - molar mass of the vaporising substance; R is universal gas constant;
T is the absolute temperature at which the pressure is measured.
12

In classical experiments pressures of di�erent metals were measured. In these mea-
surements Langmuir heated wires of the substances being studied with an electric
current in a vacuum. The temperature of the wire was measured with an optical py-
rometer. The mass loss was obtained from radius of the wire as a function of time.
Langmuir considered coe�cient of accommodation as equal to unity in vacuum [31].
Price and Hawkins [32, 33, 34] proposed to use the equation (3) for estimation the
vapor pressure of low volatile substances from thermogravimetric (TG) data. They
have found that, when the substance is vaporised not into vacuum but into �owing gas
stream, accommodation coe�cient is no longer equal to unity.
They rearranged the equation (3) into the following relationship:
P =
√2πR
α
dm
dt
√T
M(4)
With k =
√2πR
αand ν =
dm
dt
√T
M. The �nal expression for vapor pressure:
P = kν (5)
According to (5) the plot of P vs. ν is follows the same trend for a series of
compounds with known vapor pressure, regardless of chemical structure, providing that
the sample does not associate in the condensed or gas phase allowing the calibration
constant k to be determined and thus the vapor pressures of unknown materials to be
found [32, 34]. In the series of experiments by Dollimore and Alexander [35, 36, 37]
the value for calibration constant k is found for a variety of low volatile substances and
coe�cient of accommodation was determined α = 5.8 ·10−5. Gückel et al. [38] observed
the vaporisation rate being strongly a�ected by the �ow rate. In contrast, Price and
Hawkins [32] stated vaporisation rate was not a�ected by small variations of purge gas
rate.
Reference compounds are usually selected as those with well established vapor pres-
sures. Experimental vapor pressures collected in the literature [39, 40] most often
approximated by Antoine equation. Accuracy of the vapor pressures derived by TG
directly depends on a quality of vapor pressures data sets of the chosen reference com-
pounds. It is prudent to collect a set of reference substances with vapor pressure data
measured in a possibly broad temperature range which is essentially close to the con-
ditions of the TG experiment. In this context it is advisable to take some precautions
by using the comprehensive compilation [39], which contains vapor-pressure results for
all classes of organic compounds over a wide range of temperature. This compilation
is willingly used by TG-community to extract the Antoine coe�cients. However, the
origin of the data presented in [39] is unclear; methods of measurements are unknown
13
as well as errors of measurements and purities of compounds that is why use of An-
toine coe�cients listed there in each case should be considered as questionable and
some other sources ought to �nd out for the sake of comparison.
Since there is scarce of data on vapor pressures of ILs for the purpose of reference,
TGA can be used only for determination of enthalpies of vaporisation. As a method
of determination of ∆vapH, TGA has several advantages: it has short experimental
times, a few tens of milligrams are required only, and commercial TG-equipment is
easily accessible. Drawback of the method is experimental temperature range which
can be close to decomposition onset.
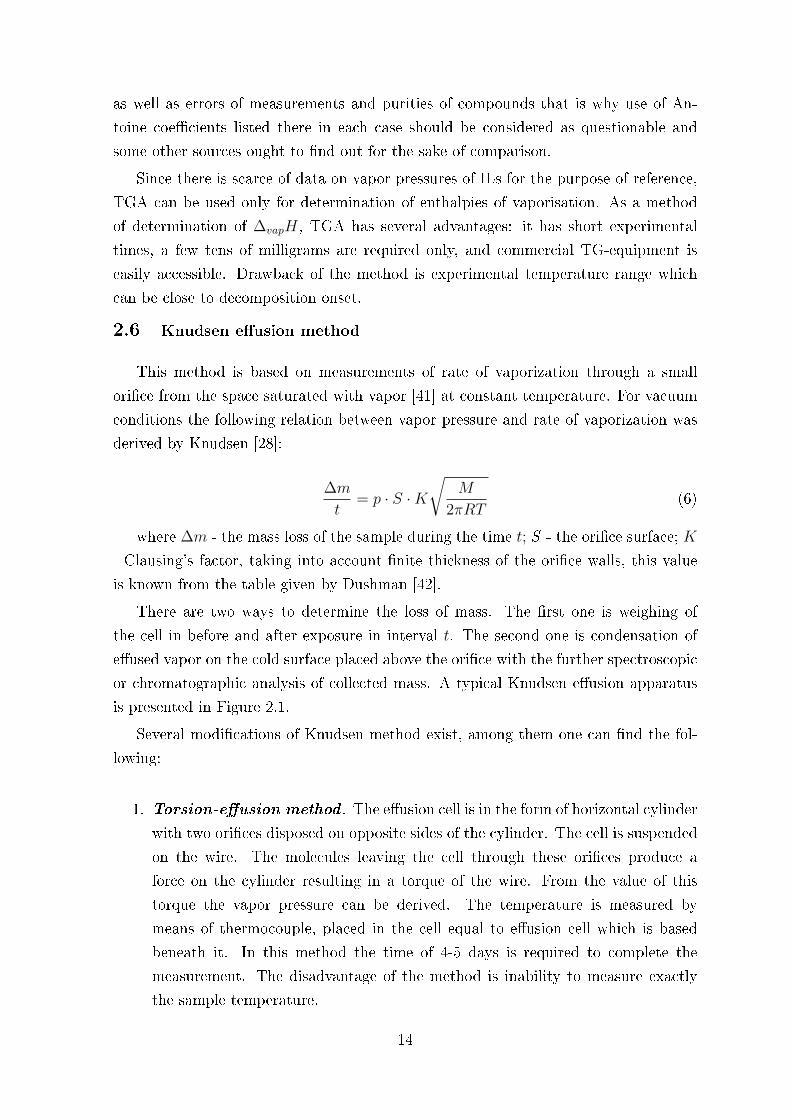
2.6 Knudsen e�usion method
This method is based on measurements of rate of vaporization through a small
ori�ce from the space saturated with vapor [41] at constant temperature. For vacuum
conditions the following relation between vapor pressure and rate of vaporization was
derived by Knudsen [28]:
∆m
t= p · S ·K
√M
2πRT(6)
where ∆m - the mass loss of the sample during the time t; S - the ori�ce surface; K
- Clausing's factor, taking into account �nite thickness of the ori�ce walls, this value
is known from the table given by Dushman [42].
There are two ways to determine the loss of mass. The �rst one is weighing of
the cell in before and after exposure in interval t. The second one is condensation of
e�used vapor on the cold surface placed above the ori�ce with the further spectroscopic
or chromatographic analysis of collected mass. A typical Knudsen e�usion apparatus
is presented in Figure 2.1.
Several modi�cations of Knudsen method exist, among them one can �nd the fol-
lowing:
1. Torsion-e�usion method . The e�usion cell is in the form of horizontal cylinder
with two ori�ces disposed on opposite sides of the cylinder. The cell is suspended
on the wire. The molecules leaving the cell through these ori�ces produce a
force on the cylinder resulting in a torque of the wire. From the value of this
torque the vapor pressure can be derived. The temperature is measured by
means of thermocouple, placed in the cell equal to e�usion cell which is based
beneath it. In this method the time of 4-5 days is required to complete the
measurement. The disadvantage of the method is inability to measure exactly
the sample temperature.
14

Figure 2.2: The scheme of the apparatus for vapor pressure measurement by Knudsenmethod: 1 - measuring block (e�usion cell with a sample, vacuum connection, cold�nger); 2 - di�usion oil pump; 3 - vacuummeasuring gauge; 4 - thermostat; 5 - roughing-down pump; 6 - helium cylinder; 7 - bellows gates.
2. Isothermal Knudsen e�usion method in the TG-type apparatus. In this
technique the mass loss of the cell is recorded as a function of time in TG-type
apparatus with high precision. In order to remove any volatile admixtures present
in the sample at least 5% of the mass of the substance should be vaporized.
3. Non-isothermal Knudsen e�usion method in the TG-type apparatus.
This method was developed to satisfy the need to analyse the sample over a large
range of temperatures during modest times. Unlike isothermal technique this
method does not require the cell to reach the steady-state temperature.
4. Knudsen technique with a quartz crystal microbalance (QCM). The sub-
stance e�using the cell condenses on piezoelectric crystal and this leads to change
in resonance frequency of the crystal. Since the mass left the cell is equal to the
one condensed on the crystal, it is possible to measure the rate of e�usion and
evaluate vapor pressure. Though, there is a requirement of mass being uniformly
distributed on the crystal.
5. Mass loss Knudsen technique with a heat-conducting calorimetry. Calori-
15

Figure 2.3: Schematic plot of output potential from the microcalorimeter against timefor a sublimation calorimetric experiment. A calibration experiment is superposed ona sublimation experiment. SA is the net area observed for the sublimation experiment.SB is the area associated with the calibration.
metric determination of enthalpies of sublimation combined with Knudsen tech-
nique has been performed by use of Calvet-type heat-conduction calorimeter [43].
The record of an output signal of the calorimeter throughout an experiment is
schematically depicted in �gure . The enthalpy of sublimation at given tem-
perature is calculated using the following equation: ∆subH = EcalibSA + SB
SB
M
m,
where Ecalib is the electrical energy supplied to the calibration heater; m is the
mass of the e�used sample. Vapor pressure of sample is measured simultaneously
and obtained by mass loss under isothermal conditions of Knudsen molecular
e�usion. The temperature behavior of p gives a mean value of ∆subH(T ). Agree-
ment between the mean values derived from calorimetric and from vapor pressure
data provides a test of mutual consistency of the experimental results.
Knudsen method and especially Knudsen method with QCM is a suitable tool for
accurate measurement of vapor pressures of ILs, since it has moderate actual times of
experiment, high sensitivity of quartz crystal microbalance and moderate temperatures
of experiment.
2.7 Chromatographic method
Chromatographic methods (GC) can be divided into two approaches: the dynamic,
in which retention volume (time) of analysid substance is measured, and the static
(head-space) analysis, in which selective and sensitive gas analysis is performed.
16

A simple indirect static analysis for the determination of vapor pressures of pure
substances was developed by Chickos[44]. A standard instrument consists of a sample
chamber joined with ballast tank through a valve. Both compartments are kept at the
same temperature, allowing the system to reach the equilibrium. The experimental
value of the pressure of the investigated substance is obtained by measurement of the
contents of the ballast tank and treatment of this quantity with the ideal gas law. It is
necessary to take into account that this method gives underestimated values of vapor
pressure, despite this, the enthalpy of vaporisation remains reliable.
Dynamic method in one turn is presented by GC-correlations of retention times with
vapor pressures of reference substances, and GC-correlations with net retention times.
In both approaches the idea of linear dependence of the logarithm of vapor pressure
on the reciprocal retention times is underlying. The di�erence between them consists
of measurement of retention times of several substances with well-known pressure over
desired temperature range in the �rst approach [45], meanwhile in the second approach
the correlation for a wide range of substances from diverse chemical classes is used [46].
2.8 Calorimetric methods
This group of methods allow to measure the enthalpy of vaporization directly. Most
of calorimeters are presented by adiabatic ones, where the heat absorbed during va-
porization is exactly equal to the heat transferred from an external source. Another
part of calorimetric determinations is performed by conduction calorimeters.
Let us consider the �rst group of methods, where adiabatic calorimeters are applied.
At low pressures two approaches are employed, with vaporization into vacuum and with
purging with carrier gas. Vaporization in vacuum is applicable even at pressures below 1
Pa, the upper limit is about 25 kPa. The range of pressures available for measurements
in the systems with carrier gas is about 0.05 to 25 kPa. In both methods vaporization
occurs in the open space. At moderate pressures (5 ÷ 200 kPa) experiments are
performed in closed systems, where vaporization and condensation parts exist.
Another possibility to measure the enthalpy of vaporization directly provides drop
calorimetry method. The sample at room temperature is dropped in Calvet type
calorimeter standing at enhanced temperature, providing rapid vaporisation of the
sample. The enthalpy of vaporization corresponds to the peak area, observed in the
calorimeter [47].
17

3 Development of the screening thermogravimetric method for a quick
appraisal of enthalpies of vaporisation of ILs
3.1 State of the Art
Nowadays, the thermogravimetric analysis (TGA) is the well established experi-
mental method for studies of a thermal behavior of a sample in a wide temperature
range under controlled external conditions (purge gas, pressure or vacuum). The mod-
ern commercial TGA devices are fully automated and they provide highly accurate
and reproducible results for the mass loss during heating of the sample. Connected to
any spectroscopic unity (MS, IR, or UV) for analysis of the evolved gases, the TGA
technique provides quantitative and qualitative information on thermal stability of the
sample under study.
In this work we decided to extend �elds of traditional applications of TGA and
to elaborate the experimental conditions of a commercially available TGA for the
fast determination of enthalpies of vaporization of extremely low volatile compounds.
Unlike the thermal stability studies using the TGA, the temperature dependent mass
loss of the sample, is intended to use for an express measurement of vaporization
enthalpies of ionic liquids.
The principle of the TGA experiment is simple � 50-100 mg of IL-sample is placed
into an open Pt-crucible (Fig. 3.1) [48] is heated with a certain rate up to elevated
temperatures and the mass loss is continuously monitored at isothermal steps (see
Fig. 3.1) . As a matter of fact it is hardly possible to separate this mass loss into
contributions due to vaporization or due to decomposition, or even due to combination
of these to processes. However, using the spectroscopic analysis of the residual IL
in the Pt-crucible, the decomposition products could be easily detected or excluded.
TGA method potentially has considerable advantages compared to the conventional
methods for determining vapor pressures. Compared to conventional techniques for
vapor pressure measurements [18, 49], TGA o�ers several advantages: a relatively
small sample required for measurements, simple operation of the commercial setup,
and short experimental times. As a rule TGA is used at ambient pressure with inert
gas purge over measuring unity. In the latter case the sublimation or vaporization
of the sample from open crucible is promoted by a gas purge over the phase contact
surface and this procedure is essential for study of low volatile compounds.
Several procedures have been developed for investigation of vapor pressures and en-
thalpies of vaporization as well as kinetic parameters of vaporization process. Among
them, isothermal measurements from the open surface (Langmuir experiments) in vac-
uum conditions, isothermal and non-isothermal zero-order kinetic measurements, non-
18
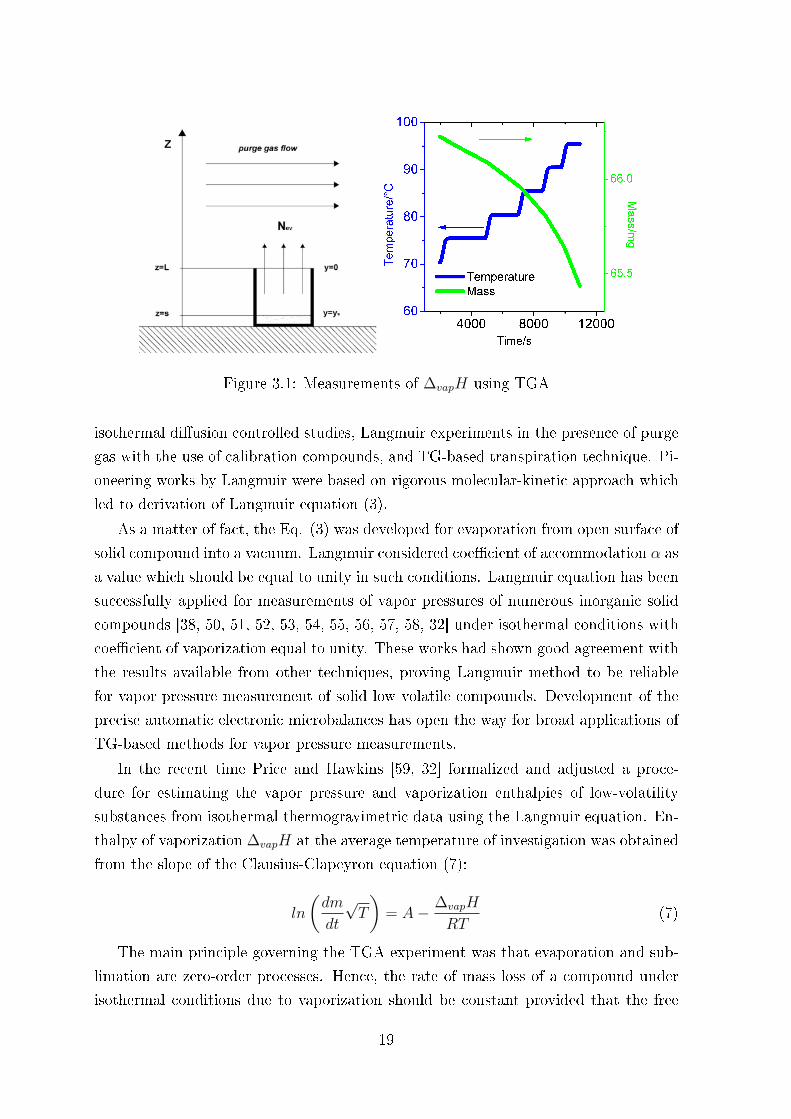
Figure 3.1: Measurements of ∆vapH using TGA
isothermal di�usion controlled studies, Langmuir experiments in the presence of purge
gas with the use of calibration compounds, and TG-based transpiration technique. Pi-
oneering works by Langmuir were based on rigorous molecular-kinetic approach which
led to derivation of Langmuir equation (3).
As a matter of fact, the Eq. (3) was developed for evaporation from open surface of
solid compound into a vacuum. Langmuir considered coe�cient of accommodation α as
a value which should be equal to unity in such conditions. Langmuir equation has been
successfully applied for measurements of vapor pressures of numerous inorganic solid
compounds [38, 50, 51, 52, 53, 54, 55, 56, 57, 58, 32] under isothermal conditions with
coe�cient of vaporization equal to unity. These works had shown good agreement with
the results available from other techniques, proving Langmuir method to be reliable
for vapor pressure measurement of solid low volatile compounds. Development of the
precise automatic electronic microbalances has open the way for broad applications of
TG-based methods for vapor pressure measurements.
In the recent time Price and Hawkins [59, 32] formalized and adjusted a proce-
dure for estimating the vapor pressure and vaporization enthalpies of low-volatility
substances from isothermal thermogravimetric data using the Langmuir equation. En-
thalpy of vaporization ∆vapH at the average temperature of investigation was obtained
from the slope of the Clausius-Clapeyron equation (7):
ln
(dm
dt
√T
)= A− ∆vapH
RT(7)
The main principle governing the TGA experiment was that evaporation and sub-
limation are zero-order processes. Hence, the rate of mass loss of a compound under
isothermal conditions due to vaporization should be constant provided that the free
19

surface area does not change [50].
From our knowledge, the use of thermogravimetry for study of vaporization process
was �rst reported by Gückel et al. [38]. They measured the rates of mass loss of a
group of pesticides using a self-recoding electronic balance in isothermal conditions.
Gückel et al. [38] studied evaporation of a sample from the glass plate attached to the
measuring arm of the balance. In order to prevent the stagnation of vapors near the
surface a purged gas at �xed rates was applied. They observed a strong dependence of
the evaporation rate on the rate of purge gas and suggested a calibration procedure at
de�nite conditions using vapor pressures of a reference compound.
Elder [51] applied a commercially available TG device for sublimation studies of
pharmaceutics into a nitrogen stream in an isothermal conditions. He pointed out the
importance of proper choice of the temperature range for investigation. On the one
hand, a noticeable mass uptake in an acceptable time is required and this restricts
the lower limit of the temperature range. On the other hand, a thermal stability of
compounds under study limits the upper temperature of the range.
Vaporization of series of dyes into a purge gas stream was investigated by Price et
al. [33, 34] in non-isothermal conditions. They rearranged Langmuir equation for the
simple data treatment (5). The calibration constant k was obtained from experiments
with several reference substances with well known pressure under the �xed conditions.
The TGA-procedure suggested by Price [59] is simple and fast, however the assumption
that calibration constant derived from a few reference compound is valid for compounds
of di�erent structure and volatility needs to be worked out and tested carefully.
The TGA technique has been intensively used for studies of vapor pressures of
pharmaceutical compounds [51, 52, 53], cosmetic ingredients [54, 55, 56, 57, 58], and
dyes [32]. In the most studies the non-isothermal conditions of the TGA experiment
have been applied.
For the successful measurements of vapor pressures using TGA the vaporization
coe�cient a in Eq. (1) have to be known. However, the practical and theoretical ob-
servation for the a is still in disarray. According to classic Langmuir´s suggestion the
vaporization coe�cient a should be close to unity for low volatile compounds by vapor-
ization in vacuum [31]. There are two classical approaches for estimating evaporation
rates of pure liquids. The principle of detailed balance requires that under equilibrium
conditions the �ux of molecules that leave the surface (per unit area per unit time) be
equal to the number of identical gaseous molecules that impact the surface, reduced
by a sticking parameter (a < 1). It follows that the evaporation �ux (mol · s−1 · cm−2)
ejected into a vacuum, thus avoiding return by collisions with the ambient gas, be
equal to the kinetic theory estimate of the collision rate of vapor molecules (per unit
area, per unit time) at the equilibrium vapor pressure: J = aP/(2pMRT )1/2, where
20

P is the pressure, M the molecular weight. Thus, a remains a �tting parameter [60].
Another expression was proposed for the rate of evaporation in terms of a unimolec-
ular dissociation of a species weakly bound to the surface layer, with an �activation
energy� equal to the enthalpy of vaporization. Mortensen and Eyring [61] formulated
this model in terms of �absolute reaction rate� theory, postulating a transmission co-
e�cient to be much less than unity. Their �activated state� was de�ned at the instant
when the evaporating species just separated from the surface layer. For the reverse
step, condensation, the activation energy was assumed to be zero.
Jer Ru Maa [62] carried out the thermal gradient in liquid phase calculations in
order to analyze the reason why a < 1. Jer Ru Maa [62] investigated evaporation
rates of water, isopropyl alcohol, carbon tetrachloride, and toluene. The experimen-
tal results agreed satisfactorily with the thermal gradient calculations, making the
assumption that the evaporation coe�cient is unity. This showed that there was lit-
tle or no resistance to molecules crossing the vapor-liquid interface in addition to the
natural resistance imposed by the gas laws. No signi�cant di�erence in the behavior
of evaporation due to the di�erence in molecular structure or chemical properties was
observed.
Later, Price and Hawkins [32, 33, 34] recognized, that for vaporization into a �ow-
ing gas stream at atmospheric pressure rather than into a vacuum, the vaporization
coe�cient a might no longer be equal to unity. In order to assess the vaporization
coe�cient Pieterse and Focke [63] suggested a sophisticated correction for the di�usion
of the sample into the gaseous phase. However, the introduction of plethora additional
(but ill de�ned) parameters into the TGA treatment procedure makes it too com-
plex for reliable estimation of the enthalpy of vaporization for extremely low-volatile
compounds.
Nevertheless, in all determinations of the vapor pressure and the enthalpy of sub-
limation or vaporization carried out by TGA method condensation or accommodation
coe�cient a was taken to be constant in the temperature region of determination. The
value of a in most of the cases depends on the used apparatus and vapor pressure
determination technique, but not the compound and temperature interval.
In order to overcome estimation of the vaporization coe�cient Dollimore and cowork-
ers [52, 53, 54, 55, 56, 57, 58] also suggested using for TGA measurements a reference
compound with the well established vapor pressures. According to their idea, the refer-
ence compound and the sample of interest were measured in the same TGA conditions.
The vaporization coe�cients for both compounds were supposed to be very similar and
the corresponding vapor pressures were estimated. However, in spite of the useful idea,
the enthalpies of vaporization derived by Dollimore et al. [64] sometimes seem to be in
error. For example, vaporization enthalpies of alkyl parabenes (esters of para-hydroxy-
21
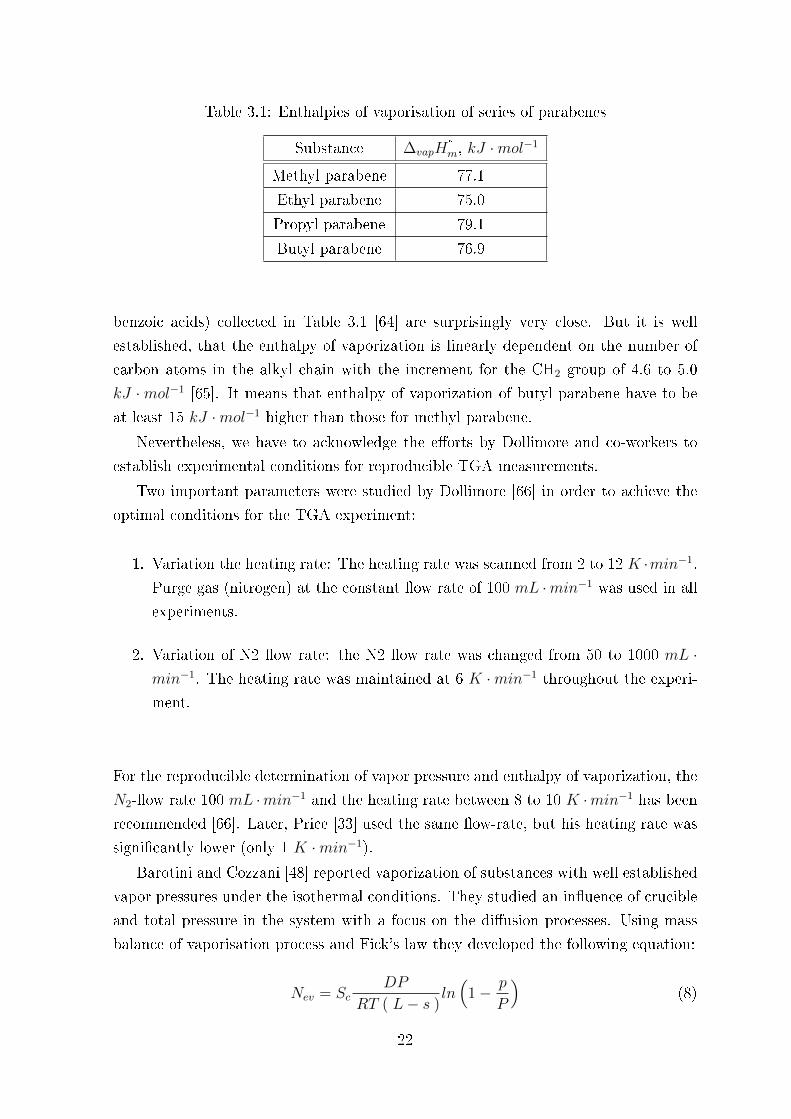
Table 3.1: Enthalpies of vaporisation of series of parabenes
Substance ∆vapH°
m, kJ ·mol−1
Methyl parabene 77.1
Ethyl parabene 75.0
Propyl parabene 79.1
Butyl parabene 76.9
benzoic acids) collected in Table 3.1 [64] are surprisingly very close. But it is well
established, that the enthalpy of vaporization is linearly dependent on the number of
carbon atoms in the alkyl chain with the increment for the CH2 group of 4.6 to 5.0
kJ ·mol−1 [65]. It means that enthalpy of vaporization of butyl parabene have to be
at least 15 kJ ·mol−1 higher than those for methyl parabene.
Nevertheless, we have to acknowledge the e�orts by Dollimore and co-workers to
establish experimental conditions for reproducible TGA measurements.
Two important parameters were studied by Dollimore [66] in order to achieve the
optimal conditions for the TGA experiment:
1. Variation the heating rate: The heating rate was scanned from 2 to 12 K ·min−1.
Purge gas (nitrogen) at the constant �ow rate of 100 mL ·min−1 was used in all
experiments.
2. Variation of N2 �ow rate: the N2 �ow rate was changed from 50 to 1000 mL ·min−1. The heating rate was maintained at 6 K ·min−1 throughout the experi-
ment.
For the reproducible determination of vapor pressure and enthalpy of vaporization, the
N2-�ow rate 100 mL ·min−1 and the heating rate between 8 to 10 K ·min−1 has been
recommended [66]. Later, Price [33] used the same �ow-rate, but his heating rate was
signi�cantly lower (only 1 K ·min−1).
Barotini and Cozzani [48] reported vaporization of substances with well established
vapor pressures under the isothermal conditions. They studied an in�uence of crucible
and total pressure in the system with a focus on the di�usion processes. Using mass
balance of vaporisation process and Fick's law they developed the following equation:
Nev = ScDP
RT ( L− s )ln(
1− p
P
)(8)
22

where Nev � the molar evaporation rate, mol ·s−1;Sc � the surface available for mass
transfer, m2; D � di�usion coe�cient of the substance in the purge gas, m2 · s−1; P �
total pressure in the system, assumed to be equal to that of purge gas, Pa; T � the
temperature of the measurement, K ; L � the height of the crucible, m;s � the height
of the substance layer in the crucible, m; p � the vapor pressure of the substance, Pa.
In order to treat the equation (8) Barotini and Cozzani [48]. suggested to use
additional equations, describing dependence of di�usion coe�cient and vapor pressure
on the temperature. According to Chapmen-Enskog model the dependence of the
di�usion coe�cient is de�ned in the following way:
D = k0T3/2 (9)
where k0 - an empirical constant, de�ned from experimental data. To describe the
vapor pressure dependence Antoine equation was used:
log10Psat = A− B
C + T(10)
In this way, the �nal equation used to treat the data with non-linear least squares
method, is as follows:
∑Nev − SC
k0PT1/2
R ( L− s )ln
1− 10A−
B
C + T
P
2
→ min (11)
After the non-linear least squares is applied to treat the TG-data, the parameters
of Antoine equation, describing dependence of vapor pressure on the temperature, are
determined, as well as di�usion coe�cient parameter. This procedure assumes that the
molar mass of the substance in the vapor phase is known. The main advantage of this
method is the possibility to determine vapor pressure and di�usion coe�cient without
calibration constant and reference substances. This eliminates the necessity to select
the reference substance with reliable vapor pressure data, which are in de�cit for low
volatile compounds. The disadvantage of this method is that it is not applicable to
free evaporation from sample placed into plane crucible, since L = s.
Very detailed and systematic study of process of evaporation of low volatile com-
pounds in the presence of purge gas was carried out by Focke [63, 67]. In order to
explain the observations of Gückel and Dollimore, where the dependence of the evap-
oration rate on the purge gas rate and low value of accommodation coe�cient were
detected, Focke developed the equation, describing the evaporation into the purge gas.
His assumptions were the following:
23

� Constant physical properties. All physical properties, including the di�usion
coe�cient, DAB are assumed concentration independent. The mole fraction of
compound A anywhere in the purge gas is so low that the physical properties of
the gas mixture are essentially identical to those of the pure purge gas.
� No chemical reaction occurs. The possibility of association of sample molecules
in the gas phase is not considered.
� Gas solubility. It is assumed that the carrier gas is insoluble in the sample
liquid/solid.
� Isothermal conditions. The thermogravimetric experiment is conducted under
steady state isothermal conditions.
� Sample dimensions. The sample has well-de�ned dimensions with a characteristic
length scale denoted by L. The size of the sample substance is assumed small
compared to dimensions of the experimental cavity.
� Steady state conditions. In reality vaporisation leads to a loss of sample vol-
ume and strictly speaking one is dealing with a moving boundary problem. It
is assumed that the boundary regression is so slow that a pseudo-steady state
assumption is valid.
� Ideal gases. All the vapors behave as ideal gases.
� Concentration of the sample substance A in the gas. The approaching purge gas
does not contain compound A as an impurity. At the sample surface the con-
centration of compound A equals the equilibrium concentration at the prevailing
temperature and pressure and is calculated from Raoult's law.
Based on these assumptions and mass balance of evaporating substance he derived the
following equation for the analysis of TGA data:
p =RT
kc ·Mdm
dt(12)
where kc - mass transfer coe�cient, de�ned by the geometry of measuring system,
di�usion coe�cient of the substance in the purge gas and the rate of purge stream. In
case of di�usion into the stagnant gas the equation (12) transforms into:
p =RT
MD
z
SC
dm
dt(13)
24

where z � di�usion path length, equal to the height of crucible, occupied by gas.
In this way, comparison of the equation (13) with Langmuir equation (3) gives the
expression for accommodation coe�cient:
α =D
z
√2πM
RT(14)
Using eq. (14), Focke estimated the value of the accommodation coe�cient α, which
is in close agreement with that, obtained by Dollimore [64]. The method developed
by Focke gives a good description of the evaporation process into the purge gas. It
clearly shows that accommodation coe�cient is not substance independent and the
procedure proposed by Hawkins and Price [59, 32] is not applicable in general. Also,
it explains that the method by Dollimore [64] for evaluation of vapor pressures is
more preferable, since it requires the structural similarity of the investigated and the
reference compounds. However, the method by Focke [63] requires data on di�usion
coe�cient of the substance in the purge gas, which are not readily available.
In the recent years Vecchio et al [65, 68, 69, 70] have used TGA with non-isothermal
and isothermal conditions for measurements of vaporization enthalpies of di�erent
classes of organic compounds (substituted acetanilides, simetryn, ametryn, terbutryn,
alachor, and other pesticides). In all studies the vaporization coe�cient α was consid-
ered to be constant. Careful validation of TGA procedure and uncertainties assessment
has been performed using benzoic, succinic, and salicylic acids. The TGA data have
been shown to be in agreement with the recommended values, provided that the study
is performed very narrow temperature range (about 30 K) [65].
Experimental procedures reported for TGA have been developed mostly for studies
of solid molecular compounds. What about liquid and ionic compounds? Are there
any peculiarities in comparison to solid and molecular compounds to be expected?
Luo et al [71] were the �rst who applied TGA for the determination of the enthalpies
of vaporization for ionic liquids. They applied isothermal conditions for determination
of the vaporization rates. In contrast to non-isothermal TGA method, during each
isothermal step the very low vaporization rates can be detected with su�cient uncer-
tainty and reproducibility. In addition, the higher sensitivity at the isothermal step
allows perform experiments at substantially lower temperatures where a possible de-
composition of the IL sample is hardly expected. But it should be mentioned that
the use of the isothermal steps during investigation consumes essentially more time in
comparison the non-isothermal scanning mode.
Also Luo et al [71] were the �rst who applied TGA for ILs, their enthalpies of
vaporization for the [Cnmim][NTf2] series spread within (5-7) kJ ·mol−1 around the
data obtained by another established methods: Knudsen [72], transpiration [73], and
25

TPD-MS [71, 74, 75]. Unfortunately, not much detail on the experimental procedure
was reported in this work [71] in order to understand the reason for the data scatter.
May be the very narrow temperature range (45 K) and only 4 isotherms have caused
this scatter.
Jess and coworkers [76, 77] used non-isothermal TGA technique in order to study
the long-term stability of di�erent types of ILs. The have suggested an excellent analy-
sis of the mass loss process occurring in the conditions of the TGA measurements, Using
purge gases with di�erent di�usion properties they were able to separate the vaporiza-
tion and decomposition processes in the TGA run. They found that for [C4mim][NTf2]
the rate of decomposition is very low up to 653 K. They derived enthalpy of vaporiza-
tion of 108 kJ ·mol−1 (at 600 K) for [C4mim][NTf2]. This value is an agreement with
the results obtained by Knudsen [72] and mass-spectrometry [71, 74, 75]. However,
this method is very sophisticated and needs a large amount of auxiliary data. It can be
hardly possible to use as an easy and fast method to obtain enthalpies of vaporization
of ILs.
Aschenbrenner et al [78] used isothermal TGA method to estimate the vapor pres-
sure of some ILs: [C4mim][NTf2], [C2mim][C2SO4], [C6mim][CF3SO3], and poly[(p-
vinylbenzyl)-trimethylammonium hexa�uorophosphate]. Glycerol was used as a refer-
ence compound in the determination. Their vapor pressure for [C4mim][NTf2] is three
orders of magnitude higher than those from well established Knudsen technique [72].
For other ILs the vapor pressure was assessed to be near 1 to 2 Pa at 373 K. These val-
ues seem to be generously overestimated. That is why we are very reticent to use TGA
for determination of the absolute vapor pressures without careful elaboration of the
experimental procedure. In contrast, the TGA method is apparently very promising
for the express, but reliable determination vaporization enthalpy.
Summing up the available details on the TGA experiment, the isothermal mode is
apparently more preferable for the reliable determination of vaporization enthalpies.
However, a careful elaboration of the TGA procedure towards reproducible measure-
ments for ILs is still required. In order to adjust the TGA experimental conditions for
extremely low volatile compounds the screening of the limits for the following param-
eters is necessary:
1. amount of sample evaporated during each isothermal step;
2. �ow rate of the purge gas;
3. temperature range for the determination of the vaporization rate
26

Using optimized parameters it could be possible to adjust TGA for express deter-
mination of vaporization enthalpies in agreement with the other methods within 2-3
kJ ·mol−1. In our opinion, the more precise determination of the enthalpy of vaporiza-
tion lies outside the limits for the method of the fast evaporation from the open surface
used in TGA.
It is reasonable to perform screening of the TGA parameters using some reference
compounds with the well established pressures and vaporization enthalpies. As a mat-
ter of fact, only a few very low volatile compounds with the reliable data are available
in the literature. In this work we have used hexadecane, di-butyl phthalate, methyl,
and ethyl stearates for screening the experimental conditions.
3.2 Experimental section
3.2.1 Materials and chemicals
Samples of reference materials (hexadecane, di - butylphthalate, methyl stearate,
and butyl stearate) were of commercial origin and they were distilled under reduced
pressure prior to use and stored under dry nitrogen. The degree of purity was de-
termined using a gas chromatograph (GC) equipped with a �ame ionization detector.
The carrier gas (nitrogen) �ow was 7.2 dm3 ·h−1. A capillary column HP-5 (stationary
phase crosslinked 5% PH ME silicone) was used with a column length of 30 m, an
inside diameter of 0.32 mm, and a �lm thickness of 0.25µm. The standard temperature
program of the GC was T = 323 K for 180 s followed by heating to T = 523 K with
the rate of 10 K · min−1. No impurities (greater than 0.05 mass per cent) could be
detected in the samples used for the measurements.
Samples of [C2mim][NTf2], [C4mim][NTf2], [C6mim][NTf2], [C8mim][NTf2], [C10mim][NTf2]
of commercial origin (Iolitec) were used. Samples of [C12mim][NTf2], [C14mim][NTf2],
[C16mim][NTf2] samples were synthesized by Prof. P. Wasserscheid. Samples of ILs
from [C2mim][NTf2] to [C12mim][NTf2] were transparent, colorless or slightly yel-
low liquids without odor. [C14mim][NTf2] and [C16mim][NTf2] were white crystals
without odor.
Samples of [C2mim][Br], [C4mim][Br], [C2mim][Cl], and [C4mim][Cl] of commer-
cial origin (Iolitec) were used. Samples of [C1mim][Cl] and [C6mim][Br] were synthe-
sized by Dr. Tim Peppel and Prof. M. Köckerling (University of Rostock). Structures
of the non-commercial samples were proved by C13 NMR. Prior to use IL samples were
subjected to vacuum evaporation to remove possible traces of solvents and moisture.
Samples were additionally puri�ed in the preconditioning experiments.
27

3.2.2 TGA � Measurements of Vaporization Enthalpy
In this work we used Perkin Elmer Pyris 6 TGA. The calibration was performed with
the use of extra pure (99.999%) alumel, nickel, and perkalloy by means of registration
of Curie-points. The uncertainty of temperature calibration was less than 0.5 K. Mass
calibration was performed with the use of standard weight of 100 µg. The purge gas �
nitrogen was obtained by the vaporization of the liquid nitrogen from a Dewar vessel.
About 50-60 mg of a sample under study was placed into the platinum crucible
with the vertical walls, diameter of 10 mm and the height 3 mm. In order to keep the
evaporation area possibly constant the crucible was �lled up to the edge. The �lling
station was organized in the glove box. Solid samples were solved in dry acetonitrile and
charged to the crucible with a syringe. Then, the solvent was evaporated at the 100°C
for 2 hours. Prior to measurement of the vaporization enthalpy, a careful conditioning
of the sample inside the TGA have been performed. During the conditioning procedure
the sample was several times heated and cooled down in scanning mode in order to
remove any traces of the solvent and the occluded water. The conditioning was repeated
until the reproducible mass loss within two consequent runs was recorded.
The balance of the TGA instrument is highly sensitive but at the same time is sub-
ject for possible systematic errors due to the thermal drift or purge gas rate �uctuations.
That is why it is vitally important to optimize measuring conditions for minimizing the
interfering factors. The main parameters responsible for reliable vaporization enthalpy
measurements using the TGA are discussed below.
Mass uptake is the mass of the sample evaporated during each isotherm. Using
in the TGA experiments very small mass losses could substantially reduce measuring
times at lower temperatures. This is essentially important for the extremely low volatile
ionic liquids. But, if the mass uptake is comparable with uncertainty of the balance,
the reliable result is hardly expected. The lower level for mass uptake is determined
by the longtime stability of the speci�c TGA setup (see Fig. 3.2). The uncertainty
of the mass determination by the Perkin Elmer Pyris 6 is 0.02 µg. From a series of
experiments we have concluded that the mass uptake during each isotherm should be
at least more than 0.06 µg.
The upper limit of mass uptake is stipulated by an impact of the mass change
inside the crucible on the surface area and the distance between vaporization surface
and gas stream. In order to localize the maximal mass uptake during the isothermal
step, the series of experiments were carried out. The enthalpies of vaporization for
the reference compounds (hexadecane, di-butyl phthalate, methyl and ethyl stearates)
were determined at the �ow rate of nitrogen 60 mL ·min−1, the temperature interval
of the enthalpy of vaporization determination was 60 K, the duration of each isotherm
was at least 10 min. The mass loss during isothermal run was changed stepwise from
28
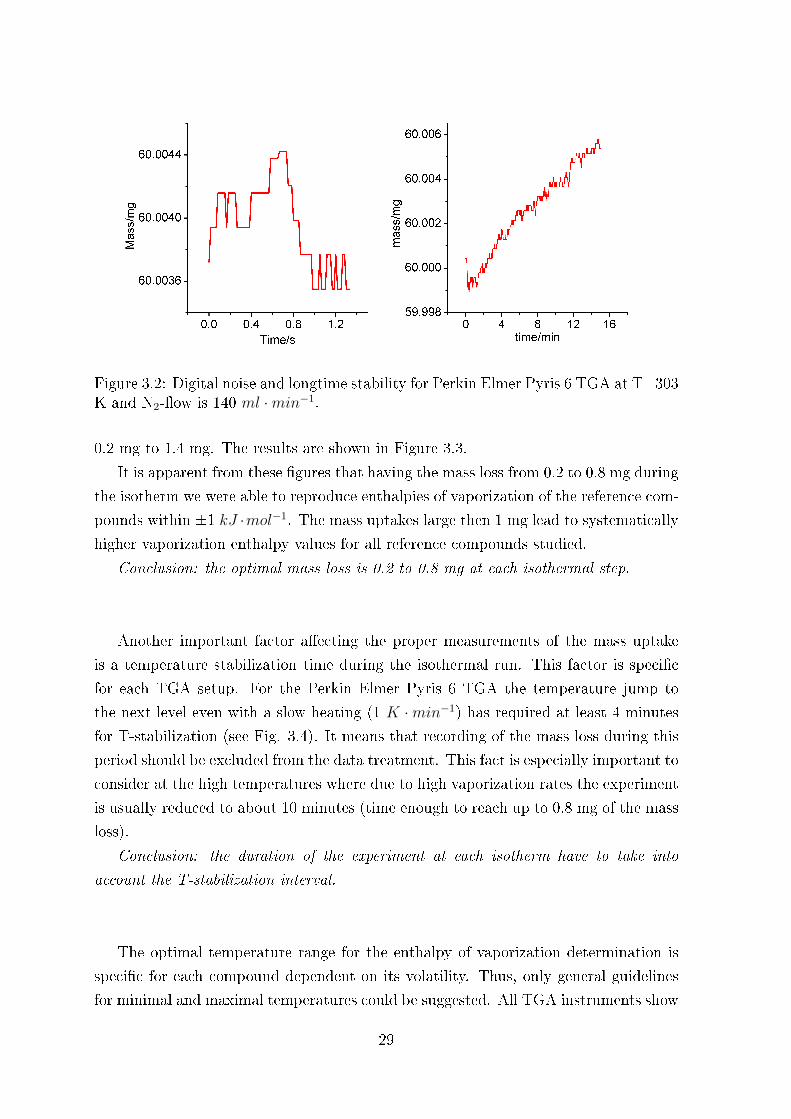
Figure 3.2: Digital noise and longtime stability for Perkin Elmer Pyris 6 TGA at T=303K and N2-�ow is 140 ml ·min−1.
0.2 mg to 1.4 mg. The results are shown in Figure 3.3.
It is apparent from these �gures that having the mass loss from 0.2 to 0.8 mg during
the isotherm we were able to reproduce enthalpies of vaporization of the reference com-
pounds within ±1 kJ ·mol−1. The mass uptakes large then 1 mg lead to systematically
higher vaporization enthalpy values for all reference compounds studied.
Conclusion: the optimal mass loss is 0.2 to 0.8 mg at each isothermal step.
Another important factor a�ecting the proper measurements of the mass uptake
is a temperature stabilization time during the isothermal run. This factor is speci�c
for each TGA setup. For the Perkin Elmer Pyris 6 TGA the temperature jump to
the next level even with a slow heating (1 K ·min−1) has required at least 4 minutes
for T-stabilization (see Fig. 3.4). It means that recording of the mass loss during this
period should be excluded from the data treatment. This fact is especially important to
consider at the high temperatures where due to high vaporization rates the experiment
is usually reduced to about 10 minutes (time enough to reach up to 0.8 mg of the mass
loss).
Conclusion: the duration of the experiment at each isotherm have to take into
account the T-stabilization interval.
The optimal temperature range for the enthalpy of vaporization determination is
speci�c for each compound dependent on its volatility. Thus, only general guidelines
for minimal and maximal temperatures could be suggested. All TGA instruments show
29

Figure 3.3: Enthalpies of vaporization of reference substances, obtained at di�erentmass losses.
Hexadecane di-Butyl Phthalate Methyl Stearate Ethyl Stearate
certain drift of the base line of the signal under isothermal conditions, thus vaporization
rate should overcome this drift and the vaporization rate should be large enough to
minimize the in�uence of the drift. The minimal vaporization rate related to unit
surface was found to be 6.3 · 10−8 kg · s−1 · m−2 for Pyris 6 TGA. Following, the
minimal temperature of the experiment should correspond to this value.
The maximal possible temperature of the experiment is usually de�ned by the ther-
mal stability of the sample. Good practice to determine a decomposition temperature
is to perform dynamic TGA at several heating rates and to extrapolate the onset to
the zero heating rate. An actual temperature interval has to be at least 60 degrees.
The large temperature range is more preferable. As a rule, the experimental time to
collect 0.06 mg mass loss and the long-term stability are responsible for the lowest
temperature of TGA runs. To save time it is reasonable to shift the study to the
30
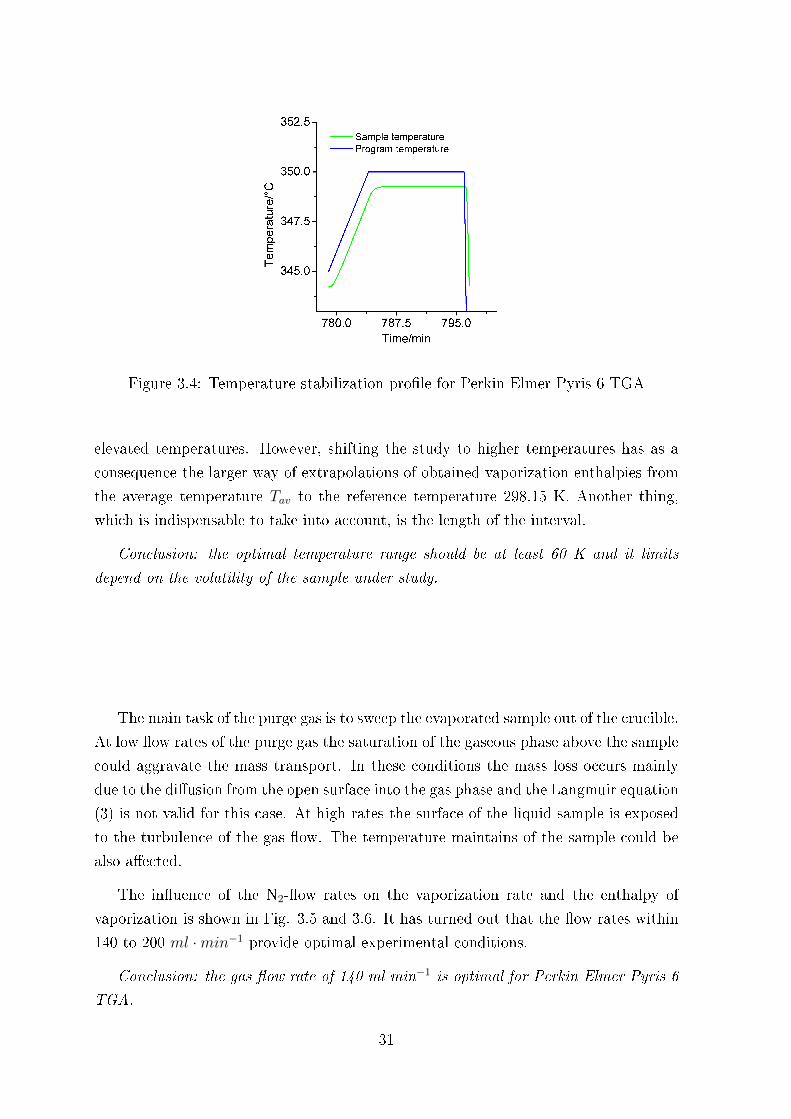
Figure 3.4: Temperature stabilization pro�le for Perkin Elmer Pyris 6 TGA
elevated temperatures. However, shifting the study to higher temperatures has as a
consequence the larger way of extrapolations of obtained vaporization enthalpies from
the average temperature Tav to the reference temperature 298.15 K. Another thing,
which is indispensable to take into account, is the length of the interval.
Conclusion: the optimal temperature range should be at least 60 K and it limits
depend on the volatility of the sample under study.
The main task of the purge gas is to sweep the evaporated sample out of the crucible.
At low �ow rates of the purge gas the saturation of the gaseous phase above the sample
could aggravate the mass transport. In these conditions the mass loss occurs mainly
due to the di�usion from the open surface into the gas phase and the Langmuir equation
(3) is not valid for this case. At high rates the surface of the liquid sample is exposed
to the turbulence of the gas �ow. The temperature maintains of the sample could be
also a�ected.
The in�uence of the N2-�ow rates on the vaporization rate and the enthalpy of
vaporization is shown in Fig. 3.5 and 3.6. It has turned out that the �ow rates within
140 to 200 ml ·min−1 provide optimal experimental conditions.
Conclusion: the gas �ow rate of 140 ml min−1 is optimal for Perkin Elmer Pyris 6
TGA.
31
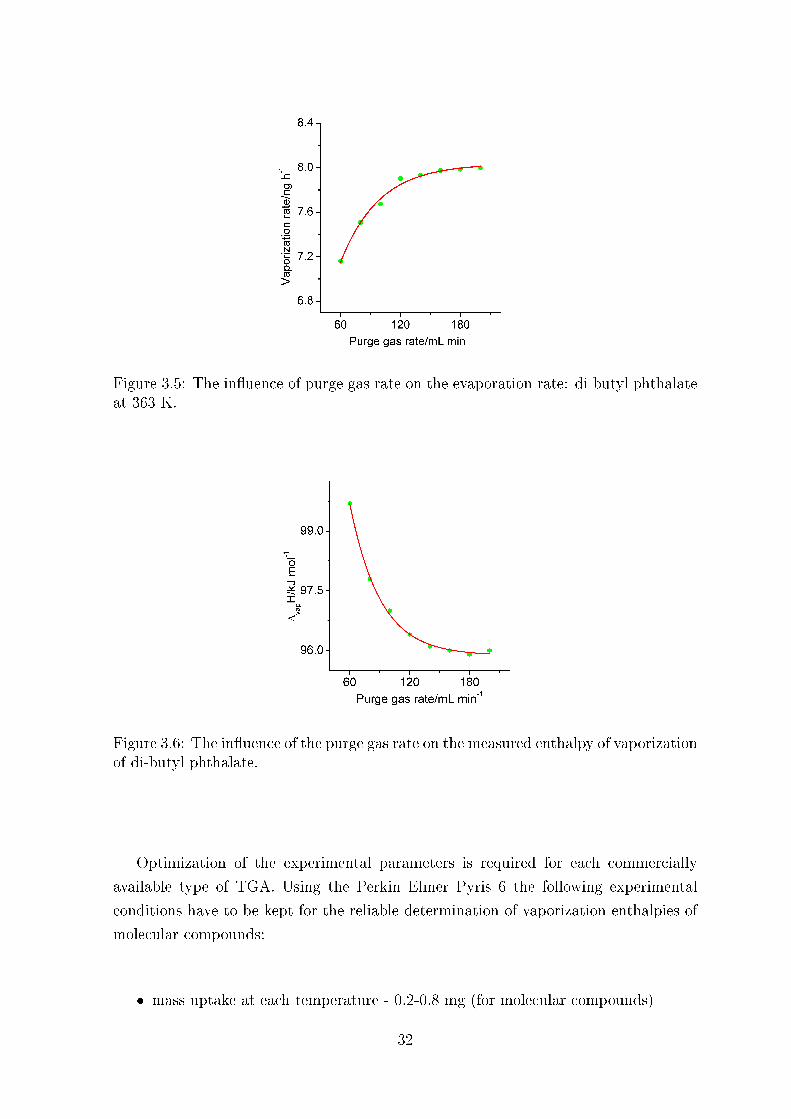
Figure 3.5: The in�uence of purge gas rate on the evaporation rate: di-butyl phthalateat 363 K.
Figure 3.6: The in�uence of the purge gas rate on the measured enthalpy of vaporizationof di-butyl phthalate.
Optimization of the experimental parameters is required for each commercially
available type of TGA. Using the Perkin Elmer Pyris 6 the following experimental
conditions have to be kept for the reliable determination of vaporization enthalpies of
molecular compounds:
� mass uptake at each temperature - 0.2-0.8 mg (for molecular compounds)
32

� duration of isothermal steps - at least 10 min
� temperature range at least 60K
� purge gas 140 to 200 mL ·min−1
3.3 Results
3.3.1 Test-measurements of vaporization enthalpies of the reference Molec-
ular Liquids
Having established the optimal conditions for the TGA experiment, the set of ref-
erence compounds: hexadecane, di-butyl phthalate, methyl, and ethyl stearates have
been studied. These molecular heavy volatile compounds have well established vapor-
ization enthalpies. It is possible to test the selected experimental conditions with these
molecular compounds in order to extend these conditions for experiments with ionic
liquids, where reliable experimental data are still absent [17]. For each compound at
least 5 to 7 TGA-runs in the selected T-range have been performed. The �rst (and
sometimes the second) run have not been taken into account because of conditioning of
the sample as described above. The resultative runs were treated together. The mass
loss values measured in the di�erent runs were scaled due to decreasing of the absolute
value of the sample from run to run.
3.3.2 Data treatment of the TGA-measurements of molecular liquids
Enthalpies of vaporization derived using Eq. (7) are referred to the mean tempera-
ture of the studied range. These values have to be adjusted to the reference temperature
of 298.15 K using the following equation:
∆vapH298 = ∆vapHT −∆gl cp · (T − 298.15) (15)
where, ∆gl cp � the di�erence of heat capacities of liquid and gas phases.
Values ∆gl cp of have been derived from the isobaric molar heat capacities of the
liquid compounds, cp,l , calculated according to the group additivity method procedure
developed by Chickos [79]:
∆gl cp = 10.58 + 0.26 · cp,l (16)
33
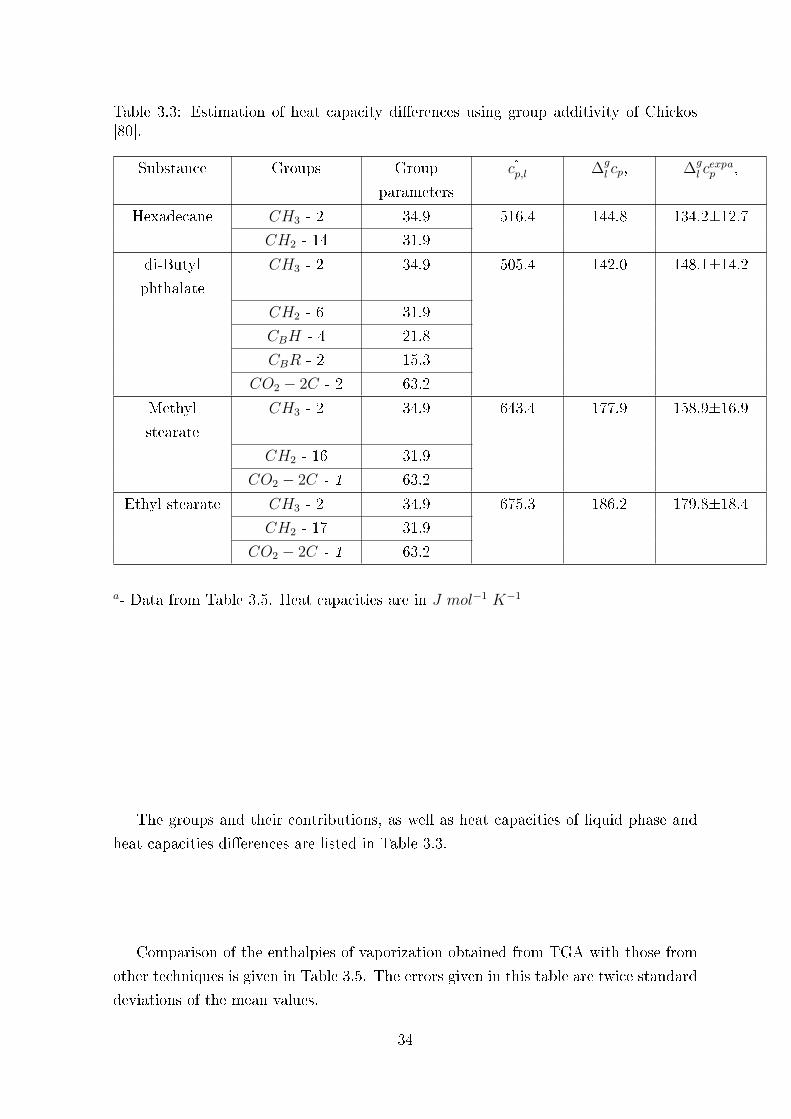
Table 3.3: Estimation of heat capacity di�erences using group additivity of Chickos[80].
Substance Groups Group
parameters
c°p,l ∆gl cp, ∆g
l cexpp
a,
Hexadecane CH3 - 2 34.9 516.4 144.8 134.2±12.7
CH2 - 14 31.9
di-Butyl
phthalate
CH3 - 2 34.9 505.4 142.0 148.1±14.2
CH2 - 6 31.9
CBH - 4 21.8
CBR - 2 15.3
CO2 − 2C - 2 63.2
Methyl
stearate
CH3 - 2 34.9 643.4 177.9 158.9±16.9
CH2 - 16 31.9
CO2 − 2C - 1 63.2
Ethyl stearate CH3 - 2 34.9 675.3 186.2 179.8±18.4
CH2 - 17 31.9
CO2 − 2C - 1 63.2
a- Data from Table 3.5. Heat capacities are in J mol−1 K−1
The groups and their contributions, as well as heat capacities of liquid phase and
heat capacities di�erences are listed in Table 3.3.
Comparison of the enthalpies of vaporization obtained from TGA with those from
other techniques is given in Table 3.5. The errors given in this table are twice standard
deviations of the mean values.
34

Table 3.5: Reference molecular compounds. Comparison of the enthalpies of vaporisa-tion (at 298.15 K) measured using TGA and other techniques.
Substance Temperature B C ∆gl c
°
p,exp, ∆vapHexp298 , ∆vapH
lit298, Method
range, °C Jmol−1K−1 kJmol−1 kJmol−1
Hexadecane 50-110 14567.2 -16.141 134.2±12.7 81.1±1.7 80.6[81] ebulliometry
di-Butyl
phthalate
90-150 16869.9 -17.813 148.1±14.2 95.0±1.2 94.0[82] transpiration
Methyl
stearate
50-110 18472.0 -19.112 158.9±16.9 106.2±1.3 104.0[82] transpiration
Ethyl
stearate
90-150 19666.5 -21.626 179.8±18.4 109.9±0.9 110.8[82] transpiration
As can be seen from the Table 3.5 in the selected experimental conditions we have
been able to reproduce the recommended literature values for very low volatile com-
pounds within ±2.0 kJ ·mol−1.
However, in order to measure to the absolute values of vapor pressure using TGA
an extended study of the vaporization coe�cient α is required.
In order to demonstrate the importance of the further careful studies, the absolute
vapor pressures of hexadecane measured using the transpiration technique are com-
pared with the results from TGA (Fig. 3.7). As a matter of fact the mass uptake
directly measured by TGA is only proportional to the values of lnp. According to the
Langmuir equation (3) the vaporization coe�cient is responsible for the adjustment
of the results to the absolute vapor pressure. In the �ow of the purge gas α can be
considered as a constant. However, the available in the literature information on α the
is contradicting. Moreover, until now is nothing known about α in case of ILs. For
example - is it the same within the homologous series or is it di�erent for the molecular
and the ionic compounds. The nature of this coe�cient will be carefully studied using
comparison of the TGA data with the absolute vapor pressures obtained e.g. static or
transpiration method, which are well established in our laboratory. This work is still
in progress.
3.3.3 Test-measurements of vaporization enthalpies of Ionic Liquids
With the reliable data on vaporization enthalpies for the reference compounds
(molecular liquids) we have tested in�uence of all important experimental conditions
(T-range, mass uptake, �ow-gas rate, evaporation surface, initial mass of sample, con-
ditioning of the sample etc.). These studies have allowed to localize the boundaries
35

Figure 3.7: Comparison of the results from transpiration and TGA for hexadecane.
for variation of experimental parameters and to recommend the selected conditions for
the reliable determination of the vaporization enthalpy for the heavy volatile molecular
compounds. As can be seen from the Table 3.5, it is possible to measure ∆vapH (298
K) of the reference compounds within ± 1 to 2 K ·mol−1 by using TGA.
Having established the optimal conditions for the molecular compounds, we have
applied them for investigation of the ionic liquids [Cnmim][NTf2], where numerous
vaporization enthalpies are already available [17]. Vaporization enthalpies of ILs have
been measured using the TGA unit � Perkin Elmer Pyris 6 TGA. Isothermal gravimet-
ric analysis curves were measured in the temperature range 480-570 K in nitrogen at a
�ow rate of 140 mL ·min−1. Platinum plane crucible (diameter 10−2 m) with about 70
mg of the sample was used. A heating ramp of 10 K ·min−1 was used, followed by a 4
h static hold period at 150°C, allowing for the slow removal of volatile impurities such
as 1-methylimidazole and traces of water prior to a stepwise isothermal run. For our
experiments, we used the same platinum crucible for each sample, in order to maintain
a uniform cross-sectional area. Already in preliminary measurements have shown that
due to very low volatility of ILs the mass uptake of only 0.06-0.1 mg is possible to ob-
tain at each temperature. However such small mass uptake still �ts the recommended
experimental conditions (see Chapter 3.2.2).
The results of the mass loss determination for the series of 1-alkyl-3-methylimidazolium
bis (tri�uoromethanesulfonyl) imides [Cnmim][NTf2] are listed in Table A.5. The mass
loss values in the formdm
dt
√T (we have applied r =
dm
dtin tables and �gures) was
used to derive the enthalpy of vaporization.
36

Figure 3.8: The spectra of [C12mim][NTf2] used in TGA investigations [83].
The absence of decomposition during the vaporization process was veri�ed by ATR
IR spectroscopy of the initial sample, sample condensed on the apparatus lid and
sample left in the crucible after enthalpy of vaporization determination No evidence
for thermal degradation has been observed, consistent with results from our earlier
measurements [38]. The IR spectra of [C12mim][NTf2] is shown in Figure 3.8 as an
example. The di�erences in obtained spectra are connected to small amount of sample
condensed on the cover, but not to any possible decomposition.
3.3.4 Data treatment of the TGA-measurements of ionic liquids
Enthalpies of vaporization of ionic liquids derived using equation (7) from the data
listed in Table A.5 are given in Table 5. These enthalpies of vaporization are also
referred to the mean temperature of the studied range and they have to be adjusted to
the reference temperature of 298.15 K using equation (15). Adjustment of the vaporiza-
tion enthalpy to the reference temperature is usually performed under the assumption
of the constant di�erence between heat capacity liquid and gaseous phases. In con-
trast to the molecular compounds, values of for ionic liquids are ill de�ned. Because
of the total lack of the information, the arbitrary values of of 94 J ·mol−1 ·K−1, 100
37

Table 3.7: The enthalpies of vaporization for 1-alkyl-3-methylimidazoliumbis(tri�uoromethanesulfonyl)imides by TGA method.
n in
[Cnmim][NTf2]
∆vapH
(542 K)
kJ ·mol−1
−∆gl cp
J ·mol−1 ·K−1∆vapH
(298.15 K)
kJ ·mol−1
∆vapH
(380 K)
kJ ·mol−1
∆vapHa
(380 K)
kJ ·mol−1
2 109.5±2.0 45.8±5.7 120.8±2.4 116.9±2.2 118.5±1.0
4 113.4±2.0 65.7±7.3 129.5±2.7 124.1±2.3 124.3±1.0
6 117.9±2.0 94.1±9.5 140.9±3.1 133.2±2.5 131.9±1.0
8 122.6±2.0 125.0±11.3 153.2±3.4 142.9±2.7 137.5±1.0
10 122.6±2.0 142.6±15.7 157.1±4.0 145.8±3.2 144.3±1.0
12 124.7±2.0 159.6±18.1 163.6±4.7 150.6± 3.5 151.1±1.0
14 132.6±2.0 169.1±20.4 173.9±5.4 160.1±3.9 158.4±1.0
16 136.3±2.0 175.6±21.3 179.2±6.0 164.8±4.6 164.4±1.0
a- Data from Knudsen QCM method [83].
J ·mol−1 ·K−1 or 105 J ·mol−1 ·K−1 [72] are commonly used for ILs regardless on their
structures. In this work we suggest to apply the Clarke and Glew equation to obtain
the heat capacity di�erence from our experimental data listed in Table A.5. Clarke
and Glew [84] suggested to approximate the vapor pressure temperature dependence
using the three adjustable parameters with the physical meaning as enthalpy ∆vapH°
298,
and entropy ∆vapS°
298 of vaporisation, as well as the di�erence between heat capacity
of liquid and gaseous phases ∆gl cp:
lnp =∆vapS
°
298
R− ∆vapH
°
298
RT− ∆g
l cpR
(ln
T
298.15− 1 +
298.15
T
)(17)
Combination of equations (3) and (17) gives the following relationship:
ln
(dm
dt
√T
)= A− B
T− C · ln
(T
298.15
)(18)
where ∆gl cp = C ·R and ∆vapH
°
298 = B ·R−∆gl c
°
p · 298.15.
We have tested this procedure for the reference molecular liquids (see Table 3 and
4) successfully. The results of the determination of ∆vapH at the average and reference
temperature are listed in Table 6.
As a rule for each sample under study a large amount of experimental points are
obtained. The standard deviation of the experimental vaporization enthalpy was usu-
ally within 0.8 to 1.8 kJ ·mol−1. However, taking into account that TGA method is
38
not a method developed for the enthalpy of vaporization determination, the standard
deviation represents only the reproducibility of the TGA experiment. It is di�cult
to assess the systematic error inherent for TGA. Therefore, in the case where the en-
thalpy of vaporization is good reproducible within ±1 kJ · mol−1 we are reticent to
ascribe this very small uncertainty to the measured value, because it means generous
overestimation of the reliability the result. Nevertheless, from our experiences with
measurements of the reference molecular compounds, we have observed the agreement
with the recommended data on ∆vapH within ± (1 to 2) kJ ·mol−1. Therefore, for the
enthalpies of vaporization for ILs measured by TGA the uncertainty of the result was
estimated as twice standard deviation. When the estimated in such way uncertainty
was lower than 2 kJ ·mol−1, it was taken to be equal 2 kJ ·mol−1.
In uncertainties of enthalpies of vaporization adjusted to 298.15 K the uncertainty
of ∆vapHT at mean temperature and the uncertainty of the heat capacity di�erence
between liquid and gaseous state ∆gl cp were included according to the following equa-
tion:
∆∆vapH298 =
√∆∆vapH2
T + (∆∆gl cp (T − 298.15))2
The uncertainty assigned to ∆vapH is twice the standard deviation.
3.4 Discussion
ILs are claimed to have negligible vapor pressures and most of the chemical and
technical applications of ILs are based on this remarkable property. A reasonable accu-
racy of the TGA method for measurements of vaporization enthalpies of imidazolium
based ILs have been demonstrated just recently [77, 85] and it has prompted the cur-
rent study. At the same time the recent paper by Styring et al. [78] have demonstrated
quite clearly complications which are arising, when the vapor pressure data are de-
rived from the TGA data. Their vapor pressure for [C4mim][NTf2] of 1.2 Pa at 120°C
is 12000 times higher compared to the result expected at this temperature from the
Knudsen measurements [72]. Taking into account these advantages and complications
we decided �rst to develop the TGA method to measure enthalpies of vaporization of
the very low volatile liquids (molecular and ionic) accurately.
3.4.1 TGA studies of 1-alkyl-3-methylimidazolium bis (tri�uoromethane-
sulfonyl) imides
Already previous investigations of ILs have shown that 1-alkyl-3-methylimidazolium
bis (tri�uoromethanesulfonyl) imides [Cnmim][NTf2] were remarkably stable to be
vaporized without decomposition at rather high temperatures of 300 to 573 K [85, 74,
39

86, 17, 72, 75]. However the available in the literature data on vaporization enthalpies
for this homological series are apparently in disarray (see Fig. 3.9 and Table 7). There
are di�erent tendencies in the enthalpies of vaporization for this series measured in the
di�erent works. For example, an unusual for homologous series non-linear dependence
of the enthalpy of vaporization on the chain length of the in the cation was observed for
ethyl-, butyl-, hexyl- and octyl- derivatives determined by the Knudsen method [72] and
by TPD MS [74]. Also from the results of Knudsen method [72] the vapor pressure for
[C6mim][NTf2] is higher than that for [C4mim][NTf2]. At the same time, the direct
calorimetrically measured values of vaporization enthalpies [17] showed the expected
liner dependence of the enthalpy of vaporization! However, the contribution for CH2
group to the enthalpy of vaporization from the calorimetric study was surprisingly
high (8.9±0.6 kJ · mol−1) in comparison to the same contribution to the enthalpy
of vaporization in n-alkanes (4.95 ± 0.10 kJ · mol−1) [87]. Moreover, for the most
frequently studied by di�erent methods sample of [C2mim][NTf2] the spread of the
available data (Fig. 3.10) is too large for any reasonable interpretation of this results.
Therefore, taking into account the very good thermal stability of the [Cnmim][NTf2]
series and plethora of available experimental data for these ILs, they seems to be of
the �rst choice for TGA study in this work.
Figure 3.9: Experimental data for homologous series [Cnmim][NTf2] available in theliterature.
40

Figure 3.10: Enthalpy of vaporisation of [C2mim][NTf2] from di�erent techniques.
The general formula for the vaporization enthalpy calculations of ILs at 298 K is:
∆vapH298 =∑i
ni ·Hi +∑j
nj ·Hj (19)
where Hi is a contribution of the i -th element; ni is the number of elements of
the i -th type in the ionic liquid; Hj is a contribution of the j -th structural correction;
nj is the number of structural corrections of the j -th type in the ionic liquid. In the
simple case for the [C2mim][Et2SO4] (empirical formula C8H16N2SO4) the calculation
formula is:
∆vapH ([Cmmim][Et2SO4]) = 8 ·HC + 2 ·HN + 4 ·NO + 1 ·NS
Table 3.9: Vaporization enthalpies ∆vapH of ILs at 298 K - experiment and prediction.
Anion Cation Method ∆vapHexpT /T ,
kJ ·mol−1/K
∆vapHexp298
,
kJ ·mol−1
∆vapHpred298
a,
kJ ·mol−1
exp−pred,kJ ·mol−1
[C2mim] [Et2SO4] TPD MS [71] 145
±4.0/500
164
±4.0163.8 0.2
[C2mim] [NTf2] Knudsen [72] 118.8
±1.3/463
135.3
±1.3132.9 2.4
41
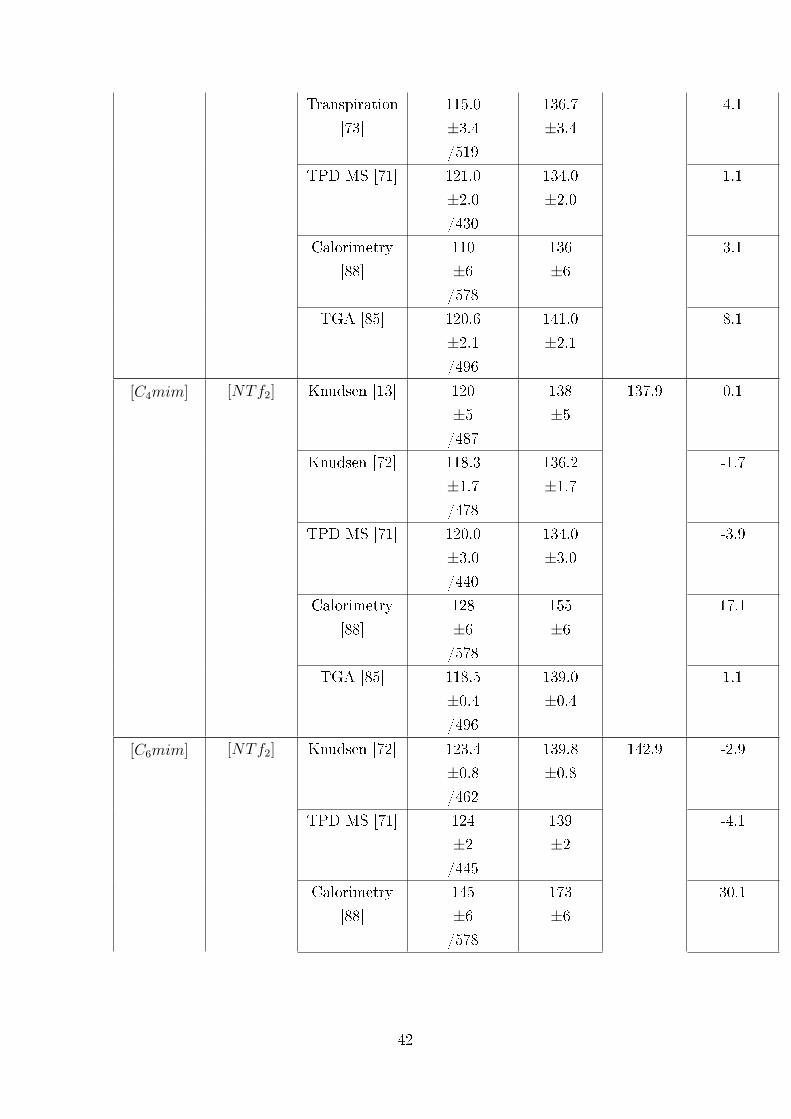
Transpiration
[73]
115.0
±3.4/519
136.7
±3.44.1
TPD MS [71] 121.0
±2.0/430
134.0
±2.01.1
Calorimetry
[88]
110
±6/578
136
±63.1
TGA [85] 120.6
±2.1/496
141.0
±2.18.1
[C4mim] [NTf2] Knudsen [13] 120
±5/487
138
±5137.9 0.1
Knudsen [72] 118.3
±1.7/478
136.2
±1.7-1.7
TPD MS [71] 120.0
±3.0/440
134.0
±3.0-3.9
Calorimetry
[88]
128
±6/578
155
±617.1
TGA [85] 118.5
±0.4/496
139.0
±0.41.1
[C6mim] [NTf2] Knudsen [72] 123.4
±0.8/462
139.8
±0.8142.9 -2.9
TPD MS [71] 124
±2/445
139
±2-4.1
Calorimetry
[88]
145
±6/578
173
±630.1
42

TGA [85] 124.1
±0.7/503
145.1
±0.72.2
[C7mim] [NTf2] Calorimetry
[88]
151
±6/578
180
±6145.4 34.6
[C8mim] [NTf2] Knudsen [72] 132.3
±0.8/475
150.0
±0.8147.9 2.1
TPD MS [71] 134
±2/450
149
±21.1
Calorimetry
[88]
163
±6/578
192
±644.1
TGA [85] 132.3
±0.5/503
153.3 5.4
[C10mim] [NTf2] TGA [85] 134.0
±2.3/510
153.0
±2.3152.9 0.1
[C2mim] [beti] TGA [85] 115.3
±1.8/503
136.3
±1.8192.7 -56.4
[C4mim] [beti] TGA [85] 114.4
±0.4/503
135.4
±0.4197.7 -62.3
[C6mim] [beti] TGA [85] 118.4
±1.6/503
139.4
±1.6202.7 -63.3
[C8mim] [beti] TGA [85] 125.0
±0.8/499
145.0
±0.8207.7 -62.7
[C10mim] [beti] TGA [85] 127.4
±3.7/510
148.4
±3.7212.7 -64.3
43
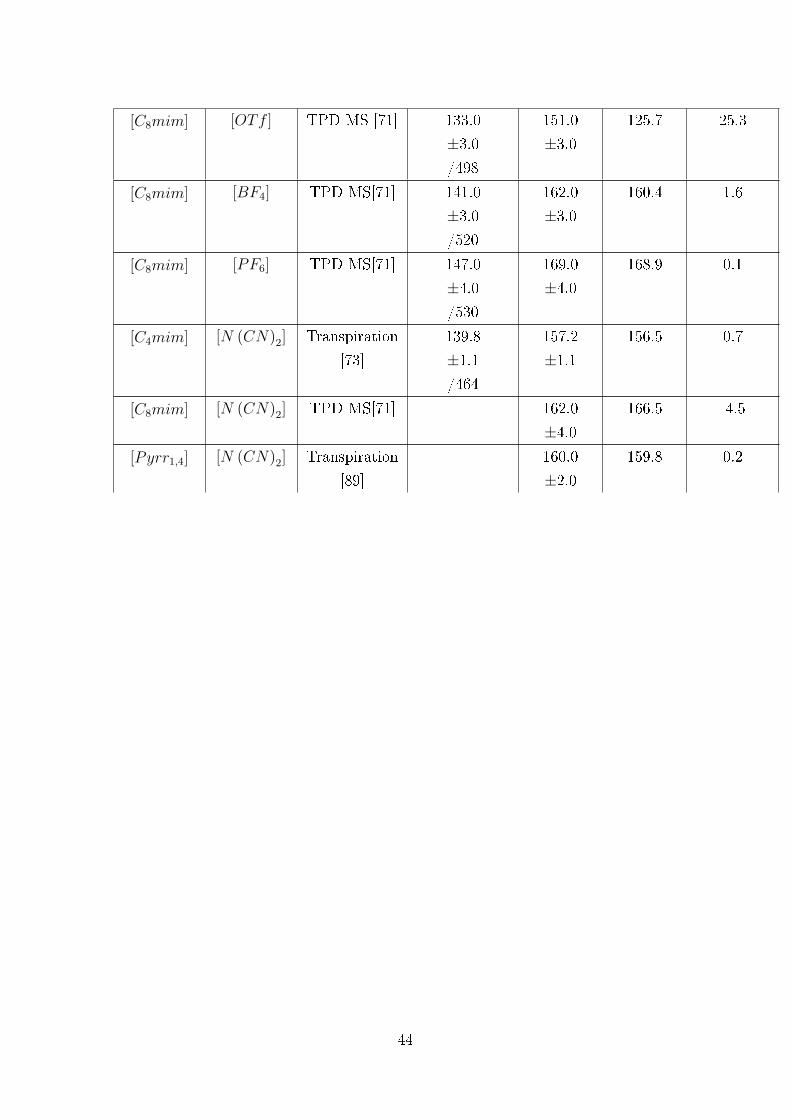
[C8mim] [OTf ] TPD MS [71] 133.0
±3.0/498
151.0
±3.0125.7 25.3
[C8mim] [BF4] TPD MS[71] 141.0
±3.0/520
162.0
±3.0160.4 1.6
[C8mim] [PF6] TPD MS[71] 147.0
±4.0/530
169.0
±4.0168.9 0.1
[C4mim] [N (CN)2] Transpiration
[73]
139.8
±1.1/464
157.2
±1.1156.5 0.7
[C8mim] [N (CN)2] TPD MS[71] 162.0
±4.0166.5 -4.5
[Pyrr1,4] [N (CN)2] Transpiration
[89]
160.0
±2.0159.8 0.2
44

Figure 3.11: Dependence of the enthalpy of vaporization for 1-alkyl-3-methylimidazolium bis (tri�uoromethanesulfonyl) imides at 542 K on the length ofthe cation alkyl chain
[Pyrr1,4] [PF3 (C2F5)3] TPD MS[90] 152.0
±4.0152.3 -0.3
[C2mim] [NO3] Transpiration[91] 168.4 164.7 4.6
[C4mim] [NO3] Transpiration[91] 167.6 169.7 -0.8
a - evaluated using equation (19)
Enthalpies of vaporization of ∆vapH for [Cnmim][NTf2] series measured using TGA
are given in Table 3.7. Most of these values were obtained at the average temperature
542 K. Any correlations at T = 542 K are preferable, because the enthalpies of vapor-
ization are less a�ected by temperature adjustment with the arbitrary heat capacity
di�erence values. In Fig. 3.11 the enthalpies of vaporization for [Cnmim][NTf2] at 542
K are correlated with the chain length of the cation. Except for [C12mim][NTf2], the
measured data are �tting well the expected linear correlation. However, the deviation
of the data for [C12mim][NTf2] is not signi�cant taking into account the boundaries
of the experimental uncertainties of other members of this homologous series.
As it has been mentioned above, the absolute vapor pressures for [Cnmim][NTf2]
was not the goal of this study. But it is interesting to compare the vaporization
rates for this series, because these parameters are actually �pressure-analogue� values
(P ∗). In Fig. 3.1214 these P ∗-values at 542 K are correlated with the chain length
in [Cnmim][NTf2] series. The vapor pressure analogue values P∗ for [C2mim][NTf2]
and [C4mim][NTf2] at 542 K are approximately equal (in agreement with the results
45

Figure 3.12: The dependence of the value analogue of vapor pressure for 1-alkyl-3-methylimidazolium bis (tri�uoromethanesulfonyl) imides from the length of the alkylchain
for these two ILs quartz crystal microbalance method [83]). The P ∗ values for ILs
with the longer chain show more or less linear behavior but again with the exception
for the data point [C12mim][NTf2]. This outlier demonstrates a crucial sensitivity
of the TGA conditions towards the absolute vapor pressure measurements. If for
vaporization enthalpy measurements the data point for [C12mim][NTf2] was still in
insigni�cant discrepancy (see Fig. 3.11), the deviation for the P ∗-values seems to be
already dramatic (see Fig. 3.12). For this reason the discussion of our results is focused
on vaporization enthalpies of ionic liquids.
Experimental results from TGAmeasurements for [Cnmim][NTf2] have been treated
with equation (18) and the resulting enthalpies of vaporization adjusted to the reference
temperature 298.15 K are given in Table 3.7 and in Fig. 21. For comparison, experimen-
tal ∆vapHo298 data for some molecular liquids (in homologous series) for alkyl benzenes
(CnH2n+1C6H5) [92], alkyl nitriles (CnH2n+1CN) [93] and alcohols (CnH2n+1OH) [94]
are also shown in Fig. 21. It is apparent that slopes for the molecular and ionic liquids
are quite similar and it means that contribution in the enthalpy of vaporization for the
extension with CH2 group (see Table 8) in ionic liquids is identical to those in molec-
ular liquids. Comparison of the CH2 increments to the enthalpy of vaporization of ILs
and molecular liquids is given in Table 8. The increment for CH2 group for molecular
liquids lies between 4.44 to 5.03 kJ ·mol−1. The CH2 increment for the enthalpy of
vaporization of [Cnmim][NTf2] series 4.2± 0.4 kJ ·mol−1 is somewhat lower but it is
hardly speci�c within the experimental uncertainties. According to the X-ray studies
of ILs liquid phase structure [95, 96] the ionic part and alkyl chain are separated, thus
the van der Waals interaction and Coulomb interaction are not distorted by each other.
46

Therefore, the CH2 increment in ILs should be close to that in the molecule where a
large functional group attached to the n-alkyl chain (e. g like alkyl benzenes). This
theoretical �nding is now proved by our experimental measurements (Table 3.11 and
Fig. ).
Figure 3.13: The enthalpies of vaporization for 1-alkyl-3-methylimidazoliumbis(tri�uoromethanesulfonyl)imides, alkyl benzenes, alkyl nitriles and alcohols at298.15 K.
Table 3.11: The values of the CH2 group increment into the enthalpy of vaporizationfor the di�erent classes of compounds.
Type of molecules Increment value of
∆vapH0298,
kJ ·mol−1
[Cnmim][NTf2] 4.2±0.4CnH2n+1CN 4.44±0.12[93]CnH2n+1OH 4.75±0.08[94]CnH2n+1C6H5 4.49±0.06[92]CnH2n+2 4.953[87]
CnH2n+1−CH2 = CH 4.972[87]
CnH2n+1SH 4.760[87]
CnH2n+1Cl 4.854[87]
CnH2n+1Br 4.803[87]
CnH2n+1 − CH =
CHCH3
5.029[87]
47

3.4.2 Validation of TGA vaporization enthalpies 1-alkyl-3-methylimidazolium
bis (tri�uoromethanesulfonyl) imides with Langmuir Quartz Microbal-
ance Method
Rebelo at al. [17] collected the available data for vaporization enthalpies of [Cnmim][NTf2]
series. Spread of these data is shown in Fig. 3.9. A new experimental technique
Quartz Microbalance Method (QCM) has been just recently established at University
of Rostock (Dr. Dz. H. Zaitsau, Prof. S.P. Verevkin) and this technique have been
purpose-built for studies of ILs. In short: evaporation of an IL sample into vacuum
is studied at several temperatures in an automatic Knudsen apparatus. In contrast
to the traditional Knudsen technique the evaporation occurs from the open surface of
the Knudsen cell and the Langmuir equation (3) is valid for such experimental con-
ditions. In order to measure the mass loss the quartz crystal microbalance (QCM) is
placed above the cell. The linear dependence between the resonance frequency change
and deposited mass has been established and used for measurements of vaporization
enthalpies.
New experimental data measured with this technique are collected in Tables 3.7
and 3.13. For comparison with these results we adjusted (using estimated according to
Eq. (16) enthalpies of vaporization measured by TGA to 380 K (see Table 3.7), where
the most reliable data for the [Cnmim][NTf2] series were measured using Langmuir-
QCM method recently. As can be seen from Table 3.7 the results from TGA and QCM
are in very good agreement taking into account the combined experimental uncertain-
ties. Only agreement for [C8mim][NTf2] is slightly worth in comparison to another
representatives from this series. In our opinion, comparison of the data derived from
di�erent methods is always favorable at the elevated temperature related to the average
temperature of experiment Tav. In this case the compared values are less a�ected by
extrapolation to the desired temperature. Extrapolation of the measured vaporization
enthalpies to the reference temperature is heavy aggravated with the ill de�ned values
as discussed above. In spite of this fact, the ∆vapH0298 data are highly desired for devel-
opment of MD simulations and �rst principles calculations. In this work we decided to
extrapolate the TGA and QCM measured vaporization enthalpies to the reference tem-
perature 298.15 K twofold: using the traditional way with the ∆gl cp = 100 J ·K−1 ·mol
in the Eq. (15) and the second way is extrapolation using the values obtained in this
work by data treatment with help of Eq. (18). Results are given in Table 3.13.
48

Table 3.13: Comparison of the data from TGA and QCM.
n in
[Cnmim]TGA QCM
∆vapH0298,
kJ ·mol−1
(∆gl cp = −100,
J ·K−1 ·mol−1)
∆vapH0298,
kJ ·K−1 ·mol−1
Tm, K ∆vapH Tm, K ∆vapH TGA QCM −∆gl cp TGA QCM
1 2 3 4 5 6 7 8 9 10
2 532.1110.6
±2.0378
118.6
±1.0
45.8
±5.7
120.8
±2.4
45.8
±5.7
120.8
±2.4
123.3
±1.1
4 542.4113.5
±2.0378
124.4
±1.0
65.7
±7.3
129.5
±2.7
65.7
±7.3
129.5
±2.7
129.6
±1.2
6 542.4118.0
±2.0383
131.6
±1.0
94.1
±9.5
140.9
±3.1
94.1
±9.5
140.9
±3.1
139.6
±1.3
8 542.5122.6
±2.0387
136.8
±1.0
125.0
±11.3
153.2
±3.4
125.0
±11.3
153.2
±3.4
147.9
±1.4
10 522.4125.2
±2.0394.6
142.5
±1.0
142.6
±15.7
157.1
±4.0
142.6
±15.7
157.1
±4.0
156.3
±1.8
12 532.1126.0
±2.0408.4
147.0
±1.0
159.6
±18.1
163.6
±4.7
159.6
±18.1
163.6
±4.7
164.6
±2.2
14 542.4132.7
±2.0416.2
152.5
±1.0
169.1
±20.4
173.9
±5.4
169.1
±20.4
173.9
±5.4
172.5
±2.6
16 542.5136.4
±2.0424.8
156.3
±1.0
175.6
±21.3
179.2
±6.0
175.6
±21.3
179.2
±6.0
178.5
±2.9
As it can be seen from Table 3.13, with the constant heat capacity di�erence
(∆gl cp = −100 J · K−1 · mol−1), the disagreement between QCM and TGA results
for all ILs sometimes exceed 10 kJ · mol−1 (see Table 3.13, column 6 and 7). How-
ever, the agreement of both data sets at 542 K and at 380 K has been just veri�ed
in Table 3.7. Following the large disagreement at 298.15 K between enthalpies of va-
porization derived from TGA and QCM is solely due to the fact that for ILs under
study is de�nitely not constant for the ILs with di�erent chain length. In contrast,
the values for [Cnmim][NTf2] derived in this work using Eq. (18) (Table 3.13, column
8) monotonically rise with the chain length. It is also apparent from the ∆vapH0298
data presented in columns 9 and 10 (Table 3.13) that agreement between enthalpies of
vaporization derived from TGA and QCM is in excellent agreement. Thus the values
of for [Cnmim][NTf2] (Table 3.13, column 8) could be recommended for re-calculation
49

of the available data for this homologues series.
3.4.3 TGA studies of 1-alkyl-3-methylimidazolium halides
Having established the express experimental TGA procedure, the most common
ILs [Cnmim][Cl] and [Cnmim][Br] have been studied using this method. Results are
given in Table 10.
It is well established, that thermal stability of imidazolium halides is substantially
lower. The expected decomposition temperature is of 546 K according to the litera-
ture [97]. Thus, our investigation was carried out at signi�cantly lower temperatures
in comparison to [Cnmim][NTf2] in order to exclude possible decomposition of the
samples.
Enthalpies of vaporization of 1-alkyl-3-methylimidazolium chlorides measured by
TGA (column 5, Table 3.15) are in a good agreement with the results obtained from
DSC studies (column 6, Table 3.15). At the same time, enthalpies of vaporization
of 1-alkyl-3-methylimidazolium bromides measured by TGA (column 5, Table 10) are
systematically lower in comparison to results obtained from DSC and QCM studies
(column 6, Table 3.15). However from the IR-ATR spectra for the [Cnmim][Br] was
apparent the decomposition of the sample during the TGA experiment. The typical
spectra for [C1mim][Br] is shown in Figure .
50

Table 3.15: The enthalpies of vaporization for 1-alkyl-3-methylimidazolium halides byTGA method.
Sample Tav, K∆vapH
0Tav
,
kJ ·mol−1
−∆gl cp
kJ ·mol−1 ·K−1
∆vapH0298,
kJ ·mol−1
TGA
∆vapH0298,
kJ ·mol−1
DSC/QCM
1 2 3 4 5 6
[C2mim][Cl] 432.4 136.5±1.8 92±10 148.8±2.2 140.8±5.0b
[C4mim][Cl] 432.4 137.2±0.9 122±16 153.6±2.3 152.4±3.0b
[C6mim][Cl] 432.4 147.5±1.3 128±16 164.7±2.5 160.0±2.8b
[C1mim][Br 442.1 118.5±1.2 68±8 128.3±1.7a 141.4±5.0b
[C2mim][Br] 432.4 117.1±1.8 96±10 129.9±2.2a 145.9±5.0b
[C4mim][Br] 432.4 118.1±1.8 111±13 133.0±2.5a 156.8±2.4b
159.0±3.0c
a Decomposition of sample was observedb Data from DSC measurements (Chapter 4.3.5, Table 16)c Data from Langmuir-QCM [83]
51
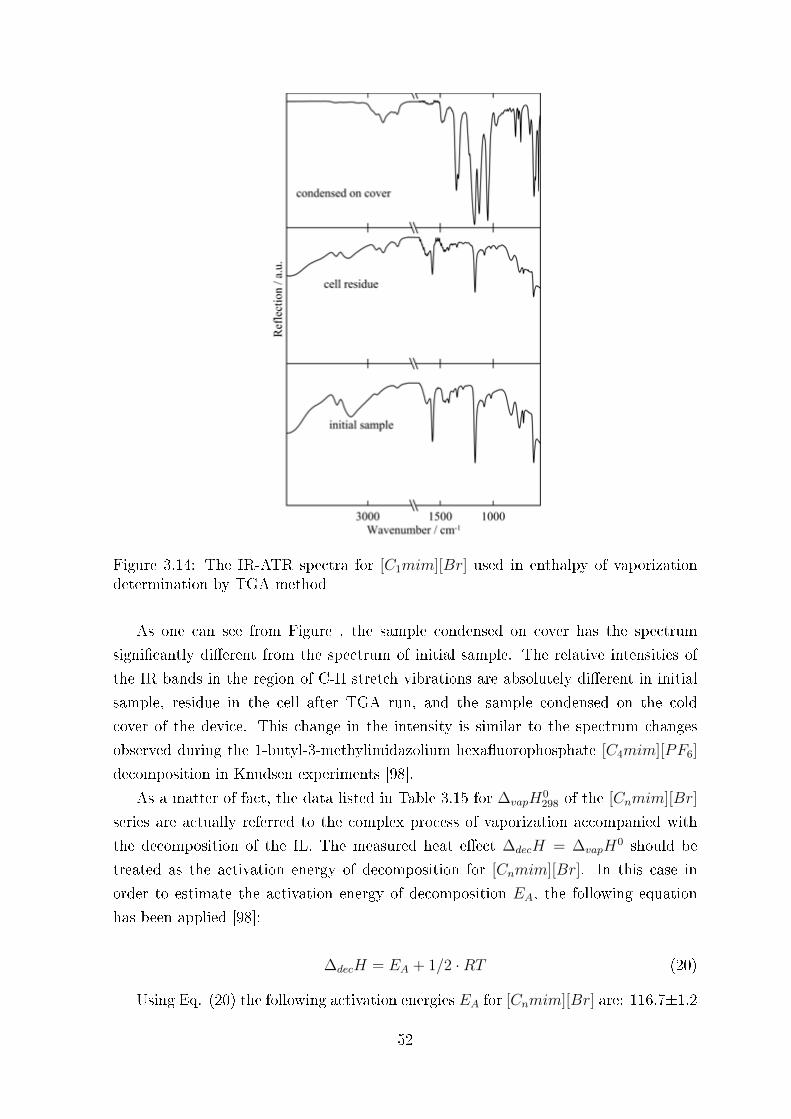
Figure 3.14: The IR-ATR spectra for [C1mim][Br] used in enthalpy of vaporizationdetermination by TGA method
As one can see from Figure , the sample condensed on cover has the spectrum
signi�cantly di�erent from the spectrum of initial sample. The relative intensities of
the IR bands in the region of C-H stretch vibrations are absolutely di�erent in initial
sample, residue in the cell after TGA run, and the sample condensed on the cold
cover of the device. This change in the intensity is similar to the spectrum changes
observed during the 1-butyl-3-methylimidazolium hexa�uorophosphate [C4mim][PF6]
decomposition in Knudsen experiments [98].
As a matter of fact, the data listed in Table 3.15 for ∆vapH0298 of the [Cnmim][Br]
series are actually referred to the complex process of vaporization accompanied with
the decomposition of the IL. The measured heat e�ect ∆decH = ∆vapH0 should be
treated as the activation energy of decomposition for [Cnmim][Br]. In this case in
order to estimate the activation energy of decomposition EA, the following equation
has been applied [98]:
∆decH = EA + 1/2 ·RT (20)
Using Eq. (20) the following activation energies EA for [Cnmim][Br] are: 116.7±1.2
52
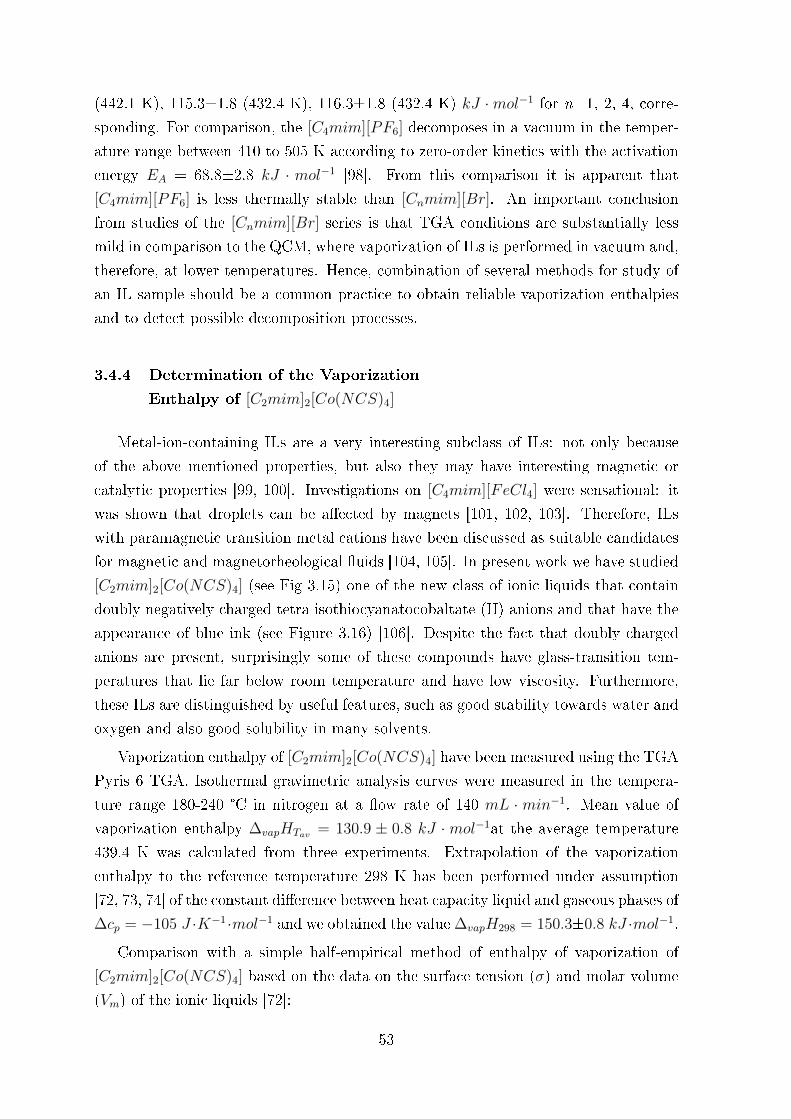
(442.1 K), 115.3±1.8 (432.4 K), 116.3±1.8 (432.4 K) kJ ·mol−1 for n=1, 2, 4, corre-
sponding. For comparison, the [C4mim][PF6] decomposes in a vacuum in the temper-
ature range between 410 to 505 K according to zero-order kinetics with the activation
energy EA = 68.8±2.8 kJ · mol−1 [98]. From this comparison it is apparent that
[C4mim][PF6] is less thermally stable than [Cnmim][Br]. An important conclusion
from studies of the [Cnmim][Br] series is that TGA conditions are substantially less
mild in comparison to the QCM, where vaporization of ILs is performed in vacuum and,
therefore, at lower temperatures. Hence, combination of several methods for study of
an IL sample should be a common practice to obtain reliable vaporization enthalpies
and to detect possible decomposition processes.
3.4.4 Determination of the Vaporization
Enthalpy of [C2mim]2[Co(NCS)4]
Metal-ion-containing ILs are a very interesting subclass of ILs: not only because
of the above mentioned properties, but also they may have interesting magnetic or
catalytic properties [99, 100]. Investigations on [C4mim][FeCl4] were sensational: it
was shown that droplets can be a�ected by magnets [101, 102, 103]. Therefore, ILs
with paramagnetic transition metal cations have been discussed as suitable candidates
for magnetic and magnetorheological �uids [104, 105]. In present work we have studied
[C2mim]2[Co(NCS)4] (see Fig 3.15) one of the new class of ionic liquids that contain
doubly negatively charged tetra isothiocyanatocobaltate (II) anions and that have the
appearance of blue ink (see Figure 3.16) [106]. Despite the fact that doubly charged
anions are present, surprisingly some of these compounds have glass-transition tem-
peratures that lie far below room temperature and have low viscosity. Furthermore,
these ILs are distinguished by useful features, such as good stability towards water and
oxygen and also good solubility in many solvents.
Vaporization enthalpy of [C2mim]2[Co(NCS)4] have been measured using the TGA
Pyris 6 TGA. Isothermal gravimetric analysis curves were measured in the tempera-
ture range 180-240 °C in nitrogen at a �ow rate of 140 mL · min−1. Mean value of
vaporization enthalpy ∆vapHTav = 130.9 ± 0.8 kJ · mol−1at the average temperature
439.4 K was calculated from three experiments. Extrapolation of the vaporization
enthalpy to the reference temperature 298 K has been performed under assumption
[72, 73, 74] of the constant di�erence between heat capacity liquid and gaseous phases of
∆cp = −105 J ·K−1·mol−1 and we obtained the value ∆vapH298 = 150.3±0.8 kJ ·mol−1.
Comparison with a simple half-empirical method of enthalpy of vaporization of
[C2mim]2[Co(NCS)4] based on the data on the surface tension (σ) and molar volume
(Vm) of the ionic liquids [72]:
53
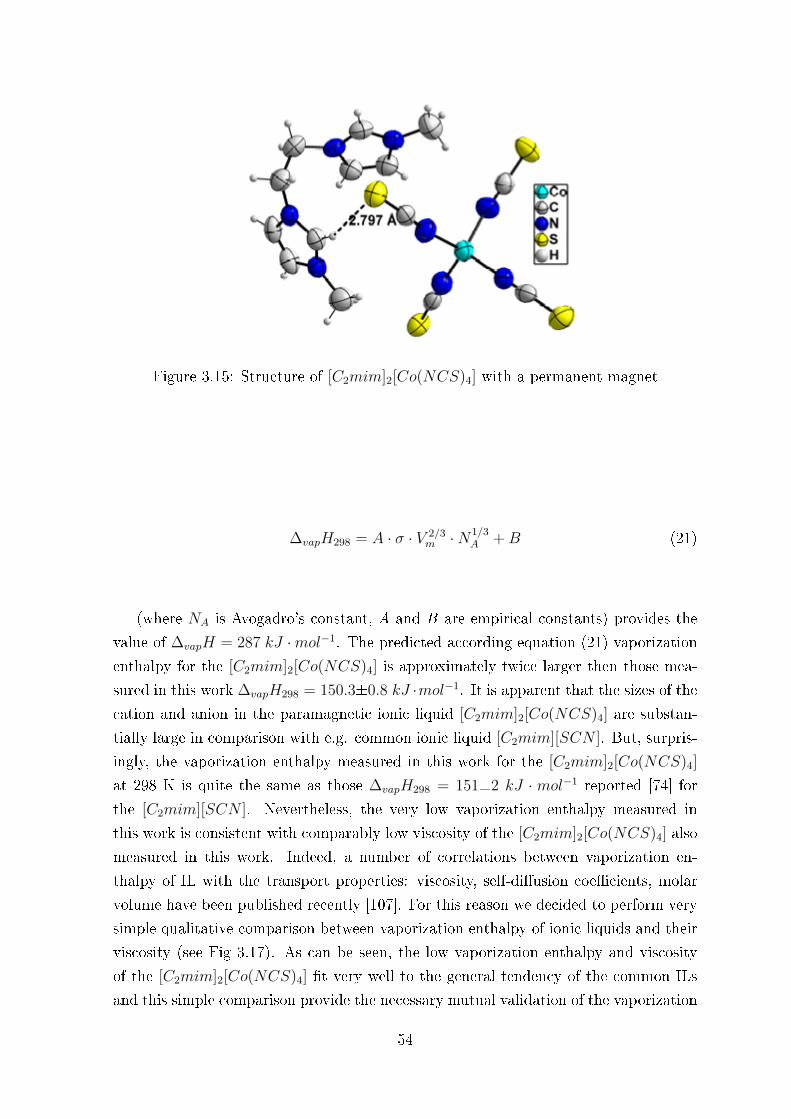
Figure 3.15: Structure of [C2mim]2[Co(NCS)4] with a permanent magnet
∆vapH298 = A · σ · V 2/3m ·N1/3
A +B (21)
(where NA is Avogadro's constant, A and B are empirical constants) provides the
value of ∆vapH = 287 kJ ·mol−1. The predicted according equation (21) vaporization
enthalpy for the [C2mim]2[Co(NCS)4] is approximately twice larger then those mea-
sured in this work ∆vapH298 = 150.3±0.8 kJ ·mol−1. It is apparent that the sizes of the
cation and anion in the paramagnetic ionic liquid [C2mim]2[Co(NCS)4] are substan-
tially large in comparison with e.g. common ionic liquid [C2mim][SCN ]. But, surpris-
ingly, the vaporization enthalpy measured in this work for the [C2mim]2[Co(NCS)4]
at 298 K is quite the same as those ∆vapH298 = 151±2 kJ · mol−1 reported [74] for
the [C2mim][SCN ]. Nevertheless, the very low vaporization enthalpy measured in
this work is consistent with comparably low viscosity of the [C2mim]2[Co(NCS)4] also
measured in this work. Indeed, a number of correlations between vaporization en-
thalpy of IL with the transport properties: viscosity, self-di�usion coe�cients, molar
volume have been published recently [107]. For this reason we decided to perform very
simple qualitative comparison between vaporization enthalpy of ionic liquids and their
viscosity (see Fig 3.17). As can be seen, the low vaporization enthalpy and viscosity
of the [C2mim]2[Co(NCS)4] �t very well to the general tendency of the common ILs
and this simple comparison provide the necessary mutual validation of the vaporization
54
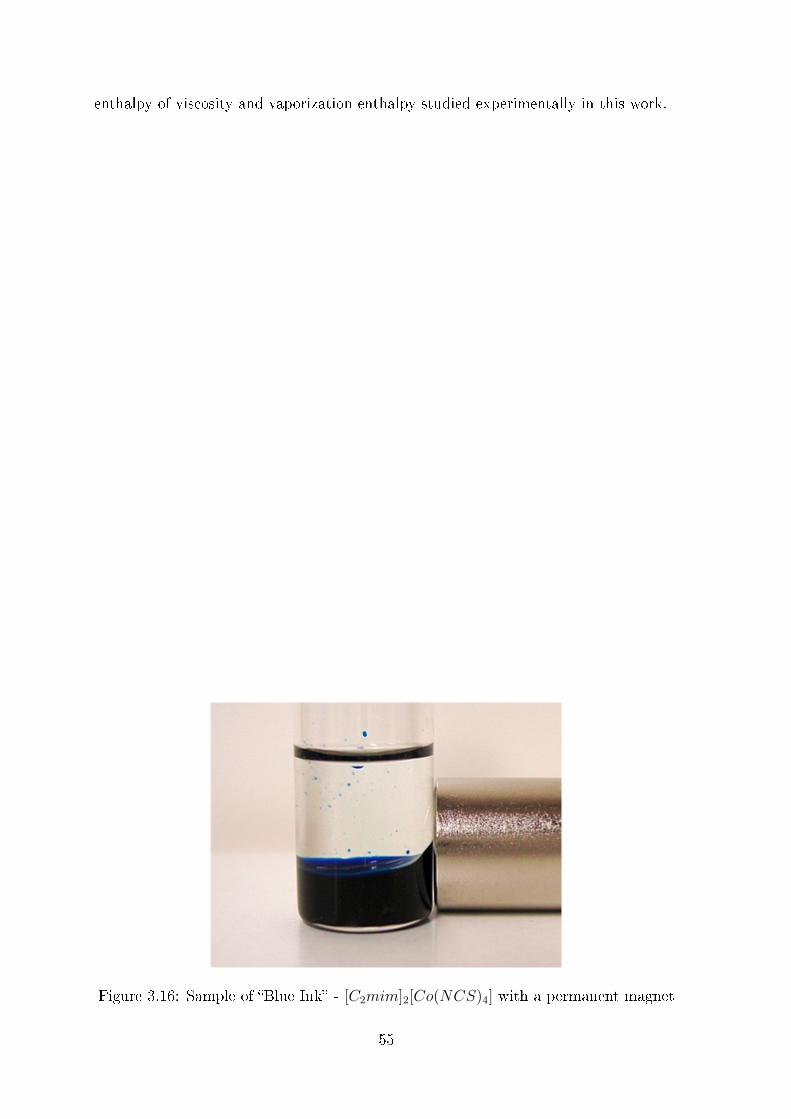
enthalpy of viscosity and vaporization enthalpy studied experimentally in this work.
Figure 3.16: Sample of �Blue Ink� - [C2mim]2[Co(NCS)4] with a permanent magnet
55

Figure 3.17: Correlation between viscosity of ionic liquids and their vaporization en-thalpies.# � common ionic liquids [Cnmim][NTf2] and [C8mim][BF4] and [C8mim][PF6]; � experimental result for vaporization enthalpy of [C2mim]2[Co(NCS)4]
a � vaporization enthalpy of [C2mim]2[Co(NCS)4] calculated according to equation(21)
3.4.5 TGA - outlook and conclusions
Having established the express experimental TGA procedure, an accumulation of
vaporization enthalpies of ILs of di�erent structures could be possible. Two main
structural ideas could be suggested for the future work. The �rst one is to �x an anion
of ILs under investigation constant and to study an in�uence of the alkyl chain length
of the imidazolium based [Cnmim]-cation. The second idea is to perform systematic
studies with the �xed 1-ethyl-3-methyl imidazolium cation ([C2mim]) and variation
of di�erent anions: [Et2SO4], [NTf2], [OTf ],[PF3 (C2F5)3], [BF4], [PF6], [N(CN)2],
[C(CN)3], and [SCN ]. In addition the following cations could be involved in the study:
[CnPy]; [C1,nPyrr]; [N (Cn)4].
We expect that not in all cases the thermal stability of ILs will allow to obtain the
vaporization enthalpy due to possible decomposition. This could be a good indicator
to exclude such an IL from studies by other methods, or may be it will even be a
56
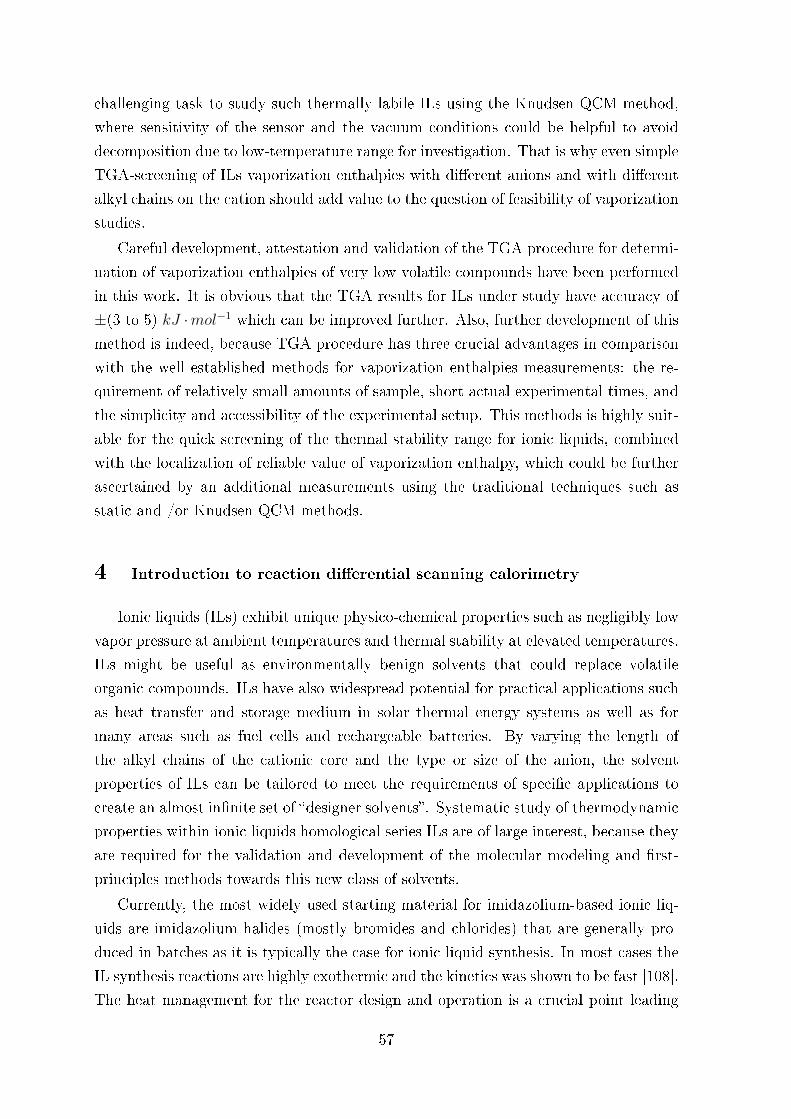
challenging task to study such thermally labile ILs using the Knudsen QCM method,
where sensitivity of the sensor and the vacuum conditions could be helpful to avoid
decomposition due to low-temperature range for investigation. That is why even simple
TGA-screening of ILs vaporization enthalpies with di�erent anions and with di�erent
alkyl chains on the cation should add value to the question of feasibility of vaporization
studies.
Careful development, attestation and validation of the TGA procedure for determi-
nation of vaporization enthalpies of very low volatile compounds have been performed
in this work. It is obvious that the TGA results for ILs under study have accuracy of
±(3 to 5) kJ ·mol−1 which can be improved further. Also, further development of this
method is indeed, because TGA procedure has three crucial advantages in comparison
with the well established methods for vaporization enthalpies measurements: the re-
quirement of relatively small amounts of sample, short actual experimental times, and
the simplicity and accessibility of the experimental setup. This methods is highly suit-
able for the quick screening of the thermal stability range for ionic liquids, combined
with the localization of reliable value of vaporization enthalpy, which could be further
ascertained by an additional measurements using the traditional techniques such as
static and /or Knudsen QCM methods.
4 Introduction to reaction di�erential scanning calorimetry
Ionic liquids (ILs) exhibit unique physico-chemical properties such as negligibly low
vapor pressure at ambient temperatures and thermal stability at elevated temperatures.
ILs might be useful as environmentally benign solvents that could replace volatile
organic compounds. ILs have also widespread potential for practical applications such
as heat transfer and storage medium in solar thermal energy systems as well as for
many areas such as fuel cells and rechargeable batteries. By varying the length of
the alkyl chains of the cationic core and the type or size of the anion, the solvent
properties of ILs can be tailored to meet the requirements of speci�c applications to
create an almost in�nite set of �designer solvents�. Systematic study of thermodynamic
properties within ionic liquids homological series ILs are of large interest, because they
are required for the validation and development of the molecular modeling and �rst-
principles methods towards this new class of solvents.
Currently, the most widely used starting material for imidazolium-based ionic liq-
uids are imidazolium halides (mostly bromides and chlorides) that are generally pro-
duced in batches as it is typically the case for ionic liquid synthesis. In most cases the
IL synthesis reactions are highly exothermic and the kinetics was shown to be fast [108].
The heat management for the reactor design and operation is a crucial point leading
57

to high quality of the resulting product and preventing of thermal runaway. Thus, a
systematic accumulation of the data on enthalpies of ILs synthesis reactions is appar-
ently required and di�erential scanning calorimetry (DSC) is a suitable experimental
tool for this purpose.
Di�erential scanning calorimetry (DSC) is broadly used for studies of heat capac-
ities, enthalpies of phase transition (glass transition, fusion, vaporization) etc. This
technique o�er important advantages, such as the small quantity of sample necessary
for the experiment (a few milligrams), handiness of manipulation, rapidity of perfor-
mance, versatility and precision of temperature control. DSC is also very useful in
the study of physicochemical processes, such as the determination of the kinetics and
thermodynamics of polymerization, due to the fact that these type of reactions are
exothermic and so they can be easily followed isothermally and dynamically by DSC.
This study reports an extention and development of DSC procedure for reliable mea-
surements of enthalpies of ILs synthesis reactions like the following:
1−MeIm (liq) + CnH2n+1 −Hal (liq) → [Cnmim][Hal] (liq) (22)
The thermodynamic properties of imidazolium, pyridinium and pyrrolidinium ILs
were derived from the experimental data.
4.1 Experimental section
4.1.1 Materials and chemicals
Samples of 1-methylimidazole (MeIm) and alkyl halides were of commercial origin
and they were were distilled under reduced pressure prior to use and stored under
dry nitrogen. The degree of purity was determined using a gas chromatograph (GC)
equipped with a �ame ionization detector. The carrier gas (nitrogen) �ow was 7.2
dm3 ·h−1. A capillary column HP-5 (stationary phase crosslinked 5% PH ME silicone)
was used with a column length of 30 m, an inside diameter of 0.32 mm, and a �lm
thickness of 0.25µm. The standard temperature program of the GC was T = 323
K for 180 s followed by heating to T = 523 K with the rate of 10 K · min−1. No
impurities (greater than 0.05 mass per cent) could be detected in the samples used for
the measurements.
4.1.2 Di�erential Scanning Calorimetry � Measurements of Reaction En-
thalpy
The general principle for the heat-�ux DSC-measurement of enthalpies of chemical
58
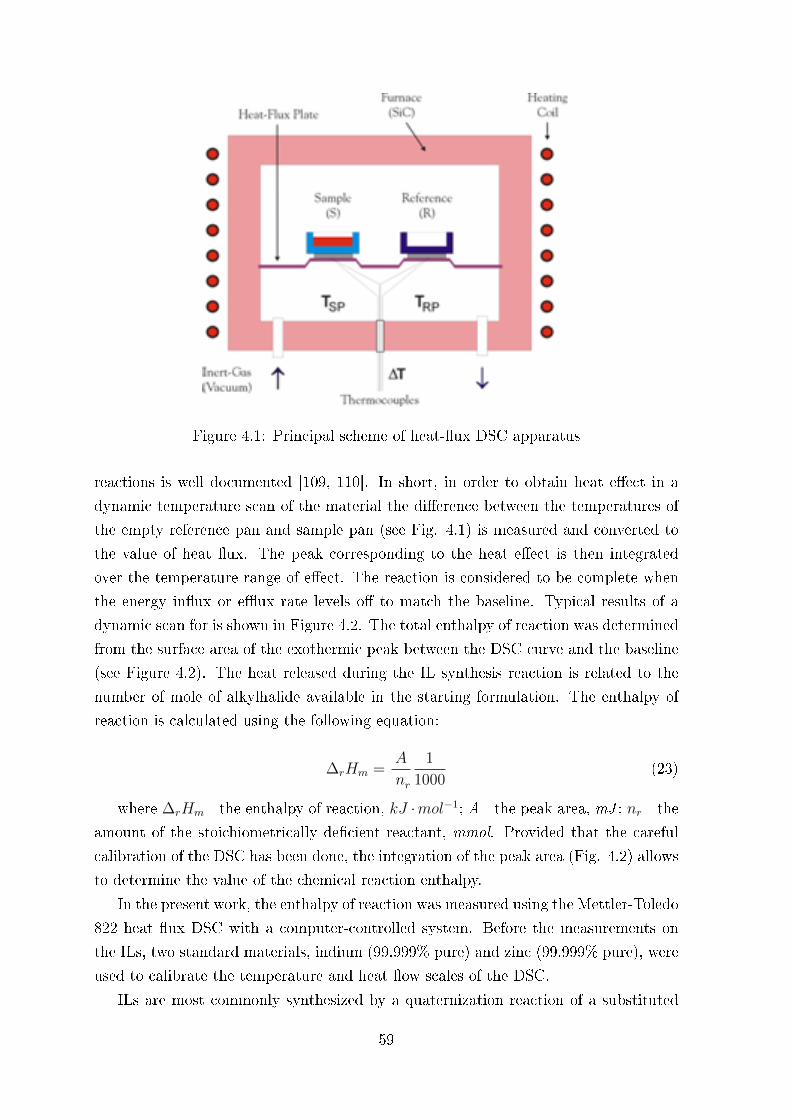
Figure 4.1: Principal scheme of heat-�ux DSC apparatus
reactions is well documented [109, 110]. In short, in order to obtain heat e�ect in a
dynamic temperature scan of the material the di�erence between the temperatures of
the empty reference pan and sample pan (see Fig. 4.1) is measured and converted to
the value of heat �ux. The peak corresponding to the heat e�ect is then integrated
over the temperature range of e�ect. The reaction is considered to be complete when
the energy in�ux or e�ux rate levels o� to match the baseline. Typical results of a
dynamic scan for is shown in Figure 4.2. The total enthalpy of reaction was determined
from the surface area of the exothermic peak between the DSC curve and the baseline
(see Figure 4.2). The heat released during the IL synthesis reaction is related to the
number of mole of alkylhalide available in the starting formulation. The enthalpy of
reaction is calculated using the following equation:
∆rHm =A
nr
1
1000(23)
where ∆rHm - the enthalpy of reaction, kJ ·mol−1; A - the peak area, mJ ; nr - the
amount of the stoichiometrically de�cient reactant, mmol. Provided that the careful
calibration of the DSC has been done, the integration of the peak area (Fig. 4.2) allows
to determine the value of the chemical reaction enthalpy.
In the present work, the enthalpy of reaction was measured using the Mettler-Toledo
822 heat �ux DSC with a computer-controlled system. Before the measurements on
the ILs, two standard materials, indium (99.999% pure) and zinc (99.999% pure), were
used to calibrate the temperature and heat �ow scales of the DSC.
ILs are most commonly synthesized by a quaternization reaction of a substituted
59
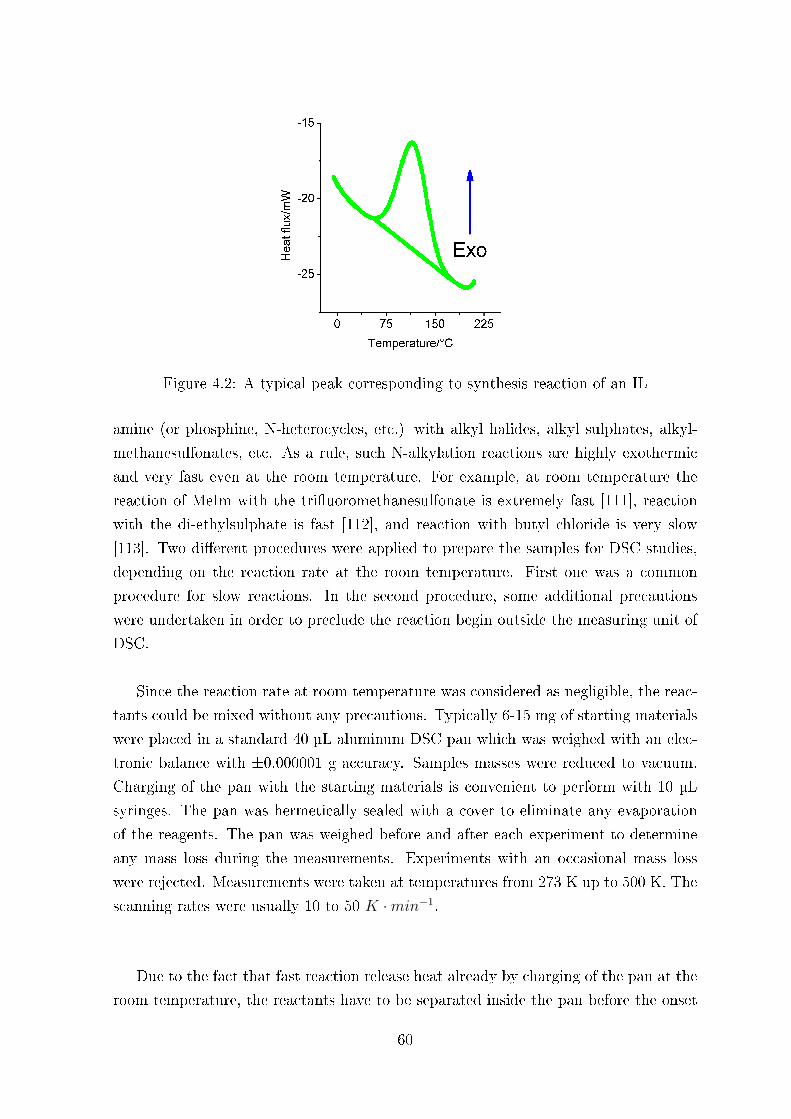
Figure 4.2: A typical peak corresponding to synthesis reaction of an IL
amine (or phosphine, N-heterocycles, etc.) with alkyl halides, alkyl sulphates, alkyl-
methanesulfonates, etc. As a rule, such N-alkylation reactions are highly exothermic
and very fast even at the room temperature. For example, at room temperature the
reaction of MeIm with the tri�uoromethanesulfonate is extremely fast [111], reaction
with the di-ethylsulphate is fast [112], and reaction with butyl chloride is very slow
[113]. Two di�erent procedures were applied to prepare the samples for DSC studies,
depending on the reaction rate at the room temperature. First one was a common
procedure for slow reactions. In the second procedure, some additional precautions
were undertaken in order to preclude the reaction begin outside the measuring unit of
DSC.
Since the reaction rate at room temperature was considered as negligible, the reac-
tants could be mixed without any precautions. Typically 6-15 mg of starting materials
were placed in a standard 40 µL aluminum DSC pan which was weighed with an elec-
tronic balance with ±0.000001 g accuracy. Samples masses were reduced to vacuum.
Charging of the pan with the starting materials is convenient to perform with 10 µL
syringes. The pan was hermetically sealed with a cover to eliminate any evaporation
of the reagents. The pan was weighed before and after each experiment to determine
any mass loss during the measurements. Experiments with an occasional mass loss
were rejected. Measurements were taken at temperatures from 273 K up to 500 K. The
scanning rates were usually 10 to 50 K ·min−1.
Due to the fact that fast reaction release heat already by charging of the pan at the
room temperature, the reactants have to be separated inside the pan before the onset
60

of the measurement. A separation membrane or any other mechanical facility is hardly
possible to install inside of the tiny (40 µL) aluminum pan. Separation of the reactants
in the pan with a wax ba�e has heavily aggravated the acquisition of the reaction peak
because of an additional fusion enthalpy of the wax. This idea was rejected. Instead, a
silicone oil have turned out to be a very practical for reactant separation. Indeed, the
silicone oil is chemically inert, termally stable and as a rule it has negligible miscibility
with chemicals common for ionic liquids synthesis. In addition, di�erent types of the
commercially available silicone oils have a broad variations of densities. Hence, it is
easy to �nd out a particular silicone oil with the density matching between values of
the two starting reactants. Thus, the separation of the reactants in the pan has been
adjusted according to the �sandwich� having more dense compound on the bottom
of the pan, the silicone oil layer in between, and the second reactant as an upper
layer. Heating of the pan inside of DSC leads to a thermal convection and provides an
intensive mixing of the reactants. In such a way, a controlled reaction start and heat
release have been achieved even for very fast reactions. Preliminary test runs with the
pan �lled only with the portion of one of reactant together with the silicone oil have
con�rmed absence of any detectable mixing e�ects, providing easy acquisition of the
reaction peak without taking into account additional heat e�ects. Thus, the reaction
enthalpy (∆rHm) was determined by integration of the experimentally obtained heat
�ux signal assuming heat e�ects due to mixing negligible.
For some reactions which slowly start already at room temperature, the reactants
could be diluted with the �nal product to slow down the reaction rate and to avoid an
uncontrolled transformation within the stabilization period of the DSC.
Commonly, the quaternization reactions are carried out in the batch reactors. Or-
ganic solvents (e.g. toluene, ethanol) have often been used for an improved heat re-
moval, increase safety of the process and obtain high quality IL. Many ILs or their
intermediates can often be quite viscous. By using a solvent, the product can be kept
in a relatively low viscosity liquid solution that can be more easily processed. [114].
However, solvent use leads to increased reaction times due to the dilution and requires
quantitative removal in an additional process step.
For our DSC studies use of the solvent has been of crucial importance. In the imi-
dazolium based reactions studied in this work the alkyl-halides were used as alkylating
agents. These substances possess very high volatility and the DSC experiments at
the neat conditions were hardly possible due to the risk of the pan explosion.Common
solvents mentioned above are as rule also volatile. In addition, it has been well es-
tablished, that e.g. for the synthesis of the ionic liquid 1-butyl-3-methylimidazolium
61

Figure 4.3: In�uence of the solvent ([C2mim][NTf2]) amount on the measured valueof enthalpy of formation reaction of [C4mim][Br]
chloride from (MeIm) and 1-chlorobutane already for a MeIm-conversion of 8%, neat
synthesis lead to two phases either rich in IL or 1-chlorobutane, whereby MeIm is sol-
uble in both phases. Only an addition of 20 vol.% of ethanol lead to a single-phase
synthesis [113]. Such a complex phase behavior during the DSC study could impact
the acquisition of the reaction peak. To overcome these two problems, a very low
volatile solvent, which is miscible with the reactants and the resulting ionic liquid is
required. It has turned out that the most suitable solvent for the the imidazolium
based ILs studied in this work was another ionic liquid - 1-ethyl-3-methylimidazolium
bis-(tri�uoromethylsulfono) imide ([C2mim][NTf2]) (99.9%, Iolitec). This solvent was
ideal to the decrease the total pressure in the reacting system. It was miscible with
the precursors and resulting ILs. In addition, the [C2mim][NTf2] as the solvent was
very advantageous for a high conversion and selectivity of the MeIm alkylation with
alkyl-halides. We tested the in�uence of amount of [C2mim][NTf2] (between 10 wt%
and 70 wt%) on the reproducibility of the measured enthalpy of reaction (see Figures
and ) and selected to keep dilution of the reacting mixture on the optimal level of
above 50-70 wt.%.
Syntheses of ILs are usually performed in an excess of a highly volatile alkyltating
reagent in order to reach high degree of conversion and easily purify the prepared IL
by gentle heating of an IL in vacuum. However, sometimes reaction was performed
at the of MeIm to provide homogeneity of the reaction mixture at the end of the
experiment [115]. For our DSC studies of IL synthesis reactions the excess of the
volatile component is impractical, because it elevate overload pressure in the pan and
the pan usually explodes by heating. In contrast, at the excess of the substituted
amine, the pressure inside of the pan remains moderate and it keeps tight during the
62
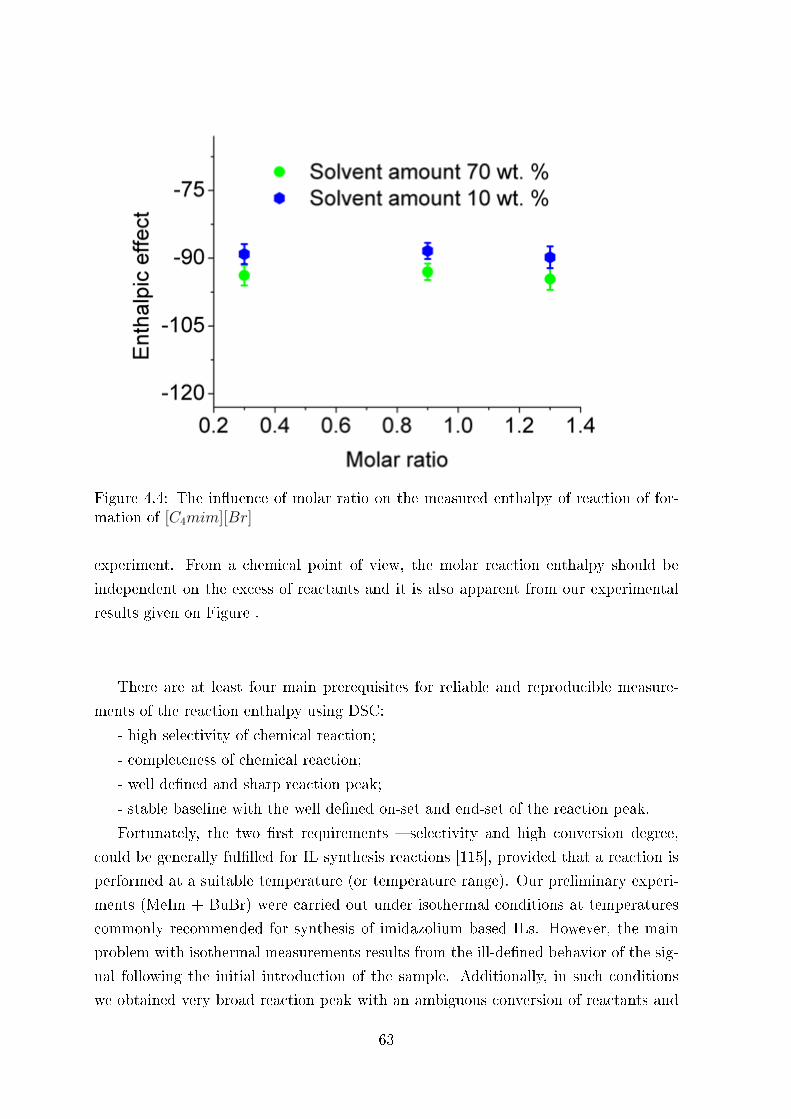
Figure 4.4: The in�uence of molar ratio on the measured enthalpy of reaction of for-mation of [C4mim][Br]
experiment. From a chemical point of view, the molar reaction enthalpy should be
independent on the excess of reactants and it is also apparent from our experimental
results given on Figure .
There are at least four main prerequisites for reliable and reproducible measure-
ments of the reaction enthalpy using DSC:
- high selectivity of chemical reaction;
- completeness of chemical reaction;
- well de�ned and sharp reaction peak;
- stable baseline with the well de�ned on-set and end-set of the reaction peak.
Fortunately, the two �rst requirements � selectivity and high conversion degree,
could be generally ful�lled for IL synthesis reactions [115], provided that a reaction is
performed at a suitable temperature (or temperature range). Our preliminary experi-
ments (MeIm + BuBr) were carried out under isothermal conditions at temperatures
commonly recommended for synthesis of imidazolium based ILs. However, the main
problem with isothermal measurements results from the ill-de�ned behavior of the sig-
nal following the initial introduction of the sample. Additionally, in such conditions
we obtained very broad reaction peak with an ambiguous conversion of reactants and
63

Figure 4.5: The in�uence of the heating rate on the accuracy of measurement
unclear end-set. Thus, our futher experiments were performed under non-isothermal
conditions with the dynamic temperature ramp which provided the stable baseline of
the DSC-run. We have studied di�ered temperature ramps from of 5 to 50 K ·min−1
(see Figure ). It has turned out that the most reproducible results could be obtained
at scanning rates up 30 K · min−1. Thus, in this work the enthalpy measurements
were performed at 50 K · min−1 heating rate in the temperature range from room
temperature up to 530 K.
In general, the selection of the upper temperature of the DSC investigation depends
crucially on the thermal stability of ILs under study. For the reactions of imidazolium
based halides synthesis (reaction (22) we have deliberately set the end temperature
to 523 K in order to obtain the high level of conversion. But it should be mentioned
that this end-set temperature was well below the decomposition temperatures (around
560 K) of [Cnmim][Hal] [116, 117]. It is also obvious, that in studies of ILs where
decomposition is expected, the upper limit of the DSC study should be adjusted to the
lower value which have to be at least of 20-30 K below the decomposition temperature.
In general, the selection of the lowest temperature of the DSC investigation depends
on the reaction rate. As a rule, after beginning of the experiment the calorimeter needs
certain time to reach the steady state conditions and to stay in this state at least for
2 minutes. It is important that the on-set of the reaction peak is outside of this
equilibration period. If the reaction under study is too fast, the lowest temperature of
DSC could be selected below the room temperature.
In each experiment we have optimized the temperature range and the scanning
rate in order to achieve the maximal possible convertion of the precursor which was
64

in stoichiometric de�ciency. In order to check the completeness of the reaction, the
aluminum pan with the sample was taken from the DSC and cooled down to the
room temperature. After weighing of the pan, its top cover was punctured and the
pan was heated at 373-393 K in a special vaccum oven within several hours until the
constant mass was reached. In such conditions the IL and the silicone oil could not be
evaporated from the pan. Thus the mass loss from the pan was ascribed to the �rst of
the MeIm which was usually taken in excess. Having the record of masses before and
after experiment the degree of conversion was calculated according to material balance
account. As a rule, the level of conversion in all experiments was between 98% and
99% (with the estimated uncertainty of 0.5%). Small corrections for the incomplete
conversion have been taken into account for each reaction under study.
According to results of screening of experimental parameters which has been per-
formed in this work, the following optimal conditions for the DSC studies of the IL
synthesis reactions could be recommended:
- ratio of precursors (MeIm):(R-Cl) =1.0:0.3 mol/mol
- content of the solvent � about 70wt. %
- temperature range 25-250 °C
- heating rate 50 K ·min−1
In this conditions the sharp reaction peak with the well de�ned on-set, end-set and,
baseline could be achieved providing the completeness of chemical reaction.
As a matter of fact, the enthalpy of reaction ∆rHm obtained by integration of the
DSC peak is referred to the temperature between the on-set and end-set of the peak.
In most cases we observed the symmetrical types of reaction peaks and we could assign
the ∆rHm to the temperature of the peak maximum Tmax. To adjust the enthalpy
∆rHm to standard temperature Kirchgo�'s law was used:
∆rHm,298 = ∆rHm,T −∆rcp · (T − 298.15) (24)
where ∆rcp - change of heat capacity in the system equal to the di�erence of heat
capacity of the product (IL [Cnmim][Hal]) and the precursors. The values of heat
capacity change for several systems are collected in the Table 4.1.
4.1.3 Computations
Standard ab initio molecular orbital calculations were performed using the Gaussian
65
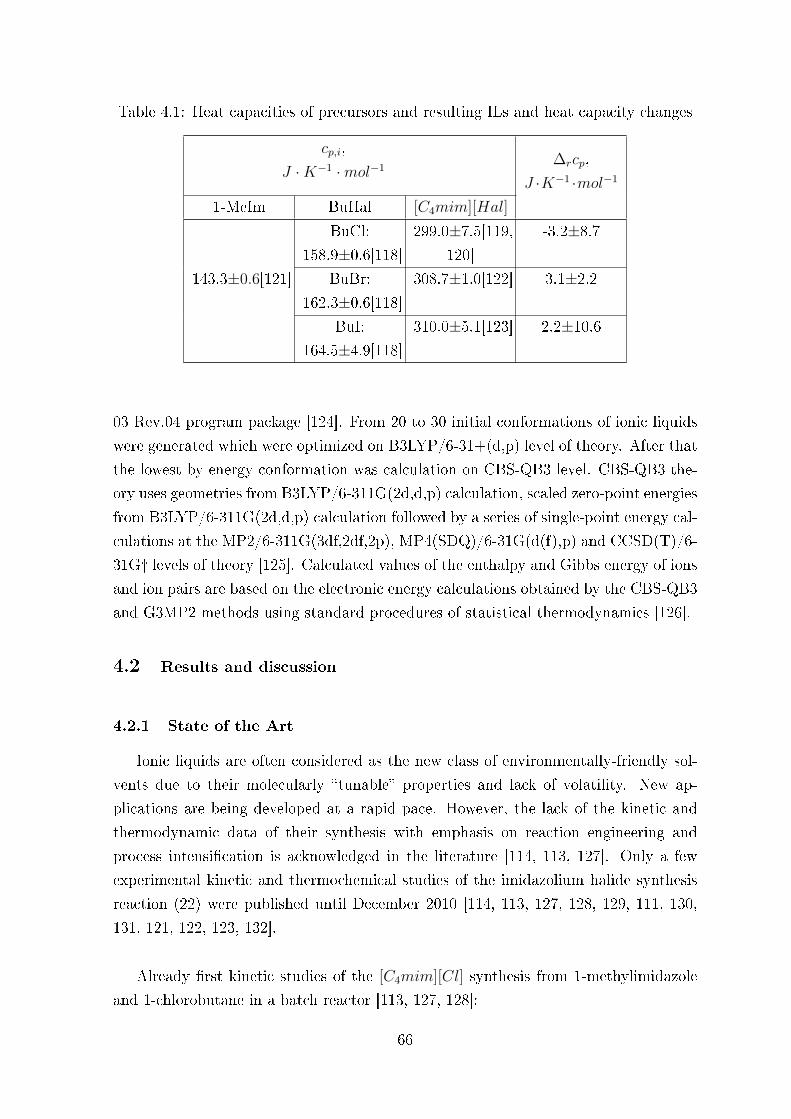
Table 4.1: Heat capacities of precursors and resulting ILs and heat capacity changes
cp,i,
J ·K−1 ·mol−1∆rcp,
J ·K−1 ·mol−1
1-MeIm BuHal [C4mim][Hal]
BuCl:
158.9±0.6[118]299.0±7.5[119,
120]
-3.2±8.7
143.3±0.6[121] BuBr:
162.3±0.6[118]308.7±1.0[122] 3.1±2.2
BuI:
164.5±4.9[118]310.0±5.1[123] 2.2±10.6
03 Rev.04 program package [124]. From 20 to 30 initial conformations of ionic liquids
were generated which were optimized on B3LYP/6-31+(d,p) level of theory. After that
the lowest by energy conformation was calculation on CBS-QB3 level. CBS-QB3 the-
ory uses geometries from B3LYP/6-311G(2d,d,p) calculation, scaled zero-point energies
from B3LYP/6-311G(2d,d,p) calculation followed by a series of single-point energy cal-
culations at the MP2/6-311G(3df,2df,2p), MP4(SDQ)/6-31G(d(f),p) and CCSD(T)/6-
31G� levels of theory [125]. Calculated values of the enthalpy and Gibbs energy of ions
and ion pairs are based on the electronic energy calculations obtained by the CBS-QB3
and G3MP2 methods using standard procedures of statistical thermodynamics [126].
4.2 Results and discussion
4.2.1 State of the Art
Ionic liquids are often considered as the new class of environmentally-friendly sol-
vents due to their molecularly �tunable� properties and lack of volatility. New ap-
plications are being developed at a rapid pace. However, the lack of the kinetic and
thermodynamic data of their synthesis with emphasis on reaction engineering and
process intensi�cation is acknowledged in the literature [114, 113, 127]. Only a few
experimental kinetic and thermochemical studies of the imidazolium halide synthesis
reaction (22) were published until December 2010 [114, 113, 127, 128, 129, 111, 130,
131, 121, 122, 123, 132].
Already �rst kinetic studies of the [C4mim][Cl] synthesis from 1-methylimidazole
and 1-chlorobutane in a batch reactor [113, 127, 128]:
66

1−MeIm (liq) + BuCl (liq) → [C4mim][Cl] (liq) (25)
have shown very complex phase behavior of the reaction participants in the course
of reaction [113]. With the MeIm-conversion >8%, neat synthesis lead to two phases
either rich in IL or 1-chlorobutane, whereby MeIm is soluble in both phases. Addition
of ethanol (>20 vol%) led to a single-phase synthesis and to an increase of the e�ective
rate constant of IL-formation. The reaction was very slow and at 343K about 50 h were
needed to reach 90% of MeIm conversion. However, an acceleration of the rate in the
neat conditions by increasing the temperature was limited, because of decomposition
of MeIm and contamination the IL. Dilution of the reacting system with ethanol as the
solvent, ensured a single-phase synthesis and improved the quality of the IL [113].
Schleicher and Scurto [114] performed extended kinetics and solvent e�ects stud-
ies in the synthesis of [C6mim][Br] in 10 di�erent solvents: acetone, acetonitrile, 2-
butanone, chlorobenzene, dichloromethane, dimethyl sulfoxide, ethyl formate, ethyl
lactate, methanol, and cyclopentanone.
First thermochemical study of the reaction 1 was published by Waterkamp et al.
[129]. Formation of [C4mim][Br] by reaction of MeIm and 1-bromobutane performed
with a reaction enthalpy of -96 kJ ·mol−1 at 338-358 K and 1-2 bar, but unfortunately,
no experimental details available in this work [129]. They also estimated the adiabatic
temperature for a run-away reaction for this system and suggested a way to intensify
the synthesis of [C4mim][Br] by using a continuously operating microreactor system.
Further very promising developments of heat pipe controlled syntheses of ionic liquids
in a microchannel reactors were reported by Löve et al. [111, 130, 131]. The enthalpy
of the [C4mim][Br] synthesis reaction:
1−MeIm (liq) + BuBr (liq) → [C4mim][Br] (liq) (26)
was determined in a an isoperibol calorimeter ∆rHm,298 = −(87.7 ± 1.6) kJ ·mol−1[121] This value is about 10 kJ ·mol−1 less negative than those by Waterkamp
et al. [129]. However it was mentioned that the enthalpy was determined in a series
of �ve experiments at 334 K. The reaction was performed at the 1.50-1.65 excess of
MeIm to provide homogeneity of the reaction mixture at the end of the experiment.
The degree of 1-bromobutane conversion at 334 K was only about 95%. In order to
obtain enthalpy of reaction according to Eq. 26, the authors [121] have been challenged
to take into account:
1. the enthalpy of mixing of 1-bromobutane with MeIm
2. the enthalpy of dissolution of [C4mim][Br] in IL + MeIm solution
67
3. the incomplete conversion of 1-bromobutane
4. the enthalpy of fusion of [C4mim][Br]
5. adjustment of the reaction enthalpy from 334 K to the reference temperature
298.15 K
The most important steps 1 and 2 were taken into account with a series of calorimetric
measurements on model mixtures [121]. The enthalpy of fusion of [C4mim][Br] was
obtained from adiabatic calorimetry [122]. Thus, the systematic study [121] of the
quaternization reaction according to the Eq 26 seems to provide more reliable value in
comparison to ambiguous documented value by Waterkamp et al. [129].
The same working group has recently applied the calorimetric procedures developed
in [121] for a determination the enthalpy of the [C4mim][I] synthesis reaction:
1−MeIm (liq) + BuI (liq) → [C4mim][I] (liq) (27)
in the isoperibol calorimeter. They obtained ∆rHm,298 = −(100.1±1.2) kJ ·mol−1
[123]. The enthalpy of this quaternization reaction was measured in a series of experi-
ments also at 334 K and at the 1.32 to 1.44 excess of MeIm. The measured value was
corrected for the side heat e�ects in the same way is it was described in [121] for the
reaction of [C4mim][Br] formation. The standard molar enthalpies of formation for
[C4mim][Br] and [C4mim][I] in the crystal and liquid states at T = 298.15 K were
determined in [121, 123] from the results for calorimerically measured ∆rHm,298.
ILs with anions containing chlorine or �uorine (e.g. [PF6]=, [AlCl4]
=) are problem-
atic with respect to corrosion and disposal. In homogeneous catalysis the free halogen
ions lead to deactivation. Therefore, halogen-free IL synthesis routes were meanwhile
developed. An example is the alkylation of methylimidazole with di-ethylsulfate to
ethylmethylimidazole di ethylsulfate ([C2mim][EtSO4]), which can be regarded as a
bulk IL and the source for various other ILs by subsequent acid-catalyzed transesteri�-
cation with alcohols [132]. Systematic kinetic studies on IL-synthesis according to Eq.
(28) were reported in [128, 132]
1−MeIm (liq) + Et2SO4 (liq) → [C2mim][EtSO4] (liq) (28)
Meanwhile synthesis of [C4mim][Cl] (see Eq. (25) shows phase separations in
solvent-free conditions, the synthesis of [C2mim][EtSO4] occurs in a mono phase [128].
Experimental enthalpy of reaction according to eq (28) ∆rHm,298 = −102 kJ ·mol−1
68

reported in [128] without any details and this value was used for simulation of heat
balance of tubular synthesis reactor. This work was extended and in [127] the ki-
netic studies on [C2mim][EtSO4]-synthesis were carried out in a continuous tubular
reactor. Both reactants were mixed at a low temperature (14°C) to avoid unwanted
pre-reactions and the experimental enthalpy of reaction, ∆rHm,298 = −102 kJ ·mol−1
was reported but again without any details [112]. Surprisingly, a signi�cantly higher
values of the reaction enthalpy (28) were given in a PhD-Thesis [127] coming from the
same working group [128, 112]. Results for ∆rHm,298 (according to Eq. 28) from three
experiments in an adiabatic reaction calorimeter (mixing of 5g MeIm and 5 g Et2SO4
) where given as follows : -173 kJ · mol−1, 148 kJ · mol−1, and 135 kJ · mol−1 with
the average value ∆rHm,298 = −152± 9 kJ ·mol−1. In addition, an enthalpy of forma-
tion of [C2mim][EtSO4] was measured in this work using the static-bomb calorimeter
Parr 1341. Only one combustion experiment with 0.5041 g of [C2mim][EtSO4] was
performed with the result of molar combustion enthalpy ∆cHm = −5103 kJ · mol−1
and the molar enthalpy of formation ∆cHm = −621.6 kJ ·mol−1. However it should
be mentioned, that as a rule the combustion experiments with the S-containing com-
pounds are performed with the rotating-bomb combustion calorimeter [133] and not
with the static bomb as reported in [127].
Renken et al. [108] has also reported kinetic studies and the use of a microstruc-
tured reactor system for the production of [C2mim][EtSO4] by a solvent-free alkylation
reaction. The reaction kinetics was studied by DSC at temperatures 293-443 K. Ex-
periments were carried out under isothermal as well as non-isothermal conditions by
imposing a well-de�ned temperature ramp to the samples. They observed that reac-
tion starts already at room temperature. Therefore, the reactants were diluted with
the �nal product to slow down the rate, thus reducing the error due to uncontrolled
transformation within the stabilization period of the DSC. The reaction enthalpy has
been determined from calorimetric experiments with reactants diluted with the �nal
product. A dilution of a factor 10 was found to be necessary to get reproducible results
of ∆rHm = −100± 2 kJ ·mol−1. This result is in line with published values [113] but
in the disagreement with results from adiabatic calorimetry [127].
Minnich et al. [134] combined reaction calorimetry with ATR-IR spectroscopic
monitoring of kinetic and thermodynamic of [C2mim][EtSO4] synthesis reaction. Semi-
batch solvent-free experiments were performed in a reaction calorimeter (Mettler Toledo)
under an inert atmosphere (argon) at 308 K. One reactant was charged to the reactor,
while the second was thermally pre-equilibrated and injected via a thermostated dos-
ing unit with slight overpressure of argon. Integration of the discrete heat �ow pulses
yielded the reaction enthalpies per injection. Values were correlated with the degree
of conversion that has been determined gravimetrically. Surprisingly, ∆rHm was not
69

independent from conversion. The absolute values of ∆rHm showed a systematic trend
with conversion including an increase to nearly the 1.5-fold of the starting exothermic-
ity and a decrease at conversions higher than 0.9. For the synthesis where MeIm was
charged and di-ethylsulfate was added, the range of the measured reaction enthalpies
was between -120 and -145 kJ · mol−1. For the synthesis where di-ethylsulfate was
charged and MeIm was added, the range of the measured reaction enthalpies was gen-
erally lower - between -85 and -140 kJ ·mol−1. The averaged molar reaction enthalpy
of the N-alkylation of 1-methylimidazole with di- ethylsulfate was found to be between
-123 and -130 kJ ·mol−1. This range of ∆rHm-values is apparently closer to the result
from adiabatic calorimetry [127].
To sum up: available in the literature calorimetric results for reaction enthalpies
of the IL synthesis reactions from precursors discussed in chapters 4.2.1.1 and 4.2.1.2
are in disarray. Complex phase behavior during the synthesis, large enthalpic e�ects
and divers reaction rates have hardly aggravated the reliability of the measured values.
Disagreement among data reported for the same reaction in literature sources some-
times exceed 50 kJ ·mol−1. Development of an accurate and reproducible calorimetric
procedure is highly desired.
4.2.2 Molar Enthalpies of Formation of ILs from DSC-Measurements
Di�erential scanning calorimetry (in comparison to the adiabatic reaction calorime-
try) is a simple and reliable experimental technique which allows examining thermal
properties of di�erent substances, among them are thermal e�ects of di�erent phase
transitions. Obviously the idea to apply DSC for the investigation of thermochem-
istry of ILs appears to be very attractive. The systematic study of parameters crucial
for the reliable DSC-experiment described in chapter 2 have demonstrated that DSC
could be successfully used to determine reaction enthalpies of the synthetic step of IL
from precursors. Certainly, these ∆rHm-values are practically important for the heat
management, assessment of thermal runaway and quality of product. However, at the
same time the ∆rHm results are also of theoretical value to derive molar enthalpies
of formation of ILs ∆rHm from DSC-Measurements. As it will be shown below, the
enthalpies of formation of ionic liquids in combination with the high-level ab initio
calculations open a new way to obtain enthalpies of vaporization of ILs [73, 135, 136].
Traditionally, the combustion calorimetry is used as the well established method to
provide enthalpies of formation [73]. However, this method is sophisticated and needs
extended experiences to obtain reliable results. Also this method has several shortages
and restrictions. The most crucial prerequisite for the combustion calorimetry is the
quality and amount of sample required for the study. In order to complete the exper-
70

iment successfully, about 10-20 g of highly pure (99.9%) sample are required. Such
amount of ILs is very expensive and also methods for purity attestations of the sam-
ple are still not su�ciently developed. Another issue � in order to get an acceptable
accuracy of the results (with an uncertainty of 1-3 kJ ·mol−1 in ∆rHm) the combus-
tion energy have to be measured with an error of 0.01-0.02%. Such result is already
achieved for C, H, O, and N containing compounds using the static bomb calorimeter
[73, 137]. For the ILs additionally containing Cl, Br, I, and S atoms, special procedure
with the rotating bomb calorimeter is required. This procedure has now succeeded for
the S-containing ILs [138] and further design for the Cl, Br, and I containing ILs is in
progress in our laboratory. In this context we put our e�orts for the development of
the new DSC based thermochemical option leading to the values of the enthalpies of
formation and futher, indirectly, to the vaporization enthalpies.
As a representative example, we consider once more the reaction according to Eq.
(25) to show the way how the enthalpy of reaction of synthesis of [C4mim][Cl] is used
to obtain its enthalpy of formation. According to the Hess Law the enthalpy of reaction
is calculated as follows:
∆rH0liq = ∆fH
0liq ([C4mim][Cl])−∆fH
0liq (MeIm)−∆fH
0liq (BuCl) (29)
where ∆rH0liq = − (78.7± 3.0) kJ · mol−1 was measured in this work using DSC
in the liquid phase; ∆fH0liq (MeIm) = (70.1± 1.0) kJ ·mol−1 [139]; ∆fH
0liq (BuCl) =
− (188.1± 1.2) kJ ·mol−1 [140].
From Eq. (29) the enthalpy of formation of the IL can be calculated:
∆fH0liq ([C4mim][Cl]) = −78.7 + 70.1− 188.2 = −196.7± 5.2 kJ ·mol−1
In the same way the enthalpies of formation of other ILs [Cnmim][Hal] were esti-
mated (see Table 4.5). These values can be used (with help of results from ab initio
calculations) to obtain the enthalpies of vaporization of these ILs indirectly (see Chap-
ter 3.3.1 ).
71

Table 4.3: Experimental results for measurements of reaction enthalpies ∆rH0liq using
DSC.
System (1) + (2) Molar ratio n2/n1 Solvent content, % wt. ∆rH0liq, kJ ·mol−1 Peak temperature, °C
Imidazolium
MeIm + BuCl 0.30 75 −78.7± 3.0 230±8MeIm + PenCl 0.25 75 −76.4± 3.0 225±6MeIm + HexCl 0.19 75 −77.4± 2.8 220±10MeIm + HepCl 0.17 80 −75.8± 3.4 220±5MeIm + OctCl 0.15 80 −78.0± 3.7 220±5MeIm + BuBr 0.40 70 −89.0± 1.5 175±5MeIm + PenBr 0.44 70 −94.6± 2.6 160±5MeIm + HexBr 0.32 70 −89.4± 3.1 160±2MeIm + HepBr 0.36 75 −87.5± 2.8 160±2MeIm + OctBr 0.30 75 −89.2± 3.2 185±5MeIm + BuI 0.67 0 −100.4± 0.9 135±2
MeIm + Et2SO4 1.38 85 −151.3± 1.5 140±5Pyridinium
Pyridine + BuBr 0.43 85 −87.3± 1.4 166±1Pyridine + PenBr 0.30 80 −87.1± 2.0 165±2Pyridine + HexBr 0.28 85 −87.5± 2.0 166±5Pyridine + HepBr 0.50 90 −87.4± 2.4 166±3Pyridine + OctBr 0.38 90 −87.3± 2.2 165±3
Pyrrolidinium
N-MePyrr + BuBr 0.43 95 −79.2± 1.9 117±3N-MePyrr + PenBr 0.43 95 −79.1± 2.0 120±4N-MePyrr + HexBr 0.53 95 −81.5± 2.0 118±2N-MePyrr+ HepBr 1.10 90 −77.7± 2.6 117±3N-MePyrr+ OctBr 1.51 95 −76.9± 2.4 118±4
72
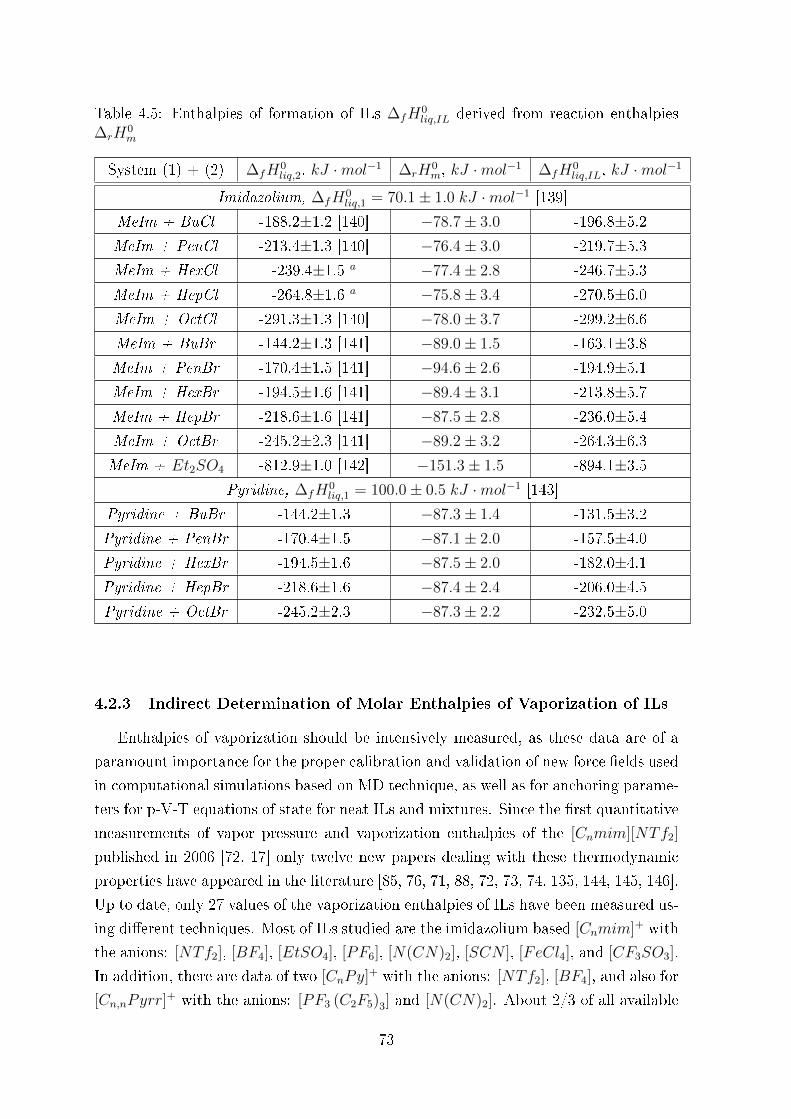
Table 4.5: Enthalpies of formation of ILs ∆fH0liq,IL derived from reaction enthalpies
∆rH0m
System (1) + (2) ∆fH0liq,2, kJ ·mol−1 ∆rH
0m, kJ ·mol−1 ∆fH
0liq,IL, kJ ·mol−1
Imidazolium, ∆fH0liq,1 = 70.1± 1.0 kJ ·mol−1 [139]
MeIm + BuCl -188.2±1.2 [140] −78.7± 3.0 -196.8±5.2MeIm + PenCl -213.4±1.3 [140] −76.4± 3.0 -219.7±5.3MeIm + HexCl -239.4±1.5 a −77.4± 2.8 -246.7±5.3MeIm + HepCl -264.8±1.6 a −75.8± 3.4 -270.5±6.0MeIm + OctCl -291.3±1.3 [140] −78.0± 3.7 -299.2±6.6MeIm + BuBr -144.2±1.3 [141] −89.0± 1.5 -163.1±3.8MeIm + PenBr -170.4±1.5 [141] −94.6± 2.6 -194.9±5.1MeIm + HexBr -194.5±1.6 [141] −89.4± 3.1 -213.8±5.7MeIm + HepBr -218.6±1.6 [141] −87.5± 2.8 -236.0±5.4MeIm + OctBr -245.2±2.3 [141] −89.2± 3.2 -264.3±6.3MeIm + Et2SO4 -812.9±1.0 [142] −151.3± 1.5 -894.1±3.5
Pyridine, ∆fH0liq,1 = 100.0± 0.5 kJ ·mol−1 [143]
Pyridine + BuBr -144.2±1.3 −87.3± 1.4 -131.5±3.2Pyridine + PenBr -170.4±1.5 −87.1± 2.0 -157.5±4.0Pyridine + HexBr -194.5±1.6 −87.5± 2.0 -182.0±4.1Pyridine + HepBr -218.6±1.6 −87.4± 2.4 -206.0±4.5Pyridine + OctBr -245.2±2.3 −87.3± 2.2 -232.5±5.0
4.2.3 Indirect Determination of Molar Enthalpies of Vaporization of ILs
Enthalpies of vaporization should be intensively measured, as these data are of a
paramount importance for the proper calibration and validation of new force �elds used
in computational simulations based on MD technique, as well as for anchoring parame-
ters for p-V-T equations of state for neat ILs and mixtures. Since the �rst quantitative
measurements of vapor pressure and vaporization enthalpies of the [Cnmim][NTf2]
published in 2006 [72, 17] only twelve new papers dealing with these thermodynamic
properties have appeared in the literature [85, 76, 71, 88, 72, 73, 74, 135, 144, 145, 146].
Up to date, only 27 values of the vaporization enthalpies of ILs have been measured us-
ing di�erent techniques. Most of ILs studied are the imidazolium based [Cnmim]+ with
the anions: [NTf2], [BF4], [EtSO4], [PF6], [N(CN)2], [SCN ], [FeCl4], and [CF3SO3].
In addition, there are data of two [CnPy]+ with the anions: [NTf2], [BF4], and also for
[Cn,nPyrr]+ with the anions: [PF3 (C2F5)3] and [N(CN)2]. About 2/3 of all available
73

data were measured using the temperature programmed desorption (TPD) combined
with mass spectrometry (MS) [76, 74, 145]. It should be mentioned, that this tech-
nique is quite new and has never been applied before for quantitative measurements of
vaporization enthalpies. Vaporization of IL from the open surface in a hot zone occurs
in this method. There are still some di�culties in the MS-signals interpretation [144]
and there are some uncertainties of data treatment according to the Langmuir open
surface vaporization procedure. In spite of these complications, the results from TPD
MS method are in very good agreement with the results from well established Knudsen
method [72] and transpiration method [135]. A similar idea as TPD MS have been
exploited recently: instead of the MS, the conjunction with single photon ionization by
a tunable vacuum ultraviolet synchrotron source have been used [146]. Apparently, due
to very sophisticated procedure of the data treatment, the uncertainties in vaporization
enthalpy associated with this method were on the level of ±12 kJ ·mol−1. Neverthe-
less, the available data on vaporization enthalpies of ILs are rather a mine�eld than
a consistent collection of data. For example, the data for the most frequently studied
homologues series of [Cnmim][NTf2] is presented on the Fig. 17. The disagreement
among results from di�erent techniques is typically on the level of 5-7 kJ ·mol−1, but
for the data from the direct drop-calorimetric study [88] disagreement reaches even 30-
40 kJ ·mol−1. This fact shows clearly the necessity of a more conclusive investigation
of the vaporization enthalpies of ILs using reliable experimental techniques. At the
same time, any indirect option for obtaining enthalpies of vaporization from empirical,
half-empirical or theoretical methods is of a grate value to provide consistency of the
data.
4.2.4 Vaporization Enthalpy from Enthalpies of Formation ∆fH0liq (IL)
One of the �rst indirect options to determine enthalpy of vaporization is the combi-
nation of combustion calorimetry with the high-level quantum chemical calculations. It
has turned out to be a valuable thermochemical option to derive vaporisation enthalpies
[73, 135, 136]. In the recent time we have developed a new alternative procedure to ob-
tain vaporisation enthalpies. This procedure is based on the experimental results from
combustion calorimetry and the �rst-principles calculations according to the general
equation:
∆fH0g = ∆fH
0liq + ∆vapH (30)
where ∆fH0liq - is measured using combustion calorimetry; ∆fH
0g - is calculated by
�rst-principles methods (e.g. G3MP2 method).
Enthalpy of vaporization of the IL can be evaluated from eq. (30):
74
∆vapH = ∆fH0g −∆fH
0liq (31)
A comprehensive studies of the thermochemical properties of [Cnmim][N(CN)2],
[Cnmim][NO3], and [C1,4Pyrr][N(CN)2] have been performed successfully for valida-
tion of this procedure [147, 73, 135, 136, 137, 138, 144].
In this work we have extended this procedure for combination of the high-level
quantum chemical calculations with the results from DSC to derive vaporisation en-
thalpies. This procedure is based on the experimental on ∆fH0liq (IL) from DSC and
the �rst-principles calculations according to the general equation. As an example � for
the ionic liquid [C4mim][Cl] using the following data: ∆fH0liq = −196.7±3.4 kJ ·mol−1
- is derived from DSC (see chapter 3.3.2); ∆fH0g = −43.5 kJ · mol−1 - is calculated
by �rst-principles method (CBS-QB3 method); the enthalpy of vaporization of the IL
could be estimated from eq. (31):
∆vapH = −43.5− (−196.7) = 153.2± 3.4 kJ ·mol−1 (32)
This indirect value is in a good agreement with the result ∆vapH = 153.5± 2.3 kJ ·mol−1 obtained from TGA (see Table 10). Values of ∆fH
0liq of ILs under study (see
Table 4.5) together with results from CBS-Q3B calculations have been used to obtain
the enthalpies of vaporization for these ILs indirectly (see Table 4.7).
4.2.5 Vaporization Enthalpy from DSC Enthalpies of Reaction, ∆rH0m
The indirect option to determine enthalpy of vaporization using Eq. (31) suggested
in 3.3.4 has one handicap: it is based on the value of the gaseous enthalpy of formation
∆fH0m,g which is evaluated using ab initio calculations. There are some ambiguities in
respect to procedures of converting results of �rst-principles calculations (total energies
E0 at T = 0 K and enthalpiesH298 at T = 298.15 K) into the desired value of ∆fH0m,g. It
is well established that in standard Gaussian-n theories, theoretical standard enthalpies
of formation ∆fH0m,g are calculated through atomization reactions, isodesmic and bond
separation reactions [148]. However, it has turned out [148, 149] that gaseous enthalpies
of formation calculated from the standard atomization procedure deviate very often
systematically from the available experimental results. The deviation could be positive
or negative, depending on the homologuous series under study [149]. It is also often
discussed, that the enthalpies of formation obtained from the �rst-principle calculations
are very sensitive for the choice of the bond separation or isodesmic reactions used for
this purpose [148]. The possible reasons are usually explained for di�erent quality of the
experimental data, involved in estimation, as well as a disbalance of electronic energies
calculated for the reaction participants. That is why we are somewhat reticent to use
75

of atomization reactions, isodesmic and bond separation reactions to obtain ∆fH0g of
ionic liquids. At the same time the logic of the DSC experiment lend itself an elegant
solution of the aforementioned problem. Indeed, using DSC we have measured the
experimental reaction enthalpy in the liquid phase e.g for [C4mim][Cl] according to
Eq. (25).
∆rH0exp,liq = ∆fH
0liq ([C4mim][Cl]) − ∆fH
0liq (MeIm) − ∆fH
0liq (BuCl) = −78.7 ±
3.0 kJ ·mol−1
The same reaction enthalpy, but in the gaseous phase could be obtained from the
�rst-principles calculation according to Eq. (33):
MeIm(g) + 1−BuCl(g)→ [C4mim][Cl](g) (33)
We have calculated using the CBS-Q3B the enthalpies H298 at T = 298.15 K for
all reaction participant of Eq. (33). According to the Hess Law the enthalpy of this
reaction is calculated as follows:
∆rH0g = H298,g ([C4mim][Cl])−H298,g (MeIm)−H298,g (BuCl) = −14.9 kJ ·mol−1
(34)
It is important to emphasize that the ∆rH0g is obtained using �rst principles directly
from the calculated H298 by-passing the conventional calculation of the enthalpies of
formation with help of atomization or isodesmic procedures. As a consequence of this
trick, the resulting value of ∆rH0g is not a�ected at all by choice and quality of auxiliary
quantities commonly required for atomization or bond separation reactions.
Having established the values of ∆rH0exp,liq and ∆rH
0g we have derived the vapori-
sation enthalpy (e.g for [C4mim][Cl]) provided that the following balance holds:
∆fH0liq = ∆fH
0g −∆vapH (35)
The enthalpy of reaction was calculated using the Hess Law:
∆rH0exp,liq = [∆fH
0g (IL)−∆vapH(IL)]−[∆fH
0g (MeIm)−∆vapH(MeIm)]−[∆fH
0g (BuCl)−∆vapH(BuCl)]
(36)
The enthalpy of vaporization of the IL has been obtained from the following equa-
tion:
∆vapH(IL) = −∆rH0exp,liq + ∆rH
0g + ∆vapH(MeIm) + ∆vapH(BuCl) (37)
With the following values of vaporisation enthalpies for reactants:
76

∆vapH(MeIm) = 55.1 ± 0.2 kJ ·mol−1 [139] and ∆vapH(BuCl) = 33.5 ± 0.1 kJ ·mol−1[150]
the equation (37) gives:
∆vap([C4mim][Cl]) = −(−78.7) + (−14.9) + 55.1 + 33.5 = 152.4± 3.3 kJ ·mol−1
So, using the value ∆rH0g calculated with CBS-Q3B in the gas phase and enthalpies
of vaporization of 1-Methyl-Imidazole and alkyl halides available from the literature
[139, 150], and the enthalpy of reaction ∆rH0exp,liq measured using DSC in the liquid
phase, the enthalpies of vaporization of the ILs under study have been derived (see
Table 16). For comparison, the value ∆vapH([C4mim][Br]) = 156.8 ± 2.4 kJ ·mol−1
has been determined from DSC (Table 16) being in a very good agreement with the
result from the Quartz-Crystal-Microbalance method [83]: ∆vapH([C4mim][Br]) =
157.9±3.0 kJ ·mol−1. This test result demonstrates in a convincing way the application
of the described DSC method to obtain vaporisation enthalpies of ILs �indirectly�.
Comparison of the vaporization enthalpies derived using two procedures: from Eq.
(31) and from Eq. (37) is given in Table 16. Both methods provide the values in a
close agreement, however we should recommend the Eq. (37) because the ∆rH0g for
this procedure have been calculated directly from the H298 avoiding the atomization
procedure.
77

Table 4.7: Comparison of vaporization enthalpies derived using Eq. (31) and Eq. (37)(in kJ ·mol−1).
IL ∆fH0liq,exp ∆fH
0g,CBS ∆vapH298,
from (31)
∆vapH298
from (37)
1 2 3 4 5
Clorides
[C1mim][Cl] -101.3 31.8 133.1 136.3
[C2mim][Cl] -138.7 0.4 139.1 140.8
[C3mim][Cl] -165.5 -22.9 142.6 144.7
[C4mim][Cl] -196.7 -43.5 153.2 152.4
[C5mim][Cl] -219.5 -63.9 155.6 154.5
[C6mim][Cl] -246.0 -84.1 161.9 160.0
[C7mim][Cl] -270.0 -105.4 164.6 161.8
[C8mim][Cl] -299.2 -126.9 172.3 167.2
Bromides
[C1mim][Br] -68.3 68.0 136.3 141.4
[C2mim][Br] -107.0 33.6 140.6 145.9
[C3mim][Br] -141.7 10.6 152.3 149.5
[C4mim][Br] -167.2 -10.5 156.8 156.8
[C5mim][Br] -194.7 -32.5 162.2 160.5
[C6mim][Br] -213.5 -51.5 162.0 161.2
[C7mim][Br] -235.8 -71.5 164.3 164.1
[C8mim][Br] -264.2 -91.6 172.6 170.8
4.3 Structure � property relationships for thermodynamic properties of
ionic liquids. Correlation with the number of C-atoms in the cation
alkyl chain
The physical and chemical properties of a compound are a function of its molecular
structure. Structure-property relationships are easy to follow for homologous series of
organic compounds. Thermodynamic properties (enthalpies of formation, enthalpies
of vaporization, etc.) have been often correlated with the chain length, retention in-
dices, topological indices, molecular descriptors [151]. A relationship, once quanti�ed,
can be used to estimate the properties of other molecules simply from their structures
and without the need for experimental determination or synthesis. This has resulted
78

in the development of quantitative structure-property relationships (QSPR) [152] or
group-additivity procedures [153, 154] as an important tool in chemical, biological,
and environmental research. Group-additivity (GA) methods are well recognized ap-
proaches to prove consistency of the experimental data on thermochemical properties
of molecular compounds [153, 154]. One of the best indicators of possible experimental
errors is a large deviation between experimental values and those calculated by GA
� especially if other, closely related compounds show no such discrepancy. The most
successful GA method for estimating of thermodynamic properties was suggested by
Benson [153, 154]. This method serves as a valuable tool for many scientists and engi-
neers whose work involves thermodynamic characterization of elementary and overall
reaction processes.
The correlations derived from experimental datasets can be used to predict the
physical properties of related molecules directly from from their modelled structures
[155]. When a structure-property relationship is found, it may also provide insight
into which aspect of the molecular structure in�uences the property. Such insight can
facilitate a systematic approach to the design of new molecules with more desirable
properties.
Unfortunately, for ionic liquids the available thermodynamic data are still scarce
and the possibilities for prediction these properties are very restricted yet [147, 137]. In
this context the structure � property relationships for thermodynamic results derived
in this work could serve ruther for testing of internal consistency of the data as well as
for validation of the DSC procedure developed in this work. There at least two obvious
ways to test the data for ILs for internal consistency.
A �rst one is a correlation of a thermodynamic property with the number
of C-atoms in the cation alkyl chain . For example for ILs of the general formula
[Cnmim][X], the thermodynamic property (vaporization enthalpy, formation enthalpy
etc.) is expected to increase monotonically in accordance with the increase in the
number CH2 groups of the cation alkyl chain.
The second way is only a modi�cation of the �rst way and it has been referred to
study of application of group-additivity rules for ILs . Are GA methods able
to predict thermochemical properties of ILs properly? Getting a de�nitive answer
to this question is di�cult. The available information is too limited for a quantitative
parametrization of any groups speci�c for ILs. A further question arises - is it generally
possible to transfer group contributions established for common organic compounds to
ionic liquids? Due to scarcity of the available data, only simple structural patterns
could be considered before the development of any kind of GA method. It has turned
out that the imidazolium based ionic liquids of general formula [Cnmim][Anion] with
n= 2 and 4 have been studied in the literature most frequently. We collected the
79
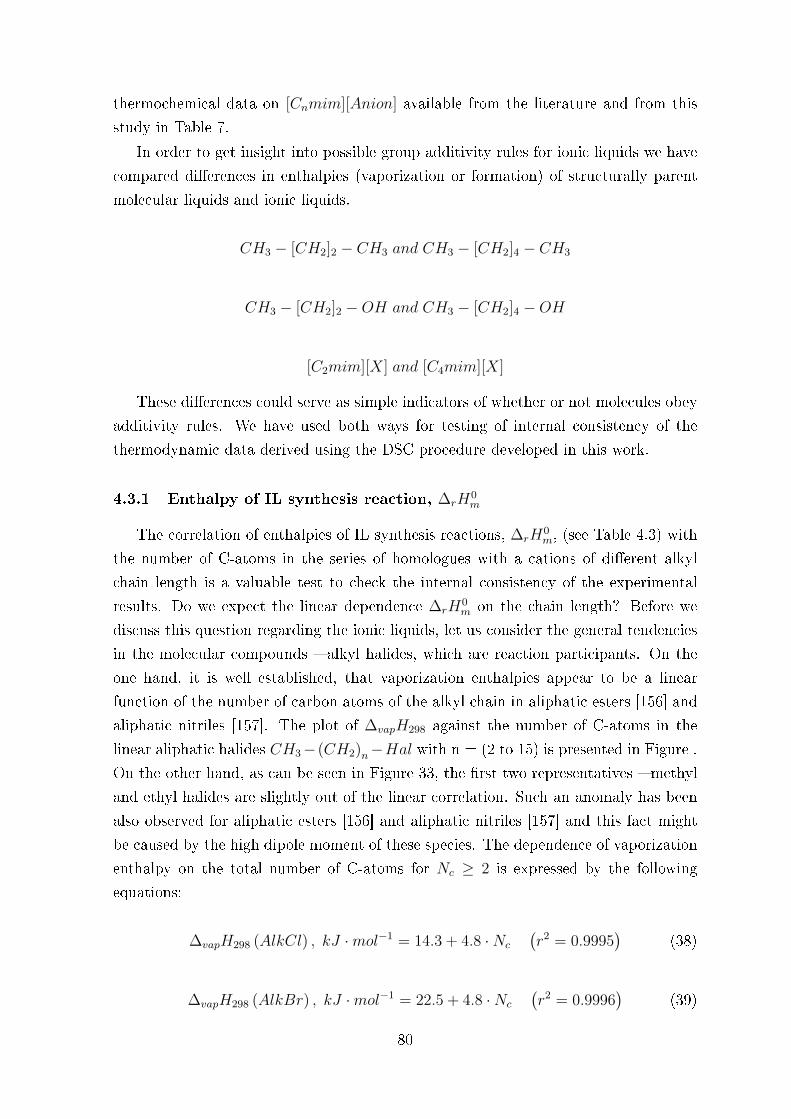
thermochemical data on [Cnmim][Anion] available from the literature and from this
study in Table 7.
In order to get insight into possible group additivity rules for ionic liquids we have
compared di�erences in enthalpies (vaporization or formation) of structurally parent
molecular liquids and ionic liquids.
CH3 − [CH2]2 − CH3 and CH3 − [CH2]4 − CH3
CH3 − [CH2]2 −OH and CH3 − [CH2]4 −OH
[C2mim][X] and [C4mim][X]
These di�erences could serve as simple indicators of whether or not molecules obey
additivity rules. We have used both ways for testing of internal consistency of the
thermodynamic data derived using the DSC procedure developed in this work.
4.3.1 Enthalpy of IL synthesis reaction, ∆rH0m
The correlation of enthalpies of IL synthesis reactions, ∆rH0m, (see Table 4.3) with
the number of C-atoms in the series of homologues with a cations of di�erent alkyl
chain length is a valuable test to check the internal consistency of the experimental
results. Do we expect the linear dependence ∆rH0m on the chain length? Before we
discuss this question regarding the ionic liquids, let us consider the general tendencies
in the molecular compounds � alkyl halides, which are reaction participants. On the
one hand, it is well established, that vaporization enthalpies appear to be a linear
function of the number of carbon atoms of the alkyl chain in aliphatic esters [156] and
aliphatic nitriles [157]. The plot of ∆vapH298 against the number of C-atoms in the
linear aliphatic halides CH3− (CH2)n−Hal with n = (2 to 15) is presented in Figure .
On the other hand, as can be seen in Figure 33, the �rst two representatives � methyl
and ethyl halides are slightly out of the linear correlation. Such an anomaly has been
also observed for aliphatic esters [156] and aliphatic nitriles [157] and this fact might
be caused by the high dipole moment of these species. The dependence of vaporization
enthalpy on the total number of C-atoms for Nc ≥ 2 is expressed by the following
equations:
∆vapH298 (AlkCl) , kJ ·mol−1 = 14.3 + 4.8 ·Nc
(r2 = 0.9995
)(38)
∆vapH298 (AlkBr) , kJ ·mol−1 = 22.5 + 4.8 ·Nc
(r2 = 0.9996
)(39)
80
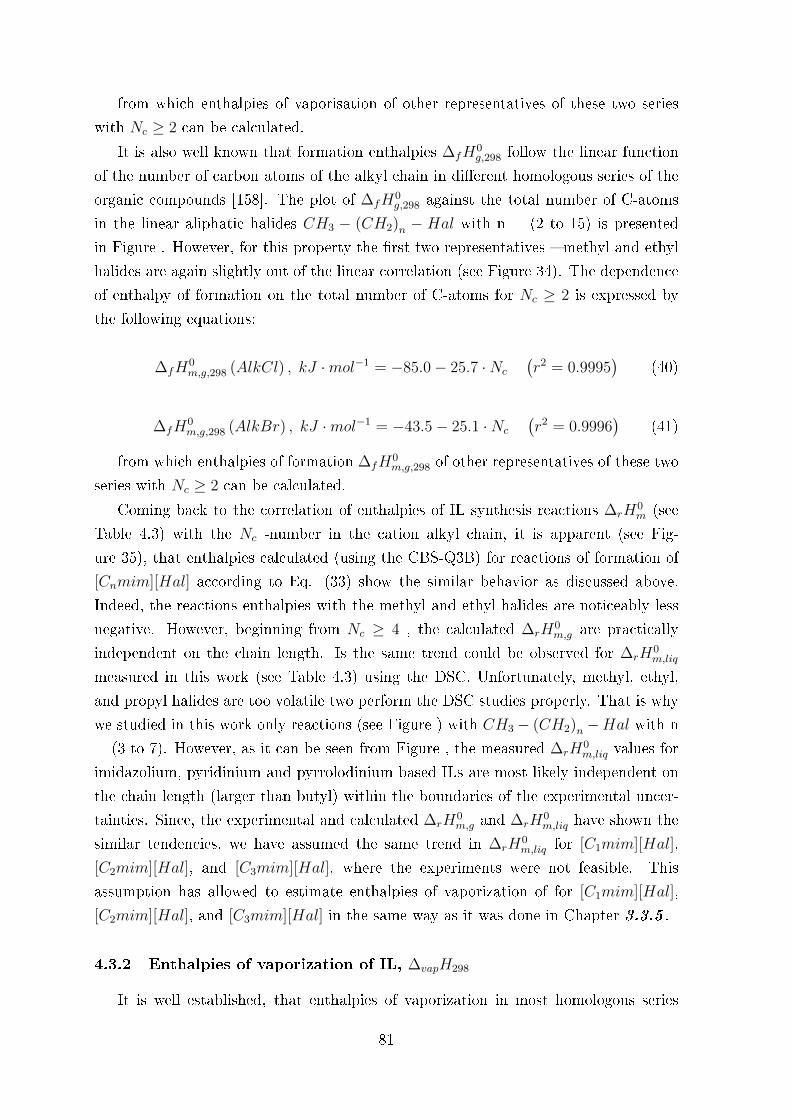
from which enthalpies of vaporisation of other representatives of these two series
with Nc ≥ 2 can be calculated.
It is also well known that formation enthalpies ∆fH0g,298 follow the linear function
of the number of carbon atoms of the alkyl chain in di�erent homologous series of the
organic compounds [158]. The plot of ∆fH0g,298 against the total number of C-atoms
in the linear aliphatic halides CH3 − (CH2)n − Hal with n = (2 to 15) is presented
in Figure . However, for this property the �rst two representatives � methyl and ethyl
halides are again slightly out of the linear correlation (see Figure 34). The dependence
of enthalpy of formation on the total number of C-atoms for Nc ≥ 2 is expressed by
the following equations:
∆fH0m,g,298 (AlkCl) , kJ ·mol−1 = −85.0− 25.7 ·Nc
(r2 = 0.9995
)(40)
∆fH0m,g,298 (AlkBr) , kJ ·mol−1 = −43.5− 25.1 ·Nc
(r2 = 0.9996
)(41)
from which enthalpies of formation ∆fH0m,g,298 of other representatives of these two
series with Nc ≥ 2 can be calculated.
Coming back to the correlation of enthalpies of IL synthesis reactions ∆rH0m (see
Table 4.3) with the Nc -number in the cation alkyl chain, it is apparent (see Fig-
ure 35), that enthalpies calculated (using the CBS-Q3B) for reactions of formation of
[Cnmim][Hal] according to Eq. (33) show the similar behavior as discussed above.
Indeed, the reactions enthalpies with the methyl and ethyl halides are noticeably less
negative. However, beginning from Nc ≥ 4 , the calculated ∆rH0m,g are practically
independent on the chain length. Is the same trend could be observed for ∆rH0m,liq
measured in this work (see Table 4.3) using the DSC. Unfortunately, methyl, ethyl,
and propyl halides are too volatile two perform the DSC studies properly. That is why
we studied in this work only reactions (see Figure ) with CH3 − (CH2)n −Hal with n
= (3 to 7). However, as it can be seen from Figure , the measured ∆rH0m,liq values for
imidazolium, pyridinium and pyrrolodinium based ILs are most likely independent on
the chain length (larger than butyl) within the boundaries of the experimental uncer-
tainties. Since, the experimental and calculated ∆rH0m,g and ∆rH
0m,liq have shown the
similar tendencies, we have assumed the same trend in ∆rH0m,liq for [C1mim][Hal],
[C2mim][Hal], and [C3mim][Hal], where the experiments were not feasible. This
assumption has allowed to estimate enthalpies of vaporization of for [C1mim][Hal],
[C2mim][Hal], and [C3mim][Hal] in the same way as it was done in Chapter 3.3.5 .
4.3.2 Enthalpies of vaporization of IL, ∆vapH298
It is well established, that enthalpies of vaporization in most homologous series
81
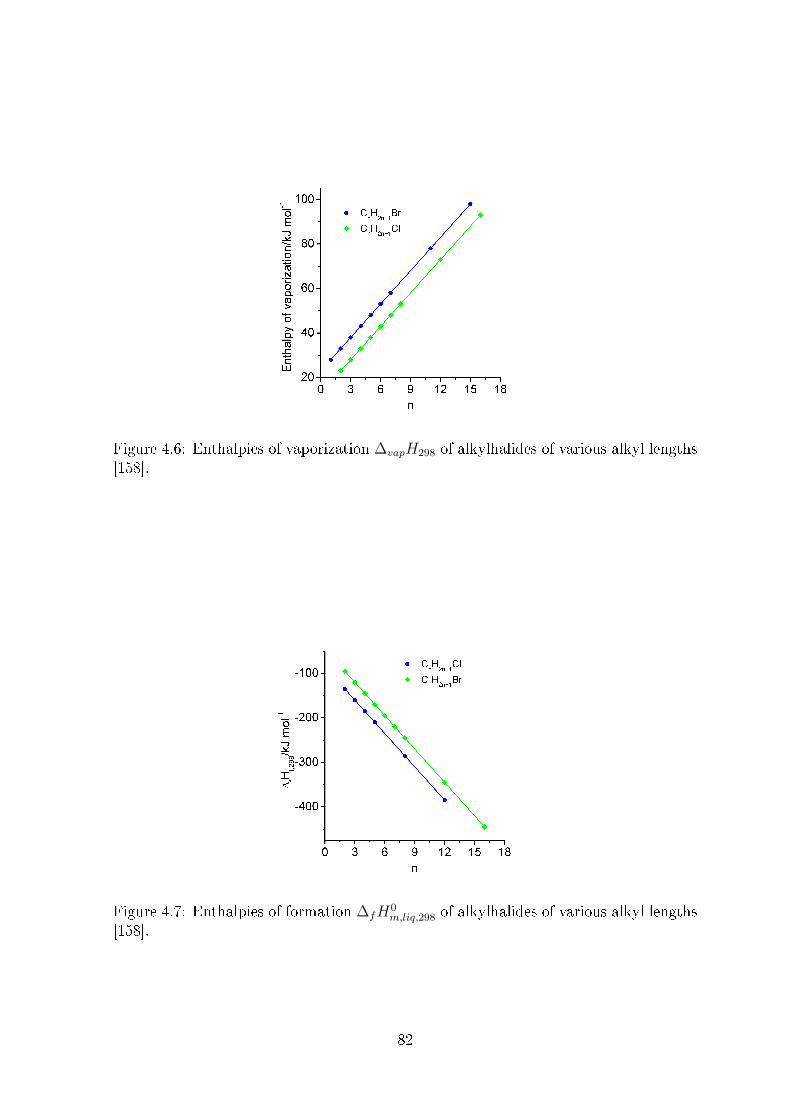
Figure 4.6: Enthalpies of vaporization ∆vapH298 of alkylhalides of various alkyl lengths[158].
Figure 4.7: Enthalpies of formation ∆fH0m,liq,298 of alkylhalides of various alkyl lengths
[158].
82

Figure 4.8: Enthalpies of reactions in liquid phase of 1-methylimidazole, pyridine, andN-methyl-pyrrolidine with alkylhalides of various alkyl lengths (Data from Table 4.3).
CnH2n+1 − R (alkanes [87], 1-substitued-alkanes [87], alcohols [159], esters [156], alde-
hydes [160] etc.) linearly correlate with the chain length Nc. Does enthalpy of vapor-
ization of ILs correlate with the number of C-atoms in the cation alkyl chain linearly
as it has been shown for vaporization enthalpies of alkyl halides in Chapter 3.4.1? The
answer on to this question is still evasive. For example, for ILs of the general formula
[Cnmim][NTf2] with n= 2, 4, 6, and 8, the vaporization enthalpy is expected to in-
crease monotonically from [C2mim][NTf2] to [C8mim][NTf2] in accordance with the
increase in the number of CH2 groups (the contribution to vaporization enthalpy of
5.0 kJ ·mol−1 per each CH2 group is typical for the n-alkane family [161]). However,
this is in disagreement with experimental observations available from the literature as
shown in Table 7. Indeed, the enthalpies of vaporization of the ethyl and the butyl
derivatives should be di�erent by about 10 kJ · mol−1, but they are hardly distin-
guishable within the boundaries of their experimental uncertainties. The enthalpy of
vaporization of the hexyl derivate is expected to be again by 10 kJ ·mol−1 larger than
those of the previous [C4mim][NTf2], however the experimental value is only slightly
larger (see Table 7). Only between [C6mim][NTf2] and [C8mim][NTf2] the assumed
contribution of 5.0 kJ · mol−1 per each CH2 group comes true �rst. The reason for
such an anomaly (or non-additivity) in the behavior of ILs could be due to interplay
of the van der Waals and Coulombic interactions. The increase of the van der Waals
interactions with the chain length (as observed for pure n-alkanes), assumed for the
ILs, is virtually impacted with the by electrostatic forces and the energy required for
the transfer of the contact ionic pair to the gaseous state [15].
Using the vaporization enthalpies of [Cnmim][Hal] estimated using the DSC (Table
4.7) we are able to add the value to the discussion of linearity of of these ILs. The
83
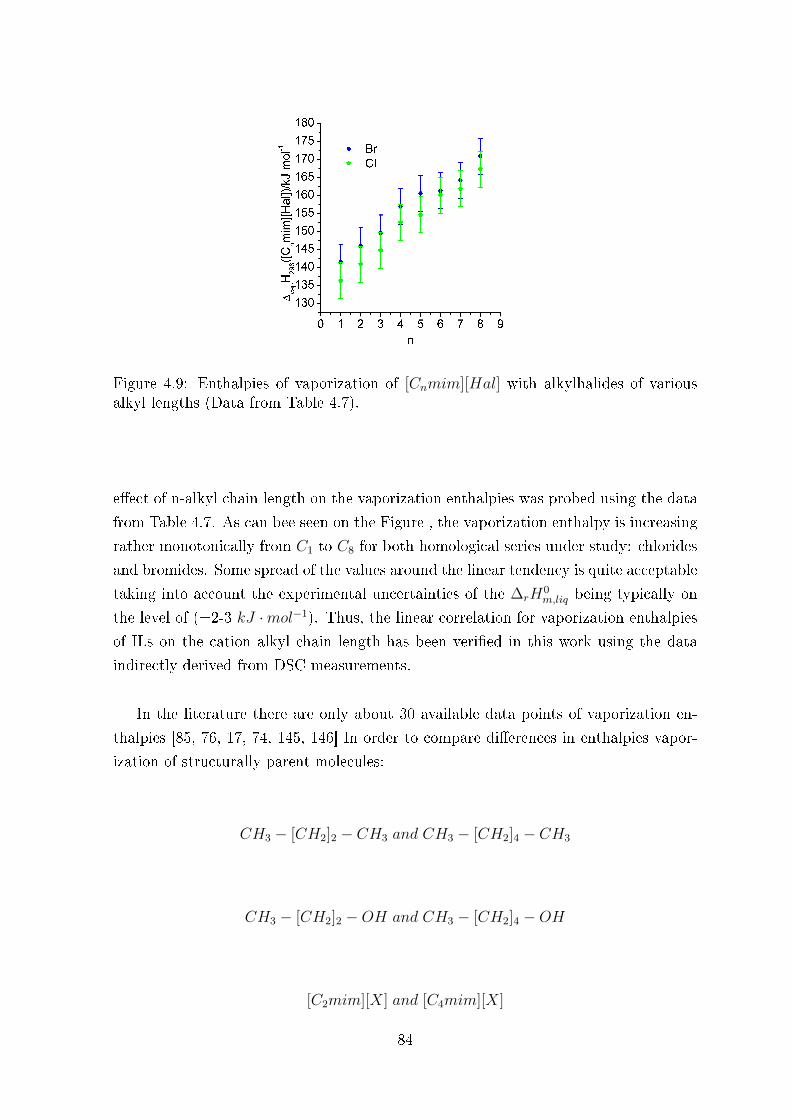
Figure 4.9: Enthalpies of vaporization of [Cnmim][Hal] with alkylhalides of variousalkyl lengths (Data from Table 4.7).
e�ect of n-alkyl chain length on the vaporization enthalpies was probed using the data
from Table 4.7. As can bee seen on the Figure , the vaporization enthalpy is increasing
rather monotonically from C1 to C8 for both homological series under study: chlorides
and bromides. Some spread of the values around the linear tendency is quite acceptable
taking into account the experimental uncertainties of the ∆rH0m,liq being typically on
the level of (±2-3 kJ ·mol−1). Thus, the linear correlation for vaporization enthalpies
of ILs on the cation alkyl chain length has been veri�ed in this work using the data
indirectly derived from DSC measurements.
In the literature there are only about 30 available data points of vaporization en-
thalpies [85, 76, 17, 74, 145, 146] In order to compare di�erences in enthalpies vapor-
ization of structurally parent molecules:
CH3 − [CH2]2 − CH3 and CH3 − [CH2]4 − CH3
CH3 − [CH2]2 −OH and CH3 − [CH2]4 −OH
[C2mim][X] and [C4mim][X]
84
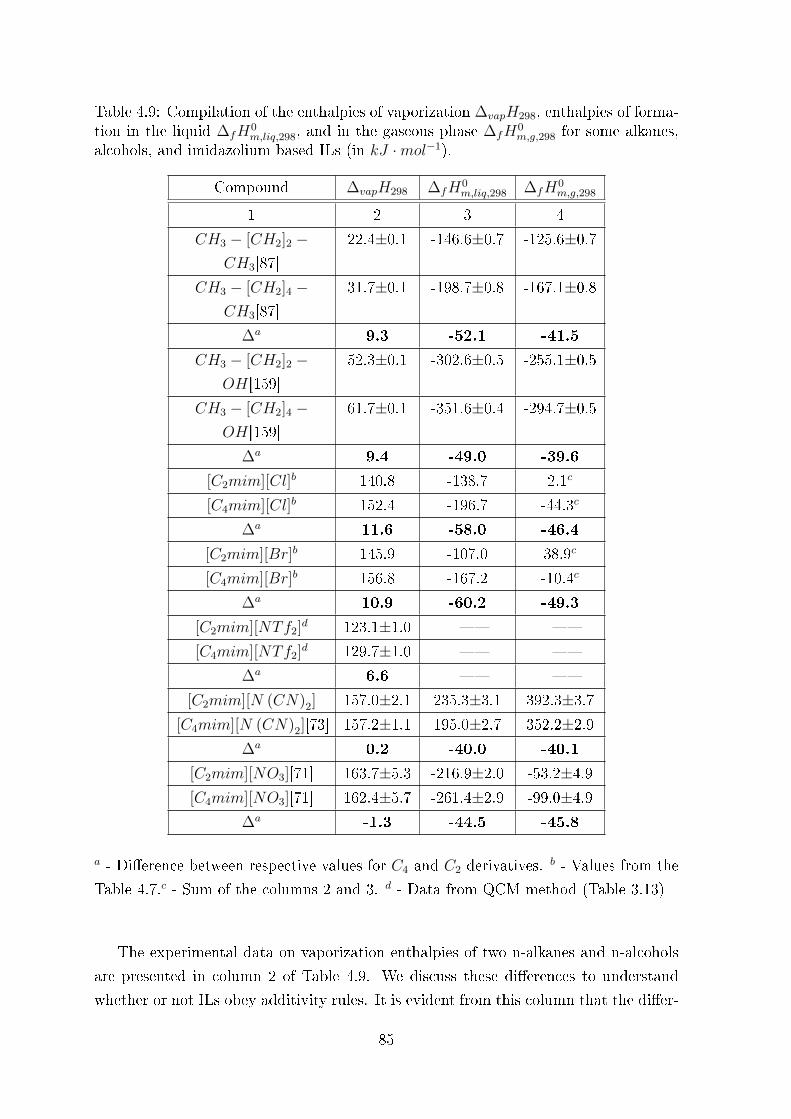
Table 4.9: Compilation of the enthalpies of vaporization ∆vapH298, enthalpies of forma-tion in the liquid ∆fH
0m,liq,298, and in the gaseous phase ∆fH
0m,g,298 for some alkanes,
alcohols, and imidazolium based ILs (in kJ ·mol−1).
Compound ∆vapH298 ∆fH0m,liq,298 ∆fH
0m,g,298
1 2 3 4
CH3 − [CH2]2 −CH3[87]
22.4±0.1 -146.6±0.7 -125.6±0.7
CH3 − [CH2]4 −CH3[87]
31.7±0.1 -198.7±0.8 -167.1±0.8
∆a 9.3 -52.1 -41.5
CH3 − [CH2]2 −OH[159]
52.3±0.1 -302.6±0.5 -255.1±0.5
CH3 − [CH2]4 −OH[159]
61.7±0.1 -351.6±0.4 -294.7±0.5
∆a 9.4 -49.0 -39.6
[C2mim][Cl]b 140.8 -138.7 2.1c
[C4mim][Cl]b 152.4 -196.7 -44.3c
∆a 11.6 -58.0 -46.4
[C2mim][Br]b 145.9 -107.0 38.9c
[C4mim][Br]b 156.8 -167.2 -10.4c
∆a 10.9 -60.2 -49.3
[C2mim][NTf2]d 123.1±1.0 � �
[C4mim][NTf2]d 129.7±1.0 � �
∆a 6.6 � �
[C2mim][N (CN)2] 157.0±2.1 235.3±3.1 392.3±3.7[C4mim][N (CN)2][73] 157.2±1.1 195.0±2.7 352.2±2.9
∆a 0.2 -40.0 -40.1
[C2mim][NO3][71] 163.7±5.3 -216.9±2.0 -53.2±4.9[C4mim][NO3][71] 162.4±5.7 -261.4±2.9 -99.0±4.9
∆a -1.3 -44.5 -45.8
a - Di�erence between respective values for C4 and C2 derivatives.b - Values from the
Table 4.7.c - Sum of the columns 2 and 3. d - Data from QCM method (Table 3.13)
The experimental data on vaporization enthalpies of two n-alkanes and n-alcohols
are presented in column 2 of Table 4.9. We discuss these di�erences to understand
whether or not ILs obey additivity rules. It is evident from this column that the di�er-
85
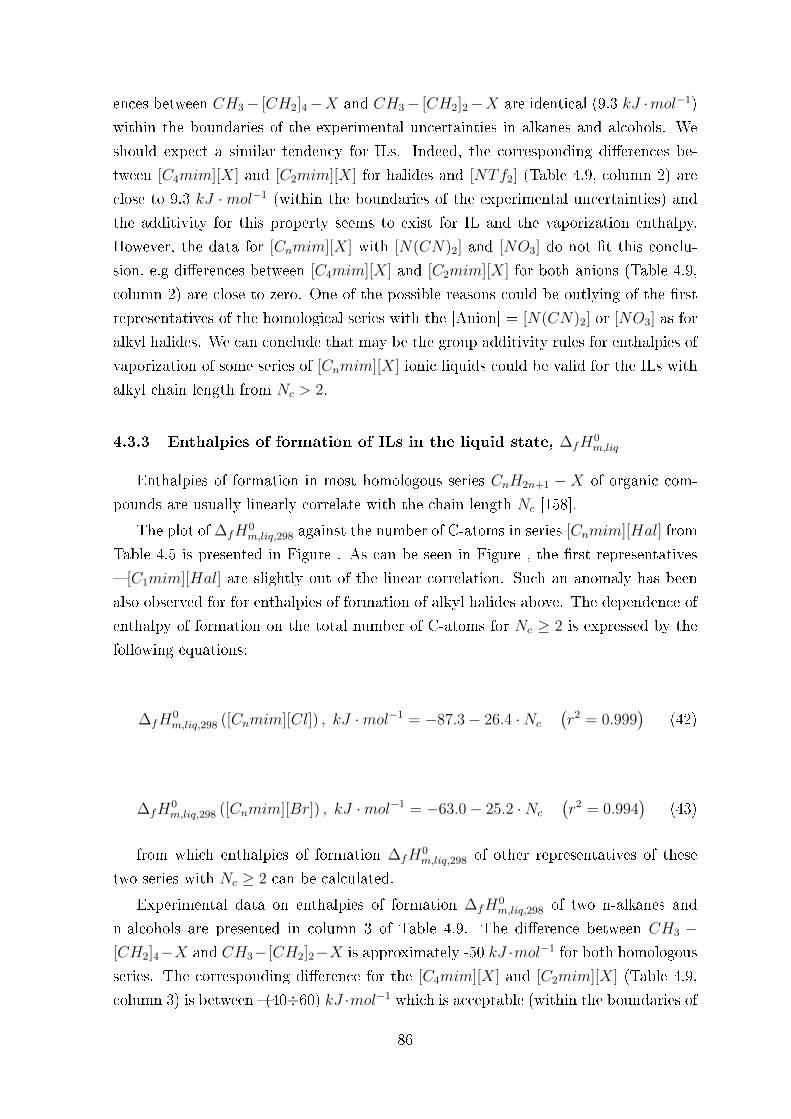
ences between CH3− [CH2]4−X and CH3− [CH2]2−X are identical (9.3 kJ ·mol−1)
within the boundaries of the experimental uncertainties in alkanes and alcohols. We
should expect a similar tendency for ILs. Indeed, the corresponding di�erences be-
tween [C4mim][X] and [C2mim][X] for halides and [NTf2] (Table 4.9, column 2) are
close to 9.3 kJ ·mol−1 (within the boundaries of the experimental uncertainties) and
the additivity for this property seems to exist for IL and the vaporization enthalpy.
However, the data for [Cnmim][X] with [N(CN)2] and [NO3] do not �t this conclu-
sion, e.g di�erences between [C4mim][X] and [C2mim][X] for both anions (Table 4.9,
column 2) are close to zero. One of the possible reasons could be outlying of the �rst
representatives of the homological series with the [Anion] = [N(CN)2] or [NO3] as for
alkyl halides. We can conclude that may be the group additivity rules for enthalpies of
vaporization of some series of [Cnmim][X] ionic liquids could be valid for the ILs with
alkyl chain length from Nc > 2.
4.3.3 Enthalpies of formation of ILs in the liquid state, ∆fH0m,liq
Enthalpies of formation in most homologous series CnH2n+1 − X of organic com-
pounds are usually linearly correlate with the chain length Nc [158].
The plot of ∆fH0m,liq,298 against the number of C-atoms in series [Cnmim][Hal] from
Table 4.5 is presented in Figure . As can be seen in Figure , the �rst representatives
� [C1mim][Hal] are slightly out of the linear correlation. Such an anomaly has been
also observed for for enthalpies of formation of alkyl halides above. The dependence of
enthalpy of formation on the total number of C-atoms for Nc ≥ 2 is expressed by the
following equations:
∆fH0m,liq,298 ([Cnmim][Cl]) , kJ ·mol−1 = −87.3− 26.4 ·Nc
(r2 = 0.999
)(42)
∆fH0m,liq,298 ([Cnmim][Br]) , kJ ·mol−1 = −63.0− 25.2 ·Nc
(r2 = 0.994
)(43)
from which enthalpies of formation ∆fH0m,liq,298 of other representatives of these
two series with Nc ≥ 2 can be calculated.
Experimental data on enthalpies of formation ∆fH0m,liq,298 of two n-alkanes and
n-alcohols are presented in column 3 of Table 4.9. The di�erence between CH3 −[CH2]4−X and CH3−[CH2]2−X is approximately -50 kJ ·mol−1 for both homologous
series. The corresponding di�erence for the [C4mim][X] and [C2mim][X] (Table 4.9,
column 3) is between �(40÷60) kJ ·mol−1 which is acceptable (within the boundaries of
86
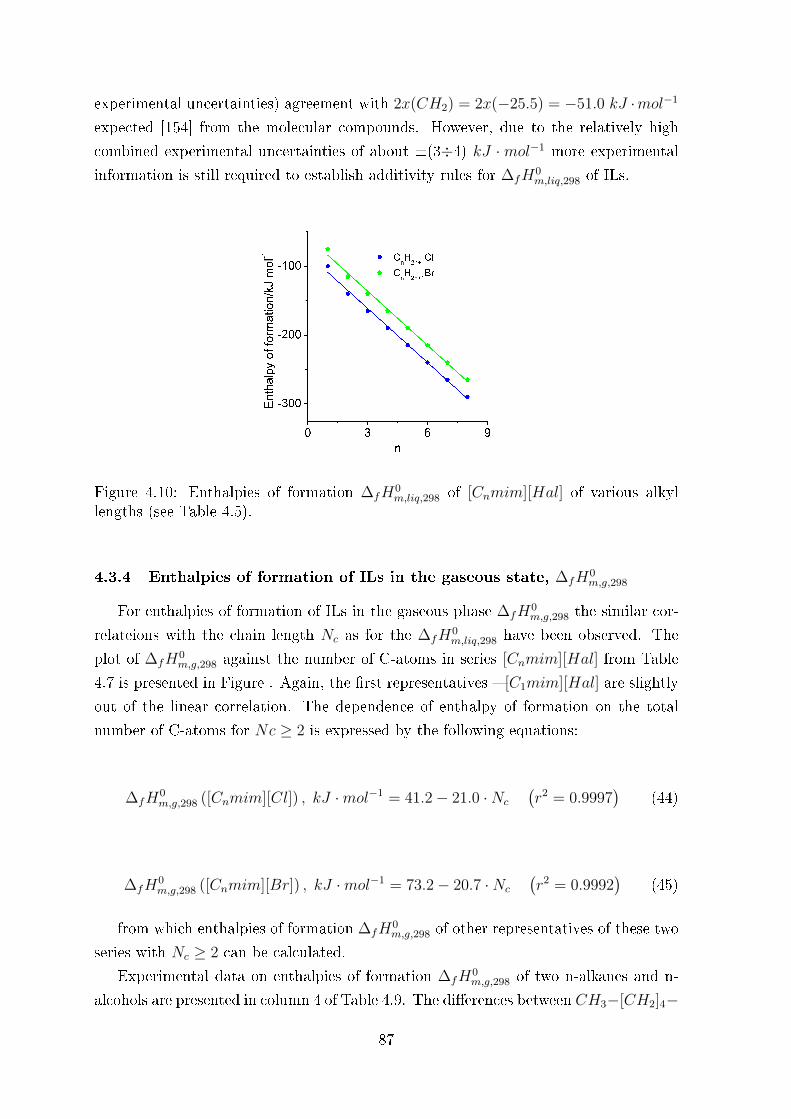
experimental uncertainties) agreement with 2x(CH2) = 2x(−25.5) = −51.0 kJ ·mol−1
expected [154] from the molecular compounds. However, due to the relatively high
combined experimental uncertainties of about ±(3÷4) kJ ·mol−1 more experimental
information is still required to establish additivity rules for ∆fH0m,liq,298 of ILs.
Figure 4.10: Enthalpies of formation ∆fH0m,liq,298 of [Cnmim][Hal] of various alkyl
lengths (see Table 4.5).
4.3.4 Enthalpies of formation of ILs in the gaseous state, ∆fH0m,g,298
For enthalpies of formation of ILs in the gaseous phase ∆fH0m,g,298 the similar cor-
relateions with the chain length Nc as for the ∆fH0m,liq,298 have been observed. The
plot of ∆fH0m,g,298 against the number of C-atoms in series [Cnmim][Hal] from Table
4.7 is presented in Figure . Again, the �rst representatives � [C1mim][Hal] are slightly
out of the linear correlation. The dependence of enthalpy of formation on the total
number of C-atoms for Nc ≥ 2 is expressed by the following equations:
∆fH0m,g,298 ([Cnmim][Cl]) , kJ ·mol−1 = 41.2− 21.0 ·Nc
(r2 = 0.9997
)(44)
∆fH0m,g,298 ([Cnmim][Br]) , kJ ·mol−1 = 73.2− 20.7 ·Nc
(r2 = 0.9992
)(45)
from which enthalpies of formation ∆fH0m,g,298 of other representatives of these two
series with Nc ≥ 2 can be calculated.
Experimental data on enthalpies of formation ∆fH0m,g,298 of two n-alkanes and n-
alcohols are presented in column 4 of Table 4.9. The di�erences between CH3−[CH2]4−
87

X and CH3−[CH2]2−X as well as for [C4mim][X] and [C2mim][X] (Table 4.9, column
4) seem to be remarkably consistent. Analysis of di�erences between [C4mim][X] and
[C2mim][X] (see column 4, Table 4.9) reveals that the contribution from two CH2
groups in ionic liquids seems to be somewhat more negative (an average of about -45
kJ · mol−1) in comparison to the value 2x(CH2) = 2x(−20.9) = −41.8 kJ · mol−1
which is expected for normal molecular compounds. However, this di�erence for ionic
liquids could be considered as acceptable, taking into account taking into account the
uncertainties assigned for the CBS-Q3B method of ± 5.0 kJ · mol−1. We conclude
that group additivity rules for the gaseous enthalpies of formation of the series of
[Cnmim][X] ionic liquids are valid for the ILs with both short and long alkyl chain
lengths on the cation. However, more experimental information is required for detecting
similarities or disparities of additivity parameters of molecular and ionic compounds.
The accumulation of data on vaporisation enthalpies and enthalpies of formation
of ionic liquids is essential for development of another kinds of correlations between
structures of ionic liquids and their thermodynamic properties.
Figure 4.11: Enthalpies of formation ∆fH0m,g,298 of [Cnmim][Hal] of various alkyl
lengths (see Table 4.7).
4.4 Calculation of the Gas Phase Enthalpies of Reaction and Formation.
Quantum Chemical Calculations.
Ab initio calculations of ILs under study were performed using the Gaussian 03
Rev.04 program package [124]. Initially the conformational analysis of the cations
of ionic liquids was carried out. The butyl derivatives of ionic liquids containing C4
top were used as models. Rotational conformers of 1-n-butyl-3-methylimidazolium, N-
butylpyridinium and N-methyl-N-butylpyrrolidinium cation were studied at the level
88

RHF/3-21G* at 0 K. Molecular structures and relative energies of all conformations for
the cations formed by rotation of alkyl groups around N-C and C-C bonds of the butyl
group (CCCN and CCNC dihedrals) by 360° have been studied with 10° step starting
from the co-planar conformation (Fig. 40 for 1-n-butyl-3-methylimidazolium). The
conformers with the lowest energies were chosen for further calculations (Fig. 41 and
Table 18). For Ñ2−Ñ3, Ñ5−Ñ8 cations the model conformers of Ñ4 were increased or
decreased for appropriate carbon atoms. The optimization of the obtained structures
was followed by the analysis of the Mulliken charges distributions. The halogen anion
was placed near the atoms with the highest positive charge. In this way from 10 to 20
conformers of ionic liquids were generated, which were optimized on B3LYP/6-31+(d,p)
level of theory.
After this conformers generation the lowest by energy conformer was calculated
on CBS-QB3 level. CBS-QB3 theory uses geometries from B3LYP/6-311G(2d,d,p)
calculation, scaled zero-point energies from B3LYP/6-311G(2d,d,p) calculation fol-
lowed by a series of single-point energy calculations at the MP2/6-311G(3df,2df,2p),
MP4(SDQ)/6-31G(d(f),p) and CCSD(T)/6-31G� levels of theory [125]. Calculated val-
ues of the enthalpy and Gibbs energy of ions and ion pairs are based on the electronic
energy calculations obtained by the CBS-QB3 and G3MP2 methods using standard
procedures of statistical thermodynamics [126].
4.4.1 Enthalpy of formation ∆fH0m,g,298 - improvement of the atomization
procedure
We have calculated using the CBS-QB3 a total energies E0 at T = 0 K and en-
thalpies H298 at T = 298 K. In the Gaussian-n theories, theoretical standard enthalpies
of formation ∆fH0m,g,298 are calculated through the atomization reactions oder bond
separation reactions [162]. Raghavachari et al. [163] have proposed to use a set of
isodesmic reactions, the �bond separation reactions� to derive theoretical enthalpies
of formation. Isodesmic reactions conserve the number of types of bonds and should
thus be an improvement of simple atomization reactions. Further enhancement in the
calculation of enthalpies of formation should be provided by homodesmic reactions,
which, in addition to the types of bonds, also conserve the hybridization of the atoms
in the bond. Unfortunately, for ionic liquids the choice of species with the reliable
thermodynamic data involved in the isodesmic or bond separation is very restricted.
In this work we have applied the atomization procedure (AT), e.g for [C2mim][Cl]:
[C2mim][Cl]→ 6 · C + 11 ·H + 2 ·N + Cl (46)
In contrast to the bond separation and isodesmic reactions, the atomization reaction
89
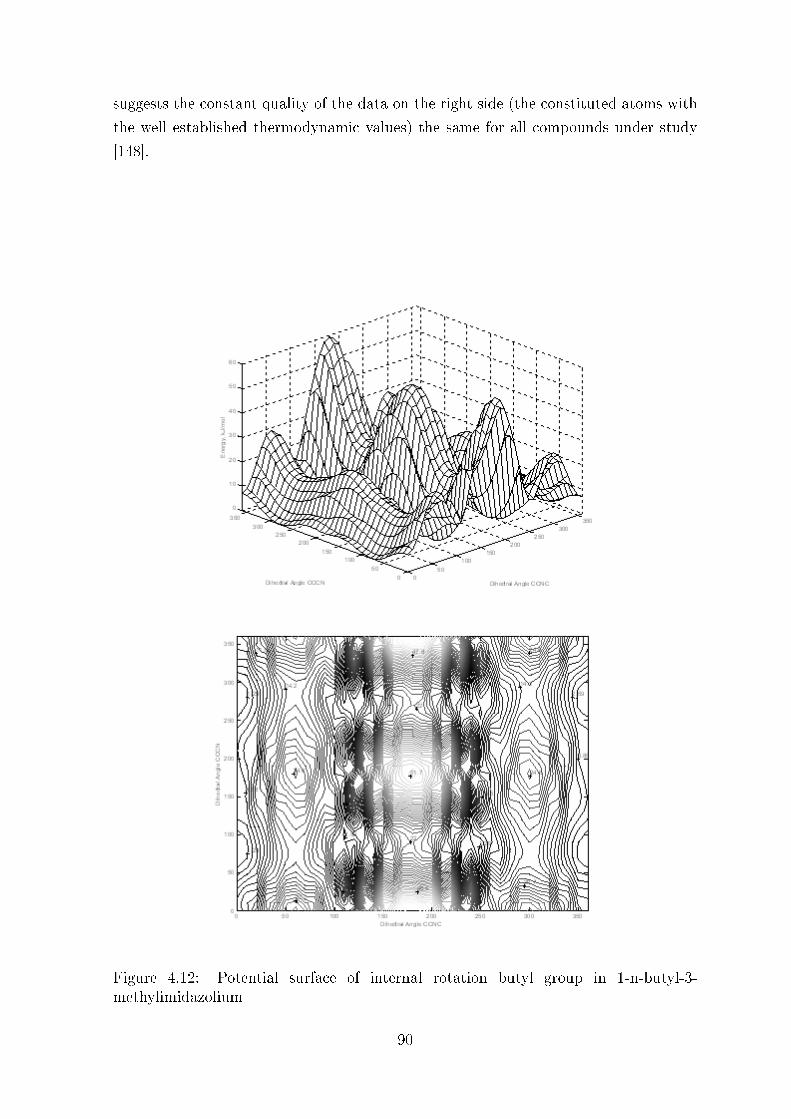
suggests the constant quality of the data on the right side (the constituted atoms with
the well established thermodynamic values) the same for all compounds under study
[148].
Figure 4.12: Potential surface of internal rotation butyl group in 1-n-butyl-3-methylimidazolium
90
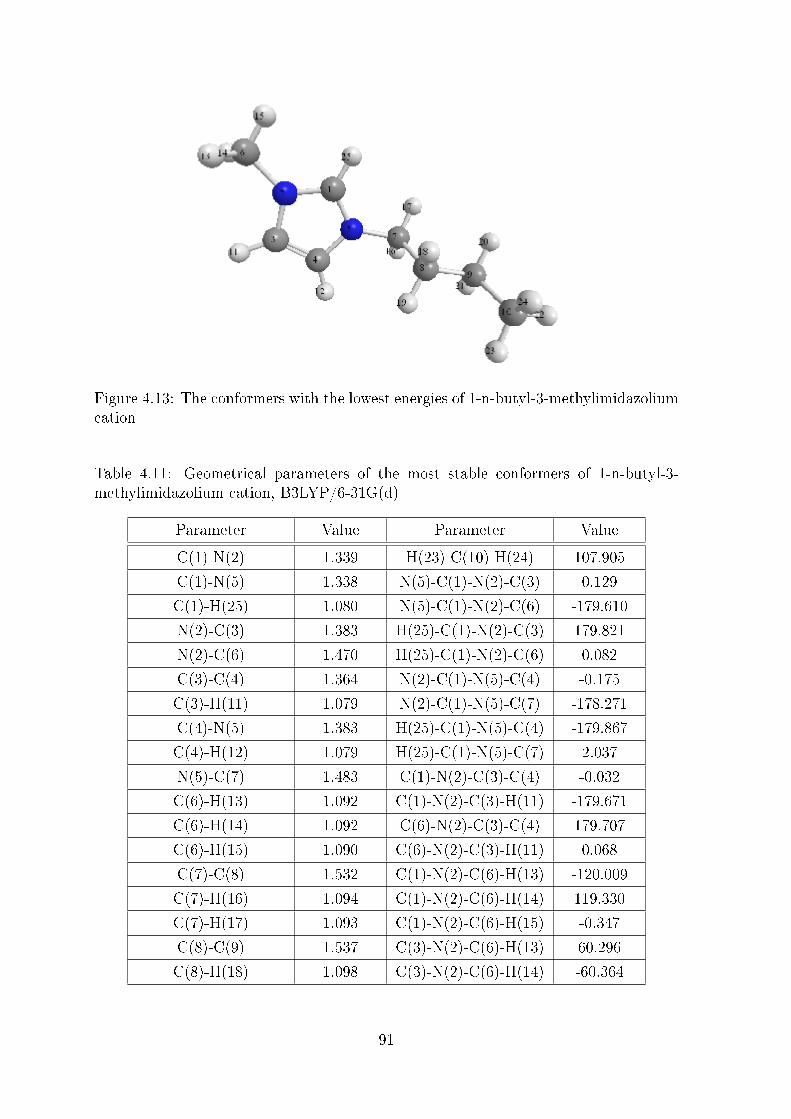
Figure 4.13: The conformers with the lowest energies of 1-n-butyl-3-methylimidazoliumcation
Table 4.11: Geometrical parameters of the most stable conformers of 1-n-butyl-3-methylimidazolium cation, B3LYP/6-31G(d)
Parameter Value Parameter Value
C(1)-N(2) 1.339 H(23)-C(10)-H(24) 107.905
C(1)-N(5) 1.338 N(5)-C(1)-N(2)-C(3) 0.129
C(1)-H(25) 1.080 N(5)-C(1)-N(2)-C(6) -179.610
N(2)-C(3) 1.383 H(25)-C(1)-N(2)-C(3) 179.821
N(2)-C(6) 1.470 H(25)-C(1)-N(2)-C(6) 0.082
C(3)-C(4) 1.364 N(2)-C(1)-N(5)-C(4) -0.175
C(3)-H(11) 1.079 N(2)-C(1)-N(5)-C(7) -178.271
C(4)-N(5) 1.383 H(25)-C(1)-N(5)-C(4) -179.867
C(4)-H(12) 1.079 H(25)-C(1)-N(5)-C(7) 2.037
N(5)-C(7) 1.483 C(1)-N(2)-C(3)-C(4) -0.032
C(6)-H(13) 1.092 C(1)-N(2)-C(3)-H(11) -179.671
C(6)-H(14) 1.092 C(6)-N(2)-C(3)-C(4) 179.707
C(6)-H(15) 1.090 C(6)-N(2)-C(3)-H(11) 0.068
C(7)-C(8) 1.532 C(1)-N(2)-C(6)-H(13) -120.009
C(7)-H(16) 1.094 C(1)-N(2)-C(6)-H(14) 119.330
C(7)-H(17) 1.093 C(1)-N(2)-C(6)-H(15) -0.347
C(8)-C(9) 1.537 C(3)-N(2)-C(6)-H(13) 60.296
C(8)-H(18) 1.098 C(3)-N(2)-C(6)-H(14) -60.364
91

However, before application of the AT procedure for estimation of enthalpies of
formation ∆fH0m,g,298 of ILs it is reasonable to test validity of the AT method to re-
produce the reliable experimental data properly. In Table 4.13 and 4.15 we collected
two sets of reliable enthalpies of formation for chlorine- and bromine-containing com-
pounds. Results of calculations using the CBS-QB3 method are given in the column
4, Table 4.13 and 4.15. It is apparent that enthalpies of formation calculated from the
atomization procedure are systematically less than those from the experimental data
for all chlorine- and bromine-compounds under the study. Notwithstanding, as it has
been mentioned above, the enthalpies of formation from the atomization procedure de-
viate systematically from the experimental values. It has turned out that a remarkable
linear correlations could be found between experimental enthalpies of formation and
those calculated by atomization enthalpies of formation:
∆fH0,expm,g,298 (AlkCl) , kJ ·mol−1 = 3.5 + 0.998 ·∆fH
0,ATm,g,298 (AlkCl)
(r2 = 0.9996
)(47)
∆fH0,expm,g,298 (AlkBr) , kJ ·mol−1 = 28.2 + 1.002 ·∆fH
0,ATm,g,298 (AlkBr)
(r2 = 0.9981
)(48)
Using this correlation, the �corrected� enthalpies of formation of the compounds
under study have been calculated (see Tables 16-17) and these values are now in good
agreement with the experimental results. Having established this �modi�ed atomiza-
tion procedure� we could use the eq. (47) and (48) for estimation enthalpies of the Cl-
and Br-containing compounds from the CBS-QB3 energies without creating any �suit-
able� bond separation or isodesmic reactions. Thus, the CBS-QB3 method combined
with the modi�ed atomization procedure have been applied in this work for reliable
calculations of ∆fH0m,g,298 of the ILs (see Tables 4.17-4.19).
92

Table 4.13: Results of Calculation of the Enthalpy of formation Chlorine-containingCompounds in the Gaseous Phase at 298.15 K, CBS-QB3, kJ ·mol−1
Compound ∆fH0,expm,g,298 ∆fH
0,calcm,g,298 ∆ = ∆fH
0,expm,g,298 −∆fH
0,calcm,g,298
Chloromethane -81.9±0.5 -87.4 5.5
1-Chloroetane -112.1±1.1 -116.1 4.0
1-Chloropropane -131.9±1.0 -136.2 4.3
2-Chloropropane -144.9±1.0 -150.5 5.6
1-Chlorobutane -154.4±1.3 -156.0 1.6
Chloroethylene 37.2±1.2 18.9 18.3∗
2-Chloro-propen-1 -21.0±9.4 -22.9 1.9
Chlorocyclohexane -163.7±3.6 -167.1 3.4
Chlorobenzene 52.0±1.3 48.2 3.8
di-Chloromethane -95.4±1.1 -105.5 10.1∗
tri-Chloromethane -102.7±1.2 -120.6 17.9∗
tetra-
Chloromethane
-95.7±1.0 -125.4 29.7∗
93

Table 4.15: Results of Calculation of the Enthalpy of formation Bromine-containingCompounds in the Gaseous Phase at 298.15 K, CBS-QB3, kJ ·mol−1
Compound ∆fH0,expm,g,298 ∆fH
0,calcm,g,298 ∆ = ∆fH
0,expm,g,298 −∆fH
0,calcm,g,298
2-Bromopropane -98.5 -132.9 24.7
Bromomethane -37.5 -68.2 30.7
Hydrogen bromide -36.4 -61.7 25.3
Bromoethane -63.6 -94.1 30.5
Bromocyan 186.2 160.9 25.3
Bromoethene 79.2 51.3 27.9
Br2 30.9 -8.3 39.2
Bromoisopropane -99.4 -123.1 23.7
Bromopropane -87.0 -113.9 26.9
Bromopropene 45.2 11.4 33.9
Bromobenzene 105.4 82.0 23.4
Bromobutane -107.1 -134.0 26.9
Bromopentane -129.0 -160.4 31.4
2-Bromoisobutane -132.4 -156.9 24.5
Bromoethene 79.2 51.3 27.9
94

Table 4.17: Results of Calculation of the Enthalpy of formation Chlorine-containingILs in the Gaseous Phase at 298.15 K, CBS-QB3, kJ ·mol−1
IL G3MP2 CBS-QB3
∆fH0,ATm,g,298 ∆fH
0,ATm,g,298, corr
[C1mim][Cl] 44.1 28.3 31.8
[C2mim][Cl] 10.2 -3.2 0.4
[C3mim][Cl] -15.1 -26.5 -22.9
[C4mim][Cl] -37.5 -47.2 -43.5
[C5mim][Cl] -59.4 -67.6 -63.9
[C6mim][Cl] -81.0 -87.8 -84.1
[C7mim][Cl] -109.2 -105.4
[C8mim][Cl] -130.7 -126.9
[C1Py][Cl] 92.7 77.5 80.9
[C2Py][Cl] 54.5 52.6 56.0
[C3Py][Cl] 27.3 27.0 30.5
[C4Py][Cl] 4.4 5.9 9.4
[C5Py][Cl] -17.7 -15.1 -11.5
[C6Py][Cl] -39.4 -35.4 -31.8
[C7Py][Cl] -55.4 -51.7
[C8Py][Cl] -75.4 -71.7
[C1,1Pyrr][Cl] � -108.5 -104.7
[C1,2Pyrr][Cl] -128.3 -134.4 -130.6
[C1,3Pyrr][Cl] � -156.6 -152.7
[C1,4Pyrr][Cl] -173.6 -177.2 -173.3
[C1,5Pyrr][Cl] -195.4 -197.6 -193.6
[C1,6Pyrr][Cl] -216.9 -217.8 -213.8
[C1,7Pyrr][Cl] -237.9 -233.8
[C1,8Pyrr][Cl] -257.9 -253.8
95

Table 4.19: Results of Calculation of the Enthalpy of formation Chlorine-containingILs in the Gaseous Phase at 298.15 K, CBS-QB3, kJ ·mol−1
IL CBS-QB3
∆fH0,ATm,g,298 ∆fH
0,ATm,g,298, corr
[C1mim][Br] 39.7 68.0
[C2mim][Br] 5.4 33.6
[C3mim][Br] -17.6 10.6
[C4mim][Br] -38.6 -10.5
[C5mim][Br] -60.6 -32.5
[C6mim][Br] -79.6 -51.5
[C7mim][Br] -99.6 -71.5
[C8mim][Br] -119.6 -91.6
[C1Py][Br] 84.9 113.3
[C2Py][Br] 56.6 84.9
[C3Py][Br] 39.4 67.7
[C4Py][Br] 13.0 41.2
[C5Py][Br] -1.9 26.3
[C6Py][Br] -23.5 4.7
[C7Py][Br] -42.9 -14.8
[C8Py][Br] -62.3 -34.2
[C1,1Pyrr][Br] -98.3 -70.2
[C1,2Pyrr][Br] -126.3 -98.3
[C1,3Pyrr][Br] -146.2 -118.2
[C1,4Pyrr][Br] -166.8 -138.9
[C1,5Pyrr][Br] -188.7 -160.8
[C1,6Pyrr][Br] -208.3 -180.4
[C1,7Pyrr][Br] -228.1 -200.2
[C1,8Pyrr][Br] -247.8 -220.0
4.4.2 Quantum chemical calculations for degree of dissociation of the ion
pair
In recent papers [73, 135, 149] we have shown, that the aprotic ILs such as [C4mim][N(CN)2],
[Pyrr1,4][N(CN)2], and [Cnmim][NO3] exist in the gaseous phase as contact ion pairs
and not as separated ions. In this work calculations for the free cation [C2mim]+,
[C2py]+, [C1,2pyrr]+, the free anions [Cl], [Br], and the ion pairs [C2mim]+[Cl]−,
96

[C2mim]+[Br]−, [C2py]+[Cl]−, [C2py]+[Br]−, [C1,2pyrr]+[Cl]−, [C1,2pyrr]
+[Br]− have
been performed. Results of the electronic energy at 0 K, the molecular structures in
the lowest energetic state and all vibrational frequencies of each species have been ob-
tained. On the basis of these quantum mechanical results, the molar Gibbs energy,
the molar enthalpy, and the molar entropy at 298.15 K have been calculated using
standard procedures of statistical thermodynamics. The purpose of this procedure was
to obtain values of the molar standard Gibbs energy of reaction ∆rG0, the standard
molar entropy of reaction ∆rS0, and the molar reaction enthalpy ∆rH
0 for the pro-
cess of dissociation of the ion pair, e.g [C2mim]+[Cl]− into ions in the gaseous phase
according to the following equation:
[C2mim]+[Cl]− → [C2mim]+ + [Cl]− (49)
The chemical equilibrium constant Kp in the ideal gaseous state has been calculated
at 298.15 K using the CBS-QB3 method according to the equation:
Kp = exp
(−∆G
RT
)(50)
from which the degree of dissociation of the ion pair a de�ned as:
α =p+
pIP + p+=
p−
pIP + p−(51)
can be calculated according to:
Kp =α2
1− α2· psat (52)
or
α =
√Kp
Kp + psat(53)
where p+ = p− is the partial pressure of the cation and anion respectively; pIP is the
partial pressure of the ion pair; psat - saturated pressure of the IL (psat = pIP + p+ + p−).
We have obtained Kp = 1.4 · 10−65 for [C2mim]+[Cl]− and the equilibrium con-
stant for dissociation of [C2mim]+[Br]−, [C2py]+[Cl]−, [C2py]+[Br]−, [C1,2pyrr]+[Cl]−,
[C1,2pyrr]+[Br]−, have been on the same level. These values are in agreement with
Kp = 1.4 · 10−54 for [C4mim][N(CN)2] derived in our previous work [73]. Such ex-
tremely low values allow us to conclude with high reliability that the degree of dissoci-
ation of the ion pair is zero for the ionic liquids under study, i.e. these ionic ILs exist
exclusively as ion pairs in the gaseous phase.
97
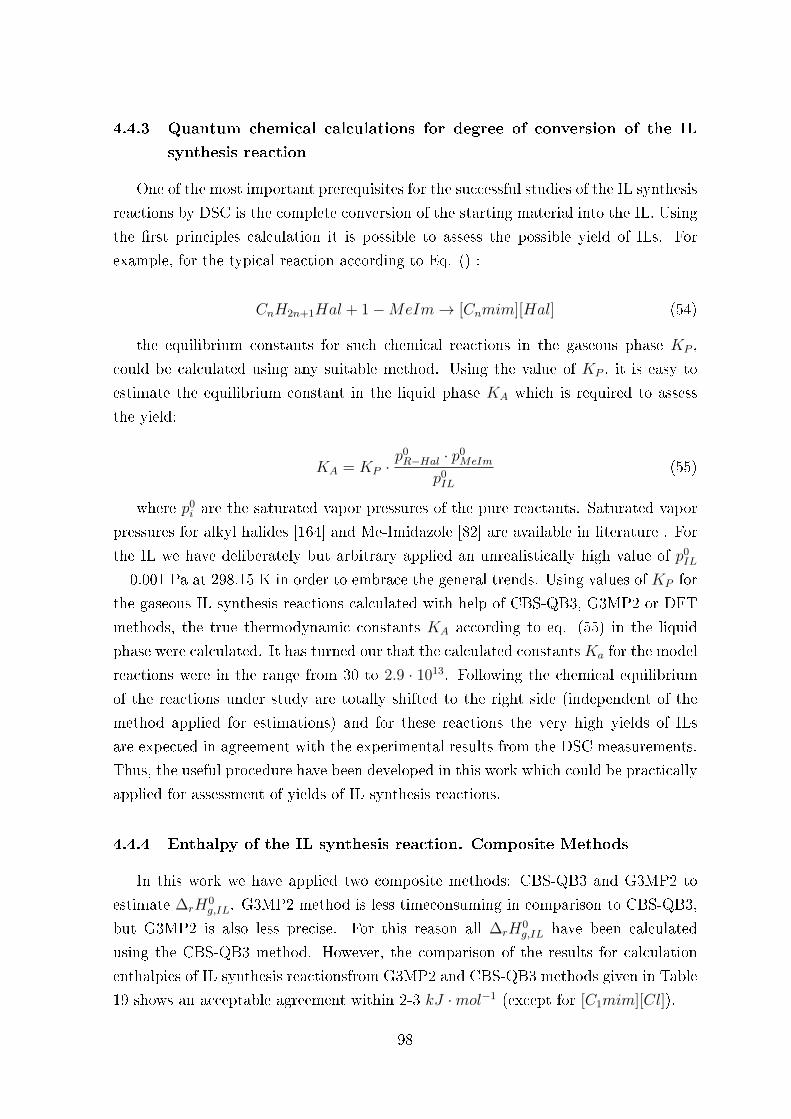
4.4.3 Quantum chemical calculations for degree of conversion of the IL
synthesis reaction
One of the most important prerequisites for the successful studies of the IL synthesis
reactions by DSC is the complete conversion of the starting material into the IL. Using
the �rst principles calculation it is possible to assess the possible yield of ILs. For
example, for the typical reaction according to Eq. () :
CnH2n+1Hal + 1−MeIm→ [Cnmim][Hal] (54)
the equilibrium constants for such chemical reactions in the gaseous phase KP ,
could be calculated using any suitable method. Using the value of KP , it is easy to
estimate the equilibrium constant in the liquid phase KA which is required to assess
the yield:
KA = KP ·p0R−Hal · p0MeIm
p0IL(55)
where p0i are the saturated vapor pressures of the pure reactants. Saturated vapor
pressures for alkyl halides [164] and Me-Imidazole [82] are available in literature . For
the IL we have deliberately but arbitrary applied an unrealistically high value of p0IL= 0.001 Pa at 298.15 K in order to embrace the general trends. Using values of KP for
the gaseous IL synthesis reactions calculated with help of CBS-QB3, G3MP2 or DFT
methods, the true thermodynamic constants KA according to eq. (55) in the liquid
phase were calculated. It has turned our that the calculated constantsKa for the model
reactions were in the range from 30 to 2.9 · 1013. Following the chemical equilibrium
of the reactions under study are totally shifted to the right side (independent of the
method applied for estimations) and for these reactions the very high yields of ILs
are expected in agreement with the experimental results from the DSC measurements.
Thus, the useful procedure have been developed in this work which could be practically
applied for assessment of yields of IL synthesis reactions.
4.4.4 Enthalpy of the IL synthesis reaction. Composite Methods
In this work we have applied two composite methods: CBS-QB3 and G3MP2 to
estimate ∆rH0g,IL. G3MP2 method is less timeconsuming in comparison to CBS-QB3,
but G3MP2 is also less precise. For this reason all ∆rH0g,IL have been calculated
using the CBS-QB3 method. However, the comparison of the results for calculation
enthalpies of IL synthesis reactionsfrom G3MP2 and CBS-QB3 methods given in Table
19 shows an acceptable agreement within 2-3 kJ ·mol−1 (except for [C1mim][Cl]).
98
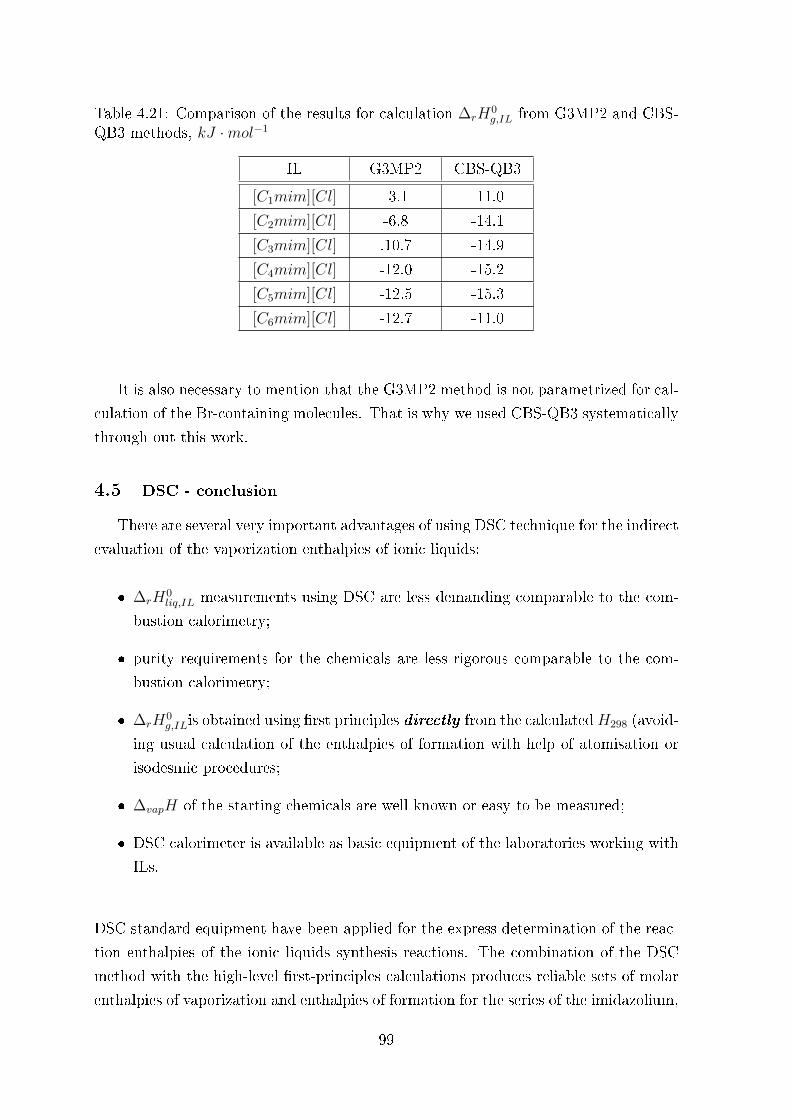
Table 4.21: Comparison of the results for calculation ∆rH0g,IL from G3MP2 and CBS-
QB3 methods, kJ ·mol−1
IL G3MP2 CBS-QB3
[C1mim][Cl] -3.1 -11.0
[C2mim][Cl] -6.8 -14.1
[C3mim][Cl] .10.7 -14.9
[C4mim][Cl] -12.0 -15.2
[C5mim][Cl] -12.5 -15.3
[C6mim][Cl] -12.7 -11.0
It is also necessary to mention that the G3MP2 method is not parametrized for cal-
culation of the Br-containing molecules. That is why we used CBS-QB3 systematically
through out this work.
4.5 DSC - conclusion
There are several very important advantages of using DSC technique for the indirect
evaluation of the vaporization enthalpies of ionic liquids:
� ∆rH0liq,IL measurements using DSC are less demanding comparable to the com-
bustion calorimetry;
� purity requirements for the chemicals are less rigorous comparable to the com-
bustion calorimetry;
� ∆rH0g,ILis obtained using �rst principles directly from the calculatedH298 (avoid-
ing usual calculation of the enthalpies of formation with help of atomisation or
isodesmic procedures;
� ∆vapH of the starting chemicals are well known or easy to be measured;
� DSC calorimeter is available as basic equipment of the laboratories working with
ILs.
DSC standard equipment have been applied for the express determination of the reac-
tion enthalpies of the ionic liquids synthesis reactions. The combination of the DSC
method with the high-level �rst-principles calculations produces reliable sets of molar
enthalpies of vaporization and enthalpies of formation for the series of the imidazolium,
99

pyridinium, and pyrrolidinium based ILs. Simple additive rules have been tested for
these thermochemical properties. We have shown that enthalpies of formation and en-
thalpies of vaporization generally obey group additivity and the values of the additivity
parameters for ionic liquids seem to be not much di�erent from those for molecular
compounds. Combination of di�erential scanning calorimetry with the �rst-principles
calculations allows rapid accumulation of the thermodynamic data. This procedure
provides indispensable data material for testing �rst-principles procedures and molec-
ular dynamic simulations techniques in order to understand thermodynamic properties
of ionic liquids on a molecular basis.
5 Outlook and conclusion of the work
Having established the express experimental TGA procedure, an accumulation of
vaporization enthalpies of ILs of di�erent structures could be possible. Two directions
of investigation could be suggested. The �rst one is to investigate series of ILs with
the same anion and 1-Me-Imidazolium based cations with di�erent alkyl chain length
[Cnmim]. The second direction is to keep constant cation (e.g. [C2mim]) and to
change anion. Following these two directions it is possible to investigate a large scope
of structure-property relationship data.
TGA method being a screening tool allows to locate values of ∆vapH and to select
proper temperature range of investigation with other well established techniques (static,
Knudsen QCM). Simultaneous measurements with several methods give an opportunity
to establish reliable vaporization data for further applications.
At the moment reproducibility of the TGA method lies in the range of ±(3 to 5)
kJ · mol−1. As a technique for investigation of vaporization of ILs TGA has crucial
advantages: it is easily accessible, fast and requires small amounts of sample. This is
why TGA is a prospective method for ∆vapH studies and needs further development.
For the reason of establishment of mutual consistency of ∆vapH data other, indirect
methods are also required. The procedure in which vaporisation enthalpy can be de-
termined was suggested. In this procedure ∆vapH is obtained as a di�erence between
enthalpies of formation of an IL in liquid and gaseous phase. Enthalpy of formation in
gaseous phase can be computed using high level �rst principles calculation. Enthalpy
of formation in liquid phase can be measured experimentally either with the use of
combustion calorimetry or with the use of DSC.
Establishment of DSC for ∆vapH studies is possible due to diversity of advantages
of DSC, e.g.: the measurement of enthalpy of formation is less demanding comparing
with combustion calorimetry (purity of reactants, time requirements, weighing proce-
100

dure), simplicity and accessibility of DSC equipment. Being applied to ∆vapH studies,
DSC provides us with possibility to derive ∆vapH easily from enthalpy of formation of
the certain IL with high accuracy. Excessive data on thermodynamic properties of ILs
obtained with the use of this indirect procedure give an opportunity to adjust param-
eters of ab initio and MD-simulations. In one turn, these simulations render essential
data on structure-property relations for ILs, which allow to tune properties of these
compounds more precisely.
101
References
[1] Hiroyuki Ohno, Bull. Chem. Soc. Jpn., 2006, 79(11), 1665�1680.
[2] Thomas Welton, August , 1999, 99(8), 2071�2084.
[3] Colin F. Poole, May , 2004, 1037(1-2), 49�82.
[4] P. Wasserscheid and W. Keim, Angew. Chem. Int. Ed., 2000, 39, 3772.
[5] D. Zhao, Y. Liao, and Z. Zhang, Clean, 2007, 35, 42.
[6] R.P. Swatloski, J.D. Holbrey, and R.D. Rogers, Green Chem., 2003, 5, 361.
[7] Ch. P. Fredlake, J. M. Crosthwaite, D. G. Hert, S. N. V. K. Aki, and J. F.
Brennecke, J. Chem. Eng. Data 2004, 2004, 49, 954�964.
[8] H. C. Joglekar, I. Rahman, and B. D. Kulkarni, Chem. Eng. Technol., 2007, 30,
819.
[9] D. Rooney, J. Jacquemin, and R. Gardas, Top. Curr. Chem., 2010, 290, 185.
[10] R. D. Rogers and K. R. Seddon, Science, 2003, 302, 792.
[11] S. Aparicio, M. Atilhan, and F. Karadas, Ind. Eng. Chem. Res., 2010, 49, 9580�
9595.
[12] L.P.N. Rebelo, J.N. Canongia Lopes, J.M.S.S. Esperanca, and E. Filipe, J. Phys.
Chem. B, 2005, 109, 6040�6043.
[13] Y.U. Paulechka, Dz. H. Zaitsau, G.J. Kabo, and A.A. Strechan, Thermochimica
Acta, 2005, 439, 158�160.
[14] M.J. Earle, J.M.S.S. Esperanca, M.A. Gilea, J.N. Canongia Lopes, L.P.N. Rebelo,
J.W. Magee, K.R. Seddon, and J.A. Widegren, Nature, 2006, 439, 831�834.
[15] Th. Koeddermann, D. Paschek, and R. Ludwig, Phys. Chem. Chem. Phys., 2008,
9, 549�555.
[16] R. Ludwig and U. Kragl, Angew. Chem. Int. Ed., 2007, 46, 6582.
[17] J. M. S. S. Esperanca, J. N. Canongia, M. Tariq, L. M. N. B. F. Santos, J. W.
Magee, and L. P. N. Rebelo, J. Chem. Eng. Data, 2010, 55, 3�12.
102
[18] R.D. Weir and Th. W. de Loos, Measurement of Thermodynamic Properties of
Multiple Phases; Elsevier, Amsterdam, 2005.
[19] J.L. Margrave, The Characterization of High-Temperature Vapours; Wiley, New
York, 1967.
[20] A.V. Suvorov, Thermodynamic Chemistry of Vapor State; Chemistry, Leningrad,
1970.
[21] H. Kasheghari, I. Mokbel, C. Viton, and J. Jose, Fluid Phase Equilibria, 1993,
87, 133.
[22] W. Swietoslawski, Ebulliometric measurements; Reinhold, New York, 1945.
[23] E. Hala, J. Pick, V. Fried, and O. Vilim, Vapour Liquid Equilibium; Pergamon
Press, Oxford, 1967.
[24] M. Rogalski and S. Malanowski, Fluid Phase Equilibria, 1980, 5, 97.
[25] S. Malanowski, Fluid Phase Equilibria, 1982, 9, 197�219.
[26] D. Ambrose, M.B. Ewing, N.B. Ghiassee, and J.C. Sanchez Ochoa, J. Chem.
Thermodyn., 1990, 22, 589.
[27] H.V. Reagnault, Ann. Chim. (Paris), 1854, 15, 129.
[28] A.N. Nesmeyanov, Vapor Pressure of the Chemical Elements; Elsevier, Amster-
dam, 1963.
[29] R. Pankajavalli, C. Mallika, O.M. Sreedharan, V.S. Raghunthan,
Antony Premkumar P., and K.S. Nagaraja, Chem. Ing. Sci., 2002, 57,
3603.
[30] R. Pankajavalli, K. Ananthasivan, S. Antonysamy, and P.R. Vasudeva Rao, J.
Nuc. Mat., 2005, 345, 96.
[31] I. Langmuir, Phys. Rev., 1913, 2, 329.
[32] D.M. Price and M. Hawkins, Thermochim. Acta, 1998, 315, 19�24.
[33] D.M. Price and M. Hawkins, Thermochim. Acta, 1999, 329, 73.
[34] D.M. Price, J. Therm. Anal. Cal., 2001, 64, 315.
[35] Lori Burnham, David Dollimore, and Kenneth Alexander, Thermochim. Acta,
2001, 367-368, 15�22.
103

[36] Koustuv Chatterjee, Anasuya Hazra, David Dollimore, and S. Alexander Ken-
neth, Journal of Pharmaceutical Sciences, 2002, 91, 1156�1168.
[37] Koustuv Chatterjee, Anasuya Hazra, David Dollimore, and S. Alexander Ken-
neth, European Journal of Pharmaceutics and Biopharmaceutics, 2002, 54, 171�
180.
[38] W. Gueckel, G. Synnatschke, and R. Rittig, Pestic. Sci., 1973, 4, 137�147.
[39] R. M. Stephenson and S. Malanowski, Handbook of the Thermodynamics of Or-
ganic Compounds; New York, Elsevier, 1987.
[40] T. Boublik, V. Fried, and E. Hala, The Vapor Pressure of Pure Substances;
Amsterdam, Elsevier, 1984.
[41] P.G. Wahlbeck, High. Temp. Sci., 1986, 21, 189.
[42] J.M. La�erty, Eds., Scienti�c Foundations of Vacuum Technique; Wiley, New
York, 1962.
[43] E.M. Eusebio, A. J. L. Jesus, M. S. C. Cruz, M. L. P. Leitão, and J. S. Redinha,
J. Chem. Thermod., 2003, 35, 123.
[44] J.F. Liebman and A. Greenberg, Ed., Molecular Structure and Energetics, vol.
2; VCH Publisher, New York, 1987.
[45] S.F. Donovan, J. Chromatogr. A, 1996, 749, 123.
[46] J.S. Chickos, S. Hosseini, and D.G. Hesse, Thermochim. Acta, 1995, 249, 41.
[47] T. Kiyobayashi and M.E. Minas de Piedade, J. Chem. Thermodyn., 2001, 33,
11.
[48] Federica Barotini and Valerio Cozzani, Thermochim. Acta, 2007, 460, 15�21.
[49] M. Knudsen, The Kinetic Theory of Gases; London, Methuen, 1950.
[50] C.G. De Kruif, T. Kuipers, J.C. Van Miltenburg, R.C.F. Schaake, and G. Stevens,
J. Chem. Thermodyn., 1981, 13, 1081�1086.
[51] J.P. Elder, J. Therm. Anal. Cal., 1997, 49, 897�905.
[52] Koustuv Chatterjee, David Dollimore, and S. Alexander Kenneth, Int. J. Pharm.,
2001, 213, 31�44.
104

[53] Koustuv Chatterjee, David Dollimore, and S. Alexander Kenneth, J. Therm.
Anal., 2001, 63, 629�639.
[54] P. Phang and D. Dollimore, Proc. NATAS Annu. Conf. Therm. Anal. Appl.,
1999, 27, 598�601.
[55] P. Phang, D. Dollimore, and S. J. Evans, Proc. NATAS Annu. Conf. Therm.
Anal. Appl., 2000, 28, 54�59.
[56] Lori Burnham, David Dollimore, and Kenneth Alexander, Proc. NATAS Annu.
Conf. Therm. Anal. Appl., 1999, 27, 602�606.
[57] S. F. Wright, Kenneth Alexander, and David Dollimore, Thermochim. Acta,
2001, 367, 29�35.
[58] Koustuv Chatterjee, David Dollimore, and S. Alexander Kenneth, Instr. Sci.
Technol., 2001, 29, 133�144.
[59] D.M. Price, Thermochim. Acta, 2001, 376, 367�368.
[60] E. A. Moelwyn-Hughes, Physical chemistry; Pergamon Press, London, 1957.
[61] E. A. Mortensen and H. Eyring, J. Phys. Chem., 1960, 64, 846.
[62] J. R. Maa, Ind. Eng. Chem. Fundamen., 1967, 6 (4), 504�518.
[63] W. W. Focke, J. Therm. Anal. Cal., 2003, 74, 97�107.
[64] Koustuv Chatterjee, David Dollimore, and Kenneth S. Alexander, September ,
2002, 392-393, 107�117.
[65] Stefano Vecchio, J. Therm. Anal. Cal., 2006, 84 (1), 271�278.
[66] Supaporn Lerdkanchanaporn and David Dollimore, December , 1998, 324(1-2),
15�23.
[67] Niel Pieterse and Walter W. Focke, Thermochim. Acta, 2003, 406, 191�198.
[68] Stefano Vecchio, J. Therm. Anal. Cal., 2007, 87 (1), 79�83.
[69] Stefano Vecchio and Mauro Tomassetti, Fluid Phase Equilibria, 2009, 279, 64�
72.
[70] Stefano Vecchio and Bruno Brunetti, J. Chem. Thermodynamics, 2009, 41, 880�
667.
105
[71] P. James Armstrong, Christopher Hurst, G. Robert Jones, Peter Licence,
R. J. Kevin Lovelock, Satterley J. Christopher, and Ignacio J. Villar-Garcia,
Phys. Chem. Chem. Phys., 2007, 9, 982�990.
[72] Dzmitry H. Zaitsau, Gennady J. Kabo, Aliaksei A. Strechan, Yauheni U.
Paulechka, Anna Tschersich, Sergey P. Verevkin, and Andreas Heintz, J. Phys.
Chem. A, 2006, 110, 7303�7306.
[73] V. N. Emel'yanenko, S. P. Verevkin, and A. Heintz, J. Am. Chem. Soc., 2007,
129, 3930�3937.
[74] A. Deyko, K.R. Lovelock, P. Licence, and R.G. Jones, Phys. Chem. Chem. Phys.,
2009, 11, 8544�8555.
[75] K.R. Lovelock, A. Deyko, P. Licence, and R.G. Jones, Phys. Chem. Chem. Phys.,
2010, 12, 8893�8901.
[76] Andreas Seeberger, Ann-Katharin Andersen, and Andreas Jess, Phys. Chem.
Chem. Phys., 2009, 11, 9375�9381.
[77] F. Heym, B. J. M. Etzold, Ch. Kerna, and A. Jess, Phys. Chem. Chem. Phys.,
2010, 12, 12089�12100.
[78] O. Aschenbrenner, S. Supasitmongkol, M. Taylor, and P. Styring, Green Chem.,
2009, 11, 1217�1221.
[79] J. S. Chickos and W. E. Jr. Acree, J. Phys. Chem. Ref. Data, 2002, 31, 537�698.
[80] J. S. Chickos and W. E. Acree, J. Phys. Chem. Ref. Data, 2003, 32, 519�878.
[81] V. Majer and V. Svoboda, Enthalpies of Vaporization of Organic Compounds: A
Critical Review and Data Compilation; Blackwell Scienti�c Publications, Oxford,
1985.
[82] S. P. Verevkin, Private communication, 2009.
[83] Zaitsau, Private communication, 2010.
[84] E. C. W. Clarke and D. N. Glew, Trans. Faraday Soc., 1966, 62, 539�547.
[85] Huimin Luo, A. Gary Baker, and Sheng. Dai, J. Phys. Chem. B., 2008, 112,
10077�10081.
[86] C. Wang, H. Luo, H. Li, and S. Dai, Phys. Chem. Chem. Phys., 2010, 12, 7246�
7250.
106
[87] M. Mansson, P. Sellers, G. Stridh, and S. Sunner, J. Chem. Therm., 1977, 9,
91�97.
[88] L.M.N.B.F. Santos, J.N. Canongia Lopes, J.A.P. Coutinho, J.M.S.S. Esperanca,
L.R. Gomes, I.M. Marrucho, and L.P.N. Rebelo, J. Am. Chem. Soc., 2007, 129,
284�285.
[89] V. N. Emel'yanenko, S.P. Verevkin, Heintz A., J-A. Cor�eld, A. Deyko, K.R.J.
Lovelock, P. Licence, and G.R. Jones, J. Phys. Chem. A, 2008, page submitted.
[90] R. G. Jones, A. Armstrong, J. P. Deyko, C. Hurst, P. Licence, C. J. Satterley,
K. R. Lovelock, A. Taylor, and I. J. Villa-Garcia, August , 2007, pages 3P04�054.
[91] V. N. Emel'yanenko, S.P. Verevkin, Heintz A., and C. Schick, J. Phys. Chem.
A., 2008, page submitted.
[92] S.P. Verevkin, J. Chem. Therm., 2006, 38, 1111�1123.
[93] S.P. Verevkin, J. Chem. Therm., 2005, 37, 73�81.
[94] D. Kulikov, S.P. Verevkin, and Heintz A., Fluid Phase Equilibria, 2001, 192,
187�207.
[95] L. Bodo, L. Gontrani, R. Caminiti, N.V. Plechkova, K.S. Seddon, and Triolo. A.,
J. Phys. Chem. B, 2010, 114, 16398�16407.
[96] H.V.R. Harsha V. R. Annapureddy, H.K. Kashyap, P.M. De Biase, and C.J.
Margulis, J. Phys. Chem. B, 2010, 114, 16838�16846.
[97] J.R. Stu�, Thermochim. Acta, 1989, 152, 421�425.
[98] Dzmitry H. Zaitsau, Yauheni U. Paulechka, and Gennady J. Kabo, J. Phys.
Chem. A, 2006, 110, 11602�11604.
[99] R. E. del Sesto, T. M. McCleskey, A. K. Burrell, G. A. Baker, J. D. Thompson,
B. L. Scott, J. S. Wilkes, and P. Williams, Chem. Commun., 2008, pages 447�
449.
[100] T. Sasaki, C. Zhong, M. Tada, and Y. Iwasawa, Chem. Commun., 2005, pages
2506�2508.
[101] S. Hayashi and H. Hamaguchi, Chem. Lett., 2004, 33, 1590�1591.
[102] S. Hayashi, S. Saha, and H. Hamaguchi, IEEE Trans. Magn., 2006, 42, 12�14.
107

[103] Q.-G. Zhang, J.-Z. Yang, X.-M. Lu, J.-S. Gui, and M. Huang, Fluid Phase Equi-
libria, 2004, 226, 207�211.
[104] Gjergj Dodbiba, Hyun Seo Park, Katsunori Okaya, and Toyohisa Fujita, J. of
Magn. and Magn. Mater., 2008, 320(7), 1322�1327.
[105] C. Guerrero-Sanchez, T. Lara-Ceniceros, E. Jimenez-Regalado, M. Rasa, and
U.S. Schubert, Adv. Mater., 2007, 19(13), 1740�1747.
[106] Rico E. Del Sesto, Cynthia Corley, Al Robertson, and John S. Wilkes, Jour-
nal of Organometallic Chemistry, 2005, 690(10), 2536�2542, 16th International
Conference on Phosphorus Chemistry, International Conference on Phossphorus
Chemistry.
[107] Oleg Borodin, September , 2009, 113(36), 12353�12357.
[108] A. Renken, V. Hessel, P. Löb, R. Miszczuk, M. Uerdingen, and L. Kiwi-Minsker,
Chemical Engineering and Processing, 2007, 46(9), 840�845, Selected Papers
from the European Process Intensi�cation Conference (EPIC), Copenhagen, Den-
mark, September 19-20, 2007.
[109] G. Hoehne, W. Hemminger, and H.-J. Flammersheim, Di�erential scanning
calorimetry; Springer-Verlag, Berlin-Heidelberg, 2003.
[110] Donna G. Blackmond, Thorsten Rosner, and Andreas Pfaltz, July , 1999, 3(4),
275�280.
[111] H. Loewe, R.D. Axinte, D. Breuch, and C. Hofmann, December , 2009, 155(1-2),
548�550.
[112] Alexandra Grosse Boewing and Andreas Jess, March , 2007, 62(6), 1760�1769.
[113] Alexandra Grosse Boewing and Andreas Jess, Green Chem., 2005, 7(4), 230�235.
[114] Jay C. Schleicher and Aaron M. Scurto, Green Chem., 2009, 11(5), 694�703.
[115] P. Wasserscheid and W. Keim, Angewandte Chemie International Edition, 2000,
39(21), 3772�3789.
[116] John R. Stu�, October , 1989, 152(2), 421�425.
[117] Helen L. Ngo, Karen LeCompte, Liesl Hargens, and Alan B. McEwen, August ,
2000, 357-358, 97�102.
[118] Ibrahim Shehatta, January , 1993, 213, 1�10.
108

[119] John D. Holbrey, Reichert W. Matthew, Reddy Ramana G., and Rogers Robin
D.; Heat capacities of ionic liquids and their applications as thermal �uids; In
ACS Symposium Series, Vol. 856, pages 121�133�. American Chemical Society,
2003.
[120] Yauheni U. Paulechka, September , 2010, 39(3), 033108�23.
[121] Yauheni U. Paulechka, Andrey G. Kabo, and Andrey V. Blokhin, November ,
2009, 113(44), 14742�14746.
[122] Y.U. Paulechka, G.J. Kabo, A.V. Blokhin, A.S. Shaplov, E.I. Lozinskaya, and
Ya.S. Vygodskii, January , 2007, 39(1), 158�166.
[123] Gennady J. Kabo, Yauheni U. Paulechka, Andrey G. Kabo, and Andrey V.
Blokhin, October , 2010, 42(10), 1292�1297.
[124] M. J. Frisch, G. W. Trucks, and H. B. Schlegel, Gaussian 03, Revision B.04;
Gaussian, Inc., Pittsburgh, PA, 2003.
[125] J. A. Montgomery, Jr., M. J. Frisch, J. W. Ochterski, and G. A. Petersson, April
, 2000, 112(15), 6532�6542.
[126] D.A. McQuarrie, Statistical Mechanics; Harper & Row, New York, 1976.
[127] A. Gross Boewing; Zur Kinetik und Reaktionstechnik der Synthese ionischer
Fluessigkeiten; PhD thesis, Uni-Bayreuth, 2006.
[128] A. Jess, A. Groÿe Böwing, and P. Wasserscheid, Chemie Ingenieur Technik, 2005,
77(9), 1430�1439.
[129] Daniel A. Waterkamp, Michael Heiland, Michael Schluter, Janelle C. Sauvageau,
Tom Beyersdor�, and Jorg Thoming, Green Chem., 2007, 9(10), 1084�1090.
[130] Shaozheng Hu, Anjie Wang, Holger Löwe, Xiang Li, Yao Wang, Changhong Li,
and Dong Yang, August , 2010, 162(1), 350�354.
[131] H. Loewe, R.D. Axinte, D. Breuch, C. Hofmann, J.H. Petersen, R. Pommersheim,
and A. Wang, October , 2010, 163(3), 429�437.
[132] John D. Holbrey, W. Matthew Reichert, Richard P. Swatloski, Grant A. Broker,
William R. Pitner, Kenneth R. Seddon, and Robin D. Rogers, Green Chem.,
2002, 4(5), 407�413.
[133] W.N. Hubbard, D.W. Scott, and G. Waddington, Experimental Thermochem-
istry; Interscience, New York, 1956.
109

[134] Clemens B. Minnich, Lukas Küpper, Marcel A. Liauw, and Lasse Greiner, August
, 2007, 126(1-2), 191�195.
[135] V. N. Emel'yanenko, S.P. Verevkin, Heintz A., and C. Schick, July , 2008,
112(27), 8095�8098.
[136] Vladimir N. Emel'yanenko, Sergey P. Verevkin, Andreas Heintz, Karsten Voss,
and Axel Schulz, July , 2009, 113(29), 9871�9876.
[137] Sergey P. Verevkin, Vladimir N. Emel'yanenko, Dzmitry H. Zaitsau, Andreas
Heintz, Chris D. Muzny, and Michael Frenkel, Phys. Chem. Chem. Phys., 2010,
12(45), 14994�15000.
[138] Dzmitry H. Zaitsau, Vladimir N. Emel'yanenko, Sergey P. Verevkin, and Andreas
Heintz, December , 2010, 55(12), 5896�5899.
[139] Otilia Mo, Manuel Yanez, Maria Victoria Roux, Pilar Jimenez, Juan Z. Dava-
los, Manuel A. V. Ribeiro da Silva, Maria das Dores M. C. Ribeiro da Silva,
M. Agostinha R. Matos, Luisa M. P. F. Amaral, Ana Sanchez-Migallon, Pilar
Cabildo, Rosa Claramunt, Jose Elguero, and Joel F. Liebman, November , 1999,
103(46), 9336�9344.
[140] G. Stridh and S. Sunner, February , 1975, 7(2), 161�168.
[141] L. Bjellerup, Acta Chem. Scand., 1961, 15, 231�241.
[142] H. Mackle and W.V. Steele, Trans. Faraday Soc., 1969, 65, 2053�2059.
[143] W. N. Hubbard, F. R. Frow, and Guy Waddington, August , 1961, 65(8), 1326�
1328.
[144] V. N. Emel'yanenko, S.P. Verevkin, Heintz A., J-A. Cor�eld, A. Deyko, K. Love-
lock, P. Licence, and G.R. Jones, September , 2008, 112(37), 11734�11742.
[145] Kevin R. J. Lovelock, Alexey Deyko, Jo-Anne Cor�eld, Peter N. Gooden, Peter
Licence, and Robert G. Jones, Chem. Eur. J. of Chem. Phys., 2009, 10(2),
337�340.
[146] Steven D. Chambreau, Ghanshyam L. Vaghjiani, Albert To, Christine Koh,
Daniel Strasser, Oleg Kostko, and Stephen R. Leone, January , 2010, 114(3),
1361�1367.
[147] S. P. Verevkin, Angewandte Chemie, 2008, 47, 5071�5074.
110

[148] W. S. Ohlinger, P. E. Klunzinger, B. J. Deppmeier, and W. J. Hehre, March ,
2009, 113(10), 2165�2175.
[149] S. P. Verevkin, V. N. Emel'yanenko, Pimerzin A. A., and Vishnevskaya E. E., J.
Phys. Chem. A, 2011, page in press.
[150] Ingemar Wadsoe, Acta Chem. Scand., 1968, 22, 2438�2444.
[151] Mati Karelson, Victor S. Lobanov, and Alan R. Katritzky, January , 1996, 96(3),
1027�1044.
[152] Alan R. Katritzky, Ritu Jain, Andre Lomaka, Ruslan Petrukhin, Mati Karelson,
Ann E. Visser, and Robin D. Rogers, March , 2002, 42(2), 225�231.
[153] Sydney W. Benson, Thermochemical kinetics: methods for the estimation of ther-
mochemical data and rate parameters; Wiley, 1976.
[154] N. Cohen, November , 1996, 25(6), 1411�1481.
[155] John M. Slattery, Corinne Daguenet, Paul J. Dyson, Thomas S. Schubert, and
Ingo Krossing, Angewandte Chemie, 2007, 119(28), 5480�5484.
[156] Eugen L. Krasnykh, Sergey P. Verevkin, Bohumir Koutek, and Jan Doubsky,
June , 2006, 38(6), 717�723.
[157] Vladimir N. Emel'yanenko, Sergey P. Verevkin, Bohumir Koutek, and Jan Doub-
sky, January , 2005, 37(1), 73�81.
[158] J.P. Pedley, R.D. Naylor, and S.P. Kirby, Thermochemical Data of Organic Com-
pounds; Ed. Chapmen and Hall, London, 1986.
[159] Dmitry Kulikov, Sergey P. Verevkin, and Andreas Heintz, December , 2001,
192(1-2), 187�207.
[160] Sergey P. Verevkin, Eugen L. Krasnykh, Tatiana V. Vasiltsova, Bohumir Koutek,
Jan Doubsky, and Andreas Heintz, April , 2003, 206(1-2), 331�339.
[161] Sergey P. Verevkin, September , 2002, 47(5), 1071�1097.
[162] R. Notario, O. Castano, J.-L. M. Abboud, R. Gomperts, L. M. Frutos, and
R. Palmeiro, December , 1999, 64(25), 9011�9014.
[163] Krishnan Raghavachari, Boris B. Stefanov, and Larry A. Curtiss, April , 1997,
106(16), 6764�6767.
[164] Herbert R. Kemme and Saul I. Kreps, January , 1969, 14(1), 98�102.
111

Acknowledgments
In this section I would like to express my deep acknowledge to people, who supported
creation of this work.
On the �rst hand I would like to thank Prof. Dr. Sergej Verevkin for his guidance, ideas
and remarkable support, which he gave me during his supervision. He encouraged me
all the time to go straight to the aim and to conduct a lot of interesting experiments.
Also I thank Prof. Dr. Christoph Schick for a nice working atmosphere in his group,
for interesting discussions and ideas. I deeply appreciate his availability for discussions
of any questions any time.
This work could not be possible without experiments conducted by Dr. Dzmitry Zait-
sau. His experimental results were of the greatest importance in interpretation of my
own measurements.
Quantum-chemical computations were also valuable. And I show my gratitude to Dr.
Vladimir Yemel'yanenko for his e�orts in such computations.
Additional acknowledgment should be addressed to Mr. Evgeny Shoifet for his advice
how to apply LATEX to creation of this manuscript.
All the members of the Polymer physics working group are acknowledged as well for
the help in dealing with experimental equipment.
Cordial thanks are addressed to my family and my friends for their moral support in
many situations.
112
Selbständigkeitserklärung
Ich versichere hiermit an Eides statt, daÿ ich die vorliegende Arbeit mit dem Titel:
Development of experimental methods for measurements of vaporization enthalpies of
Ionic Liquids
selbständig angefertigt und ohne fremde Hilfe verfaÿt habe, keine auÿer den von mir
angegebenen Hilfsmitteln und Quellen dazu verwendet habe und die den benutzten
Werken inhaltlich und wörtlich entnommenen Stellen als solche kenntlich gemacht habe.
113

Selbständigkeitserklärung
Ricardas Ralys
__________________________________________________
Persönliche Daten
Name Ricardas Ralys
Adresse Möllnerstr 11, 18109 Rostock
Geburtsdatum 26.08.1982
Geburtsort Kazachstanas
Familienstand ledig
__________________________________________________
Werdegang
09/89-08/98 Schule 18 in Uchta, Russische Föderation
09/98-08/00 Städtische Humanistisch-Pädagogische Lyzeum in Uchta, Rus-
sische Föderation
09/00-03/06 Chemiestudium an der Staatliches Technologiesches Institut
St. Petersburg (Technische Universität),
Diplomarbeit in der Fachrichtung Chemische Technologie von
natürlischen Energieträgern und Kohlensto�materialen,
Betreuer Prof. Dr. D.A. Rosenthal �Die Gewinnung von Bi-
tumen unterschiedlicher Sorten aus Asphaltteer (Gudron) und Asphaltit�
05/06-10/08 Promotionsstudium an der Staatliches Universität St. Peters-
burg auf dem Gebiet der Chemische Termodynamik und Kinetik,
Betreuer: Prof. Dr. A.M. Toikka
seit 11/08 Promotionsstudium an der Universität Rostock auf dem Gebiet
der Physikalische Chemie,
Betreuern: Prof. Dr. S.P. Verevkin und Prof. Dr. C. Schick
seit 01/11 Wissenschaftlicher Mitarbeiter an der Universität Rostock, im
Bereich Polymerphysik AG von Prof. Dr. C. Schick
114

Verö�entlichungen
Tim Peppel, Martin Köckerling, Monika Geppert-Rybczynska, Ricardas V. Ralys,
Jochen K. Lehmann, Sergey P. Verevkin, and Andreas Heintz, Angewandte Chemie
International Edition, 2010, 49 (39), 7116-7119
115