development of expanded thermoplastic … development of expanded thermoplastic polyurethane bead...
TRANSCRIPT

Development of Expanded Thermoplastic Polyurethane Bead Foams and Their Sintering Mechanism
by
Nemat Hossieny
A thesis submitted in conformity with the requirements for the degree of Doctor of Philosophy
Department of Mechanical and Industrial Engineering University of Toronto
© Copyright by Nemat Hossieny 2014
ii
Development of Expanded Thermoplastic Polyurethane Bead
Foams and Their Sintering Mechanism
Nemat Hossieny
Degree of Doctor of Philosophy
Department of Mechanical and Industrial Engineering
University of Toronto
2014
Abstract
Polymer bead foaming technology represents a breakthrough in the production of low density
plastic foamed components that have a complex geometrical structure and has helped to expand
the market for plastic foams by broadening their applications. In this research, the unique
microstructure of thermoplastic polyurethane (TPU) consisting of phase-separated hard segment
(HS) domains dispersed in the soft segment (SS) matrix has been utilized to develop expanded
TPU (E-TPU) bead foam with microcellular morphologies and also to create inter-bead sintering
into three dimensional products using steam-chest molding machine. The phase-separation and
crystallization behavior of the HS chains in the TPU microstructure was systematically studied in
the presence of dissolved gases and also by changing the microstructure of TPU by melt-
processing and addition of nano-/micro-sized additives. It was observed that the presence of gas
improved the phase separation (i.e. crystallization) of HSs and increased the overall crystallinity
of the TPU. It was also shown that by utilizing the HS crystalline domains, the overall foaming
behavior of TPU (i.e. cell nucleation and expansion ratio) can be significantly improved.
Moreover, the HS crystalline domains can be effective for both sintering of the beads as well
strengthening the individual beads to improve the property of the moulded part. It was also
observed that unlike other polymer bead foaming technologies, the E-TPU bead foaming

iii
sintering does not require formation of double melting-peak. The original broad melting peak
existing in the TPU microstructure due to the wide size distribution of HS crystallites can be
effectively utilized for the purpose of sintering as well as maintenance of the overall dimensional
stability of the moulded part.

iv
Acknowledgments
I would like to express my sincere gratitude and appreciation to my supervisor, Professor Chul B.
Park for providing me with the continuous guidance, enthusiasm and encouragement to assist me
in conducting a successful research. His visions, insights and suggestions have an everlasting
influence on my personal and professional growth. I feel extremely honored and fortunate to
have such a supportive mentor.
I would like to thank my Ph.D. committee members, Professor Hani Naguib and Professor Glenn
D. Hibbard for their valuable comments and suggestions offered during the course of my Ph.D.
research. Also, I am grateful for Professor Anup Ghosh and Professor Lidan You for their
valuable feedback in my Ph.D. final oral examination.
I am grateful of the financial support and scholarships from Ontario Graduate Scholarship
(OGS), Consortium of Cellular and Micro-Cellular Plastics (CCMCP), and Natural Sciences and
Engineering Research Council of Canada (NSERC) funding for Network for Innovative Plastics
Materials and Manufacturing Processes (NIPMMP).
My special thanks goes to Kara Kim for her kind assistance. I would like to extend my
acknowledgment to my colleagues and other members of Microcellular Plastic Manufacturing
Laboratory. Their advice, assistance and friendship have contributed to the successful completion
of my research. Special thanks goes to Dr. Changwei Zhu, Dr. Saleh Amani, Hasan Mahmood,
Dr. Reza Barzegari, Dr. Reza Nofar, Dr. Amir Ameli, Alireza Tabatabaei, Mehdi Saniei, Vahid
Shaayegan, Lun Howe Mark, Weidan Ding, Davoud Jahani, Ali Rizvi, Mo Xu, Sai Wang,
Raymond Chu, Dr. Peter Jung, Dr. Anson Wong, Hui Wang, Anne Zhao as well as everyone else
who helped me in my Ph.D. studies. I am also grateful for the many undergraduate students who
have assisted me during the course of my research. Also, to the administrative staff in our
department: Konstantine, Brenda, Ceaser and Jho: thank you for your kind assistance on the
various administrative matters.
Finally, my special thanks go to my family members in India and Canada for their support,
encouragement and patience throughout the course of this Ph.D. research.
v
Table of Contents
Acknowledgments .......................................................................................................................... iv
Table of Contents ............................................................................................................................ v
List of Tables .................................................................................................................................. x
List of Figures ................................................................................................................................ xi
List of Symbols ............................................................................................................................ xix
Chapter 1 Introduction .................................................................................................................... 1
1.1 Thermoplastic Foams .......................................................................................................... 1
1.2 Classification of Thermoplastic Foams .............................................................................. 1
1.3 Bead Foam Technology ...................................................................................................... 2
1.4 Research Motivation ........................................................................................................... 2
1.5 Objective of Thesis ............................................................................................................. 3
1.6 Organization of Thesis ........................................................................................................ 4
1.7 References ........................................................................................................................... 5
Chapter 2 Literature Review ........................................................................................................... 7
2 Literature Review ....................................................................................................................... 7
2.1 Basic and General Principles of Foaming ........................................................................... 7
2.1.1 Polymeric foams and foaming process ................................................................... 7
2.1.2 Polymeric foams and foaming process ................................................................... 8
2.1.3 Supercritical CO2 (scCO2) foaming ...................................................................... 11
2.2 Extrusion Foaming Technology ........................................................................................ 17
2.3 Injection Foam Molding Technology ............................................................................... 19
2.3.1 Conventional foam injection molding and microcellular injection molding
technologies .......................................................................................................... 19
2.3.2 Low-pressure and high-pressure foam injection molding technologies ............... 20
2.4 Rotational Foam Molding Technology ............................................................................. 22

vi
2.5 Bead Foam Molding Technology ..................................................................................... 24
2.5.1 Bead fabrication .................................................................................................... 25
2.5.2 Bead bonding ........................................................................................................ 26
2.5.3 Bead foam materials ............................................................................................. 33
2.6 Thermoplastic polyurethane .............................................................................................. 40
2.7 References ......................................................................................................................... 42
Chapter 3 Phase Separation and Crystallization of TPU in the Presence of Dissolved Gas:-
Effects of Processing, Nano-/Micron-Sized Additives and Gas Types ................................... 57
3 Phase Separation and Crystallization of TPU in the Presence of Dissolved Gas .................... 57
3.1 Introduction ....................................................................................................................... 57
3.2 Experimental Procedure .................................................................................................... 59
3.2.1 Materials ............................................................................................................... 59
3.2.2 Sample preparation ............................................................................................... 59
3.2.3 Rheological analysis ............................................................................................. 60
3.2.4 Atomic force microscopy ...................................................................................... 61
3.2.5 Crystallization analysis of TPU at ambient pressure ............................................ 61
3.2.6 Crystallization analysis of TPU at high-pressure with dissolved gas ................... 62
3.2.7 Phase separation and crystallization analysis using X-ray diffraction .................. 64
3.3 Results and Discussions .................................................................................................... 65
3.3.1 Rheological behavior of TPU and TPU nano-/micro-composites ........................ 65
3.3.2 Atomic force microscopy ...................................................................................... 68
3.3.3 Crystallization analysis of TPU at ambient pressure ............................................ 70
3.3.4 Crystallization analysis of TPU in presence of high-pressure dissolved gas ........ 78
3.3.5 WAXS analysis ..................................................................................................... 89
3.3.6 SAXS analysis ...................................................................................................... 91
3.4 Conclusions ....................................................................................................................... 92

vii
3.5 References ......................................................................................................................... 93
Chapter 4 Foaming Behavior of TPU in Simulation Foaming Setup:- Effects of HS
Crystallites, Nano-/Micro-Sized Additives, Blowing Agent Types and Foaming Methods.... 97
4 Foaming Behavior of TPU in Simulation Foaming Setup ....................................................... 97
4.1 Introduction ....................................................................................................................... 97
4.2 Experimental Procedure .................................................................................................... 99
4.2.1 Materials ............................................................................................................... 99
4.2.2 Sample preparation ............................................................................................... 99
4.2.3 Butane sorption experiment ................................................................................ 100
4.2.4 Foaming setup and procedure ............................................................................. 100
4.2.5 Foam characterization ......................................................................................... 102
4.3 Results and Discussion ................................................................................................... 103
4.3.1 Sorption of butane in TPU .................................................................................. 103
4.3.2 Effect of HS crystallites on foaming of TPU with butane .................................. 103
4.3.3 Foaming of TPU and TPU nano-clay nanocomposites with CO2 and water ...... 111
4.4 Conclusions ..................................................................................................................... 114
4.5 References ....................................................................................................................... 115
Chapter 5 Modification of Steam-Chest Molding Technology .................................................. 118
5 Modification of Steam-Chest Molding Technology .............................................................. 118
5.1 Introduction ..................................................................................................................... 118
5.2 Theoretical Background .................................................................................................. 119
5.3 Modifications on Steam-Chest Molding Machine to Incorporate Hot Air ..................... 122
5.4 Experimentation .............................................................................................................. 123
5.4.1 Materials ............................................................................................................. 123
5.4.2 Steam-chest molding setup and experimental design ......................................... 124
5.4.3 Surface quality characterization .......................................................................... 125

viii
5.4.4 Tensile property characterization ........................................................................ 126
5.4.5 Thermal property characterization ...................................................................... 127
5.5 Results and Discussion ................................................................................................... 127
5.5.1 Effect of hot air on the steaming time ................................................................. 127
5.5.2 Effect of hot air on the total processing temperature .......................................... 128
5.5.3 Effect of hot air flow rate on surface properties ................................................. 131
5.5.4 Effect of hot air temperature on surface properties ............................................ 135
5.5.5 Effect of hot air pressure on surface properties .................................................. 135
5.5.6 Thermal properties of molded EPP samples ....................................................... 137
5.5.7 Effect of hot air on tensile properties .................................................................. 139
5.6 Conclusions ..................................................................................................................... 141
5.7 References ....................................................................................................................... 142
Chapter 6 Processing of TPU Bead Foams In Lab-Scale Bead Foaming System and Sintering
Mechanism With Steam-Chest Molding Technology ............................................................ 145
6 Production and Sintering of E-TPU Beads ............................................................................ 145
6.1 Introduction ..................................................................................................................... 145
6.2 Materials and Experimental Procedure ........................................................................... 146
6.2.1 Materials ............................................................................................................. 146
6.2.2 Lab-scale bead foaming setup ............................................................................. 147
6.2.3 Expanded TPU (E-TPU) bead foaming procedure ............................................. 147
6.2.4 Thermal behavior of E-TPU beads ..................................................................... 148
6.2.5 Gel Permeation Chromatography (GPC) ............................................................ 148
6.2.6 Water up-take analysis ........................................................................................ 149
6.2.7 Foam characterization ......................................................................................... 149
6.2.8 Steam-chest molding of E-TPU beads ................................................................ 150
6.2.9 Mechanical property measurement ..................................................................... 150

ix
6.3 Results and Discussions .................................................................................................. 151
6.3.1 Foaming behavior of E-TPU beads ..................................................................... 151
6.3.2 Characterization of TPU ..................................................................................... 155
6.3.3 Thermal behavior of E-TPU bead foams ............................................................ 157
6.3.4 GPC analysis ....................................................................................................... 161
6.3.5 Sintering of E-TPU beads with steam-chest molding machine .......................... 162
6.4 Conclusions ..................................................................................................................... 176
6.5 References ....................................................................................................................... 177
Chapter 7 Conclusion and Future Recommendations ................................................................. 178
7 Conclusion and Future Recommendations............................................................................. 178
7.1 Summary of Major Contributions ................................................................................... 178
7.1.1 Effect of processing, nano-/micro-sized additives and dissolved gas on the
phase separation and crystallization behavior of TPU ........................................ 178
7.1.2 Effect of HS crystallites on the foaming behavior of TPU ................................. 179
7.1.3 Effect of HS crystallites on the foaming behavior of TPU ................................. 180
7.1.4 Lab-scale autoclave processing of E-TPU beads and sintering with steam-
chest molding machine ....................................................................................... 181
7.2 Summary of Major Contributions (Publications) ........................................................... 182
7.3 Recommendations for Future Research .......................................................................... 183

x
List of Tables
Table 3-1 Data of DSC measurements at ambient pressure (1bar) ............................................... 76
Table 3-2 Comparison of PR-TPU’s DSC measurements at ambient pressure (1 bar) and butane
pressure (55 bar) ........................................................................................................................... 85
Table 3-3Comparison of TPU-1GMS sample DSC measurements at ambient pressure (1 bar) and
butane pressure (55 bar) ................................................................................................................ 89
Table 5-1 Experimental parameters and design variables .......................................................... 125
Table 5-2 Experimental matrix ................................................................................................... 125
Table 5-3 Melting points and crystallinity of molded EPP samples at fix and moving mold
surface at different processing conditions of pure steam and steam with hot air ....................... 138
Table 6-1 Different E-TPU beads and conditions (steam pressure/time) used to produce molded
E-TPU samples ........................................................................................................................... 163
Table 6-2 Different conditions (steam pressure/time) used to produce molded E-TPU-90A
samples ........................................................................................................................................ 163

xi
List of Figures
Figure 2-1 Microcellular foaming process ...................................................................................... 9
Figure 2-2 Schematic pressure-temperature phase diagram for a pure component showing the
supercritical fluid (SCF) region .................................................................................................... 12
Figure 2-3 Methods for the production of expandable and expanded bead foams ....................... 25
Figure 2-4 Schematic of under-water pelletization as a following unit for foam extrusion ......... 26
Figure 2-5 Bead foam processing in a steam-chest moulding machine: 1: closing and filling the
mould, 2: steaming, 3: cooling, 4: ejection of moulded part ........................................................ 27
Figure 2-6 Steps for steaming bead foams: 1: purging, 2: cross-steam, 3: autoclave steaming ... 28
Figure 2-7 Concept of the crack filling method ............................................................................ 30
Figure 2-8 Concept of the pressure filling method ....................................................................... 30
Figure 2-9 A typical double-peak melting behavior of foamed beads .......................................... 32
Figure 2-10 SEM micrograph of a cross-section of an EPP bead made with autoclave foaming
setup .............................................................................................................................................. 36
Figure 2-11 Failure mechanism: a) inter-bead, b) intra-bead ....................................................... 39
Figure 3-1 Schematic of the saturation setup with butane ............................................................ 64
Figure 3-2 Complex shear viscosity plot of AR-TPU and PR-TPU ............................................. 65
Figure 3-3 Complex shear viscosity plot of AR-TPU, PR-TPU, TPU-1GMS, TPU-1NCl and
TPU-1NSi ..................................................................................................................................... 66
Figure 3-4 Time sweep rheological curves of AR-TPU and PR-TPU .......................................... 67
Figure 3-5 Time sweep rheological curves of AR-TPU, PR-TPU, TPU-1GMS, TPU-1NCl and
TPU-1NSi ..................................................................................................................................... 67

xii
Figure 3-6 AFM images: (a) AR-TPU, (b) PR-TPU; Scale: 5 μm side length in both micrographs
....................................................................................................................................................... 69
Figure 3-7 AFM image of PR-TPU after saturating at 160°C with butane at 55 bar pressure;
Scale: 5 μm side length ................................................................................................................. 69
Figure 3-8 AFM image of TPU-1GMS; Scale: 5 μm side length in the micrograph ................... 69
Figure 3-9 DSC curves of the AR-TPU and PR-TPU samples .................................................... 71
Figure 3-10 DSC cooling curves of PR-TPU and TPU-GMS samples ........................................ 72
Figure 3-11 DSC melting curves of PR-TPU and TPU-GMS samples: (a) regular plot, (b)
magnified plot for high temperatures ............................................................................................ 72
Figure 3-12 DSC curves of PR-TPU and TPU-NSi samples: (a) exotherms, (b) endotherms ..... 73
Figure 3-13 DSC curves of PR-TPU and TPU-NCl samples: (a) exotherms, (b) endotherms ..... 73
Figure 3-14 DSC endotherms of PR-TPU after annealing at various temperatures at ambient
pressure (1 bar) ............................................................................................................................. 75
Figure 3-15 Effect of annealing at high temperature producing low temperature peak (marked
with an arrow) after cooling .......................................................................................................... 75
Figure 3-16 DSC endotherm of AR-TPU and PR-TPU after annealing at 180°C for 60 min ...... 76
Figure 3-17 DSC endotherms of PR-TPU and TPU-GMS post annealing at 180°C .................... 77
Figure 3-18 DSC endotherms of PR-TPU after annealing at different saturation temperature and
time ............................................................................................................................................... 78
Figure 3-19 Non-isothermal melt crystallization behavior of TPU at different cooling rates: (a)
ambient pressure (1 bar), (b) CO2 pressure (45 bar) .................................................................... 79
Figure 3-20 Heat of crystallization of PR-TPU samples at different CO2 pressure and cooled
from the melt with different cooling rates .................................................................................... 80

xiii
Figure 3-21 Non-isothermal melt crystallization behavior of TPU in presence of different fillers
and in the presence of CO2 pressure (45 bar) ............................................................................... 80
Figure 3-22 DSC melting endotherms after annealing over a range of CO2 pressures at a fixed
saturation temperature and time for (a) PR-70A and (b) PR-90A ................................................ 81
Figure 3-23 DSC melting endotherms after annealing at 60 bar CO2 pressure for 30 min at a
range of saturation temperatures for (a) PR-70A and (b) PR-90A ............................................... 82
Figure 3-24 DSC melting endotherms after annealing over a range of saturation times at a fixed
saturation pressure and temperature for (a) PR-70A and (b) PR-90A .......................................... 82
Figure 3-25 .(a) Comparison of DSC endotherm of AR-TPU and PR-TPU after annealing at
atmospheric pressure (w/o butane) and 55 bar butane; (b) total heat of fusion of AR-TPU and
PR-TPU after saturation with butane. ........................................................................................... 84
Figure 3-26 Comparison of DSC endotherm of AR-TPU and PR-TPU after annealing at
atmospheric pressure (w/o butane) and 55 bar butane .................................................................. 85
Figure 3-27 Tg after annealing in ambient pressure (1 bar) and in the presence of butane (55 bar).
....................................................................................................................................................... 85
Figure 3-28 Comparison of DSC melting endotherm of PR-TPU and TPU-1GMS after annealing
at ambient pressure (1bar) and in the presence of butane (55 bar) at 150°C for 60 min .............. 86
Figure 3-29 ΔHTot of PR-TPU and TPU-1GMS after annealing at ambient pressure (1bar) and in
the presence of butane (55 bar) for 60 min over a range of annealing temperature’s .................. 87
Figure 3-30 (a) Total heat of fusion (ΔHTot) of PR-TPU and TPU-1GMS over range of butane
pressure after annealing at 150°C for 60 min, (b) ΔHTm-low values of PR-TPU and TPU-1GMS
over range of butane pressure after annealing at 150°C for 60 min ............................................. 87
Figure 3-31 ΔHTm-high1 of PR-TPU and TPU-1GMS annealed under ambient pressure and butane
pressure of 55 bar over a range of annealing temperature’s for 60 min ....................................... 88
Figure 3-32 The Tm-high1 variations of PR-TPU and TPU-1GMS samples versus butane pressures
saturated at 165°C for 60 min ....................................................................................................... 88

xiv
Figure 3-33 Tg of PR-TPU and TPU-1GMS after annealing at ambient pressure and various
butane pressures ............................................................................................................................ 89
Figure 3-34 Comparison of XRD profiles of PR-TPU and TPU-1GMS ...................................... 90
Figure 3-35 Comparison of XRD profiles of TPU-1GMS annealed at ambient pressure (1bar) and
various butane pressures at a saturation temperature of 150°C .................................................... 91
Figure 3-36 SAXS profiles of TPU-1GMS samples after annealing at different pressure’s at
150°C ............................................................................................................................................ 92
Figure 4-1 Schematic of the simulation foaming setup with butane .......................................... 101
Figure 4-2 Schematic of the TPU and TPU nanocomposite foaming setup with water and CO2
..................................................................................................................................................... 102
Figure 4-3 The solubility of butane in AR-TPU and PR-TPU at 20.7 bar ................................. 103
Figure 4-4 Foam morphology of TPU prepared at 55 bar and 150ºC, 160ºC, and 165ºC: (a), (b),
and (c) AR-TPU; (d), (e), and (f) PR-TPU; Scale bars: 10 µm .................................................. 104
Figure 4-5 Foam morphology of TPU prepared at 103 bar and 150ºC, 160ºC and 165ºC: (a), (b),
and (c) AR-TPU; (d), (e), and (f) PR-TPU; Scale bars: 10 µm .................................................. 104
Figure 4-6 Characterization of AR-TPU and PR-TPU foams: (a) average cell size and (b) cell
densities ....................................................................................................................................... 106
Figure 4-7 Schematic of TPU/butane morphology displaying the possible broad HS length
distribution .................................................................................................................................. 107
Figure 4-8 Expansion ratios of AR-TPU and PR-TPU foams .................................................... 108
Figure 4-9 Foam morphology under 55 bar butane pressure at different saturation temperatures.
(a-d) PR-TPU; (e-h) TPU-05GMS; (i-l) TPU-1GMS ................................................................. 109
Figure 4-10 Cell densities of PR-TPU and TPU-GMS foams .................................................... 109
Figure 4-11 Expansion ratios of PR-TPU and TPU-GMS foams ............................................... 111

xv
Figure 4-12 Comparison of DSC melting endotherm of TPU-1NCl after annealing at ambient
pressure (1bar), in the presence of CO2 (55 bar) and in the presence of CO2 and water at 150°C
for 60 min .................................................................................................................................... 112
Figure 4-13 Foam morphology of PR-TPU prepared at 55 bar and 150°C: (a) CO2 and (b)
CO2+water .................................................................................................................................. 113
Figure 4-14 Foam morphology of TPU-1NCl prepared at 55 bar and 150°C: (a) CO2 and (b)
CO2+water .................................................................................................................................. 114
Figure 5-1 Double-peak melting behavior of EPP foamed beads ............................................... 120
Figure 5-2 A schematic of modified steam chest molding machine with hot air supply ............ 123
Figure 5-3 Rectangular area showing the location of line scans to characterize the surface
property on fixed mold and moving mold surface of molded EPP sample ................................ 126
Figure 5-4 Schematic of specimen preparation for tensile tests ................................................. 127
Figure 5-5 Effect of hot air and its flow rate on the total steaming time .................................... 128
Figure 5-6 Effect of hot air and its flow rate on the processing temperature during (a)1st
steaming cycle and (b) 2nd steaming cycle. (c) A schematic illustrating the locations where the
processing temperatures of T1 and T3 were measured. .............................................................. 130
Figure 5-7 Effect of hot air and its pressure on the processing temperature during (a) 1st
steaming and (b) 2nd steaming cycles ........................................................................................ 131
Figure 5-8 Comparison between actual line profile values measured over the scan length of EPP
parts molded with (a) pure steam and (b) steam mixed with hot air at 120 l/min ...................... 132
Figure 5-9 Effect of hot air and its flow rate on (a) Ra and (b) Rz surface roughness parameters
..................................................................................................................................................... 132
Figure 5-10 Effect of hot air and its flow rate on the waviness (Wa) values of molded EPP’s
surface ......................................................................................................................................... 133

xvi
Figure 5-11 Fixed mold surface micro-topography of EPP bead molded products using (a) pure
steam and (b) steam mixed with hot air with an air flow rate of 100 l/min ................................ 133
Figure 5-12 SEM micrographs of the cut surfaces of fixed mold surface of EPP samples
produced using steam and steam mixed with hot air at different flow rates (a) pure steam, (b) 80
l/min, and (c) 120 l/min .............................................................................................................. 134
Figure 5-13 Effect of hot air temperature on (a) Ra and (b) Rz surface roughness parameters . 135
Figure 5-14 Effect of hot air pressure on (a) Ra and (b) Rz surface roughness parameters ....... 136
Figure 5-15 Effect of hot air pressure on the waviness (Wa) values of molded EPP’s surface . 136
Figure 5-16 DSC thermographs of molded EPP samples (a) fixed mold surface and (b) moving
mold surface ................................................................................................................................ 138
Figure 5-17 Tensile strengths of molded EPP samples produced with pure steam and steam
mixed with hot air at different flow rates .................................................................................... 139
Figure 5-18 Tensile strengths of molded EPP samples produced with pure steam and steam
mixed with hot air at different temperatures ............................................................................... 140
Figure 5-19 Tensile strengths of molded EPP samples produced with pure steam and steam
mixed with hot air at different pressures ..................................................................................... 141
Figure 6-1 A schematic of autoclave bead foaming set-up ......................................................... 147
Figure 6-2 Steam-chest molding procedure ................................................................................ 151
Figure 6-3 Morphology of AR-TPU-90A beads at 55 bar CO2 pressure: (a), (b) without water;
(c), (d) with water ....................................................................................................................... 152
Figure 6-4 Morphology of AR-TPU-90A beads processed without water: (a), (b), (c) 55 bar CO2;
(d), (e), (f) 83 bar CO2 ................................................................................................................ 153
Figure 6-5 Morphology of AR-TPU-90A beads processed with water: (a), (b) 55 bar CO2; (c), (d)
83 bar CO2 ................................................................................................................................... 154

xvii
Figure 6-6 Morphology of AR-TPU-70A beads processed with CO2 pressure of 55 bar at 110°C:
(a) pressure-drop method (b) temperature-jump method ............................................................ 155
Figure 6-7 Morphology of AR-TPU-90A beads processed with CO2 pressure of 55 bar at 140°C:
(a) pressure-drop method (b) temperature-jump method ............................................................ 155
Figure 6-8 Expansion ratio of E-TPU beads produced with different methods: (a) AR-TPU-70A,
(b) AR-TPU-90A ........................................................................................................................ 156
Figure 6-9 Expansion ratio of different TPU foam beads processed with temperature-jump
method ......................................................................................................................................... 157
Figure 6-10 DSC melting curves of AR-TPU-90A after annealing at 150°C for 30 min with
different annealing conditions ..................................................................................................... 159
Figure 6-11 DSC melting curves of AR-TPU-90A bead foams processed with pressure-drop
method with water over a range of saturation temperature with 55 bar CO2 pressure .............. 160
Figure 6-12 DSC melting curves of AR-TPU-70A bead foams processed with different methods
..................................................................................................................................................... 161
Figure 6-13 Average molecular weight of the E-TPU beads processed with pressure-drop in the
presence of water: (a) AR-TPU-70A, (b) AR-TPU-90A ............................................................ 162
Figure 6-14 Actual E-TPU beads and their cellular morphologies: (a), (b) E-TPU-70A; (c), (d) E-
TPU-80A; (e), (f) E-TPU-90A .................................................................................................... 164
Figure 6-15 E-TPU-90A beads molded over range of steam pressure; (a) 1.5 bar, (b) 2 bar, (c)
2.2 bar, (d) 2.4 bar ....................................................................................................................... 165
Figure 6-16 Fractured E-TPU-90A bead foam molded part manufactured with 2.2 bar steam
pressure ....................................................................................................................................... 165
Figure 6-17 Water uptake percentage in E-TPU-90A beads over a range of temperature’s and
times ............................................................................................................................................ 167

xviii
Figure 6-18 E-TPU-90A beads soaked with water molded at 2 bar steam pressure ; (a) 50°C
water temperature, (b) 70°C water temperature .......................................................................... 167
Figure 6-19 Steam-chest molded E-TPU bead foams: (a) E-TPU-70A, (b) E-TPU-80A, (c) E-
TPU-90A ..................................................................................................................................... 168
Figure 6-20 Tensile property testing of E-TPU-70A molded sample: (a) loaded sample, (b)
fractured sample .......................................................................................................................... 168
Figure 6-21 Stress v/s strain curves of the samples: (a) E-TPU-70A, (b) E-TPU-80A .............. 169
Figure 6-22 Comparison of Young’s modulus and tensile strength of E-TPU, EPP and EPLA
molded samples: (a) Young’s modulus, (b) Tensile strength ..................................................... 170
Figure 6-23 SEM micrographs of the surfaces, the cut surfaces, and the fracture surfaces of
molded E-TPU-70A and E-TPU-80A samples ........................................................................... 172
Figure 6-24 DSC melting peak comparisons of neat-TPU, foamed E-TPU beads and molded E-
TPU beads: (a) E-TPU-70A, (b) E-TPU-80A, (c) E-TPU-90A .................................................. 175

xix
List of Symbols
CBA = Chemical blowing agents
PBA = Physical blowing agents
EPS = Expandable polystyrene
EPP = Expanded polypropylene
HFCs = Hydrofluorocarbons
PS = Polystyrene
PP = Polypropylene
Cs = Solubility of gas in the polymer (cm3/g or ggas/gpolymer)
H = Henry's law constant (cm3 [STP]/g-Pa)
ps = Saturation pressure
R = Gas constant (J/K)
Ho = Solubility coefficient constant (cm3 [STP]/g-Pa)
∆Hs = Molar heat of sorption (J)
D = Diffusivity
Do = Diffusivity coefficient constant (cm2/s)
W = Required work to generate a bubble
γpb = Surface tension
Ab = Surface area
Vb = Bubble of volume
∆ = Gibbs free energy in homogeneous nucleation
Co = Concentration of gas molecules in solution
fo = Frequency factor of gas molecules joining the nucleus

xx
k = Boltzman constant
r = Critical radius
σ = Surface tension
∆p = Pressure difference between the bubble and the melt.
N1 = Heterogeneous nucleation rate
∆ = Gibbs free energy in heterogeneous nucleation
= Surface energy of the polymer-bubble interface
∆P = Gas pressure used to diffuse the gas into the polymer
θ = Wetting angle of the polymer-additive gas interface.
dP/dt = Pressure drop rate
Psat = Saturation pressure
ρf = Foam density , g/cm3
ρ = Density of unfoamed sample, g/cm3
M = Mass of foam sample, g
V = Volume of foam sample, cm3
Φ = Volume expansion ratio,
No = Cell density
N = Number of bubbles in the micrograph
a = Area of the micrograph
M = Magnification factor of the micrograph
ΔHT = Experimental heat of fusion heat of fusion

1
Chapter 1 Introduction
1.1 Thermoplastic Foams
Thermoplastic foams consist of at least two phases: solid polymer matrix and a gaseous phase
that contributes to the formation of cells [1]. The manufactured polymer foam products possess
unique characteristics compared to their solid counterparts, such as higher specific tensile
strength, higher toughness, and superior thermal and sound insulation properties [2-6].
Additionally, polymer foamed parts are much lighter than their solid counterparts. Hence
thermoplastic foams keep stimulating manufacturers and users of foams to find new lucrative
application areas.
The main processing methods to produce thermoplastic foams are autoclave foaming [7-9],
extrusion foaming [10-16], injection foam molding [17-20], rotational molding [21-23], and
compression foam molding [24,25]. The two most popular methods are extrusion foaming and
injection foam molding due to their higher productivity. On the other hand, autoclave or the
batch foaming results in high quality foams.
1.2 Classification of Thermoplastic Foams
Generally thermoplastic foams are classified based on the cell size, the foam density and the cell
structure. Firstly, depending on cell size and cell density, thermoplastic foams are classified as
conventional foams, fine-celled foams, microcellular foams and nano-cellular foams [26]. The
foams are also classified based on the foam density as; high density foams (i.e. less than 4 times
expansion), medium density foams (i.e. between 4 and 10 times expansion), and low-density
foams (i.e. more than 10 times expansion). High density foams are usually used for construction
materials, furniture, and transportation products, whereas low-density foams are mainly used for
impact absorption, sound insulation, and packaging materials [27].To classify thermoplastic
foams based on the cell structure, they can be divided into the open-cell foams and the closed-
cell foams. The open-cell foams feature inter-connected cells. On the other hand, the closed-cell
foams have no openings in cell walls.

2
1.3 Bead Foam Technology
Foam extrusion and injection molding are the two predominated continuous processes in plastic
foam industry. In general, the process of foam extrusion allows production of two-dimensional
foam profiles of various densities and foam expansions. On the other hand, with the injection
foam molding, it is possible to fabricate foam and thin-wall foam components in complex, three-
dimensional shapes. Nevertheless, the volume expansion ratio for parts made from injection
foam molding is often limited to two to three-fold. In contrast to foam extrusion and injection
molding, the bead foaming technology is a manufacturing process which involves molding and
sintering of tiny foamed plastic beads into plastic foam components. This process can produce
three-dimensionally shaped foam products with ultra low densities. In this aspect, the bead
foaming technology is considered to be a highly promising alternative which possesses both the
foam expansion of extrusion foaming and the part geometry complexity of injection foam
molding.
The technology of bead foam molding, in general, comprises of two main steps: bead fabrication
and bead molding. There are two main approaches for manufacturing beads: batch autoclave
foaming and continuous extrusion foaming. The batch autoclave foaming approach is currently
being practiced in industry to fabricated foamed beads in batches, and bead foam products are
manufactured through a steam chest bead molding process with the foamed beads. A continuous
process which incorporates both the bead fabrication and molding processes has received great
attention from the plastic foam industry because it will introduce a cost-effective, continuous
foam process for ultra-low-density foam products with complex three-dimensional geometries.
In addition, such a cost-effective, continuous process will encourage the development of bead
foam with other polymeric materials tailored for particular applications.
1.4 Research Motivation
Although polymer bead foaming technology has provided a breakthrough in the production of
low-density foamed components with complex geometrical structure, there are only a few
polymer which have been successfully processed into expanded bead foams and their products.
One of the major issues is that every polymer beads may not fulfill the requirements of being
able to be welded into three dimensional parts using steam-chest molding machine. The sintering
technique used in expanded polypropylene (EPP) provided a promising solution for sintering
issues of polymer beads. In EPP, a double melting-peak is essential to have a balance between a

3
stable cellular structure and a proper inter-bead sintering. The low-temperature melting peak
formed during cooling as foaming occurs is used for bonding of the EPP beads. Whereas, the
high-temperature melting peak formed during the isothermal saturation step in a autoclave bead
foaming process are utilized to maintain the bead geometry even at the high temperature required
for good sintering.
The unique chemical structure of thermoplastic polyurethane (TPU) consisting of phase-
separated hard segment (HS) domains dispersed in the soft segment (SS) matrix can be
effectively utilized to develop expanded TPU (E-TPU) beads. Furthermore, it would be
necessary to investigate the desirable crystal melting structure required for a good sintering of
the E-TPU beads with steam-chest molding machine. The processing of E-TPU beads and its
three dimensional parts have a great potential to replace many important applications using
thermoset polyurethane, which are non-recyclable and are concern to the environment. The
knowledge would also help in utilizing other thermoplastic elastomeric materials for bead
foaming applications.
1.5 Objective of Thesis
The main objective of this thesis is to develop E-TPU bead foams with a desirable crystal
melting structure and foam morphology for molding with steam-chest molding machine. The
importance of achieving a desirable crystal melting peak is firstly to create a strong sintering
between the expanded beads in the molded E-TPU foam products by utilizing the crystals. The
crystals will also be beneficial to improve the foam morphology of the beads by increasing the
heterogeneous cell nucleation mechanism via the pressure variation around the existing crystals
or the crystals generated during the processing of the E-TPU bead foams. TPU are thermoplastic
elastomeric materials with a very unique crystallization behavior. It should also be noted that the
crystallization behavior of TPU is quite complicated and is significantly affected by the
processing conditions (i.e. melting and subsequent cooling from melt).
For this purpose, first of all, the crystallization behavior of TPU is extensively investigated by
varying the processing condition, by adding nano/-micron additives and in the presence of
dissolved gas at elevated pressures using regular DSC and HP-DSC.

4
Subsequently, TPU bead foams are processed in a simulation autoclave foaming chamber and in
a lab-scale bead foaming chamber. The effects of modifying the crystalline structure of TPU
during the foaming process and the parameters (i.e. saturation temperature, saturation pressure
and gas type) which affect this change are investigated in detail. Eventually, the effects of the
crystalline domains on the resultant E-TPU bead foam properties such as morphology and
thermal behavior are investigated.
Finally, the E-TPU bead foams are molded using a steam-chest molding machine and the
mechanism behind the bead-to-bead sintering for elastomeric bead foam materials is verified and
presented in detail. The tensile property of the molded E-TPU bead foam products is measured to
investigate the sintering behavior of the beads.
1.6 Organization of Thesis
This thesis is organized into 7 chapters:
Chapter 1 presents an introduction to thermoplastic foams and their classification, brief
introduction on bead foaming method is described and the motivation and objectives of the thesis
is systematically described.
Chapter 2 presents a detailed literature review and the theoretical background of the thesis topics.
The various foaming technologies are discussed and special emphasis is given to bead foaming
technology, the variety of polymeric materials commercially processed using bead foaming
technology and emerging bead foam materials. A thorough review on the crystallization behavior
of TPU is also presented.
Chapter 3 extensively present’s the effects of melt-processing, the addition of nano/-micron
additives and the presence of dissolved gas on the crystallization behavior of TPU studied using
regular DSC and HP-DSC.
Chapter 4 demonstrated the effect of crystals on the foaming behavior of TPU with different
physical blowing agents. The results from chapter 3 are correlated to the foams processed in
Chapter 4.
5
Chapter 5 shows the modifications performed to the existing steam-chest molding machine by
addition of hot air to the steam supply. This was done to reduce the sensitivity of the temperature
to the pressure variation inside the mold of the steam-chest molding machine. The effects of the
flow rate, the pressure and the temperature of the hot air on the surface roughness, thermal
properties, and mechanical properties of the molded products were studied.
Chapter 6 demonstrates the manufacturing of E-TPU bead foams with different foaming
techniques and the effect of foaming on the crystalline domains in the TPU microstructure.
The sintering of the E-TPU beads was achieved with steam-chest molding machine and the
mechanism behind the sintering was investigated. To verify the effectiveness of the sintering
between the E-TPU beads, the tensile property was measured and reported in this chapter.
Chapter 7 provides a summary of major contribution and conclusion remarks as well as the
recommendations for the future research.
1.7 References
[1] D. Klempner, and V. Sendijarevic, Handbook of Polymeric Foams and Foam Technology,
2nd Edition, Hanser Publishers (2004)
[2] D. F.Baldwin, and N. P. Suh, SPE ANTEC Tech. Papers, 38, 1503 (1992)
[3] D. I. Collias, D. G. Baird, and R. J. M. Borggreve, Polymer, 35, 3978 (1994)
[4] D. I. Collias, and D. G. Baird, Polym. Eng. Sci., 35, 1167 (1995)
[5] K. A. Seeler, and V. Kumar, Journal of Reinforced Plastics and Composites, 12, 359
(1993)
[6] L. M. Matuana, C. B. Park, and J. J. Balantinecz, Cellular Polymers, 17, 1 (1998)
[7] L. Glicksman, Notes from MIT Summer Program 4.10S, Cambridge, MA (1992)
[8] J. Reignier, J. Tatiboue¨t, and R. Gendron, Polymer, 47, 5012 (2006)
[9] M. Shimbo, D. F. Baldwin, and N. P. Suh, Polym. Eng. Sci., 35, 1387 (1995).
[10] J. H. Schut, Plastics Technology, July (2001)
[11] D. I. Collias, and D. G. Baird, R. J. M. Borggreve, Polymer, 25 3978 (1994)

6
[12] D. I. Collias, and D. G. Baird, Polym. Eng. Sci., 35, 1167 (1995)
[13] E. P. Giannelis, Adv. Mater., 8, 29 (1996)
[14] M. Okamoto, P. H. Nam, P. Maiti, T. Kotaka, N. Hasegawa, and A. Usuki, Nanoletters, 1,
295 (2001)
[15] X. Han, C. Zeng, L. J. Lee, K. W. Kurt, D. L. Tomasko, SPE ANTEC Tech. Papers, 48,
Paper #354 (2002)
[16] M. Kwak, M. Lee, and B. K. Lee, SPE ANTEC Tech. Papers, 48, Paper #381 (2002)
[17] C.A. Villamizar, C. D. Han, Polym. Eng. Sci.,18, 699 (1978)
[18] D. Maldas, B. V. Kokta, and C. Daneault, J. Vinyl. Technol., 11, 2 (1989)
[19] N. E. Zafeiropoluos, C. A. Baillie, and F. L. Matthews, Adv. Compos. Lett., 9, 291 (2000)
[20] G. Cantero, A. Arbelaiz, R. Llano-Ponte, and I. Mondragon, Comp. Sci. Techno. 63 1247
(2003)
[21] A. Arbelaiz, B. Fernandez, G. Cantero, R. Llano-Ponte, A. Valea, and I. Mondragon,
Compos. Part A, 36, 1637 (2005)
[22] P. Balasuriya, L. Ye, Y. Mai, and J. Wu, J. Appl. Polym. Sci., 83, 2505 (2002)
[23] B. V. Kokta, D. Maldas, C. Daneault, and P. Beland, Poly. Plast. Technol. Eng., 29, 87
(1990)
[24] B. N. Kokta, D. Maldas, C. Daneault, and P. Beland, J. Vinyl. Technol., 12, 146 (1990)
[25] K. L. Pickering, A. Abdalla, C. Ji, A. G. McDonald, and R.A. Franich, Composites: Part A,
34, 915 (2003)
[26] K. C. Frisch, J. H. Saunders, Plastics Foams, Marcel Dekker Inc., New York (1972)
[27] J. L. Throne, Thermoplastic Foams, Sherwood Publishers, Ohio (1996)
7
Chapter 2 Literature Review
2 Literature Review
2.1 Basic and General Principles of Foaming
2.1.1 Polymeric foams and foaming process
Polymeric foams [1, 2] are lightweight structures with a gas phase dispersed in the form of
bubbles. They have been widely used in various applications such as cushioning, insulation,
packaging and absorbency. Foams with interconnected pore structures are being studied recently
for their applications in tissue engineering as scaffolds for cell attachment and growth.
Various polymers have been used for foam applications, e.g., polyurethane (PU), polystyrene
(PS), polyolefin (polyethylene (PE) and polypropylene (PP)), poly(vinyl chloride) (PVC),
polycarbonate (PC), just name a few. In US market PU occupies the largest market share (53%)
in terms of the amount consumed, while PS is the second (26%).
Polymeric foams can be classified depending on their composition, cell morphology and physical
properties into two categories, rigid or flexible foams. Rigid foams are used in applications such
as building insulation, appliances, transportation, packaging, furniture, flotation and cushion, and
food and drink containers, whereas flexible foams are used as furniture, transportation, bedding,
carpet underlay, textile, gaskets, sports applications, shock and sound attenuation, and shoes.
Based on the size of the foam cells, polymer foams are classified as macrocellular (>100µm),
microcellular (1-100 µm), ultra-microcellular (0.1-1 µm) and nano-cellular (0.1-100nm).
Polymer foams can also be defined as either closed cell or open cell foams. A closed cell has the
foam cells isolated from each other by complete cell walls. Whereas, in open cell foams, cell
walls are broken and the structure consists of ribs and struts. Generally, closed cell foams have
lower permeability, leading to better insulation properties. Open cell foams, on the other hand,
provide better absorptive capability.

8
The foaming process consists of a system composing polymer (or monomer), blowing agents,
nucleating agent, and other necessary additives (fire retardants, surfactant, catalyst etc). Blowing
agent plays a vital role in the foam cell morphology.
Typically there are two types of blowing agents: physical blowing agents and chemical blowing
agents. Chemical blowing agents produce gases by chemical reactions or thermal decomposition
which are trapped within the polymer matrix to form foams. Physical blowing agents consists of
volatile chemicals such as chloroflurocarbons (CFCs), hydrocarbons/alcohols, and inert gases
(CO2, N2, argon). Current concerns with the ozone layer depletion has gradually reduced the use
of CFCs. Inert gases especially CO2 has become a favorable choice due to its environmentally
benign and supercritical fluid working properties.
2.1.2 Polymeric foams and foaming process
Plastic foams with cell sizes smaller than 10 µm and cell densities larger than 109 cells/cm
3 are
defined as microcellular foams [3, 4]. Nam Suh [5] was the first who proposed an idea of
introducing small bubbles in solid polymers. The rationale is that if the cell size is smaller than
the critical flaws, which already exist in the bulk polymer matrix and is generally introduced in
sufficient numbers, then the material density could be reduced while maintaining the essential
mechanical properties. Microcellular foams compared to conventional polymeric foams offer
higher impact strength, increased toughness and longer fatigue life [6, 7, 3, 8, 9, 10].
Extensive research has been carried out in this area during the past several decades. A wide
range of polymers such as PS [3, 5], PC [11], and PMMA [12, 13] have been successfully
synthesized into microcellular parts.
2.1.2.1 Microcellular foams
Microcellular foams can be produced by a batching, semi-continuous, and continuous process.
Each process mentioned has three basic steps: mixing/saturation, cell nucleation and cell growth
as shown in Figure 2.1 [14].

9
Figure 2-1 Microcellular foaming process
The batch foaming process [11, 15] of polymer materials is carried out by placing the polymer
samples in a pressurized autoclave and saturating it with the blowing agent at certain saturation
temperature and saturation pressure. If the temperature at which the polymer is saturated is
higher than the glass transition temperature, Tg, of the polymer matrix, sudden release of pressure
would result in super- saturation and cell nucleation and growth. Cell nucleation is usually fixed
by cooling the materials below its Tg. However when the saturation temperature is lower than Tg,
the cell is not able to nucleate and grow after the release of pressure even if the gas is in the
super saturation state. This is because of the glassy nature (high rigidity) of the polymer matrix.
An increase in temperature above the Tg can cause foaming. Cell structure is again fixed by
cooling. The latter method allows an independent manipulation of saturation and foaming
condition, leading to higher process flexibility. However, diffusion of the gas is inevitable while
transferring the gas-saturated material to the high temperature environment, leading to thick skin
region.
Kumar et al. [16] developed the semi-continuous foaming process. It was used to produce
polymer sheets in a solid state. In this method, a gas channeling material (gas permeable
materials) is rolled by interleaving them between layered polymer sheets. Subsequently, the roll
is saturated with the blowing agent at room temperature. Finally, the pressure is released and the
saturated polymer sheets are separated from the channeling material. The bubble nucleation and
growth is induced by pulling the sheets through a heating station.

10
The continuous extrusion foaming process is a attractive method because of its mass production
features of foamed polymers leading to high productivity, easy control, and flexible product
shaping [4, 17]. Extrusion foaming can be carried out on either a single-screw extruder or twin-
screw extruder. During the extrusion, it is better to reduce the temperature profile from the
hopper to the die. A homogeneous single-phase solution is achieved by mixing the blowing agent
into the barrel with the polymer. Cell nucleation is induced by either a rapid, large pressure drop
or a sudden temperature increase through the die. Cells will expand until the extrudate
temperature is below the glass transition temperature of the polymer. The foam shape and
expansion is controlled by a shaping die. The two distinctive characteristics of extrusion foaming
compared to a batch foaming process is that instead of saturated amount of gas a metered amount
of gas is mixed with the polymer. Secondly, the driving force for bubble nucleation is controlled
by the flow instead of the saturation pressure.
2.1.2.2 Microcellular foam properties
Many polymers have been synthesized as microcellular foams. However, very limited
development has taken to understand their mechanical properties.
A brief status on the previous research on the mechanical properties of microcellular foams can
be summarized as follows. In case of most polymers, microcellular foams exhibited superior
impact strength, toughness and fatigue life compared to solid polymers. The extent of
improvement differs among different polymers. Further, different research groups have reported
different results for the same polymer-gas system. To conclude, a direct comparison of the
mechanical properties between microcellular foams and macrocellular foams with the same
density is very limited. The review to follow is focused on the impact, tensile, and compressive
properties.
The microcellular foams prepared from PVC [18-20] and PC [21] showed an improvement in
their impact strength. A void fraction of 80% increased the impact strength of PVC foams by
four times compared to solid PVC [18]. Barlow et al. work on impact strength of PVC reported
the strength to be a strong function of both the cell density and cell size [21]. There are some
controversial results as well such as from Kumar et al. [22] reporting lowered impact strength by
introducing microcellular structure in PVC compared to that of neat PVC. The reason is yet not
clear.

11
Tensile strength and modulus of microcellular foams were studied for PC, ABS, PET and PVC
[18, 23, 24]. Though not much improvement in these two properties is seen in microcellular
foams over their bulk counterparts a marginal increase in the relative tensile strength is noticed.
It was noticed that a linear relationship exists between the tensile strength and the foam density
for the polymer systems examined. Waldman [23] reported a 400% increase in toughness of PS
foams compared to solid samples. Additionally, the tensile toughness peaked at a relative foam
density of 0.75.
Arora [25] carried out a systematic study of the compressive behavior of microcellular PS foam.
An anisotropic model was proposed to describe the effect of cell size and cell shape on the
compressive strength. It was reported that the compressive strength of PS foams increases as the
size of the cell increases. The development of a stable neck in the polymer while subjected to a
uniaxial tension correlated the phenomenon of heterogeneous, progressive buckling of the
microcellular structures. From an energy balance consideration, a model was established
describing the densification process of microcellular foams under compression.
The fatigue life characterizing the behavior of materials under repeating external forces were
studied in case of foams. PC foams with a relative density of 0.9 (10% of the weight of
reduction) showed the same fatigue life as that of the PC solid. Furthermore, the PC foams
exhibited a fatigue life one order of magnitude higher than that of solid with an increase of
relative density to 0.97[15].
2.1.3 Supercritical CO2 (scCO2) foaming
Carbon dioxide is a clean and versatile solvent for the synthesis and processing of a wide range
of materials. Supercritical (scCO2) as a processing fluid has made noticeable developments in the
past decade and have been extensively used in a variety of applications such as polymerization,
polymer fractionation and extraction, impregnation, polymer foaming and blending, surface
modification, coating and microlithography [26, 27]. A supercritical fluid (SCF) as seen in
Figure 2.2 [26] may be defined as a substance for which both temperature and pressure are both
above the critical values. Under supercritical conditions the SCF exhibits gas like diffusivity and
liquid like density with zero surface tension. The high solvation power and fast diffusion are
especially beneficial to polymer processing and there is a great deal of research in using scCO2 in
polymer processing and foaming technology. Additionally, the critical point of CO2 is relatively

12
low, 31° C and a pressure of 73.8 bar. Furthermore, CO2 is abundantly available at low cost; they
are not-toxic, non-flammable, and environmentally benign. All these advantages make ScCO2 a
promising blowing agent for polymeric foaming production.
Figure 2-2 Schematic pressure-temperature phase diagram for a pure component showing
the supercritical fluid (SCF) region
2.1.3.1 Formation of polymer/foaming agent homogeneous solutions
Formation of gas/polymer solution is one of the fundamental steps of the gas foaming process.
Solubility and diffusivity are the two important factors that describe the gas absorption behavior
into polymers. Solubility denotes the maximum concentration of the gas in the polymer which
can be described by Henry’s law as,
C=H.P (Eq 2.1)
where, P is the pressure, C is solubility of gas in the polymer and H is the Henry constant, which
is dependent on the temperature. While diffusivity denotes how fast the gas can enter or disperse
out of the polymer. The diffusivity can be described by Arrhenius relationship as,
RT
EDD aexp0 (Eq 2.2)
Where D is the diffusivity, D0 is the diffusion constant, Ea is the activation energy for diffusion
of a gas in a polymer, R is the gas constant, and T is the absolute temperature. An ideal foaming

13
condition is a condition with higher gas solubility in a polymer assisting in greater cell
nucleation and growth. A higher diffusivity is sought in this step because of a shorten saturation
time and better productivity. However, this may not assist in cell growth, discussed latter.
Both the solubility and diffusivity are highly dependent on the pressure and temperature. A
lower temperature generally results in a higher solubility, a highly desirable situation. However,
a decreased processing temperature decreases the diffusivity of gas in polymer reducing the
productivity. In order to improve the productivity, a higher gas pressure is usually used thereby
increasing the solubility. Wissinger et al [29, 30] and Zhang [31] reported that in a PS-CO2
system there is a linear relationship between the solubility and the saturation pressure (Henry’s
law). Similar results were noticed in the PP-CO2 system. Handa et al [32] investigated the
solubility of CO2 in PMMA over a wide range of temperature (0-1670C) and pressure up to 61
atm. They reported that the linear relationship between the solubility and pressure only exists at
high temperature regions. However, at lower temperature, the solubility was convex towards the
pressure.
Gas solubility being affected by various other factors has been reported in recent research
studies. Effect of nanoclay on the kinetics of CO2 gas in PMMA was studied by A.Manninen et
al. [33]. It was reported that diffusivity increased with a higher nanoclay concentration while the
solubility remained unchanged by the presence of nanoclay. Handa et al. [13, 32] reported that
the diffusivity of highly pressurized CO2 in PMMA at a lower temperature may be higher than
that at a higher temperature because of the shifting of the glass transition temperature (Tg). The
change in crystallinity of semi-crystalline polymer was also found to change the solubility of gas
in a polymer [34].
Polymers with electron donor groups such as ether, fluro, and carbonyl groups, usually exhibits a
higher solubility of CO2. Kazarian et al [35] have shown that CO2 can participate in Lewis acid-
base type interactions with polymers containing electron-donating groups such as carbonyls. In
this case, CO2 is considered as Lewis acid and the polymer with those functional groups as the
Lewis base.
14
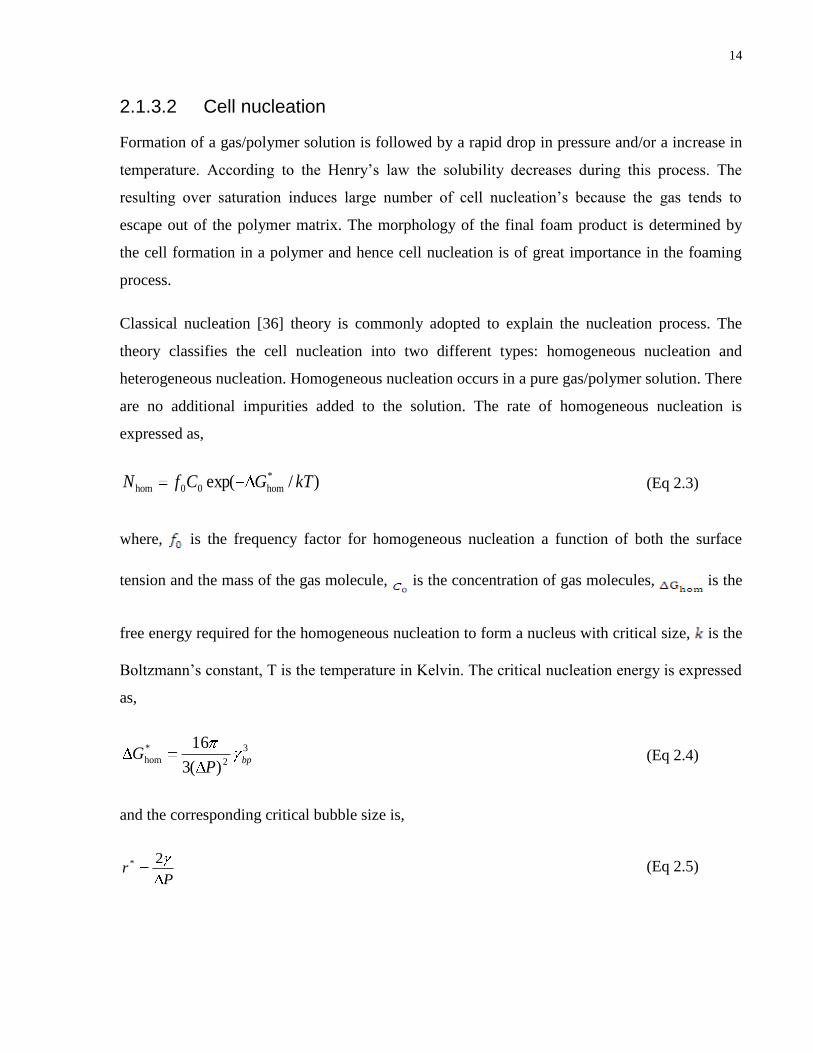
2.1.3.2 Cell nucleation
Formation of a gas/polymer solution is followed by a rapid drop in pressure and/or a increase in
temperature. According to the Henry’s law the solubility decreases during this process. The
resulting over saturation induces large number of cell nucleation’s because the gas tends to
escape out of the polymer matrix. The morphology of the final foam product is determined by
the cell formation in a polymer and hence cell nucleation is of great importance in the foaming
process.
Classical nucleation [36] theory is commonly adopted to explain the nucleation process. The
theory classifies the cell nucleation into two different types: homogeneous nucleation and
heterogeneous nucleation. Homogeneous nucleation occurs in a pure gas/polymer solution. There
are no additional impurities added to the solution. The rate of homogeneous nucleation is
expressed as,
)/exp( *
hom00hom kTGCfN (Eq 2.3)
where, is the frequency factor for homogeneous nucleation a function of both the surface
tension and the mass of the gas molecule, is the concentration of gas molecules, is the
free energy required for the homogeneous nucleation to form a nucleus with critical size, is the
Boltzmann’s constant, T is the temperature in Kelvin. The critical nucleation energy is expressed
as,
3
2
*
hom)(3
16bp
PG (Eq 2.4)
and the corresponding critical bubble size is,
Pr
2* (Eq 2.5)

15
Here, is the liquid-gas surface tension, and ΔP is the pressure difference between that of the
inside of critical nuclei and the surrounding liquid. Assuming the polymer is fully saturated at by
the blowing agent and the partial molar volume of blowing agent in the polymer is zero, ΔP can
be taken as the saturation pressure.
In the presence of nucleating agents, heterogeneous nucleation takes place in the polymer matrix.
It occurs at the interface between the polymer/gas solution and the nucleants. The heterogeneous
nucleation rate is given by [37]:
)/exp( *
11 kTGCfN hethet (Eq 2.6)
Where, is the frequency factor, is the concentration of the heterogeneous nucleation sites,
which can be related to the particle concentration. The term is given by,
)()(3
16 3
2
* fP
G bphet (Eq 2.7)
where, is the surface energy of the polymer, ΔP is gas saturation pressure, and is wetting
angle geometric factor.
The homogeneous and heterogeneous nucleation’s are not different from each other. The mixed
model describes the nucleation by,
hetNNN '
hom (Eq 2.8)
where, N is the combined nucleation rate of both homogeneous and heterogeneous nucleation’s,
is the modified homogeneous nucleation rate, and is the heterogeneous nucleation
rate. Modified homogeneous nucleation rate can by given by,

16
kT
GCfN hom'
00
'
hom exp (Eq 2.9)
where is the concentration of gas molecules in solution after heterogeneous nucleation has
occurred.
The free energy required for heterogeneous nucleation is generally much lower that required for
homogeneous nucleation. Therefore, additives such as talc, nano-clay or nanotubes can decrease
the energy required to create bubbles and therefore promote the cell nucleation. However there
are certain criteria to be fulfilled for being an ideal nucleant [38]. Three of the most important
criterion are: first, highest nucleation efficiency can only be achieved when the nucleation on the
nucleant surface is energetically favored and is relative to homogeneous and heterogeneous
nucleation; secondly, ideal nucleants have uniform size and surface properties; thirdly, ideal
nucleants are easily dispersible.
2.1.3.3 Cell growth and stabilization
The process of cell growth involves mass, momentum and heat transfer of the fluid. The models
describing the cell growth evolve from a basic model [39] used to describe the cell growth from
a single bubble that is surrounded by an infinite sea of fluid with an infinite amount of available
gas.
Cells come too close to each other as they grow. A solid wall of polymer separates the gaseous
phase. The increased pressure inside the bubbles stretches the cell walls to become thinner. Ones
the pressure inside a cell is high enough it ruptures the cell wall and two adjacent bubble
becomes a single large bubble. This transformation is referred to as cell coalescence [40]. Cell
coalescence adversely affects the cell sizes and hence should be avoided. Decreasing the
flexibility of the polymer by cooling down the polymer is common way to prevent cell
coalescence. A drop in temperature below the glass transition temperature (Tg) or the
crystallization temperature (Tc) fixes the foam morphology.
17
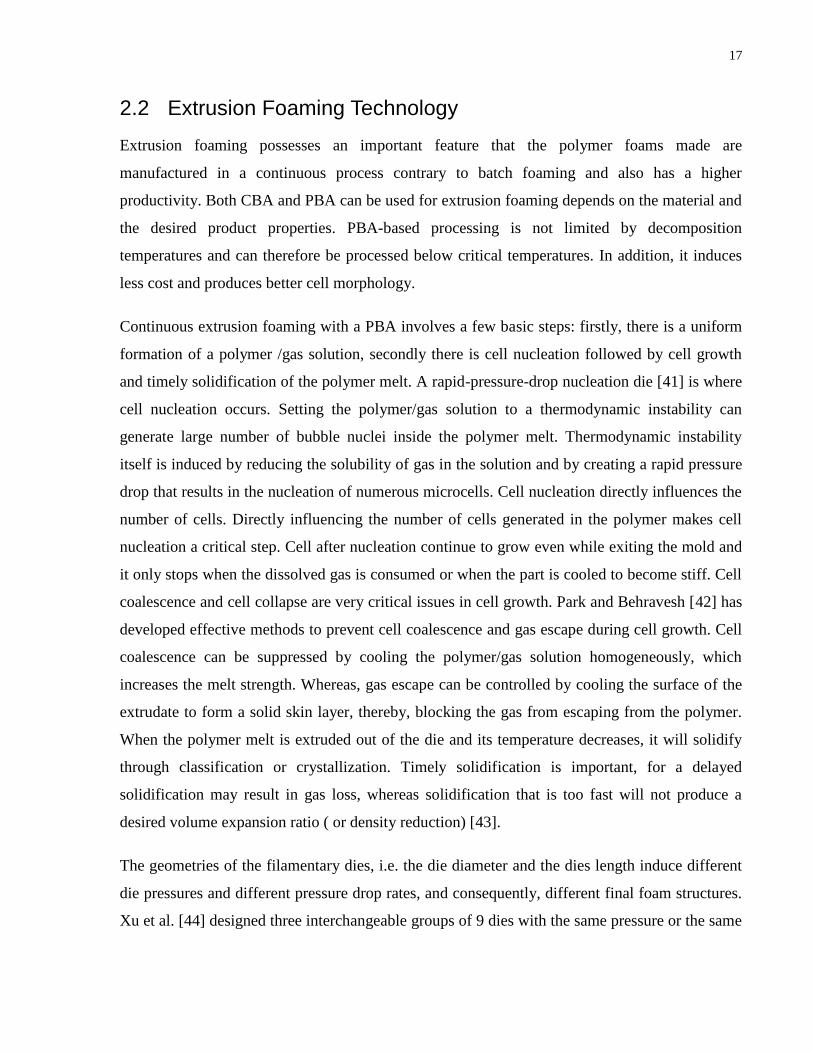
2.2 Extrusion Foaming Technology
Extrusion foaming possesses an important feature that the polymer foams made are
manufactured in a continuous process contrary to batch foaming and also has a higher
productivity. Both CBA and PBA can be used for extrusion foaming depends on the material and
the desired product properties. PBA-based processing is not limited by decomposition
temperatures and can therefore be processed below critical temperatures. In addition, it induces
less cost and produces better cell morphology.
Continuous extrusion foaming with a PBA involves a few basic steps: firstly, there is a uniform
formation of a polymer /gas solution, secondly there is cell nucleation followed by cell growth
and timely solidification of the polymer melt. A rapid-pressure-drop nucleation die [41] is where
cell nucleation occurs. Setting the polymer/gas solution to a thermodynamic instability can
generate large number of bubble nuclei inside the polymer melt. Thermodynamic instability
itself is induced by reducing the solubility of gas in the solution and by creating a rapid pressure
drop that results in the nucleation of numerous microcells. Cell nucleation directly influences the
number of cells. Directly influencing the number of cells generated in the polymer makes cell
nucleation a critical step. Cell after nucleation continue to grow even while exiting the mold and
it only stops when the dissolved gas is consumed or when the part is cooled to become stiff. Cell
coalescence and cell collapse are very critical issues in cell growth. Park and Behravesh [42] has
developed effective methods to prevent cell coalescence and gas escape during cell growth. Cell
coalescence can be suppressed by cooling the polymer/gas solution homogeneously, which
increases the melt strength. Whereas, gas escape can be controlled by cooling the surface of the
extrudate to form a solid skin layer, thereby, blocking the gas from escaping from the polymer.
When the polymer melt is extruded out of the die and its temperature decreases, it will solidify
through classification or crystallization. Timely solidification is important, for a delayed
solidification may result in gas loss, whereas solidification that is too fast will not produce a
desired volume expansion ratio ( or density reduction) [43].
The geometries of the filamentary dies, i.e. the die diameter and the dies length induce different
die pressures and different pressure drop rates, and consequently, different final foam structures.
Xu et al. [44] designed three interchangeable groups of 9 dies with the same pressure or the same

18
pressure drop rate. They assumed that the polymer melt was described by a “ power law model”
and generated the theoretical equations to calculate die pressure and pressure drop rate [45].
Naguib et al. carefully analyzed experimental results of extrusion foaming at various processing
conditions. They concluded that the final volume expansion ratio of extruded PP foams blown
with n-butane was governed either by the loss of the blowing agent through the foam skin or the
crystallization of polymer matrix [46].
The diffusivity of blowing agents at elevated temperatures is very high. Therefore, gas can easily
escape from the extruded foam because of its higher diffusivity at elevated temperatures. In
addition, as the cell expansion increases, the thickness of the cell wall decreases and the resulting
rate of gas diffusion between cells increases. Consequently, the rate of gas escape from the foam
to the environment increases. Gas escape through the thin cell walls decreases the amount of gas
that is available for the growth of cells, resulting in lowered expansion. Moreover, if the cells do
not solidify quickly enough, they tend to shrink due to loss of gas through the foam skin, causing
overall foam contraction. This indicates that the gas loss phenomena are a dominant factor that
constrains the volume expansion when the melt temperature is high.
Another critical factor that affects the maximum expansion ratio in plastic foam processing is the
crystallization behavior of semi-crystalline materials. Semi-crystalline polymer melt, such as PP,
solidifies at the moment of crystallization during cooling. Therefore, the foam structure solidifies
at the crystallization temperature during the foaming process. If the crystallization occurs in the
primitive stage of foaming, i.e., before the dissolved blowing agent fully diffuses out of the
plastic matrix and into the nucleated cells, then the foam cannot fully expand. Therefore, in order
to achieve the maximum volume expansion ratio, the crystallization (or solidification) should not
occur before all of the dissolved gas diffuses out into the nucleated cells. Upon exiting the die,
the temperature of melt decreases due to external cooling outside the die and the cooling effect
which is attributed to isentropic expansion of the blowing gases Thus, the processing temperature
at the die determines the time for the solidifying of the polymer melt. Therefore, in order to
provide adequate time for the gas to diffuse into the polymer matrix, the processing temperature
should be sufficiently high. It should be noted that if the processing temperature is too close to
the crystallization temperature, the polymer melt would solidify too quickly before the foam has
expanded fully.

19
This indicates that there is an optimum processing temperature for achieving maximum
expansion. If the melt temperature is too high, then the maximum volume expansion ratio is
governed by gas loss and it will increase as the processing temperature decreases. If the melt
temperature is too high, then the maximum volume expansion ratio is governed by gas loss and it
will increase as the processing temperature decreases. If the melt temperature is too low, then the
volume expansion ratio is governed by the solidification (i.e., the crystallization ) behavior and it
will increase as the temperature increases.
2.3 Injection Foam Molding Technology
2.3.1 Conventional foam injection molding and microcellular injection molding technologies
Foam Injection Molding (FIM) technology, one of many conventional injection molding
processes, is also like other thermoplastic foam manufacturing technologies. Polymer is melted,
mixed with a gas blowing agent, and injected into a mold through a shut off nozzle. The large
pressure differentiation between the melting chamber and the mold would induce a significant
pressure drop in the polymer since the mold is not pressurized. The injected material foams
during the pressure drop and expands in volume to fill the mold.
The FIM technology produces a number of advantages compared to other methods. It reduces the
material cost, the parts weight, the molding cycle time, the residual stress, the viscosity and the
processing temperature. Other advantages include the elimination of surface sink marks on the
parts, enhanced dimensional stability, high stiffness-to-weight ratio, and minimized fiber-type
fillers damages.[47]
In the 1980s, Dr. Suh and his students at the Massachusetts Institute of Technology developed a
microcellular plastic to reduce material usage and increase material stiffness by crack arrestors
formed by tiny bubble. Contrary to other researches, the cell diameter for this plastic is around 5
to 50 μm and the cell density is higher than 106[48]. The majority of cells also must be closed
cells with less amount of weight reduction. The team focused on the microcellular structures
development then moved on to continuous polymer manufacturing processes. Other researchers
also participated in developing the microcellular injection molding process and the
manufacturing equipment. Trexel Inc. is the company responsible in cooperating with the MIT
20
research team to develop the MuCellⓇ system that injects PBA such as N2 and CO2. FIM is now
also generally known as “microcellular injection molding”.
Microcellular injection molding differs from commercial FIM by the fact that it fills the mold
without foaming. It injects a full shot of polymer material into the mold to account for the
volume shrinkage from cooling. In contrast, low pressure FIM often achieves a high void
fraction. The microcellular process utilizes only PBA to create foam structure instead of the PBA
or CBA that FIM uses. The process can create thin-walled products due to the gas present in the
polymer matrix. The injection molding process provides the same dimensional stability because
volume expansion counter acts shrinkage and warpage in cooling, The packing and holding
phases is no longer necessary thus cycle time is reduced. Disadvantages are shared between FIM
and microcellular injection molding. The mold parts have poor surface finish, and there are
limited applications for a nontransparent part. The process also requires a strictly balanced
runner system, complicated design and technology, and requires a significant amount of
investment. [48].
2.3.2 Low-pressure and high-pressure foam injection molding technologies
2.3.2.1 Low-pressure FIM
FIM is classified as low pressure by two major factors, the relative cavity pressure between 0.5
to 10 MPa, and smaller injection shot size from 65 to 80% of the full shot volume. Low pressure
is achieved by the small shot size and can also lower tonnage in the molding machine. Expansion
in this method fills most of the cavity volume in the mold and is therefore very suitable for thick-
walled products. Low pressure FIM also reduces residual stress, lowers cost, and increases
dimension stability. Products that perform simple functions can be made effectively using this
process.
Flow swirl marks on the product surface and non-uniform cellular morphology are two defects
that have to be overcome. Swirl marks are created when the cells are nucleated and squeezed
onto the mold surface. The nucleated cells have to travel all the way to fill up the mold. Cell
growth can be excessive during this travel and cause significant cell coalescence. The low
injection pressure limits the minimum thickness of parts made. It is because when the thickness

21
is small, the polymer cools faster and would encounter a higher resistance during the flow and it
is hard to overcome when the injection pressure is low. Generally parts with thickness of less
than 0.25’’ is not considered in this FIM process.
2.3.2.2 High-pressure FIM
High pressure FIM is classified by the fast completion of the mold cavity filling, the
disconnection of the core foaming and solid skin layer formation, and the core foaming due to
cooling polymer shrinkage. In high pressure FIM, the mold cavity is filled completely with
polymer quickly. When the polymer shrinks during the cooling stage, volume expansion again
fills the free volume in the mold. Uniform cell structures are created with this process since
foaming occurs after the cavity is completely filled without much cell movement. Swirl mark
effect is reduced due to the fast filling and increases the surface quality. The volume expansion
from foaming is minimum with this process which requires more cost in material.
2.3.2.3 Investigation of foaming behaviors in foam injection molding using mold pressure profile
Different experiments are done to explore the foaming mechanism of the FIM process. However,
it is difficult to control the mechanism as various factors contribute to the outcome. One
researcher, Lee, experimented FIM with mold pressure profiles [47, 49]. Pressure is measured in
three different locations, corresponding Location A, Location B, Location C, within the plaque-
shaped mold with multiple fan gates. A comparison is made between the results of Lee’s FIM
experiment and foam extrusion with the assumption that when the system pressure is
significantly lower than the solubility pressure, cell nucleation occurs. From foam extrusion, the
gas-added polymer part leaves the mold in steady state and the cell grows also in steady state.
From FIM, however, the gas-added polymer flow in the mold experiences different pressures at
different parts of the mold. The degree of injection of the polymer/gas mixture varies and affects
cell nucleation. While the gas pressure drop also changes according to the filling of the mold and
the pressure of the flow front.
Most experiment parameters in the two processes were maintained the same to extract a fair
comparison. Only the pressure drop and pressure drop rates are different in the two technologies.
The polymer materials used in the two processes are polypropylene (PP), thermoplastic poly-
olefin (TPO), and high density polyethylene (HDPE). N2 acts as the PBA for FIM as well as

22
foam extrusion. Pressure drop and pressure drop rate conditions for the foam extrusion process
are derived from cell densities measured from products of different trails of varying processing
parameter. As for the FIM, cell density values are measured at the 3 locations where pressures
were measured. Pressure drop values give an assumption that the larger the pressure drop would
determine the final cell density.. Measured cell density values from FIM closely correspond to
the estimated values from foam extrusion. Eventually, the foam extrusion data and the mold
cavity pressure profile can be used to estimate the cell density values and foam structure in the
FIM process. In conclusion, specifically desired cell density values from the FIM process can be
achieved by varying certain processing parameters.
2.4 Rotational Foam Molding Technology
Rotational foam molding is an example of chemical foaming processes. The technique is evolved
from the conventional rotational molding process. Conventional rotational molding process is
widely used in the plastic industry to manufacture storage tanks, furniture, playground
equipment, toys, and components for aircrafts and automobiles [50-52]. The process is believed
to be developed in the late 1930s to early 1940s along with the development of highly plasticized
liquid polyvinyl chloride, a thermoplastic alternative to latex rubber. At that period of time,
rotational molding was mainly used to produce toys such as squeezable toy dolls and beach balls.
During the World War II, the process was utilized to produce items such as syringe bulbs,
squeezable bottles, bladders and air-filled cushions. During these early years, plastic parts were
rotational molded inside a hollow metal mold over an open flame. With the introduction of
rotational –molding-graded polyethylene powders and hot air ovens in the 1950s, the process
advanced rapidly and more and more types of hollow plastic products could be manufactured
from the process [53].
Rotational molding required low equipment and mold cost and has relatively low waste [53, 54].
It produces hollow parts that are low in residual stressed [53]. It is also capable of manufacturing
parts of complex geometries, sizes, and variable thicknesses and layers [50]. Because of these
advantages, rotational molding has been expanding at a rate of 10 to 15% per annum over the last
few decades [55]. A possible drawback to utilizing rotational molding process would be the
material requirements of the process. Materials suitable for rotational molding are relatively
expensive due to the need of special additives and fine powder sizes. Low-density polyethylene

23
(LLDPE)and high-density polyethylene (HDPE) are widely used in rotational molding. They
represent about 85%of all polymers consumed in the rotational molding industry. The reasons for
that are their modest melting temperatures and their ability to sinter together under low-shear
conditions [53]. Although polyethylene materials are easy to rotational mold, their relatively low
stiffness and strength make them less favorable for engineering applications [54]. Other
polymeric materials used in liquid polymers [53]. Polypropylenes-based materials are selected
for the experiments in this thesis project because of their better mechanical properties over
polyethylene. Until the last decade, very few studies have been conducted for developing plastic
foams from this technique. Due to the nature of the rotational molding process, physical blowing
agents such as high-pressure gases are not applicable to create the gaseous phase in the material
matrix [56, 57]. Needham attempted to produce plastic foams from a rotational molding process
by introducing a chemical blowing agent (CBA), mainly sodium bicarbonate into the material
mixture [58]. The Uniroyal Chemical Co. Inc., in 1996, successfully synthesized LDPE foams
from rotational molding using cologne OT as the CBA. The company reported that the foam
density decreased and the wall thickness increased as a result of an increased concentration of
Celogen OT used during the foaming process. They also suggested that the cooling step in the
foaming cycle determined the quality for the resulting foam [50]. Liu et al. and Pop-Iliev et al.
investigated the processing of polyethylene and polypropylene foams and the effect of the
blowing agent and processing temperature on the resulting cell microstructure [50, 56, 59]. Fine-
celled foams of three-fold to six-fold expansion could be made from the rotational foam molding
technique [50, 56, 59].
In general, the process of rotational foam molding can be summarized into four main steps [53,
60]:
i) Charging the Mold with Materials: A predetermined amount of polymer powders and CBA
particles mixture will be charged into the mold. The mold is then set to rotate uni-axially and is
heated simultaneously inside an oven at the desired temperature.
ii) Polymer Powder Sintering: The polymer powders begin to melt and sinter together. Due to the
temperature gradient along the radial direction of the mold, powders on the mold surface will
sinter first. As the heating process continues, all the powders in the mold will eventually sinter
together forming a continuous polymer matrix.
24
iii) Decomposition of CBA and Foaming: As the temperature of the polymer melt inside the
mold rises to certain point, the CBA particles in the melt will start to decompose and liberate
gases creating bubbles or pores inside the polymer matrix.
iv) Cooling: While the mold is still in rotation, it is being cooled by air or water jets upon the
completion of the heating cycle. The polymer melt inside the mold begins to cool and solidify
starting from the mold surface towards the center of the mold. At the end of the cooling cycle,
the solidified polymer part will be released from the mold.
As suggested by Pop-Iliev et al., the sintering temperature of the polymer should be lower than
the decomposition temperature of CBA, the foaming temperature, and the coalescent
temperature. The reason for that is to allow the polymer to sinter into a continuous phase for
improved cell quality. It is also important that the molten polymer has to flow and wet to the
blowing agents well in order to eliminate undesired air bubbles encapsulation, which impairs the
cell morphology. The zero-shear viscosity is also a key parameter in the sintering of the polymer
matrix and the resulting cell morphology [56, 59, 60].
2.5 Bead Foam Molding Technology
Foam extrusion and injection molding are the two predominat continuous processes in plastic
foam industry. In general, the process of foam extrusion allows production of two-dimensional
foam profiles of various densities and foam expansions. On the other hand, with the injection
foam molding, it is possible to fabricate foam and thin-wall foam components in complex, three-
dimensional shapes. Nevertheless, the volume expansion ratio for parts made from injection
foam molding is often limited to two to three-fold. In contrast to foam extrusion and injection
molding, the bead foaming technology is a manufacturing process which involves molding and
sintering of tiny foamed plastic beads into plastic foam components. This process can produce
three-dimensionally shaped foam products with ultra low densities. In this aspect, the bead
foaming technology is considered to be a highly promising alternative which possesses both the
foam expansion of extrusion foaming and the part geometry complexity of injection foam
molding [61-63].
The technology of bead foam molding, in general, comprises of two main steps: bead fabrication
and bead molding.

25
2.5.1 Bead fabrication
In principle, two approaches for the production of foamed bead exist. The first approach consists
of the production of expandable beads, which can be applied for amorphous thermoplastic resins
like polystyrene (product: EPS – expandable PS). Expandable beads are granules in which a
blowing agent (e.g. pentane) is trapped and are expanded in a second step before the welding-
process, the so-called pre-expansion. Efficient transportation of the unfoamed material and
control of density by the part-manufacturer are clear advantages compared to expanded beads,
which is the second type of beads.
Expanded beads are produced from semi-crystalline thermoplastics, since the presence of
crystalline domains prevents the storage of a blowing agent inside the solid bead [64]. Expanded
polypropylene (EPP) is produced in that way. An overview of the possible methods is given in
Fig 2.3.
Figure 2-3 Methods for the production of expandable and expanded bead foams
The most commonly used method to produce huge quantities of expandable beads of polystyrene
is the suspension-polymerization with a blowing agent. In that process, the polymerization
happens at high pressure in the presence of pentane, which leads to the incorporation of the
blowing agent inside the granules. Problems arise with additivation, since the additives are
required to be fully soluble in water to be stored in the final bead. Another drawback is the base
material itself, since not all polymers can be synthesized via suspension-polymerization.
A method to produce expandable or expanded beads is the impregnation (loading with blowing
agent) of micro-granules, which contain all required additives, with the blowing agent in an
autoclave. This is the main production process for EPP. In a first impregnation vessel the solid
PP-beads are saturated with gas at around 150 °C and then released to an expansion vessel.

26
Afterwards the beads are washed to remove any residual suspension stabilizer, which would
inhibit proper welding of the beads during steam-chest moulding [65]. For amorphous polymers,
expandable beads can be produced as well, if the saturation step takes place at temperature below
the glass-transition of the polymer-blowing agent-solution.
Alternatively, foam extrusion with under-water pelletizing allows the production of expandable
beads or already expanded beads. It is schematically shown in Fig. 2.4. In this method, gas-
loaded polymer melt is extruded through a hole-plate into a water-stream and cut by rotating
knifes. If the water-pressure is above the vapor pressure of the blowing agent, the blowing agent
is trapped within the solidifying polymer and expandable beads are produced. At low pressure,
the dissolved gas evaporates and forms bubbles resulting in expanded beads. Advantages of this
method are the exact dosing of the blowing agent(s) into the melt and a continuous and flexible
process, which allows the processing of any thermoplastic resin with additives. Variable process
parameters are temperature and pressure of the water, the rotational speed of the knives and the
temperature of the perforated plate.
Figure 2-4 Schematic of under-water pelletization as a following unit for foam extrusion
2.5.2 Bead bonding
The parts from bead foams are made in a complex, yet efficient process, which allows the
production of parts with a high geometrical degree of freedom at very low density. For the
production of parts, the expanded or expandable beads are welded together in a steam-chest
moulding machine. Therefore, the surface of the beads is partially molten or softened, which

27
leads to the inter-diffusion of chains between different beads and thereby good cohesion. Good
cohesion between the beads is necessary to ensure favorable mechanical properties [66,67].
The processing of bead foams to a part is done in a steam-chest-moulding machine in five steps.
The steps are shown on Fig. 2.5and will be explained below.
Figure 2-5 Bead foam processing in a steam-chest moulding machine: 1: closing and filling
the mould, 2: steaming, 3: cooling, 4: ejection of moulded part
1. Filling of the mould
At first, foamed beads are sucked out of a container blown into the mould by an injector, which
usually functions according to the venturi-principle. This step is critical to achieve a homogenous
distribution of the beads inside the mould.
2. Welding of the beads
After the filling process, the beads are fused together by hot steam flowing through the mould.
During steaming, the beads form physical links due to inter-diffusion of chains of neighboring
beads. To ensure high welding quality elevated temperature and a sufficient steaming time are
necessary as well as a high contact area and force between the beads. With a low contact area,

28
force is transferred only at a few points, which leads to bad mechanical properties. If the contact
force is low, the beads might not touch sufficiently thus also leading to bad welding.
For EPP, the steam has an inlet pressure between 7 and 8 bar. However, the pressure inside the
mould is lower - pressures between 2.5 and 4 bar are common [68]. Thus, a steam-temperature
up to 150 °C is achieved. In case of EPP or other semi-crystalline polymers, a part of the crystals
is molten or in the case of EPS the polymer is softened.
The steaming process consists of three steps, which are shown on Fig. 2.6. At first, the air
between the beads is purged out and the mould is pre-heated. Therefore, steam is flowing parallel
to the mould (Fig. 2.6 - 1). Secondly, the steam flows through the mould (Fig. 2.6- 2). To ensure
a temperature distribution as homogeneous as possible and thereby to ensure constant welding
quality in the whole part, the mould is steamed from both sides. This is called cross steaming.
Finally, steam is guided along the mould to improve surface quality (autoclave steaming, Fig.
2.6- 3).
Figure 2-6 Steps for steaming bead foams: 1: purging, 2: cross-steam, 3: autoclave
steaming
In EPP, a double melting-peak is essential to have a balance between a stable cellular structure
(which requires crystallinity) and proper inter-bead welding must be maintained. Therefore, the
lower melting peak ensures good bonding and the upper one keeps the structure stable and

29
prevents the collapse of cells. The creation of the double melting peak will be discussed in detail
in the chapter about EPP.
3. Cooling and stabilization
For dimensional stability of the part, cooling of the mould is a crucial step. If the part is ejected
without cooling, further expansion of the beads is possible, which leads to a deviation of the
original size. For cooling the mould is sprayed with water until a temperature of around 80 °C is
reached.
4. Ejection of the moulded part
After moulding and cooling, the part is finally ejected. Pressurized air and mechanical ejectors
are used to eject the part.
5. Post-processing of the final part
Especially at low density, shrinkage can be a challenge. For example Neopolen P can have a
shrinkage up to 2.8 % [69] (Neopolen P 8220 K, BASF SE, density 22 g/l), which comes from
the condensation of steam inside the beads that leads to a vacuum. For components requiring
high dimensional accuracy, a tempering step of the parts is necessary. For Neopolen P a
temperature of 80°C is recommended. In this step, the original shape is restored, at least
partially. Furthermore, condensed water from the steaming step is removed as well.
In principle EPP is processed in two different ways, namely the crack filling process or the
pressure filling process. Both can be combined with the so-called pre-loading step. Those
processes will be explained in this section.
In contrast to EPS, which still contains a certain amount of blowing agent, EPP-beads do not
expand any further inside the mould without special treatment. Therefore, this matter must be
dealt with process-wise.
At first, the crack-filling method will be explained. Its concept is shown on Fig. 2.7. With this
method the beads are filled into a compression-mould at ambient pressure. Before the steaming-
process, the mould is closed to its final dimensions, so that the beads are compressed. With this
technique very thin parts with a thickness even below the bead thickness can be realized. The

30
drawback of this method is an inhomogeneous density distribution, if the wall thickness is not
constant, and limitations in the part shape. An example for the application of this method is the
sun-visor in the automotive industry.
Figure 2-7 Concept of the crack filling method
Alternatively, the pressure filling method can be used, which is depicted in Fig. 2.8. Therefore,
the beads are subjected to an elevated pressure during the filling process, which leads to a
compression of the beads. After filling, the pressure is released and the beads re-expand thus
reducing macro-porosity. According to the level of filling-pressure, the compression of the beads
and thereby final density of the part can be controlled. For EPP usually filling-pressures between
1.5 and 3.5 bar are applied.
Figure 2-8 Concept of the pressure filling method
With the above-mentioned processing method only moderate densities can be achieved. To lower
the density those moulding methods must be combined with pressure pre-loading. Before the
actual moulding, the beads are subjected to pressurized hot air for several hours until the inside
pressure of the beads reaches equilibrium with the outside. The so captured air leads to additional
expansion during steaming thus allowing lower densities. Furthermore, pressure pre-loading
reduces macro-voids between the beads, which leads to better mechanical properties.

31
The working mechanism of steam-chest moulding is similar to a sintering process. The major
difference between the two processes is that the former uses high temperature steam as an
effective heating/cooling medium [70,71], while the latter normally uses hot air [72–74]. During
the steam-chest moulding process [75,76], high temperature steam is injected into the mould in
three different cycles to soften and fuse the beads. The steam vaporizes the volatile gas present in
the beads and hence causes the expansion in volume, as well as re-blowing of the beads. Through
this process, the empty space in is filled at the same time when the inter-bead fusion is created,
which results in the forming. To improve bead foaming technologies and bead-moulded
products, many researchers performed mechanical property tests of bead-moulded products
based on commercialized beads such as expanded polystyrene (EPS) and expanded
polypropylene (EPP). The formation of inter-bead bonding in EPS beads involves the diffusion
of polymer chains across the inter-bead regions during the heating process of steam-chest
moulding process. Whereas, the cooling cycle freezes the physical entanglement of the polymer
chains at the inter-bead boundaries and results in the bonding of the EPS bead foams. The steam
temperature and moulding time are two critical parameters affecting the extent of bead fusion
and significantly affects the overall mechanical properties of the moulded bead foam samples
[71,77–79]. However, if the foamed beads are steamed for too long, their cell structure might
collapse and deteriorate the surface property of the moulded product [80].
In the case of moulding of EPP beads with steam-chest moulding machine, good sintering
requires a desirable double crystal melting peak structure as shown in Fig. 2.9. The hatched area
in Fig. 2.9 represents the desirable steam temperature range between the low and high melting
peaks (Tm-low and Tm-high) of EPP beads within the steam-chest moulding machine [81–88]. When
EPP beads are processed in the steam-chest moulding machine, crystals associated with Tm-low
melt and contribute to the fusing and sintering of individual beads. The unmolten Tm-high crystals
help to preserve the overall cellular morphology and dimensional stability of the moulded EPP
product. A very narrow processing window between the two melting peaks poses a significant
challenge in setting the processing steam temperature during the molding process in steam-chest
moulding machine. A slight variation in steam temperature may cause the Tm-high crystals to get
affected and destroy the cellular morphology of the EPP beads and cause shrinkage of the
moulded EPP product. The steam can penetrate into the EPP beads during the steam-chest
moulding process. During the cooling cycle, at the end of the moulding process, the high-

32
temperature steam, which diffused into the beads, tends to condense in the cells and leads to a
negative pressure. Due to the characteristics closed cell structure of EPP beads, air cannot
penetrate into the foam within a short span of time, which results in a dramatic decrease in the
internal pressure of the foams. Consequently moulded EPP parts tend to shrink after completion
of the moulding process. An annealing process is generally used at a high temperature to enhance
the diffusion rates of steam and air and thus prevent shrinkage [67].
30 60 90 120 150 180 210-1.4
-1.2
-1.0
-0.8
-0.6
-0.4
-0.2 actual variation of steam
temperature
Tm-high
Tm-low
He
at
Flo
w (
W/g
)
Temperature (°C)
Endo
Figure 2-9 A typical double-peak melting behavior of foamed beads
The processing steam in a steam-chest moulding machine is in the superheated state and its
temperature is coupled with the processing pressure [89] according to the vapour pressure curve.
However, as the steam enters the mould cavity via small ports, the overall pressure starts
decreasing due to condensation of the steam on the beads. Furthermore, the pressure of the steam
decreases because of the resistance of the flow through the beads, which subsequently reduces
the temperature and makes it difficult to determine the actual temperature of the mould.
Moreover, considering the large volume and complicated shape of the mould cavity the
temperature distribution and thereby also density is not uniform. Hence the optimum processing
condition required for the desired properties in the moulded bead foam products can be achieved
by trial and error. Nakai et al. [84] investigated some fundamental aspects of steam-chest
moulding, such as the evaporation and condensation of steam and heat conduction, using
numerical simulation techniques. They reported reduced heat conduction to the core area of the

33
mould caused by a decrease in steam temperature as a result of drop in the steam pressure.
Generally, higher operating steam pressure is implemented to improve the heat conduction to the
core area of the mould. However, a higher operating steam pressure relates to higher operating
cost and a higher temperature leading to an increase in localized temperature near the steam
entry, and hence beads exposed to this high temperature may melt resulting in shrinkage at the
surface of the product. This dramatically deteriorates the surface property of the moulded
product.
2.5.3 Bead foam materials
2.5.3.1 Commercial bead foam materials
EPS is the most widely used bead foam material with a consumption of 4.7 Mt per year [90] due
to its low price and high availability [62]. It is heavily used for packaging applications. This
causes also major problems, because of the enormous amounts of EPS-waste. So, knowledge of
the recycling capability is very important [63]. EPS is also often used in cheaper cycling helmets,
although it offers less competitive impact properties compared to EPP, which makes the latter
material the favorite for applications with impact deformation. EPS offers slightly lower density
compared to EPP but has less favorable chemical and temperature resistance. However, transport
and storage of EPS is much cheaper. Expandable PS can be transported in huge masses, where
only small masses at the same transport volume of expanded PP can be transported due to its
foamed structure.
EPS offers good insulation capabilities, which lead – in combination with the low price - to the
second highest market shares of insulation materials after glass wool [91]. In principle, the
mechanical behavior of EPS is similar to EPP, since they posses the same basic structure.
However, EPS has a higher specific modulus and strength at the cost of elasticity. Also the
maximum temperature of usage for EPS is lower than EPP. Mechanical properties are highly
dependent on the quality of welding of the beads, which was studied in numerous publications
[71,80,92,93]. For the application in the sectors of thermal insulation and packaging, the
knowledge of creep behavior of EPS is of utmost importance [94–96]. Protective systems often
put EPS to use as a shock absorber, therefore the dynamic properties of this material were
studied in many publications [63,97,98].

34
In contrast to EPP, EPS is much less elastic, which imposes constrictions on the use of EPS for
packaging of high-value goods. This lead to the development of bead foams from PS based
blends, which offer higher elasticity, toughness at low temperature and better chemical
resistance [99].
Thermal transport in foams comprises of conduction through the solid cell walls and struts as
well as the cell gas, convection and radiation. Convection can be neglected for cell smaller than
3 mm [100], which is true for all bead foams. Thermal conduction of foams consists of the
conduction through the solid and the cell gas. The conduction of the polymeric matrix is affected
by crystallinity and orientation [101–103], which are heavily affected by the foaming process.
Either conduction through the solid or through the cell gas can be dominant, depending on
density. For low densities, the cell gas dominates the thermal transport over the solid polymer
because of its high volume fraction. For very small cells with a cell diameter in the same order of
magnitude as the free path length of an air molecule, the Knudsen-effect becomes important and
the thermal conductivity of the cell gas is reduced drastically [104].
Besides conduction, radiation is a very important transport mechanism of thermal energy in
foams. This effect is mainly dependent on cell morphology and temperature. Several workers try
to separate the total heat conductivity into its parts [100,105–110]. However, those contributions
cannot be separated in normal measurements without modelling [111], so the authors used more
or less complex models for separation.
One major drawback of the above-mentioned results of the theoretical models is the
independence of the radiative and conductive contributions. This matter was tackled by Ferkl et
al. [100] in a (at the time being) spatially one-dimensional model. No assumption on the
propagation of radiation and geometry was made. In literature, EPS is often used as a material to
investigate the thermal properties of foams in general [112,91,108]. However, the special
particle-structure of bead foams was never investigated in detail. To reduce thermal radiation
EPS bead foams are equipped with Graphite-particles, which act as reflectors for infrared
radiation thus reducing the overall thermal conductivity. An exemplary product for this kind of
EPS is Neopor (BASF SE).
EPS is well known for packaging applications. For example electronic devices are kept safe from
transport-damage using EPS crash absorbers or spacers. Also in areas, where rigorous safety

35
restrictions exist, such as helmets for cyclists or bikers or car-seats for children, EPS is used
often [113]. In the automotive industry it is used for crash-absorbers as well.
Thanks to its advantageous thermal insulation capability it is used for the insulation of houses in
form of blocks, where it is also used for acoustic insulation against footfall sound. For the
cooling of perishable goods as drugs, food or human blood EPS contributes to keep energy cost
low as insulation and makes the transportation of such goods affordable and practical.
Among particle foams (or bead foams), EPP has unique advantages, such as excellent impact
resistance, energy absorption, insulation, heat resistance and flotation. In addition, it is
lightweight and recyclable, and exhibits good surface protection as well as oil, chemical and
water resistance. Thanks to these advantages, the use of EPP is gaining increased momentum in
the automotive, packaging, and construction industries. The combination of its flexible
applicability, reasonable tooling cost, high resilience, good sound dampening at high
frequencies, and, especially, its low weight, has made EPP the material of choice for numerous
applications. For instance, EPP foams are now utilized as bumper cores, providing significantly
higher energy absorption upon impact as opposed to conventional systems. However, unlike
expandable polystyrene (EPS), which is supplied as expandable small pellets, suppliers can only
provide EPP beads in an expanded or pre-expanded form. The beads are then shipped to the parts
manufacturers for further moulding. Due to the presence of bubbles in the bead (i.e. the large
volume of the bead), the cost of storing, packaging, and transporting EPP is very high, ultimately
rendering it far more expensive than EPS or a normal PP resin. Moreover, very little research has
been conducted on EPP manufacturing, sintering behavior, and steam chest moulding process.
Consequently, when an EPP concept product is targeted, the manufacturer can only depend on
the EPP supplier to obtain a prototype, thus having little or no control over material selections
and processing conditions.
The EPP beads features high closed-cell content which is typically 95-98% as shown in Fig. 2.10
and is measured using a pycnometer in accordance to ASTM D6226. The closed-cell structure
provides high expansion force, while steam-chest moulding assists with the bonding of EPP
beads. Depending on the bulk density, EPP beads have cell diameters from 200-500 µm and cell
densities in the range of 105-10
6 cells/cm
3.

36
The batch foaming process has been successfully used to achieve the high closed-cell content in
EPP beads compared to extrusion foaming. In a batch foaming process for EPP beads, the micro-
pellets are saturated close to the melting point of the material. The high viscosity of polymer
melt provides enormous melt strength so that the cell wall can withstand the bi-axial extension
during the cell growth. The cell density, expansion ratio and crystal characteristic of the
individual EPP bead foams have a significant effect on the overall mechanical properties of the
moulded EPP bead foam product [112,114]. Guo et al. [115] investigated the critical processing
parameters to produce EPP beads in a lab-scale autoclave system. The pressure drop was
systematically controlled by using a modular die at the discharge port. The die geometry (L/D)
was decided to maintain a high enough pressure inside the chamber to prevent pre-foaming of
the gas-impregnated EPP beads. The cell density was not affected by the die geometry. On the
other hand, the volume expansion of the EPP beads slightly decreased as the die length
increased.
The saturation pressure plays a very crucial factor in achieving the high cell densities and
expansion ratios of the EPP beads processed in a autoclave bead foaming setup. In the autoclave
foaming of EPP beads with CO2, a higher saturation pressure allowed a higher CO2 content to be
dissolved into the PP pellets [116,117]. The higher CO2 content helped to reduce the energy
barrier for cell nucleation and increased the cell nucleation rate, which led to a higher final cell
density [118,119]. The volume expansion of EPP beads was also observed to increase
dramatically as the saturation pressure was increased. The higher cell density achieved at high
saturation pressure decreases the amount of gas loss from the foamed EPP beads and hence
improves the expansion ratio.
Figure 2-10 SEM micrograph of a cross-section of an EPP bead made with autoclave
foaming setup

37
The production of EPP beads with double melting peak characteristics has been well established
[120–124]. The two-peak crystal structure is generated by impregnating the PP micro-pellets
with a physical blowing agent in a autoclave chamber at elevated pressures and temperatures
around PP’s melting point over a certain period of time [121,124]. During the gas impregnation
stage, a new crystal melting peak is created at a higher temperature, Tm-high (Fig. 2.8). The newly
generated crystal peak (Tm-high) during the isothermal gas-impregnation stage of the EPP beads
stems from the perfection of the α crystal phase out of the unmelted crystals, which has a higher
orientation and hence a higher melting temperature than the original peak and is known as α2
[125,126]. The melting temperature of this peak is typically above the annealing temperature.
The Tm-low melting peak (Fig. 2.8), is generated during the rapid cooling process in autoclave
foaming chamber and is known as α1. The α1 and α2 are α forms of crystal with various degree of
perfection [127–133]. Choi et al. [125] have shown that by ramping the PP to the annealing
temperature, the less perfect crystals melt and the more perfect crystals that exist above the
annealing temperature remain unmelted. During the annealing treatment, the Tm-high from
unmelted crystals increases with a higher perfection, whereas the portion of the Tm-low peak that
forms during the cooling process decreases since more crystals are formed to the higher melting
peak. However, the work conducted by Choi et al. [125] was at ambient pressure. The actual EPP
bead manufacturing process is conducted at high pressure with blowing agent, which leads to the
dissolution of gas into the PP matrix. The dissolved gas significantly affects the crystallization
behavior of PP [134].
In the context of EPP bead foam manufacturing, the effect of dissolved blowing agent on the
generation of double crystal melting peak structure can be systematically investigated using a
high-pressure differential scanning calorimetry (HP-DSC). The plasticising effect of dissolved
blowing agent, decreases the saturation temperature required for the generation of the higher
melting peak with perfected crystals in EPP bead foams [135].
For EPP bead foams, copolymers with polypropylene (PP) as base monomer are preferred
compared to homo-PP because the latter has poor impact properties at low service temperatures
[125,136–141]. The copolymers can be binary, such as a propylene-ethylene copolymer or a
propylene-butene copolymer, or a ternary copolymer, such as propylene-ethylene-butene
copolymer [125,142]. By using branched high-melt-strength PP [82] and metallocene-catalyzed
PP [122,143], the mechanical properties and compressibility of EPP beads and their moulded

38
foam products can be improved. Other studies have shown that the mechanical properties of EPP
beads can be improved significantly by choosing an appropriate PP copolymer that will lead to
better control of the secondary crystal form [144]. For instance, to improve EPP’s in-mould
foamability, researchers have employed a PP copolymer with a lower melting temperature [145];
in another case, graphite was introduced in order to increase the heat resistance [136].
Furthermore, it has been shown that the use of PP nano-composites can also improve EPP bead
properties [146]. Efforts have also been made to produce expandable PP beads; however, the use
of either an encapsulated physical blowing agent [147] or a dispersed chemical blowing agent
[148] in the beads has not become common practice due to technical difficulties.
As mentioned earlier, for EPP foamed beads to have a good sintering during the steam-chest
moulding stage, they need to possess a double-peak (or at least broad) melting characteristic. The
ratio between the Tm-low and Tm-high peaks is thus crucial in determining the surface quality and
mechanical properties of the steam-chest moulded EPP product. If the Tm-low peak is dominant,
then the moulded EPP product may not have the same geometry as the mould. In contrast, if the
Tm-high peak is dominant, then the sintering will be weak resulting in poor mechanical properties.
The failure mechanism in moulded EPP products have been attributed to the bead boundaries and
a potential fracture path between the beads [149,150]. This is known as inter-bead bonding and it
has been reported that they tend to determine the mechanical properties of the bead products
[149,150]. Inter-bead fracture arises due to weak sintering between the EPP beads. However,
another failure mechanism occurs within the EPP beads and is known as intra-bead fracture. This
failure reflects that there is a good sintering between the EPP beads. The inter-bead and intra-
bead failure mechanism can be investigated by observing under a scanning electron microscope
as shown in Fig. 2.11.
The tensile strength of EPP samples has a strong dependency on the processing steam pressure
and corresponding temperature used during the steam-chest moulding process. The tensile
properties of EPP samples increases at higher steam pressure. A similar phenomenon was
observed in EPS bead processing, where a high tensile strength and a high degree of inter-bead
fusion was obtained at high moulding pressure [150].
The tensile strength of EPP moulded samples also increased significantly due to the development
of crystals in the inter-bead areas during the cooling cycle of the steam-chest moulding process

39
[115,151]. EPP bead size is another important parameter, which affects the inter-bead bonding
and improves the mechanical properties of moulded products [115].
EPP is in a state of constant development and getting ever closer to the customer. Previously
EPP was mainly used in the automotive industry as construction material in the application as
cores for crash bumpers or for tool boxes in the car boot. For those applications the specific
advantages of EPP as low density and good energy dissipation at impact are harvested.
Today’s trends aim towards higher functionality. For example hinges, snap fits or fasteners make
the material fit for new applications as furniture. The challenges are the steam nozzle imprints
and its technical appearance. Therefore the development of multi-material systems is facilitated
[152]. An EPP foam-core can be combined with a layer of TPE for decoration. The connection of
both components can be achieved in an online process. However, if a coating is desired, adhesion
between the coating and EPP is still challenging making a surface treatment necessary [153].
Another approach to modify the properties of EPP is hybridisation [154]. So, the EPP beads are
combined with metal bead foams in order to create a hybrid material with highly elastic behavior
at low stress (behavior dominated by EPP) and high energy dissipation at high stress (behavior
now dominated by metal foam). The purpose is to produce better crash bumpers for cars to
increase passenger safety while reducing weight. It got clear, that the development of EPP is not
at the end, but very dynamic and rapidly advancing, especially towards design and creativity.
Figure 2-11 Failure mechanism: a) inter-bead, b) intra-bead

40
2.6 Thermoplastic polyurethane
Thermoplastic polyurethane (TPU) are class of thermoplastic elastomers (TPE) that combine the
mechanical properties of vulcanized rubber with the processing characteristics of thermoplastic
polymers. The absence of the chemical networks that normally exist in rubber and instead
physical links caused by hydrogen bonding makes TPU material completely reprocessable.
It is well known that TPUs are linear segmented block copolymers of alternating soft and hard
segments. The soft segments (SS), consisting of long polymeric chains of a macro-glycol
(polyether and polyester type), are flexible and weakly polar. The hard segments (HS) are
processed by reaction between diisocyanate, e.g. diphenylmethane-4,4’-diisocyanate (MDI) and
the chain extender, e.g. butanediol. The hard segments are rigid and highly polar. At working
temperature, thermodynamic immiscibility of hard and soft segments results in phase separation
and, consequently a micro-domain structure [160]. Such a structure was first proposed by Cooper
and Tobolsky [161] and is responsible for the peculiar properties of TPUs [162,163]. The hard
segment domains behave as multifunctional tie points functioning both as a physical crosslink’s
and reinforcing fillers, whereas the soft segment form the elastomeric matrix responsible for
material flexibility. This molecular structure results in a number of interesting properties. TPUs
show a high flexibility even at low temperatures, good abrasion behavior, low compression set
and high resistance against oil, fat and solvents.
There is a large number of possible TPUs by varying in the structure of monomers, in
composition and therefore in the final properties. Due to the economic importance of TPU based
on MDI, 1,4-butanediol (BD), and a polyether or polyester macroglycol, the research efforts
have been focused on this particular class of TPUs. The final properties of the TPU are
determined not only by the chemical structure and composition, but also by the synthesis
conditions and thermal history. There is a general assumption that the changes in the thermal
history results in a different microphase structure of the TPU [164,165].
The typical polyurethane is extensively hydrogen bonded [166], the donor being the NH group of
the urethane linkage. The hydrogen-bond acceptor may be either the hard urethane segment (the
carbonyl of the urethane group) or the soft segment (an ester carbonyl or ether oxygen). The
morphological and intermolecular bondings in polyurethane block polymers have been
investigated using various thermoanalytical techniques such as dta, DSC, thermomechanical

41
analysis, and thermal expansion measurements methods. The phase separation starts again as the
cooling process is initiated. Since the mobility of the polymer chains decreases with decreasing
temperature, the phase separation process will be hindered. Different domain and crystallite
morphologies and varying degrees of phase separation can be achieved depending on the cooling
and post annealing conditions [167-172]. A very long annealing time at room temperature, or a
post annealing at temperatures near or above the glass transition temperature of the hard
segments [16,173], are necessary to approach an equilibrium state. Typically thermal transitions
observed in polyurethane elastomers may include the glass transition of either the HS or SS, a
short-range order endotherm of the HS attributable to storage of annealing effects, and
endotherms associated with the long-range order of crystalline portions of either soft [174-177]
or hard segments [178-184]. Above melting temperature of the HS crystallites, the melt becomes
homogeneous [173, 185] with the amorphous HS completely dissolved in the soft segments [167,
173]. The SS glass transition temperature can be used to qualitatively indicate the amount of hard
segment dissolved in the soft domains. A higher glass transition temperature indicates an
increased presence of hard segments dissolved in the soft domains [186,187].
The interpretation of the multiple endothermic behavior observed in TPUs have been extensively
explored and reported in many literatures. The size and position of melting endotherms have
been reported to vary with changes in composition ratio [188,189], soft segment length [176],
annealing [181,183,190,185], processing temperature [191], and mechanical deformation [192].
The endotherm occurring between 50 and 250ºC has been of considerable interest. In earlier
publication [189], the multiple endothermic behavior was attributed to either hydrogen bond
distribution effects or two types of hydrogen bonds, for example, hard segment inter-urethane
hydrogen bonds and hard segment-soft segment hydrogen bonds. However in later studies it was
reported that the observed DSC endotherm are not attributable to hydrogen bond dissociation.
Samuels and Wilkes [193] prepared polymers which employed piperazine and BDO based hard
segments that lacked available hydrogen for hydrogen bonding. However they reported similar
DSC endotherm to those of the hydrogen-bonded materials. They hypothesized that the presence
of various levels of packing order in the hard domains could contribute to the multiple
endotherms.
Seymour and Cooper [164] performed DSC annealing and variable temperature infrared studies
on a series of polyether and polyester-based polyurethanes. They supported the hypothesis

42
proposed by Samuel et al.[194]. They proposed the DSC peaks seen at TI and TII attributed to the
disruption of short and long range order respectively (due to the distribution in hard segment
lengths), and peak TIII to melting of microcrystalline order [164]. By inducing annealing the
short range ordering can be continuously improved until the merging of the I and II regions
[164].
Van Bogart et al.[183] carried an extensive DSC annealing study on several classes of TPUs and
reported that annealing at a certain temperature would invariably result in an endothermic peak
20-50ºC above the annealing temperature. Furthermore, they studied the response of an
MDI/BDO hard segment polymer to annealing, and this yielded similar results to the block
polymers containing shorter sequences of the same material. This implies that annealing-induced
ordering was an intra-domain phenomenon and is not strongly dependent on the presence of soft
segment phase.
Koberstein et al. [185] investigated annealing induced changes in polyurethane morphology
using DSC and simultaneous SAXS-DSC techniques. The relationship between composition
ratio, the presence and position of the various endotherms seen in DSC, and the nature of SAXS
data was analyzed to investigate the structure of the TPU materials. They found the existence of
three endotherm, as reported by earlier researchers.
A major limitation for the use of TPU is its middle up to high hardness. Addition of plasticizers
can achieve soft grade TPUs. However processing is much more challenging and the plasticizers
tend to migrate out of the material in long-term applications. The production of foamed TPU can
reduce the material hardness without additional plasticizers. The reduced density due to foaming
can open new fields of applications for TPU materials. TPUs can be foamed using different
techniques such as extrusion process, batch or continuous process in producing expanded bead
foams.
2.7 References
[1] Landrock AH, Handbook of Plastic Foams: Types, Properties, Manufacture and
Applications.1991, New Jersey: Noyes Publications.
[2] Khemani KC. ACS Symp. Ser. 1997.
[3] Martini-Vvedensky JE, Suh NP, Waldman FA. US Patent 4,473,665; 1984.

43
[4] Park CB, Suh NP, and Baldwin DF, 1999.
[5] Martini JE, Waldman FA, and Suh NP in SPE ANTEC. 1982.
[6] Collias, D. I., & Baird, D. G. (1995). Impact behavior of microcellular foams of
polystyrene and styrene-acrylonitrile copolymer, and single-edge-notched tensile
toughness of microcellular foams of polystyrene, styrene-acrylonitrile copolymer, and
polycarbonate. Polymer Engineering and Science, 35(14), 1178-1183.
[7] Collias, D. I., & Baird, D. G. (1995). Tensile toughness of microcellular foams of
polystyrene, styrene-acrylonitrile copolymer, and polycarbonate, and the effect of
dissolved-gas on the tensile toughness of the same polymer matrices and microcellular
foams. Polymer Engineering and Science, 35(14), 1167-1177.
[8] Matuana, L. M., Park, C. B., & Balatinecz, J. J. (1998). Cell morphology and property
relationships of microcellular foamed PVC/wood-fiber composites. Polymer Engineering
and Science, 38(11), 1862-1872.
[9] Matuana, L. M., Park, C. B., & Balatinecz, J. J. (1998). Structures and mechanical
properties of microcellular foamed polyvinyl chloride. Cellular Polymers, 17(1), 1-16.
[10] Seeler, K. A., & Kumar, V. (1993). Tension-tension fatigue of microcellular
polycarbonate - initial results. Journal of Reinforced Plastics and Composites, 12(3),
359-376.
[11] Kumar, V., & Weller, J. (1994). Production of microcellular polycarbonate using carbon-
dioxide for bubble nucleation. Journal of Engineering for Industry-Transactions of the
Asme, 116(4), 413-420.
[12] Goel, S. K., & Beckman, E. J. (1994). Generation of microcellular polymeric foams using
supercritical carbon-dioxide .1. effect of pressure and temperature on nucleation. Polymer
Engineering and Science, 34(14), 1137-1147.
[13] Handa, Y. P., & Zhang, Z. Y. (2000). A new technique for measuring retrograde
vitrification in polymer-gas systems and for making ultramicrocellular foams from the
retrograde phase. Journal of Polymer Science Part B-Polymer Physics, 38(5), 716-725.
[14] S Siripurapu, Dissertation, Blend-and surface-assisted foaming of polymers with
supercritical carbon dioxide. 2003.
[15] Doroudiani, S., Park, C. B., & Kortschot, M. T. (1998). Processing and characterization
of microcellular foamed high-density polyethylene/isotactic polypropylene blends.
Polymer Engineering and Science, 38(7), 1205-1215.
[16] Kumar V and Schirmer HG, 1997.

44
[17] Park, C. B., Baldwin, D. F., & Suh, N. P. (1995). Effect of the pressure drip rate on cell
nucleation in continuous processing of microcellular polymers. Polymer Engineering and
Science, 35(5), 432-440.
[18] Matuana, L. M., Park, C. B., & Balatinecz, J. J. (1998). Structures and mechanical
properties of microcellular foamed polyvinyl chloride. Cellular Polymers, 17(1), 1-16.
[19] Juntunen RP, Kumar V, and Weller JE. Journal of Vinyl and Additive Technology 2002;
6 (2): 93.
[20] Barlow C, Kumar V, and Flinn B. MD Porous, Cellular and Microcellular Materials,
ASME 2001.
[21] Barlow, C., Kumar, V., Flinn, B., Bordia, R. K., & Weller, J. (2001). Impact strength of
high density solid-state microcellular polycarbonate foams. Journal of Engineering
Materials and Technology-Transactions of the Asme, 123(2), 229-233.
[22] Kumar V. Annual Technical Conference - Society of Plastics Engineers 2002;
60th (2): 1892.
[23] Waldman FA, Ph. D. Dessertation, 1982.
[24] Kumar V, Vanderwel M, and Well J. J. Eng. Mater. Tech 1994.
[25] Arora, K. A., Lesser, A. J., & McCarthy, T. J. (1998). Preparation and characterization of
microcellular polystyrene foams processed in supercritical carbon dioxide.
Macromolecules, 31(14), 4614-4620.
[26] Cooper, A. I. (2000). Polymer synthesis and processing using supercritical carbon
dioxide. Journal of Materials Chemistry, 10(2), 207-234.
[27] Kirby, C. F., & McHugh, M. A. (1999). Phase behavior of polymers in supercritical fluid
solvents. Chemical Reviews, 99(2), 565-602.
[28] Okamoto, M., Nam, P. H., Maiti, P., Kotaka, T., Nakayama, T., Takada, M., et al.
(2001). Biaxial flow-induced alignment of silicate layers in polypropylene/clay
nanocomposite foam. Nano Letters, 1(9), 503-505.
[29] Wissinger, R. G., & Paulaitis, M. E. (1987). Swelling and sorption in polymer-CO2
mixtures at elevated pressures. Journal of Polymer Science Part B-Polymer Physics,
25(12), 2497-2510.
[30] Wissinger, R. G., & Paulaitis, M. E. (1991). Molecular thermodynamic model for
sorption and swelling in glassy polymer-CO2 systems at elevated pressures. Industrial &
Engineering Chemistry Research, 30(5), 842-851.

45
[31] Zhang Q, Xanthos M, and Dey SK. MD (American Society of Mechanical Engineers)
1998; 82 (Porous, Cellular and Microcellular Materials) 75-83.
[32] Handa, Y. P., Zhang, Z., & Wong, B. (2001). Solubility, diffusivity, and retrograde
vitrification in PMMA-CO2, and development of sub-micron cellular structures. Cellular
Polymers, 20(1), 1-16.
[33] Manninen, A. R., Naguib, H. E., Nawaby, A. V., Liao, X., & Day, M. (2005). The effect
of clay content on PMMA-clay nanocomposite foams. Cellular Polymers, 24(2), 49-70.
[34] Koros, W. J., & Paul, D. R. (1978). CO2 sorption in poly(ethylene-terephthalate) above
and below glass-transition. Journal of Polymer Science Part B-Polymer Physics, 16(11),
1947-1963.
[35] Kazarian, S. G., Vincent, M. F., Bright, F. V., Liotta, C. L., & Eckert, C. A. (1996).
Specific intermolecular interaction of carbon dioxide with polymers. Journal of the
American Chemical Society, 118(7), 1729-1736.
[36] Colton, J. S., & Suh, N. P. (1987). The nucleation of microcellular thermoplastic foam
with additives .1. theoretical considerations. Polymer Engineering and Science, 27(7),
485-492.
[37] Condo, P. D., Sanchez, I. C., Panayiotou, C. G., & Johnston, K. P. (1992). Glass-
transition behavior including retrograde vitrification of polymers with compressed fluid
diluents. Macromolecules, 25(23), 6119-6127.
[38] Peter Spitael, Christopher W. Macosko, Richard B, Mcclurg. Macromolecules, 2004, 37
(18), 6874-6882.
[39] Shimoda, M., Tsujimura, I., Tanigaki, M., & Ohshima, M. (2001). Polymeric foaming
simulation for extrusion processes. Journal of Cellular Plastics, , 37(6) 517-536.
[40] Pop-Iliev R, Liu F, G Liu, Park CB (2003). Advances in Polymer Technology, 22, 4, 280-
296.
[41] C. B. Park, D. F. Baldwin, and N. P. Suh, Polym. Eng. Sci., 35, 432-440 (1995)
[42] C. B. Park, A. H. Behravesh, and R. D. Venter, Polym. Eng. Sci., 38, 1812 (1998)
[43] A. H. Behravesh, C. B. Park, and R. D. Venter, Cellular Polymers, 17, 309 (1998)
[44] X. Xu, C. B. Park, D. Xu, and R. Pop-Iliev, Polym Eng Sci 43, 1378 (2003)
[45] W. Michaeli, Extrusion Dies for Plastics and Rubber, 52-64, Hanser (2003)
[46] H. E. Naguib, C. B. Park, P. C. Lee, and D. Xu, J. Polym Eng 26, 6 (2006)

46
[47] J. W. S. Lee, "Investigation of Foaming Behaviors In Injection Molding Using Mold
Pressure Profile," Ph.D., Mechanical and Industrial Engineering, University of Toronto,
Toronto, 2009.
[48] J. Xu, Microcellular Injection Molding: John Wiley and Sons, Inc.,, 2010.
[49] J. W. S. Lee, J. Wang, J. D. Yoon, and C. B. Park, "Strategies to achieve a uniform cell
structure with a high void fraction in advanced structural foam molding," Industrial and
Engineering Chemistry Research, vol. 47, pp. 9457- 9464, 2008.
[50] Liu, G., Park, C.B., and Lefas. J.A., “Production of Low-Density LLDPE Foams in
Rotational Molding”, Polymer Engineering and Science, 38, 1997-2009, 1998.
[51] Gogos, G., "Bubble Removal in Rotational Molding”, Polymer Engineering and Science,
44, 388-394, 2004.
[52] Abdullah, M.Z., Bickerton, S., and Bhattacharyya, D., “Enhancement of Convective Heat
Transfer to Polymer Manufacturing Molds”, Polymer Engineering and Science, 45, 114-
124, 2005.
[53] Crawford, R.J. and Throne, J.L., Rotational Molding Technology, William Andrew
Publishing/Plastics Design Library, 2002.
[54] Martin, D., Halley, P., Truss, R., Murphy, M., Jackson, O., and Kwon, O., “Polyethylene-
layered Silicate Nanocomposites for Rotational Moulding”, Polymer International, 52:11,
1774-1779, 2003.
[55] Dodge, P., Modern Plastics Encyclopedia, D-171, 1996.
[56] Pop-Iliev, R., Rizvi, G.M., and Park, C.B., “The Importance of Timely Polymer Sintering
While Processing Polypropylene Foams in Rotational Molding”, Polymer Engineering
and Science, 43, 40-54, 2003.
[57] Archer, E., Harkin-Jones, E., Kearns, M.P., and Fatnes, A., “Processing Characteristics
and Mechanical Properties of Metallocene Catalyzed Linear Low-density Polyethylene
Foams for Rotational Molding”, Polymer Engineering and Science, 44, 638-647, 2004.
[58] Needham, D.G., U.S. Patent 5,366,675, 1994.
[59] Pop-Iliev, R., and Park, C.B., “Single-step Rotational Foam Molding of Skin-Surrounded
Polyethylene Foams”, Journal of Cellular Plastics, 39:1, 49-58, 2003.
[60] Pop-Iliev, R. and Park, C.B., “Processing of Polypropylene Foams in Melt Compounding
Based Rotational Foam Molding”, Journal of Reinforced Plastics and Composites, 21:12,
1079-1100, 2002.

47
[61] Maletzko C, Keppeler U, Klaus H, de Grave I. US 6,864,298 B2 - EXPANDABLE
POLYOLEFIN PARTICLES, 2005.
[62] Tang L, Zhai W, Zheng W. Autoclave preparation of expanded polypropylene/poly(lactic
acid) blend bead foams with a batch foaming process. J Cell Plast 2011;47:429–46.
[63] Hornberger L, Might T, Mohareb N, Pirie T. Dynamic Properties of Recycled EPS Foam.
Polym Plast Technol Eng 1997;36:917–30.
[64] Doroudiani S, Park CB, Kortschot MT. Effect of the crystallinity and morphology on the
microcellular foam structure of semicrystalline polymers. Polym Eng Sci 1996;36:2645–
62.
[65] Lee EK. Novel Manufacturing Processes for Polymer Bead Foams by. University of
Toronto, 2010.
[66] Stupak PR, Frye WO, Donovan JA. The Effect of Bead Fusion of Polystyrene Foam .
1991.
[67] Zhai W, Kim Y-W, Jung DW, Park CB. Steam-Chest Molding of Expanded
Polypropylene Foams. 2. Mechanism of Interbead Bonding. Ind Eng Chem Res
2011;50:5523–31.
[68] BASF SE. Neopolen P - Technical information. 2009.
[69] BASF SE. Datasheet Neopolen® P 8220 K 2010.
[70] Svec P, Rosik L, Hoak Z, Vecerka F. styrene Based Plastics and Their Modifications.
1990.
[71] Rossacci J, Shivkumar S. Bead fusion in polystyrene foams. J Mater Sci 2003;8:201–6.
[72] Pop-Iliev R, Rizvi GM, Park CB. The importance of timely polymer sintering while
processing polypropylene foams in rotational molding. Polym Eng Sci 2003;43:40–54.
[73] Pop-Iliev R. Manufacture of Integral Skin PP Foam Composites in Rotational Molding. J
Cell Plast 2006;42:139–52.
[74] Bellehumeur CT, Tiang JS. Simulation of non-isothermal melt densification of
polyethylene in rotational molding. Polym Eng Sci 2002;42:215–29.
[75] Mills NJ. Polymer Foams Handbook. Elsevier; 2007.

48
[76] Nakai S, Taki K, Tsujimura I, Ohshima M. Numerical Simulation of a Polypropylene
Foam Bead Expansion Process 2008.
[77] Zhai W, Kim Y-W, Park CB. Steam-Chest Molding of Expanded Polypropylene Foams.
1. DSC Simulation of Bead Foam Processing. Ind Eng Chem Res 2010;49:9822–9.
[78] Zhai W, Kim Y-W, Jung DW, Park CB. Steam-Chest Molding of Expanded
Polypropylene Foams. 2. Mechanism of Interbead Bonding. Ind Eng Chem Res
2011;50:5523–31.
[79] Sands M. An Analysis of Mold Filling and Defect Formation in Lost Foam Castings.
Worcester Polytechnic Institute, 1998.
[80] Stupak PR, Frye WO, Donovan J a. The Effect of Bead Fusion on the Energy Absorption
of Polystyrene Foam. Part I: Fracture Toughness. J Cell Plast 1991;27:484–505.
[81] Mills NJ, Gilcrist A. Shear and Compressive Impact of Polypropylene Bead Foam. Cell
Polym 1999;18:157–74.
[82] Klempner D, Sendijareviʹc V, Aseeva RM. Handbook of Polymeric Foams and Foam
Technology. Hanser Verlag; 2004.
[83] Mills NJ. Time Dependence of the Compressive Response of Polypropylene Bead Foam.
Cell Polym 1997;16:194–215.
[84] Nakai S, Taki K, Tsujimura I, Ohshima M. Numerical simulation of a polypropylene
foam bead expansion process. Polym Eng Sci 2008;48:107–15.
[85] Yang C-T, Lee S-T. Dimensional Stability Analysis of Foams Based on LDPE And
Ethylene-Styrene Interpolymer Blends. J Cell Plast 2003;39:59–69.
[86] Frederick G, Kaepp GA, Kudelko CM, Schuster PJ, Domas F, Haardt UG, et al.
Optimization of Expanded Polypropylene Foam Coring to Improve Bumper Foam Core
Energy Absorbing Capability. 1995.
[87] Mahapatro A, Mills NJ, Sims GLA. Experiments and modelling of the expansion of
crosslinked polyethylene foams. Cell Polym 1998;17:252–70.
[88] Beverte I. Elastic constants of monotropic plastic foams. 2. Deformation parallel to foam
rise direction. Numerical calculations. Mech Compos Mater 1998;34:115–22.

49
[89] Viot P. Hydrostatic compression on polypropylene foam. Int J Impact Eng 2009;36:975–
89.
[90] Müller H. EPS-Herstellung: Druck erfordert Gegendruck. Kunststoffe 2010;2:20–3.
[91] Coquard R, Baillis D, Quenard D. Heat transfer in low-density eps foams. 12èmes
Journées Int. Therm., 2005, p. 291–4.
[92] Stupak PR, Donovan J a. The Effect of Bead Fusion on the Energy Absorption of
Polystyrene Foam. Part II: Energy Absorption. J Cell Plast 1991;27:506–13.
[93] Schellenberg J, Wallis M. Dependence of properties of expandable polystyrene particle
foam on degree of fusion. J Appl Polym Sci 2010;115:2986–90.
[94] Vaitkus S, Gnip I, Keršulis V, Vėjelis S. Prediction of Creep Strain of the Expanded
Polystyrene ( EPS ) in Long-term Compression 2007;13.
[95] Gnip IY, Vaitkus S, Keršulis V, Vėjelis S. Confidence intervals of long-term prediction
and synthesis of creep compliance prediction estimates for expanded polystyrene (EPS)
under permanent compressive stress. Polym Test 2008;27:688–97.
[96] Gnip IY, Vaitkus S, Keršulis V, Vėjelis S. Experiments for the long-term prediction of
creep strain of expanded polystyrene under compressive stress. Polym Test 2010;29:693–
700.
[97] Gimbel GM, Hoshizaki TB. Compressive properties of helmet materials subjected to
dynamic impact loading of various energies. Eur J Sport Sci 2008;8:341–9.
[98] Doroudiani S, Kortschot MT. Polystyrene foams. III. Structure-tensile properties
relationships. J Appl Polym Sci 2003;90:1427–34.
[99] SCHIPS C, HAHN K, HOFMANN M, RUCKDÄSCHEL H, AßMANN J, JANSSENS
G, et al. EP 2 384 354 B1 - Elastic particle foam based on polyolefin/styrene polymer
mixtures, 2013.
[100] Ferkl P, Pokorný R, Bobák M, Kosek J. Heat transfer in one-dimensional micro- and
nano-cellular foams. Chem Eng Sci 2013;97:50–8.
[101] Hansen D, Bernier GA. Thermal conductivity of polyethylene: The effects of crystal size,
density and orientation on the thermal conductivity. Polym Eng Sci 1972;12:204–8.

50
[102] Hansen D, Ho CC. Thermal conductivity of high polymers. J Polym Sci Part A Gen Pap
1965;3:659–70.
[103] Choy CL, Chen FC, Luk WH, Arle II. Thermal Conductivity of Oriented Crystalline
Polymers 1980;18:1187–207.
[104] Costeux S, Zhu L. Low density thermoplastic nanofoams nucleated by nanoparticles.
Polymer (Guildf) 2013;54:2785–95.
[105] Sundarram SS, Li W. On thermal conductivity of micro- and nanocellular polymer
foams. Polym Eng Sci 2013;53:1901–9.
[106] Xie T, He Y-L, Hu Z-J. Theoretical study on thermal conductivities of silica aerogel
composite insulating material. Int J Heat Mass Transf 2013;58:540–52.
[107] Kaemmerlen A, Vo C, Asllanaj F, Jeandel G, Baillis D. Radiative properties of extruded
polystyrene foams: Predictive model and experimental results. J Quant Spectrosc Radiat
Transf 2010;111:865–77.
[108] Placido E, Arduini-Schuster MC, Kuhn J. Thermal properties predictive model for
insulating foams. Infrared Phys Technol 2005;46:219–31.
[109] Tseng C, Kuo K. Thermal radiative properties of phenolic foam insulation. J Quant
Spectrosc Radiat Transf 2002;72:349–59.
[110] Caps R, Heinemann U, Fricke J, Keller K. Thermal conductivity of polyimide foams. Int
J Heat Mass Transf 1997;40:269–80.
[111] Coquard R, Rochais D, Baillis D. Experimental investigations of the coupled conductive
and radiative heat transfer in metallic/ceramic foams. Int J Heat Mass Transf
2009;52:4907–18.
[112] Schellenberg J, Wallis M. Dependence of Thermal Properties of Expandable Polystyrene
Particle Foam on Cell Size and Density. J Cell Plast 2010;46:209–22.
[113] Trassl C, Wörthwein H. Klasse statt Masse. Kunststoffe 2010;12:134–7.
[114] Sasaki H, Nakamura Y. EP002151470A1 - POLYPROPYLENE RESIN FOAM
PARTICLE AND MOLDED ARTICLE THEREFROM, 2010.

51
[115] Guo Y, Hossieny N, Chu RKM, Park CB, Zhou N. Critical processing parameters for
foamed bead manufacturing in a lab-scale autoclave system. Chem Eng J 2013;214:180–
8.
[116] Li G, Wang J, Park CB, Simha R. Measurement of gas solubility in linear/branched PP
melts. J Polym Sci Part B Polym Phys 2007;45:2497–508.
[117] Sato Y, Fujiwara K, Takikawa T, Takishima S, Masuoka H. Solubilities and diffusion
coefficients of carbon dioxide and nitrogen in polypropylene, high-density polyethylene,
and polystyrene under high pressures and temperatures. Fluid Phase Equilib
1999;162:261–76.
[118] Leung SN, Wong A, Guo Q, Park CB, Zong JH. Change in the critical nucleation radius
and its impact on cell stability during polymeric foaming processes. Chem Eng Sci
2009;64:4899–907.
[119] Leung SN, Park CB, Li H. Numerical simulation of polymeric foaming processes using
modified nucleation theory. Plast Rubber Compos 2006;35:93–100.
[120] Sasaki H, Ogiyama K, Hira A, Hashimoto K, Yanagisawa H, Tokoro H. US 6,838,488
B2 - PRODUCTION METHOD OF FOAMED POLYPROPYLENE RESIN BEADS,
2005.
[121] Braun F. US 6,723,760 B2 - METHOD FOR PRODUCING EXPANDED OR
EXPANDABLE POLYOLEFIN PARTICLES, 2004.
[122] Sasaki H, Sakaguchi M, Akiyama M, Tokoro H. US 6,313,184 B1 EXPANDED
POLYPROPYLENE RESIN BEADS AND A MOLDED ARTICLE, 2001.
[123] Hira A, Hashimoto K, Sasaki H. US 7,182,896 B2 - COMPOSITE FOAMED
POLYPROPYLENE RESIN MOLDING AND METHOD OF PRODUCING SAME,
2007.
[124] Schweinzer J, Fischer J, de Grave I, Kogel W. US 5703135 A - Production of expanded
polyolefin beads, 1997.
[125] Choi JB, Chung MJ, Yoon JS. Formation of Double Melting Peak of Poly(propylene- c o
-ethylene- c o -1-butene) during the Preexpansion Process for Production of Expanded
Polypropylene. Ind Eng Chem Res 2005;44:2776–80.

52
[126] Ruiyun Z, Xiaolie L, Qunhua W, Dezhu M. Melting Behavior of Low Ethylene Content
Polypropylene Copolymers with and without Nucleating Agents. Chinese J Polmyer Sci
1994;12:246.
[127] Sasaki H, Hira A, Hashimoto K, Tokoro H. US 20030162012 A1 - Expanded
polypropylene resin bead and process of producing same, 2003.
[128] Napolitano R, Pirozzi B, Varriale V. Temperature dependence of the thermodynamic
stability of the two crystalline α forms of isotactic polypropylene. J Polym Sci Part B
Polym Phys 1990;28:139–47.
[129] Turner-Jones A. Development of the γ-crystal form in random copolymers of propylene
and their analysis by dsc and x-ray methods. Polymer (Guildf) 1971;12:487–508.
[130] Janimak JJ, Cheng SZD, Zhang A, Hsieh ET. Isotacticity effect on crystallization and
melting in polypropylene fractions: 3. Overall crystallization and melting behaviour.
Polymer (Guildf) 1992;33:728–35.
[131] De Rosa C, Guerra G, Napolitano R, Petraccone V, Pirozzi B. Conditions for the α1-α2
transition in isotactic polypropylene samples. Eur Polym J 1984;20:937–41.
[132] Petraccone V, Guerra G, De Rosa C, Tuzi A. Extrapolation to the equilibrium melting
temperature for isotactic polypropylene. Macromolecules 1985;18:813–4.
[133] Hikosaka M, Seto T. The Order of the Molecular Chains in Isotactic Polypropylene
Crystals. Polym J 1973;5:111–27.
[134] Raps D, Köppl T, de Anda AR, Altstädt V. Rheological and crystallisation behaviour of
high melt strength polypropylene under gas-loading. Polymer (Guildf) 2014;55:1537–45.
[135] Nofar M, Guo Y, Park CB. Double Crystal Melting Peak Generation for Expanded
Polypropylene Bead Foam Manufacturing. Ind Eng Chem Res 2013;52:2297–303.
[136] Braun F, Glück G, Hahn K, de Grave I, Tatzel H. US 6677040 B1 - Expanded
polypropylene particles, 2004.
[137] Kogel W, de Grave I, Hahn K, Fischer J. US 5925686 A - Production of expanded
polyolefin particles, 1999.

53
[138] Sasaki H, Sakaguchi M, Akiyama M, Tokoro H. US 6077875 A - Beads comprising
uncrosslinked ethylene-propylene random copolymer having melting point of at least 140
degress celsius as base resin, 2000.
[139] Fischer J, Dietzen F-J, Ehrmann G, de Grave I, Rieger J. US 5744505 A - Prefoamed
polyolefin beads produced by extrusion, 1998.
[140] Tripathi D. Practical Guide to Polypropylene. Rapra Technology Ltd; n.d.
[141] Ito J-I, Mitani K, Mizutani Y. Annealing of commercial block polypropylene. II.
Behavior of poly(ethylene-co-propylene) component. J Appl Polym Sci 1992;46:1235–
43.
[142] Tjong SC, Xu SA. Non-isothermal crystallization kinetics of calcium carbonate-filled β-
crystalline phase polypropylene composites. Polym Int 1997;44:95–103.
[143] Sugano T, Yokkaichi SK, Yokkaichi-Shi M-S. EP 0611795 A1 - Polypropylene resin
expanded particles, n.d.
[144] Tsurugai K, Tokoro H, Oikawa M. US 5747549 A - Polypropylene resin for moldings,
1998.
[145] Yamaguchi T, Iwamoto T, Yamaguchi M, Senda K. US 6607682 B1 - Pre-expanded
polypropylene resin beads and process for producing molded object therefrom by in-mold
foaming, 2003.
[146] Ziegler M. WO 2004003063 A8 - Thermoplastische schaumstoffe mit nanostrukturierten
füllstoffen und verfahren zu ihrer herstellung, 2004.
[147] Fischer J, Rieger J, Hahn K, de Grave I, Kogel W. US 5773481 A - Polyolefin particle
foam, 1998.
[148] Park CB, Liu G, Liu F, Pop-Iliev R, D’Uva S, Zhang B. US 6103153 A - Rotational
molding with charging and rotation, 2000.
[149] Lee JWS, Wang J, Yoon JD, Park CB. Strategies to Achieve a Uniform Cell Structure
with a High Void Fraction in Advanced Structural Foam Molding. Ind Eng Chem Res
2008;47:9457–64.
[150] Barnetson A. Expanded polystyrene: development, processing, applications and key
issues. In: Eaves D, editor. Handb. Polym. Foam., Rapra Technology Limited; n.d.

54
[151] Park CB, Baldwin DF, Suh NP. Effect of the pressure drop rate on cell nucleation in
continuous processing of microcellular polymers. Polym Eng Sci 1995;35:432–40.
[152] Trassl C, Altstädt V, Schreier P. Concepts for particle foam based ultralight automotive
interior parts, 2014, p. 354–7.
[153] Schreier P, Trassl C, Altstädt V. Surface modification of polypropylene based particle
foams, 2014, p. 378–82.
[154] Rapp F, Diemert J. New Applications: Multifunctional Hybrid Foams. Kunststoffe
2012;7:60–3.
[155] Jonsson L. Foaming of TPE with thermally expandable microspheres. Thermoplast.
Elastomers, iSmithers Rapra Publishing; 2010.
[156] Sahnoune A. Foaming of Thermoplastic Elastomers with Water. J Cell Plast
2001;37:149–59.
[157] Kim SG, Lee JWS, Park CB, Sain M. Enhancing cell nucleation of thermoplastic
polyolefin foam blown with nitrogen. J Appl Polym Sci 2010:n/a–n/a.
[158] Garlotta D. A Literature Review of Poly ( Lactic Acid ). J Polym Environ 2001;9:63–84.
[159] Nofar M, Zhu W, Park CB. Effect of dissolved CO2 on the crystallization behavior of
linear and branched PLA. Polymer (Guildf) 2012;53:3341–53.
[160] P.E. Gibson, M.A. Wallace, and S.L. Cooper, Development in Block Copolymers, p.217,
I.Goodman, ed., Elsevier, London (1982).
[161] S.L.Cooper and A.V.Tobolsky, J. Appl. Polym. Sci., 10, 1837 (1966).
[162] G.Oertel, Polyurethane Handbook, Hanser Publishers, Munich (1993).
[163] C.S.Schollenberger, Polyurethane Technol., 197 (1969).
[164] R.W. Seymour and S.I. Cooper, Macromolecules, 6, 48 (1973).
[165] G. Pohl, D. Joel, H. Goering, and H.E. Carius, Plastik und Kautschuk, 40, 357 (1993).

55
[166] R.W. Seymour, G.M. Estes, and S.L. Cooper, Macromolecules, 3, 579 (1970).
[167] Y.Li, T. Gao, J.Liu, K.Linliu, C.R. Desper, and B. Chu, Macromolecules, 25, 7365
(1992).
[168] R.Bonart, L.Morbitzer, and G.J.Hentze, J. Macromol. Sci.-Phys., B3(2), 337 (1969).
[169] J. Blackwell, M.R. Nagarajan, and T.B. Hoitink, Polymer, 23, 950 (1982).
[170] J. Blackwell and C.D.Lee, J. Polym. Sci., Polym. Phys., 22, 759 (1984).
[171] R.M.Briber and E.L. Thomas, J. Macromol Sci. Phys., B22, 509 (1983).
[172] J.T.Koberstein and T.P. Russell, Macromolecules, 19, 714 (1986).
[173] Y.Li, T.Gao, and B.Chu, Macromolecules, 25, 1737 (1992).
[174] J.Foks, H.Janik, and R. Russo, Eur. Polym. J., 26, 309 (1990).
[175] R.Russo, Colloid Polym. Sci., 269, 1 (1991).
[176] K. Sreenivasan, Eur. Polym. J., 27, 811 (1991).
[177] X. Yuying, Z. Zhiping, W. Dening, and Y. Shengkang, Polymer, 33, 1335 (1992).
[178] J.Blackwell and C.D.Lee, Advances in Urethane Science and Technology, K.C. Frisch
and D. Klempner, Eds., Technomic, Stamford, Conn., (1984).
[179] Y. Camberlin, J.P. Pascault, M. Letoffe, and P.Claudy, J. Polym. Sci., Polym. Chem. Ed.,
20, 383 (1982).
[180] T.R. Hesketh, J.W.C. Van Bogart, and S.L.Cooper, Polym. Eng. Sci., 20, 190 (1980).

56
[181] W. Hu and J.T. Koberstein, J. Polym. Sci., Polym. Phys. Ed., 32, 437 (1994).
[182] J.T. Koberstein and A.F. Galambos, Macromolecules, 25, 5618 (1992).
[183] J.W.C. Van Bogart, D.A. Bluemke, and S.L. Cooper, Polymer, 22, 1428 (1981).
[184] J.W.C. Van Bogart, P.E. Gibson, and S.L. Cooper, J. Polym. Sci., Polym. Phys. Ed., 21,
65 (1983).
[185] L.M. Leung and J.T. Koberstein, Macromolecules, 19, 706 (1986).
[186] T.G. Fox, Bull. Am. Phys. Soc., 50, 549 (1956).
[187] L.A.Wood, J. Polym. Sci., 28, 319 (1958).
[188] Z.S.Petrovic and I.Javni, J. Polym. Sci., Polym. Phys. Ed., 27, 545 (1989).
[189] R.W. Seymour and S.L. Cooper, Polym. Lett., 9, 695 (1971).
[190] M.E. Kazmierczak, R.E. Fornes, D.R. Buchanan, and R.D. Gilbert, J. Polym. Sci., Polym.
Phys. Ed., 27, 2188 (1989).
[191] J.A. Miller, S.B. Lin, K.K.S. Hwang, K.S. Wu, P.E. Gibson, and S.L. Cooper,
Macromolecules, 18, 32 (1985).
[192] W. Meckel, W. Goyert, and W. Weider, Thermoplastic Elastomers, N.R. Legge, L.
Holden, and H.E. Schroeder, Eds., Hanser, Munich, New York, 1987.
[193] S.B. Clough, N.S. Schneider, and A.O. King, J. Macromol. Sci., B2, 641 (1968).
[194] S.L. Samuels and G.L. Wilkes, J. Polym. Sci., Polym. Symp., 43, 149 (1973).

57
Chapter 3 Phase Separation and Crystallization of TPU in the Presence of
Dissolved Gas:- Effects of Processing, Nano-/Micron-Sized Additives and Gas Types
3 Phase Separation and Crystallization of TPU in the Presence of Dissolved Gas
3.1 Introduction
Thermoplastic polyurethanes (TPUs) are multi-block copolymers that exhibit a unique
combination of strength, flexibility and processability due to their phase-separated
microstructure.[1,2] These properties result from a molecular structure with rigid HS domains
dispersed in the soft segment (SS) matrix. The SS is a polyol with an ester or ether group in the
main chain having a low glass transition temperature and is viscous at service temperature,
imparting flexibility to TPU. The HS is formed by the reaction of diisocyanate and short-chain
diols, which crystallizes and influences the mechanical properties in TPU such as hardness and
tear strength. As a result of this unique microstructure, TPUs exhibit very good impact properties
at low temperature, excellent chemical resistance and great flexibility over a broad service
temperature, which make them suitable for a wide range of demanding applications such as
automobile parts, construction materials, sports equipment, and medical instruments.[3]
TPU’s phase separation strongly depends on the hydrogen bonding between the HSs and its
crystallization kinetics [4,5]. Generally, the extent of phase separation is incomplete and the
microstructure of TPU consists of mixed HS and SS segmental chains. The presence of inter-
segmental mixing affects the morphology, the thermal and the mechanical properties of TPUs.
The incorporation of HSs within the SSs elevates the glass transition temperature and degrades
the TPUs elastic properties [6]. On the other hand; the inclusion of SS within the HS domains
reduces its crystallinity. Due to its high commercial value, the HS phase-separation and
crystallization behavior in TPUs based on the reaction of 4,4'-methylenediphenyl 1,1'-
diisocyanate (MDI) and butanediol (BDO) have been extensively studied[7,8]. A detailed
morphological analysis using SAXS for a series of MDI/BDO based TPUs showed that the HS
phase-separated domain structure was in agreement with a model proposed by Koberstein and

58
Stein[6]. The basis of this model is that HS chains shorter than the critical length for microphase
separation are presumed to remain dissolved within the SS microphase, while longer segments
aggregate into lamellar HS crystalline domains.
The multiple endotherms, size, and melting peak temperatures in TPUs have been studied by
numerous authors in the past, and the changes in such characteristics have been attributed to the
changes in the HS and SS ratio, thermal annealing, thermal history, processing condition, and
mechanical deformation [4,5,9-11]. Thermal annealing of TPUs leads to rearrangement of
hydrogen bonds and thus improves the formation of HS domains and their crystallization kinetics
[6,12,13]. The thermal studies on TPU have been conducted at atmospheric pressure [6-8,12-14.
There is, however, very limited study on the effects of high pressure gas on the phase-separation
and crystallization behavior of HS in the TPU microstructure. Some studies have investigated the
diffusion of gases such as oxygen, carbon dioxide and hydrogen through TPUs at high pressures;
however, none have discussed the phase-separation and/or crystallization of HSs in the presence
of the dissolved gas [15,16]. In our recent study, we demonstrated the effect of butane gas on the
phase separation and crystallization behaviors of HSs in TPU [17]. The dissolved butane acted as
a plasticizer and assisted the HS chains to phase-separate and significantly increased the overall
heat of fusion of the TPU.
The concept of utilizing dissolved gas to improve the phase separation and crystallization of HS
chains can be effectively used to develop a number of interesting technologies for TPU. One of
the technologies is to introduce cellular morphology, which would lead to density and hardness
reduction and consequently decrease the cost. The heterogeneous cell nucleation rate during
foam processing can be significantly promoted through local pressure variations [18-20], around
the HS domains and crystallites [21-13]. In addition, the surrounding areas of newly formed (or
growing) HS domains and crystals have an increased amount of gas due to gas exertion from the
phase-separated and crystallized region, which is further favorable for heterogeneous cell
nucleation[24]. It is well known that the crystallization behavior of polymers under dissolved gas
is expected to be fundamentally different from that under air at ambient pressure [25]. Dissolved
gas causes swelling of the polymer matrix which increases the molecular chain mobility [25,26].
This affects the surface tension [27-31], the viscosities [32-34], and the thermal behaviors
including the crystallization kinetics [35-38]. Overall the varying crystallization kinetics at
various pressures can significantly influence the final foam morphology.
59
In this chapter, we examined the effect of melt-compounding and the presence of three different
additives on the phase separation and crystallization behavior of HS in the TPU microstructure at
atmospheric pressure using a regular DSC. These additives were nano-clay, nano-silica and
glycerol monosterate (GMS). The melt-compounding and the compounding of the additives into
TPU microstructure were done using a twin-screw micro-compounder. The effect of dissolved
CO2 at high-pressure on the phase separation and crystallization behavior of neat-TPU and TPU
with the additives was investigated using a high-pressure differential scanning calorimeter (HP-
DSC). The effect of dissolved butane on the phase separation and crystallization behavior of
neat-TPU and TPU with GMS was investigated in a specially designed saturation system. The
generated HS crystallites were analyzed with atomic force microscopy, wide-angle X-ray
diffractometer (WAXS) and small angle X-ray diffractometer (SAXS).
3.2 Experimental Procedure
3.2.1 Materials
The TPU used in this study was Elastollan manufactured by BASF with a melting temperature of
171°C, a specific density of 1.13 g/cm3, and a hardness of Shore 90A. The HSs are composed of
reaction between MDI and BDO. The SSs are polyether diols, with a high hydrolysis resistance
tendency. Glycerol monosterate (GMS) used as a diffusion retarder and also an element which
modifies the crystallization behavior of HS was Pationic 915. The nano-clay used was Cloiste
30B. The nano-silica used was Aerosil A 200. The N-butane and CO2, supplied by Linde Gas
Canada, was used as the blowing agent.
3.2.2 Sample preparation
The “as-received” TPU material (AR-TPU) was compounded in a twin screw extruder DSM
Micro-compounder. Prior to compounding, the AR-TPU was dried in a CONAIR drier at 105°C
for 4 hours to remove moisture. The compounding was implemented at a processing temperature
of 190°C for 3 min and a rpm of 50. The samples of the extruded “processed” TPU (PR-TPU)
and the AR-TPU were used in the phase separation and crystallization of HSs .
The “as-received” TPU and GMS were dry blended and then compounded in a twin screw
extruder (DSM Microcompounder). Prior to compounding, the “as-received” TPU was dried in a
CONAIR drier at 105°C for 4 hours to remove moisture. The compounding was implemented at

60
a processing temperature of 190°C for 3 min and a screw speed of 50 rpm. A series of TPU-
GMS samples with GMS contents of 0.5, 1 and 2 wt%, named as TPU-05GMS, TPU-1GMS and
TPU-2GMS, respectively, were prepared.
The “as-received” TPU material (AR-TPU) and nano-clay (Cloisite 30B) were compounded in a
twin screw extruder (DSM Microcompounder). Prior to compounding, the AR-TPU was dried in
a CONAIR drier at 105°C for 4 hours to remove moisture. A series of TPU/nano-clay sample
with nano-clay contents of 0.5, 1 & 2 wt% (TPU-05NCl, TPU-1NCl and TPU-2NCl) were
prepared.
The “as-received” TPU material (AR-TPU) and nano-silica (Aerosil A200) were compounded in
a twin screw extruder (DSM Microcompounder). Prior to compounding, the AR-TPU was dried
in a CONAIR drier at 105°C for 4 hours to remove moisture. A series of TPU/nano-silica sample
with nano-silica contents of 0.5, 1 & 2 wt% (TPU-05NSi, TPU-1NSi and TPU-2NSi) were
prepared.
3.2.3 Rheological analysis
The shear viscosities of AR-TPU, PR-TPU, TPU-GMS, TPU-NCl and TPU-NSi samples were
measured using a ARES Rheometry with a 25 mm diameter parallel plate geometry and 1 mm
gap. The samples were first heated, between the parallel plates, to the desired temperature, which
was followed by a frequency sweep test. The angular frequency ranged from 0.1 to 100 rad/s.
Dynamic oscillatory tests were carried at a strain rate of 5% corresponding to the linear visco-
elastic zone. The samples were dried in a vacuum oven prior to the experiments. The
experiments were performed in a nitrogen environment to suppress thermo-oxidative
degradation.
Rheological experiments were also performed to study the isothermal crystallization kinetics of
AR-TPU, PR-TPU, TPU-GMS, TPU-NCl and TPU-NSi samples using the similar setup as
discussed above with the ARES rheometry. Time sweep experiments were carried out at a low
frequency of 1 Hz and a strain of 5%. For all the experiments, the samples were first put between
the rheometer plates at 230oC within a nitrogen environment in a convection oven to suppress
degradation. The samples were kept at a temperature of 230oC for 3 min to eliminate the thermal

61
history of the TPU samples, and then the samples were rapidly cooled to the desired temperature
to perform the time sweep tests.
3.2.4 Atomic force microscopy
Atomic Force Microscopy (AFM) experiment was performed on samples using a Nanoscope
IIIA Multimode AFM machine. The data was collected in air in tapping mode using a diving
board TESP cantilever. The data were recorded as 512 x 512 pixel data sets at a scanning rate of
1 Hz. Prior to the AFM experiment, the samples were cryo-microtomed with a Leica UltraCut
UCT microtome machine using liquid nitrogen. The cutting speed was set to 5 mm/sec, and a
final 70 nm cut was used to get the surface.
3.2.5 Crystallization analysis of TPU at ambient pressure
To analyze the non-isothermal melt crystallization and isothermal crystallization behaviors of the
neat-TPU and TPU samples with additives (GMS, nano-clay and nano-silica) at ambient pressure
(1 bar) a regular Differential Scanning Calorimetry (DSC-Q2000) from TA Instruments was
utilized.
3.2.5.1 Non-isothermal melt crystallization analysis
The samples were heated to 230°C at a rate of 10°C/min and equilibrated for 10 min. Next, the
samples were cooled to -90°C at a rate of 10°C/min. Then the samples were reheated to 250°C at
a rate of 10°C/min. Similarly, to investigate the effects of the additives (GMS, nano-clay and
nano-silica) on the phase separation and crystallization behavior of HSs in the TPU
microstructure the melt crystallization behavior was analyzed with the method discussed above.
3.2.5.2 Isothermal crystallization analysis
The production of expanded TPU bead foams requires annealing of the material at elevated
temperatures, which would affect the HS crystalline domains. Hence to investigate the effect of
annealing, isothermal experiments were implemented at elevated temperatures under ambient
pressure (1 bar) using DSC. The samples were heated to the desired isothermal temperature at a
constant heating rate of 20°C/min. Then, the samples were annealed for 60 min. This was
followed by cooling at a rate of 20°C/min to -90°C. Subsequently a second heating step was
conducted at a rate of 10°C/min to 230°C to investigate the effects of annealing treatment.

62
3.2.6 Crystallization analysis of TPU at high-pressure with dissolved gas
As discussed earlier, during the production of expanded TPU beads, the TPU material is
annealed at elevated temperatures in the presence of gas. The dissolved gas causes swelling of
the TPU matrix, which increases the molecular chain mobility. This affects the thermal behavior
and the crystallization kinectics of the HSs chains in the TPU matrix. Overall the varying
crystallization kinetics at various pressures can significantly influence the final foam
morphology. Hence to investigate the effect of dissolved gas on the crystallization behavior of
the HS chains in the TPU matrix both the non-isothermal and isothermal crystallization behavior
of neat-TPU and TPU with different additives was investigated with CO2 and butane,
respectively.
3.2.6.1 Non-isothermal melt crystallization analysis in presence of CO2
To analyze the non-isothermal melt crystallization and isothermal crystallization behaviors of the
neat-TPU and TPU samples with additives (GMS, nano-clay and nano-silica) in presence of
dissolved CO2 a HP-DSC (NETZSCH DSC 204 HP, Germany) was utilized. The HP-DSC was
calibrated by measuring the melting points and heat of fusion for In, Bi, Sn, Pb, and Zn under
ambient and high CO2 pressures.
The samples were heated to 230°C at a rate of 20°C/min and equilibrated for 10 min in the
presence of high-pressure CO2. Next, the samples were cooled to 10°C at a rate of 20°C/min also
in the presence of high-pressure CO2. Finally, the samples were reheated to 250°C at a rate of
10°C/min in the presence of high-pressure CO2. The effects of varying CO2 pressure on the melt
crystallization behavior of the samples were investigated.
3.2.6.2 Isothermal crystallization analysis in presence of high-pressure CO2
To investigate the effect of dissolved CO2 on the isothermal crystallization behavior of AR-TPU,
PR-TPU, TPU-GMS, TPU-NCl and TPU-NSi, the samples were saturated at the desired
saturation temperature at elevated CO2 pressures by using HP-DSC (NETZSCH DSC 204 HP,
Germany). The samples were heated to the desired saturation temperature at a rate of 20°C/min
and equilibrated for 60 min. Next, the samples were cooled to 10°C at a rate of 20°C/min. Then,
CO2 was released at a very low-pressure drop rate to avoid any cell nucleation (and thereby to
63
avoid the influence of expansion on the crystallization of HS).Then, the samples were degassed
at room temperature for 2 hours and were reheated to 250°C at a rate of 10°C/min. Thereby, the
effects of isothermal saturation on the crystallization behavior of the samples were investigated
in the presence of dissolved CO2.
3.2.6.3 Isothermal crystallization analysis in presence of high-pressure butane
Our high pressure DSC (Netzsch DSC 204 HP) that has been used to study the effect of the
dissolved gas on the isothermal crystallization behaviours of polymers [39,40] could not
accommodate the liquid-state, high-pressure gas. So it was necessary to design a procedure to
study the effect of dissolved butane on the crystallization of TPU without using the high pressure
DSC.
To investigate the isothermal crystallization behaviour under butane pressure, the respective TPU
sample was saturated in the autoclave foaming chamber for 60 min at various annealing
temperatures (Figure 3.1). This procedure was similar to the foaming process, which will be
described in detail in Chapter 4. But, since expansion of bubbles may affect the TPUs
crystallization through biaxial stretching [41,42], foaming was completely prevented by rapidly
quenching the chamber in water before depressurization (i.e., after gas saturation). Then, butane
was released at a very low-pressure drop rate to avoid any cell nucleation (and thereby to avoid
the influence of expansion on the crystallization of HS). Then, the samples were degassed at the
room temperature for 48 hours and were heated from -90ºC to 230ºC at a heating rate of
10ºC/min in DSC. Thereby, the effects of isothermal saturation on the crystallization behavior of
both the AR-TPU and the PR-TPU were investigated in the presence of butane.

64
Figure 3-1 Schematic of the saturation setup with butane
3.2.7 Phase separation and crystallization analysis using X-ray diffraction
A significant problem in studies of urethane morphology is obtaining sufficient contrast in
electron micrographs to visualize the system. Since even highly phase separated systems will
possess regions of similar density, mass thickness contrast will be intrinsically low. Hence the
structure of HS crystallites have been successfully investigated by Wide-angle X-ray scattering
(WAXS) and Small-angle X-ray scattering (SAXS). Both the techniques were used in this thesis
to investigate the changes in the HS morphology and crystallinity.
3.2.7.1 Wide-angle X-ray scattering (WAXS)
The WAXS analysis was carried out using a Siemens D5000 diffractometer with Cu-Kα source
operating at 50 kV and 35 mA. The data was then processed by Siemens DiffracPlus software.
3.2.7.2 Small-angle X-ray scattering (SAXS)
The SAXS profiles were collected for samples in air and room temperature using a Bruker
SMART6000 CCD area detector with a Cu rotating anode source operating at 50kV and 90mA.
The average wavelength was 1.5418 Å. The sample to detector distance was approximately 300
mm. The raw frames were smoothed to correct for detector noise, and integrated into 1D profiles.

65
All the SAXS profiles presented have been masked in the low scattering vector region where
beam stop influenced the profile.
3.3 Results and Discussions
3.3.1 Rheological behavior of TPU and TPU nano-/micro-composites
The formation of the HS crystallite depends on the molecular mobility of the HS chains, which
are significantly affected by the viscosity [43,44]. For this purpose, the melt viscosity of both the
AR-TPU and the PR-TPU samples was measured at various conditions. Figure 3.2 shows the
viscoelastic behaviors of the AR-TPU and the PR-TPU samples at temperatures of 200°C and
210ºC, as a function of the frequency. As anticipated, both the samples showed a shear thinning
behavior. As shown in Fig. 3.2, the complex viscosity of the PR-TPU was lower than the AR-
TPU sample at both temperatures. The drop in the viscosity may be correlated with the decrease
of PR-TPU’s molecular weight and broader distribution of the HS chain segments caused by the
high mechanical shear and polymeric chain scission during the melt processing in the twin screw
extruder.
1 10 10010
1
102
103
AR-TPU- 200 C
PR-TPU- 200 C
Sh
ea
r V
isco
sity (
Pa
.s)
Frequency (rad/sec)
AR-TPU- 210 C
PR-TPU- 210 C
Figure 3-2 Complex shear viscosity plot of AR-TPU and PR-TPU
Figure 3.3 compares the viscoelastic behaviors of the AR-TPU and the PR-TPU samples with
respect to the presence of additives (1wt%GMS, 1wt% NCl and 1 wt% NSi). As shown in Fig.
3.3, the complex viscosity of TPU decreases in the presence of nano-/micron-sized additives.
The addition of GMS acts as a lubricant and hence decreases the viscosity of TPU. On the other

66
hand, the presence of nano-clay and nano-silica may affect the HS chain segment distribution
and the molecular weight resulting in the lower viscosity.
1 10 100
100
101
102
103
104
Com
ple
x v
iscosity (
Pa-s
)
Frequency (rad/sec)
AR-TPU
PR-TPU
TPU-1GMS
TPU-1NCl
TPU-1NSi
Temperature = 2100C
Figure 3-3 Complex shear viscosity plot of AR-TPU, PR-TPU, TPU-1GMS, TPU-1NCl and
TPU-1NSi
Time sweep experiments were used to study the change of crystallization under small-amplitude
oscillatory shear (SAOS) with small deformation. First, the samples were heated to 230°C and
equilibrated for 3 min to erase the thermal history. Next, the samples were cooled down rapidly
to 155°C and 165°C, respectively. After the sample reached the desired temperature, SAOS was
applied to study the quiescent crystallization. A constant frequency of 1 Hz with a strain of 1%
was selected to prevent non-linear viscoelasticity and disturbance of the evolving structures.
Figure 3.4 depicts the plots of the increase of the storage modulus (G’) during crystallization of
the AR-TPU and the PR-TPU samples. Initially, the G’ value remained constant in both the AR-
TPU and the PR-TPU samples due to less structural changes in the molten polymers. However,
at an intermediate times, the G’ values of the samples increased, which indicated a phase
transition related to the crystallization of HS. The onset of crystallization shows the properties of
the polymer to be changing from a liquid-like to a solid-like behavior as soon as the HS
crystallites became sufficiently interconnected. As shown in Fig. 3.4, the onset of crystallization
shifted clearly to an earlier time for the PR-TPU compared to the AR-TPU. Thereby, the low
viscosity can facilitate the mobility of the HSs in the PR-TPU to stack and crystallize with higher
perfection.

67
0.1 1 1010
0
101
102
103
104
105
AR-TPU-165 C
PR-TPU-165 C
G' (
Pa
)
Time (min)
AR-TPU-155 C
PR-TPU-155 C
Figure 3-4 Time sweep rheological curves of AR-TPU and PR-TPU
In the presence of additives (1 % GMS, 1 % NCl and 1% NSi), the onset of HS crystallization
further shifted to earlier time compared to PR-TPU and AR-TPU as shown in Fig. 3.5. The
decreased viscosities in presence of the additives would have further assisted the mobility of the
HSs in the TPU microstructure resulting in the observed increase in the viscosity during the time
sweep experiments.
1 10 10010
1
102
103
104
G' (
Pa
-s)
Time (min)
AR-TPU
PR-TPU
TPU-1GMS
TPU-1NCl
TPU-1NSi
Figure 3-5 Time sweep rheological curves of AR-TPU, PR-TPU, TPU-1GMS, TPU-1NCl
and TPU-1NSi

68
3.3.2 Atomic force microscopy
Figure 3.6a shows the AFM images of the AR-TPU sample, which reveals the presence of
spherical phase-separated HS crystalline domains (marked with a thick solid arrow). These HS
crystalline domains have a diameter of approximately 1 µm. This was because, the longer HS
chains could not stack to form crystallites with higher degree of perfection due to the low
molecular mobility in the AR-TPU [44,45]. As seen in Fig. 3.6b, the PR-TPU sample showed a
much smaller spherical phase-separated HS domains (marked with a thick solid arrow) ranging
between 300-500 nm in diameter, which confirms the breaking of the HS chains. However, a
high concentration of nano-sized fiber-like crystallites, marked with a thin solid arrow in Fig.
3.6b dispersed in the SS matrix was also observed. These HS crystallites are in the range of 200
to 500 nm in length. As discussed earlier, the processing provided a broad sequence distribution
of HS chains. However, the facilitated molecular mobility caused certain HS chains to stack and
crystallize with a higher perfection and thereby nano-scale crystalline structures were appeared.
Although the AR-TPU sample also showed these fiber-like crystallites marked with a thin solid
arrow in Fig. 3.6a, their concentration was much lower compared to the PR-TPU. Moreover,
both the AR-TPU and the PR-TPU showed HS spheres in the range of 50-100 nm marked with a
circle in Fig. 3.6a and Fig. 3.6b. These HS spheres are from the very short HS chains that can
hardly crystallize and hence lie dispersed in the SS matrix.
Figure 3.7 shows the AFM image of the PR-TPU sample after annealing at 160°C with the
presence of butane at a saturation pressure of 55 bar. It is clearly seen that compared to untreated
PR-TPU (Fig. 3.6b), the sample annealed with butane showed much larger HS crystallites with a
diameter of approximately 1 µm (marked with a thick solid arrow) and the mechanism for their
formation is discussed latter.
The AFM surface morphology for TPU-1GMS shows HS spherulites (marked with solid arrows
in Fig. 3.8) with approximately 500-1000 nm in diameter. The formation of α and β spherulites
have been reported in bulk morphology of TPUs as a result of high level of mobility of
MDI/BDO based HS chains due to the flexibility of BDO group[46-48]. The presence of GMS
would have assisted the HS chains to coil and fold and form spherulites, which is confirmed in
the DSC endotherms of TPU-GMS samples (Fig. 3.8).

69
Figure 3-6 AFM images: (a) AR-TPU, (b) PR-TPU; Scale: 5 μm side length in both
micrographs
Figure 3-7 AFM image of PR-TPU after saturating at 160°C with butane at 55 bar
pressure; Scale: 5 μm side length
Figure 3-8 AFM image of TPU-1GMS; Scale: 5 μm side length in the micrograph
(b
)
(a)
(b
)

70
3.3.3 Crystallization analysis of TPU at ambient pressure
3.3.3.1 Non-isothermal melt crystallization analysis with regular DSC
The isocyanate and hydroxyl end groups that form the characteristic urethane linkages in TPU
are stable in the solid state of the polymer. However, above a certain stability temperature in the
molten state, the urethane bonds start dissociating. This phenomenon is known as
“transurethanization” and it affects the sequence of the HS chain distribution [49,50]. For MDI
based TPUs, processing above 190-200 ºC increases the rate of trans-reactions [50,51].
Generally, the melt processing of MDI based TPUs leads to a polydisperse system with the
formation of both short and long HS chains. Upon cooling the melt of a polydisperse system, the
HS chains phase-separate into different crystalline domain sizes. A polydisperse distribution of
HS in TPU shows multiple melting endotherms, which can be attributed to different size and
various levels of packing order in the phase-separated HS domains and microcrystalline
structure. [50-52].
Figure 3.9 shows the cooling traces of the TPU samples. As seen, the PR-TPU showed a much
earlier on-set of the HS crystallization than the AR-TPU. These results suggest that in the PR-
TPU sample some of the HS with certain repeat units could have possibly crystallized much
faster at higher temperatures. Based on a widely accepted morphological model by Koberstein-
Stein, the most readily crystallizable sequence is estimated to be between two and four HS repeat
units for MDI/BDO based TPU [53]. However, at higher temperatures, the increased mobility
permits the crystallization of successively longer HS chains. The model also showed that BDO
residue could be present in various conformations (gauche and trans), and subsequently could
switch between these conformations at a rate that was determined by the temperature of the
sample. They concluded that the BDO residue could facilitate the folding or coiling of longer HS
chains to form crystalline lamellae. Based on this model, the widely distributed HS chains in the
PR-TPU may have better mobility to crystallize at the higher temperature with more closely
packed phase-separated HS domains, compared to the AR-TPU.

71
30 60 90 120 150 180 2100.5
0.6
0.7
0.8
0.9
1.0
1.1
Endo
183.5oC
12J/g
172oC
96.4oC
12J/g
12J/g
171oC
98.6oC
PR-TPU
AR-TPU
heating curve H
ea
t F
low
(J/g
)
Temperature (oC)
cooling curve
12J/gExo
Figure 3-9 DSC curves of the AR-TPU and PR-TPU samples
Figure 3.10 shows the DSC cooling curves for PR-TPU and TPU-GMSs samples. Overall,
addition of GMS significantly promoted the crystallization kinetics of HSs in the TPU
microstructure. In case of TPU-05GMS sample the crystallization temperature increased by
22.5°C. Further increase in GMS concentrations did not affect the crystallization temperature of
HS. Figure 3.10 also illustrates that PR-TPU and TPU-GMS samples showed double peaks in
their cooling curve. In case of PR-TPU, the high temperature peak (marked with hatched area in
Fig. 2) was observed as a shoulder peak and there was presence of sharper low temperature peak
at 98.5°C. With the addition of 0.5 wt% GMS, the high temperature shoulder peak observed in
neat-TPU changed to a broad exothermic peak. On the other hand, the low temperature peak
reduced significantly to form a shoulder peak (marked with solid dashed arrow in Fig. 3.10).
The mechanical shear from compounding would have broken the original sequence distribution
of HS chains into a much wider HS chain length distribution in both neat-TPU and TPU-GMS
samples due to the “transurethanization” reaction [54,55]. The HS chains phase-separate into
different domain sizes and microcrystalline structure upon cooling from the melt. However, as
discussed earlier some shorter HSs with repeat length below the critical phase-separation length
would remain dissolved in the SS microphase in the neat-TPU. On the other hand, in the case of
TPU-GMS samples, the lubricating effect of GMS may have promoted formation of a wide size
and perfection in HS domains due to the increase in the mobility of HS chains. The melting
endotherms confirmed the formation of wide size distribution of HS crystallites in TPU-GMS

72
samples as depicted in Fig. 3.11a. Both neat-TPU and TPU-GMS samples showed a broad
melting endotherm. However TPU-GMS (0.5 %, 1% and 2 %) showed formation of a new high
temperature shoulder peak above 180°C up to 210°C and the peak became more distinct with an
increase in the GMS concentration (hatched area in Fig. 3.11b). The highly perfected HS
crystallites, formed due to the lubricating effect of GMS, melt in the high temperature range
observed.
Figure 3-10 DSC cooling curves of PR-TPU and TPU-GMS samples
-100 -50 0 50 100 150 2000.0
0.2
0.4
0.6
0.8
1.0
172.8
171.4
74.0
74.4
TPU-05GMS
TPU-2GMS
TPU-1GMS
Heat flow
(J/g
)
Temperature (°C)
neat-TPU
72.9
70.4
171
170Endo
(a)
170 180 190 200 210 2200.05
0.10
0.15
0.20
0.25
184.3
197.4
184.1
204.7
205.9
185.4
Temperature (°C)
Heat flow
(J/g
)
neat-TPU
TPU-05GMS
TPU-1GMS
TPU-2GMS
183.9
(b)
Figure 3-11 DSC melting curves of PR-TPU and TPU-GMS samples: (a) regular plot, (b)
magnified plot for high temperatures
Figure 3.12a shows the DSC cooling curves for PR-TPU and TPU-NSi samples. Similar to the
PR-TPU samples, TPU-NSi showed double peaks in their cooling curve. The area of the high
temperature peak was observed to increase by increasing the nano-silica concentration. Thus at

73
higher nano-silica content, the HS crystallites could grow and stack into better perfection. The
melting of the bigger and/or highly perfected crystals was confirmed in the melting curve of
TPU-2NSi samples as shown in Fig. 3.12b, where a formation of a very broad high melting peak
was formed between 180°C to 210°C. In the case of addition of nano-clay to the TPU, the
crystallization was not significantly different compared to PR-TPU as shown in Fig. 3.13.
Figure 3-12 DSC curves of PR-TPU and TPU-NSi samples: (a) exotherms, (b) endotherms
Figure 3-13 DSC curves of PR-TPU and TPU-NCl samples: (a) exotherms, (b) endotherms
3.3.3.2 Isothermal crystallization with regular DSC
To investigate the effect of the annealing temperature on the HS crystallization at ambient
pressure (1 bar), an isothermal analysis was carried out using DSC. Figure 3.14 shows the DSC
endotherm of the PR-TPU after the isothermal treatments over a wide range of temperatures. It
should be noted that the AR-TPU showed a similar behavior and hence is not shown. Table 3.1
30 60 90 120 150 180 2100.0
0.1
0.2
0.3
0.4
0.5
TPU-2NSi
TPU-1NSi
98.5oC
12J/g
98oC
13J/g
98oC
13J/g
98.5oC
13J/g
He
at F
low
(J/g
)
Temperature (oC)
Cooling graphs: 10oC/min
Exo
PR-TPU
TPU-05NSi
(a)
30 60 90 120 150 180 210-0.6
-0.5
-0.4
-0.3
TPU-2NSi
TPU-1NSi
TPU-05NSi
2nd
Heating graphs: 10oC/min
Temperature (oC)
He
at F
low
(J/g
)
170oC
171oC
170oC
171oC
Endo PR-TPU
(b)
30 60 90 120 150 180 2100.0
0.1
0.2
0.3
0.4
0.5
TPU-2NCl
TPU-1NCl
TPU-05NCl
98.5oC12J/g
98oC
13J/g
98oC
13J/g
97oC
13J/g
Cooling graphs: 10oC/min
He
at F
low
(J/g
)
Temperature (oC)
Exo
PR-TPU
(a)
30 60 90 120 150 180 210-0.6
-0.5
-0.4
-0.3
TPU-2NCl
TPU-1NCl
TPU-05NCl
171oC
171oC
171oC
170oC
2nd
Heating graphs: 10oC/min
He
at F
low
(J/g
)
Temperature (oC)
Endo(b)
PR-TPU

74
summarizes the melting peaks and the heat of fusion (ΔHf) from the DSC experiments for both
the AR-TPU and the PR-TPU samples. It can be seen that the increased annealing temperature
shifted the low temperature melting peak (Tm-low) to higher temperatures generally 15-20°C
above the annealing temperature. Seymour and Copper [56] have reported this behavior in their
studies, and have related the shifting of the low melting peak to higher temperatures caused by
the growth or perfection of the smaller HS crystalline domains. At a lower annealing
temperature, the Tm-high1 and Tm-high2 melting peaks are not affected and are related to the melting
of larger and highly perfected HS crystalline domains. At an annealing temperature of 150ºC, Tm-
low merges with the Tm-high1. By further increasing the annealing temperature to 155°C, two
melting peaks began to appear as shown in Fig. 3.15. The Tm-high1 can be attributed to the melting
of the highly perfected HS crystals, which are formed due to the annealing condition. At the
same time, a new low melting peak (Tm-low), marked by arrow, is also generated as shown in Fig.
3.15. In this case, the annealing condition caused melting of the less perfect HS crystals, and the
molten HS chains re-crystallized when cooled to form the Tm-low melting peak. By increasing the
annealing temperature further to 160°C and 165°C, the Tm-high1 melting peak associated with HS
crystals, which are perfected from annealing shifts to 174.5°C and 179.8°C [57]. Thus, a new
higher melting peak is formed instead of the original melting temperature of the PR-TPU.
Although the Tm-high1 peak shifted to a higher temperature, the area under the peak decreased.
This was followed by an increase in the area of the Tm-low peak as shown in Fig. 3.15. The higher
portion of the HS crystals became molten and contributed to the formation of Tm-low melting peak
during cooling. In other words, at an increased annealing temperature, more of the original HS
crystals were melted and thereby more melt became available during the cooling, which
promoted the formation of the HS crystals with low perfection.
After annealing at 180ºC (Fig. 3.16), the Tm-high1 peaks of the AR-TPU and the PR-TPU samples
shifted to 195.2 ºC and 197°C, respectively. However, the Tm-high2 peak, which existed only in the
PR-TPU sample shifted to a very high temperature of 211°C. Thus, the PR-TPU sample had a
higher number of highly perfected HS crystals compared to the AR-TPU sample.
It is also important to observe that the total heat of fusion (ΔHT) of both the AR-TPU and the
PR-TPU samples decreased with an increase in the annealing temperature as seen in Table 3.1.
Hesketh et al. [58] studied a series of PUs after annealing at various temperatures between 120ºC
and 190ºC. They reported that the fraction of HS chains dissolved in the SS increased when
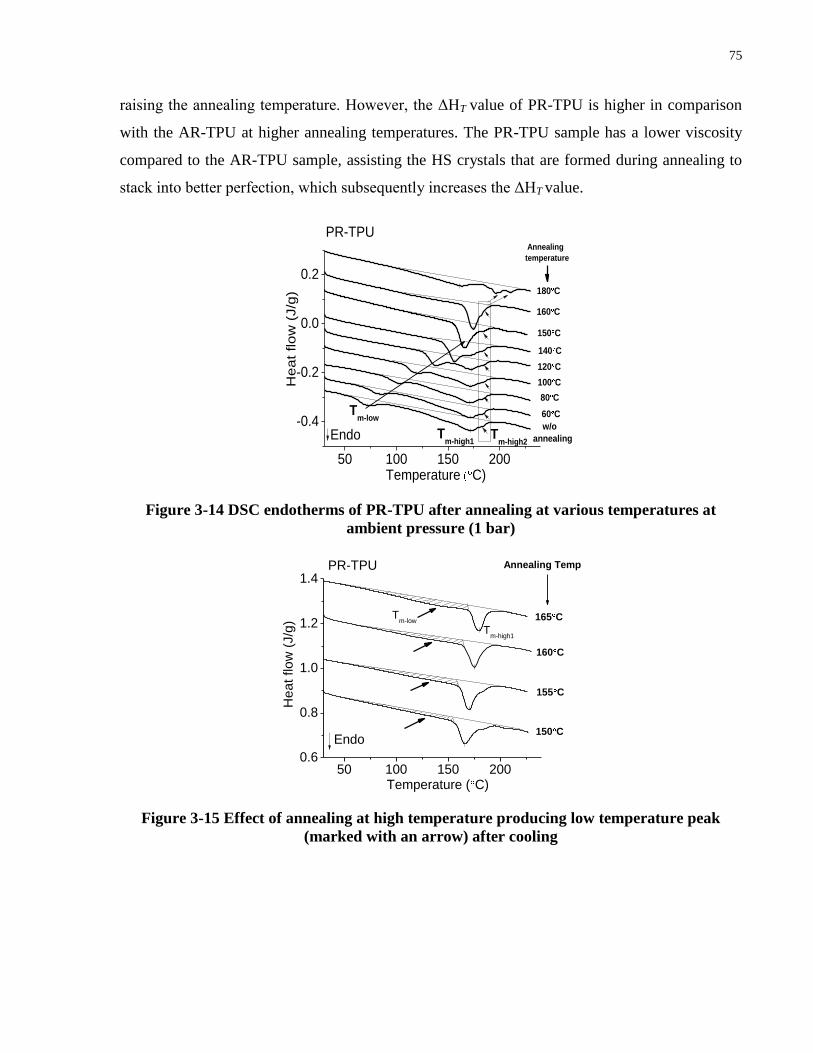
75
raising the annealing temperature. However, the ΔHT value of PR-TPU is higher in comparison
with the AR-TPU at higher annealing temperatures. The PR-TPU sample has a lower viscosity
compared to the AR-TPU sample, assisting the HS crystals that are formed during annealing to
stack into better perfection, which subsequently increases the ΔHT value.
50 100 150 200
-0.4
-0.2
0.0
0.2
Annealing
temperature
Tm-high2
Endo
PR-TPU
Tm-high1
Tm-low
180 C
160 C
150 C
140 C
100 C
120 C
80 C
60 C
w/o
annealing
He
at
flo
w (
J/g
)
Temperature C)
Figure 3-14 DSC endotherms of PR-TPU after annealing at various temperatures at
ambient pressure (1 bar)
50 100 150 2000.6
0.8
1.0
1.2
1.4Annealing Temp
Tm-low
PR-TPU
165 C
160 C
155 C
150 C
He
at
flo
w (
J/g
)
Temperature ( C)
Endo
Tm-high1
Figure 3-15 Effect of annealing at high temperature producing low temperature peak
(marked with an arrow) after cooling

76
50 100 150 200-0.6
-0.4
-0.2
13.31 J/g
15.38 J/g
197 C
195.2 C
211 C
AR-TPU
PR-TPU
He
at flo
w (
J/g
)
Temperature ( C)
Post annealing at 180 C
Endo
Figure 3-16 DSC endotherm of AR-TPU and PR-TPU after annealing at 180°C for 60 min
Table 3-1 Data of DSC measurements at ambient pressure (1bar)
AR-TPU PR-TPU
Anneal
Temp
(°C)
ΔHT
(J/g)
[SD]
Tm(oC) ΔHT
(J/g)
[SD]
Tm(oC)
TgTm-
low
Tm-
high 1
Tm-high 2 Tg Tm-low Tm-high 1 Tm-high 2
w/o
annealin
g
36.1
[0.20]-40.6
126.
0172.5 -
38.0
[0.11]-40.7 67.9 171.9 183.1
10020.2
[0.09]-45.1
126.
3174.1 -
17.6
[0.06]-42.9 118.5 171.1 183.1
12019.1
[0.02]-47.2
138.
1173.2 -
18.4
[0.07]-44.7 138.4 173.2 183.1
14017.8
[0.12]-40.1
155.
7174.7 -
19.0
[0.16]-43.8 155.9 174.8 183.1
15017.6
[0.20]-40.5
107.
7165.8 -
19.6
[0.14]-38.2 109.9 165.5 184.2
15519.6
[0.03]-35.9
114.
5170.1 -
19.8
[0.10]-42.8 118.3 170.1 184.4
16516.5
[0.14]-39.1
126.
3178.8 -
17.3
[0.20]-37.4 130.1 179.8 185.1
18013.3
[0.06]-
165.
9195.2 -
15.3
[0.10]- 163.4 197.9 211.1
At lower annealing temperatures, the presence of GMS, nano-clay and nano-silica did not affect
the isothermal crystallization behavior of TPU at ambient pressure. However at higher annealing
temperature (i.e. 180°C), the presence of GMS in particular affected the perfection in the HS
crystallites. Figure 3.17 compares the melting curve of PR-TPU and TPU-GMS samples after
annealing at 180°C. As shown the melting curve of PR-TPU consisted of three peaks. The first

77
peak is broad and has a maximum at 161.3°C. The second and third peaks are smaller but at a
much high temperatures of 197ºC and 211ºC. The broad melting peak is from the HS crystallites
formed during cooling. The two high temperature peaks are the melting of different sizes of
larger HS crystallites, which stacked into higher perfection due to the annealing. The TPU-
05GMS sample showed a broad melting peak with a maximum at 162.9°C. However the sample
showed three high temperature peaks at 189.1ºC, 199.4°C and 211.3°C respectively. Thus there
is presence of higher number of larger HS crystallites in TPU-05GMS samples. By increasing
the GMS concentration (TPU-2GMS), the broad melting peak shifted to approximately 16°C
above the melting peak observed in PR-TPU. On the other hand only one high temperature peak
is observed at 206.7°C. However the high temperature peak is larger compared to PR-TPU and
TPU-05GMS samples. Overall, the total heat of fusion (ΔHT) increased at higher concentration
of GMS.
70 140 210
-0.4
-0.2
15.4J/g
17.5 J/g
20 J/g
206.7 C
177.3 C
189.1 C199.4 C
211.3 C162.9 C
161.3 C
211 C
TPU-2GMS
TPU-05GMS
Heat flow
(J/g
)
Temperature (°C)
PR-TPU
197 C
Post annealing at 180 C
Endo
Figure 3-17 DSC endotherms of PR-TPU and TPU-GMS post annealing at 180°C
To investigate the effect of the annealing time on the HS crystallization at ambient pressure (1
bar), an isothermal analysis was carried out using DSC. Figure 3.18 shows the DSC endotherm
of the PR-TPU after the isothermal treatments over different annealing temperature and
annealing time of 60 min, 120 min and 180 min respectively. It should be noted that the AR-TPU
and TPU in presence of additives (TPU-GMS, TPU-NCl and TPU-NSi) showed a similar
behavior and hence are not shown. Overall by increasing the annealing time, the perfection
and/or the size of the HS crystallites increased, which resulted in increase in the Tm-high melting
peaks as shown in Fig. 3.18.

78
Figure 3-18 DSC endotherms of PR-TPU after annealing at different saturation
temperature and time
3.3.4 Crystallization analysis of TPU in presence of high-pressure dissolved gas
3.3.4.1 Non-isothermal melt crystallization analysis with high-pressure CO2
Figure 3.19 compares the non-isothermal melt crystallization behavior of PR-TPU at ambient
pressure (1 bar) and CO2 pressure (45 bar) with different cooling rates from the melt. Overall,
with a decrease in the cooling rate the crystallization temperature shifted to higher temperatures
for both the samples cooled in ambient pressure and in the presence of CO2 (1 bar).
Thus at lower cooling rate, the HS chains have longer time to stack and form crystallites with
better perfection. This behavior was observed in the samples cooled at ambient pressure with an
increase in the total heat of crystallization (ΔHC) (J/g). Similar behavior was observed for the
samples saturated with CO2 at 45 bar and cooled with 20oC/min, 10
oC/min and 5
oC/min.
However, when the samples were cooled at 2oC/min, the ΔHC was observed to decrease
compared to samples cooled at ambient pressure (1 bar).
Figure 3.20 compares the ΔHC of PR-TPU cooled with different cooling rates from the melt at
ambient pressure (1 bar) and different CO2 pressure’s. At 15 bar CO2 pressure, the samples
cooled with 50C/min and 20
0C/min showed a sudden increase in the ΔHC compared to those
cooled with 20C/min and 10
0C/min. With increase in the CO2 pressure to 30 bar, the ΔHC at all
the cooling rates decreased. However sample cooled with 200C/min showed highest decrease in
30 60 90 120 150 180 210 240-1.0
-0.9
-0.8
-0.7
-0.6
-0.5
-0.4
-0.3Iso 220
oC
Iso 180o
C
Iso 160o
C
He
at
flo
w (
J/g
)
Temperature (0C)
180 min
120 min
60 min
Iso 100o
C
Tm-high

79
the ΔHC value. Further increase in the CO2 pressure to 45 bar resulted in increase in the ΔHC at
all the cooling rates.
Figure 3-19 Non-isothermal melt crystallization behavior of TPU at different cooling rates:
(a) ambient pressure (1 bar), (b) CO2 pressure (45 bar)
Figure 3.21 compares the non-isothermal melt crystallization behavior of TPU with additives (1
% GMS, 1% NCl and 1 % NSi) at ambient pressure (1 bar) and in the presence of CO2 pressure
(45 bar). Overall, the presence of additives and high-pressure CO2 did not affect the
crystallization and phase-separation of HSs in the TPU microstructure. However in the case of
TPU-1GMS, the crystallization temperature slightly shifted further to higher temperature. Hence
the presence of GMS and the plasticization effect of CO2 may have further increased the
mobility of HS chains, which assists the chains to stack and form crystallites with higher degree
of perfection.
30 60 90 120 150 180 210 2400.0
0.3
0.6
0.9
20oC/min
10oC/min
5oC/min
2oC/min14J/g
13.5J/g
12J/g
11J/g
He
at F
low
(J/g
)
Temperature (oC)
Atmospheric pressure (1bar)(a)
30 60 90 120 150 180 210 2400.0
0.1
0.2
0.3
0.4
0.5
0.6
0.7
0.8
0.9
8.5J/g
9.5J/g
11.2J/g
20oC/min
10oC/min
5oC/min
2oC/min
He
at F
low
(J/g
)
Temperature (oC)
45 bar CO2 pressure
7J/g
(b)

80
Figure 3-20 Heat of crystallization of PR-TPU samples at different CO2 pressure and
cooled from the melt with different cooling rates
Figure 3-21 Non-isothermal melt crystallization behavior of TPU in presence of different
fillers and in the presence of CO2 pressure (45 bar)
3.3.4.2 Isothermal crystallization analysis with high-pressure CO2
Figure 3.22 depicts the HS crystal melting behavior of the PR-70A and PR-90A samples
saturated at ambient pressure (1 bar) and different CO2 pressures (28, 60 and 103 bar). The
saturation time was 30 min for both samples, and the saturation temperature was set 140°C for
PR-70A and, 160°C for PR-90A. Overall, in both the annealing settings, the sharp high
temperature melting peak (Tm-high) related to the melting of highly perfected HS crystals existed
in both the PR-70A and PR-90 samples. But the position of the Tm-high was affected differently
for both the PR-70A and the PR-90A samples with the change in the CO2 pressure. For the PR-
90A sample saturated at 28 bar and 60 bar, the Tm-high shifted to slightly lower temperatures due
to the plasticizing effect of CO2. However, by increasing the saturation pressure to 83 bar, the
0 10 20 30 40 50 602
4
6
8
10
12
14
16
18
20
Heat of C
rysta
llization (
Hc)
(J/g
)
CO2 pressure (bar)
2oC/min
5oC/min
10oC/min
20oC/min
PR-90A
30 60 90 120 150 180 2100.0
0.3
0.6
0.9
Temperature (oC)
He
at F
low
(J/g
)
TPU-1wt% GMS
TPU-1wt% NSi
TPU-1wt% NCl
45bar CO2
Atmospheric Pressure (1bar)

81
Tm-high increased by approximately 10°C to 182°C. Thus, at a higher saturation pressure, the
mobility of the existing HS crystalline domains may have increased, which may have assisted in
their higher degree of stacking and perfection, which resulted in a higher melting temperature.
The PR-70A sample depicted increase in the Tm-high at all the investigated CO2 pressures (28, 60
and 83 bar) as shown in Fig. 3.22b. On the other hand, saturation with CO2 induced a broader
low melting peak (Tm-low) in both the PR-70A and the PR-90A samples at all the pressures.
Although the Tm-high peak shifted to a higher temperature with an increase in the CO2 pressure,
the area under the peak decreased for both the PR-70A and the PR-90A samples. This was
followed by an increase in the area of the Tm-low peak as shown in Fig. 8. The higher portion of
the HS crystals became molten due to the plasticization effect of CO2 and contributed to the
formation of Tm-low melting peak during cooling. In other words, at an increased CO2 pressure,
more of the original HS crystals were melted and thereby more melt became available during the
cooling, which promoted the formation of the HS crystals with low perfection. Thus it can also
be concluded that CO2 induced a high degree of HS crystal nucleation in the TPU microstructure.
Further, there is a significant increase in the total crystallinity (Tcrys) of both the PR-70A and PR-
90A samples after annealing with CO2, compared to the annealing at ambient pressure (Fig.
3.22). This must have been due to the plasticization effect of the dissolved CO2, which may have
facilitated the HS chain mobility that further promotes the HS phase separation (i.e.
crystallization and crystal nucleation).
30 60 90 120 150 180-0.6
-0.5
-0.4
-0.3
-0.2
-0.1
0.0
0.1(a)
Tcrys
=8.5%
107.5153.6
1 bar
Heat flow
(J/g
)
Temperature (°C)
saturation time = 30 minsaturation temp = 140 C
PR-70A
Tcrys
=18.8%
73.5118.6
160.883 bar
Tcrys
=19.8%
72.5118.3
158.5
60 barT
crys=23.2%
73.7
155.6
28 bar
30 60 90 120 150 180 210 240
-0.6
-0.5
-0.4
-0.3
-0.2
-0.1
0.0
0.1
0.2(b)
Tcrys
=15.0%
133.0
174.7
1 bar
He
at
flo
w (
J/g
)
Temperature (°C)
saturation temp = 160 Csaturation time = 30 min
PR-90A
Tcrys
=28.5%
70.0
Tcrys
=29.5% 151.3
182.0
83 bar
60 bar
174.2
133.4Tcrys
=32.3%
72.0
69.7
133.8
173.128 bar
Figure 3-22 DSC melting endotherms after annealing over a range of CO2 pressures at a
fixed saturation temperature and time for (a) PR-70A and (b) PR-90A
Figure 3.23 compares the melting behaviors of the PR-70A and PR-90A after the samples were
isothermally treated over a range of temperatures with the presence of CO2 (60 bar). Overall, for

82
both PR-70A and PR-90A samples, the formation of double melting peak shifted to a lower
annealing temperature due to the plasticization effect of CO2. Furthermore, there is a significant
increase in the total crystallinity (Tcrys) of the HS in both PR-70A and the PR-90A after
saturating with CO2.
30 60 90 120 150 180 210-0.5
-0.4
-0.3
-0.2
-0.1
0.0
(a) saturation pressure = 60 bar
Tcrys
=20.8%
Tcrys
=20.9%
Endo
PR-70A
118.3 C
139.1 C
68.8 C
122.6 C
68.7 C
He
at
flo
w (
J/g
)
Temperature (°C)
Annealing
temp
140 C
120 C
100 C
Tcrys
=18.5%
72.5 C
158.5 C
saturation time = 30 min
30 60 90 120 150 180 210 240
-0.5
-0.4
-0.3
-0.2
-0.1
0.0
0.1
(b)
170.2 C
Tcrys
=28.8%
Tcrys
=27.2%
Tcrys
=25.3%
155.4 C
70.1 C
72.0 C
133.0 C
173.2 C
He
at
flo
w (
J/g
)
Temperature (°C)
Annealing
temp
165 C
160 C
140 C
PR-90A
Endo
55.5 C
142.9 C
177.1 C
saturation time = 30 minsaturation pressure = 60 bar
Figure 3-23 DSC melting endotherms after annealing at 60 bar CO2 pressure for 30 min at
a range of saturation temperatures for (a) PR-70A and (b) PR-90A
Three different saturation times were investigated, and the results are shown in Fig. 3.25.
Overall, with an increase in the saturation time, the unmelted HS crystalline domains in both the
PR-70A and PR-90A samples rearranged to form more perfect crystals with a higher melting
temperature. It was also observed that the Tcrys of both the PR-70A and PR-90A samples
increased with a higher saturation time.
0 30 60 90 120 150 180 210 240-0.3
-0.2
-0.1
0.0
0.1
0.2
0.3
0.4(a)
Tcrys
=24%
Tcrys
=20.3%
Tcrys
=20.1%
139.1
141.9
142.7
68.5
68.8
PR-70A
120 min
60 min
30 min
Heat flow
(J/g
)
Temperature (°C)
saturation temp = 120 Csaturation pressure = 60 bar
69.4
0 30 60 90 120 150 180 210 240
-0.3
-0.2
-0.1
0.0
0.1
0.2
0.3
0.4(a)
133.0
120.0
121.5
Heat flow
(J/g
)
Temperature (°C)
saturation temp = 160 Csaturation pressure = 60 bar PR-90A
120 min
60 min
30 min
Tcrys
=32.4%
68.8
Tcrys
=30.9%
175.467.5
Tcrys
=27.2%
174.172.0
173.2
Figure 3-24 DSC melting endotherms after annealing over a range of saturation times at a
fixed saturation pressure and temperature for (a) PR-70A and (b) PR-90A
3.3.4.3 Isothermal crystallization analysis with high-pressure butane
Figure 3.25a compares the melting behaviors of the AR-TPU and the PR-TPU after the samples
were isothermally treated at 165°C at ambient pressure (1 bar), and with the presence of butane
83
(55 bar). Overall, in both the annealing settings, a sharp Tm-high1 melting peak existed in the AR-
TPU and the PR-TPU samples. But after annealing in the presence of butane, the Tm-high1 shifted
to a lower temperature by approximately 5°C to 6°C for both samples due to the plasticizing
effect of butane.
On the other hand, saturation with butane induced a broader low melting peak (Tm-low) in both
samples. Further, there is a significant increase in the heat of fusion (ΔHTm-low) values of both
samples, after annealing with butane compared to annealing at ambient pressure as shown in Fig.
3.25a. There is also a significant increase in the total heat of fusion (ΔHT) value after annealing
with butane compared to annealing at ambient pressure. This must have been due to the
plasticization effect of butane, which may have facilitated the HS chain mobility (i.e., HS
flexibility) that further promotes the HS phase separation (i.e., the crystallization). However, the
PR-TPU sample showed a much higher increase in the ΔHT value compared to the AR-TPU
sample over a wide range of annealing temperatures as seen in Fig. 3.25b. By increasing the
butane pressure to 103 bar (Fig. 3.25b), the ΔHT value of the PR-TPU was further increased, due
to the increased flexibility of the HS chains to form crystalline domains.
The heat of fusion related to the Tm-high1 melting peak (ΔHTm-high1) was roughly estimated as
shown by the area marked with the dashed lines in Fig. 3.25a. Overall, the ΔHTm-high1 of both the
AR-TPU and the PR-TPU samples increased after annealing with butane (55 bar) compared to
annealing at ambient pressure (1 bar). However, the PR-TPU showed a much higher increase in
the ΔH Tm-high1 (Fig. 3.26) compared to the AR-TPU over a wide range of annealing temperatures.
Hence, the microstructure of the PR-TPU has a greater number of highly perfected HS crystals
compared to the AR-TPU.

84
-50 0 50 100 150 200 2500.0
0.2
0.4
0.6
0.8
1.0 1 bar (ambient)
Tm-low
Tm-low
HTm-high1
HT=16.5J/g
HT=40.4J/g
HT=17.3J/g
Tm-high1
Tg
173.8 C
174.2 C
Tm-high1
Saturation time= 60 min
HT=44.1J/g
Temperature ( C)
He
at flo
w (
J/g
)
Tg
Saturation temp= 165 C
PR-TPU
AR-TPU
55 bar (butane)
Endo
(a)
150 155 160 1650
10
20
30
40
50
AR-TPU (55 bar)
PR-TPU (55 bar)
AR-TPU (1 bar)
PR-TPU (1 bar)
T (
J/g
)
Saturation temperature ( C)
AR-TPU (103 bar)
PR-TPU (103 bar)
Saturation time= 60 min(b)
Figure 3-25 .(a) Comparison of DSC endotherm of AR-TPU and PR-TPU after annealing
at atmospheric pressure (w/o butane) and 55 bar butane; (b) total heat of fusion of AR-
TPU and PR-TPU after saturation with butane.
Figure 3.27 compares the Tg values of the AR-TPU and the PR-TPU after annealing at different
temperatures at ambient pressure, and in the presence of butane at 55 bar. Overall, the Tg of both
samples decreased with butane treatment as expected. Because of its plasticizing effect, the
dissolved butane must have increased the intermolecular distance. According to Table 3.2 and
Fig. 3.25, the HS crystallinity was significantly increased by gas dissolution for both melting
peaks at Tm-low and Tm-high1 due to the increased mobility. Overall, the SS purity may have
improved significantly due to the increased phase separation (i.e., the crystallization).

85
150 155 160 1650
3
6
9
12
15
18
Saturation time= 60 min
PR-TPU (1 bar)
AR-TPU (55 bar)
PR-TPU (55 bar)
Saturation temperature ( C)
m-h
igh (
J/g
)
AR-TPU (1 bar)
Figure 3-26 Comparison of DSC endotherm of AR-TPU and PR-TPU after annealing at
atmospheric pressure (w/o butane) and 55 bar butane
150 155 160 165
-70
-60
-50
-40
-30
-20
Tg
(C
)
Saturation temperature ( C)
AR-TPU (1 bar)
PR-TPU (1 bar)
AR-TPU (55 bar)
PR-TPU (55 bar)
Figure 3-27 Tg after annealing in ambient pressure (1 bar) and in the presence of butane
(55 bar).
Table 3-2 Comparison of PR-TPU’s DSC measurements at ambient pressure (1 bar) and
butane pressure (55 bar)
Anneali
ng
Temp
(°C)
Ambient pressure (1 bar) Butane pressure (55 bar)
ΔHTm-
low (J/g)
ΔHTm-
high1
(J/g)
Tm (°C)ΔHTm-
low (J/g)
ΔHTm-
high1
(J/g)
Tm (°C)
Tg Tm-low
Tm-
high1
Tg Tm-low Tm-high1
150 7.2 12.4 -38.2 109.9 165.5 30.3 15.3 -51.2 97.8 162.5
155 7.7 12.1 -42.8 118.3 170.1 34.9 12.9 -55.2 102.7 165.3
165 10.6 6.7 -37.4 130.1 179.8 33.8 10.3 -57.0 119.5 173.8

86
It is well known that annealing TPUs at lower temperatures at ambient pressure (1bar) increases
the size of the smaller HS crystallites and shifts the low temperature melting peak (Tm-low) always
~15-20°C higher than the corresponding annealing temperature. Figure 3.28 compares the
melting endotherms of the annealed PR-TPU and TPU-1GMS samples at 150°C under ambient
pressure (1 bar) and butane pressure of 55 bar. The saturation with butane induced a broad low
melting peak (Tm-low) in both samples. With the introduction of butane, not only a significant
increase in the heat of fusion of ΔHTm-low was observed (Fig. 3.28), there was also a significant
raise in the total heat of fusion (ΔHTot) in both the PR-TPU and TPU-1GMS samples. The
presence of dissolved butane facilitated the HS chain mobility (i.e., HS flexibility), improving
the HS crystallization kinetics. Furthermore, the presence of GMS together with butane caused a
much higher increase in the ΔHTot value of the TPU-1GMS sample, compared to that of the TPU
without GMS (Fig. 3.29).
-50 0 50 100 150 200 250
-0.4
-0.2
0.0
HTot
= HTm-low
+ HTm-high1
HTm-low
Tm-low
HTm-high1
Tg
Endo
neat-TPU
Tmhigh1He
at
Flo
w (
J/g
)
Temperature (°C)
butane pressure (55 bar)
ambient pressure (1 bar)
Tmhigh1
TPU-1 GMS
Tg
Tm-low
Figure 3-28 Comparison of DSC melting endotherm of PR-TPU and TPU-1GMS after
annealing at ambient pressure (1bar) and in the presence of butane (55 bar) at 150°C for
60 min
Figures 3.30a and 3.30b compares the ΔHTot and ΔHTm-low values of PR-TPU and TPU-1GMS
samples, treated isothermally at 150°C under ambient pressure (1 bar), and various butane
pressures. At a lower butane pressure (i.e., 23 bar), the ΔHTot of PR-TPU increased as compared
to annealing at ambient pressure (1 bar). However at higher butane pressures (53 bar and 103
bar), the ΔHTot of PR-TPU was not significantly affected. In contrast to PR-TPU, the ΔHTot of
TPU-1GMS sample continuously increased with an increase in the butane pressure, exhibiting
threefold raise at 103 bar. Similar trends were observed in the ΔHTm-low values of the PR-TPU
and TPU-1GMS samples as shown in Fig. 3.30b. The synergy caused by the lubricating nature of

87
GMS and the butane’s plasticizing effect may have induced a larger number of less perfect,
small-sized HS crystals during cooling, which resulted in the increase of the ΔHTm-low values of
TPU-1GMS and a higher ΔHTot values compared to PR-TPU.
150 155 160 1650
10
20
30
40
50
60
To
tal h
ea
t o
f fu
sio
n (
HT
ot)
(J/g
)
PR-TPU (55 bar)
TPU-1GMS (1 bar)
neat-TPU (1 bar) TPU-1GMS (55 bar)
Saturation temperature ( C)
Figure 3-29 ΔHTot of PR-TPU and TPU-1GMS after annealing at ambient pressure (1bar)
and in the presence of butane (55 bar) for 60 min over a range of annealing temperature’s
0 20 40 60 80 10015
20
25
30
35
40
45
To
tal h
ea
t o
f fu
sio
n (
HT
ot)
(J/g
)
Saturation pressure (bar)
PR-TPU
TPU-1GMS(a)
0 20 40 60 80 100
5
10
15
20
25
TPU-1GMS
m-low (
J/g
)
Saturation pressure (bar)
PR-TPU(b)
Figure 3-30 (a) Total heat of fusion (ΔHTot) of PR-TPU and TPU-1GMS over range of
butane pressure after annealing at 150°C for 60 min, (b) ΔHTm-low values of PR-TPU and
TPU-1GMS over range of butane pressure after annealing at 150°C for 60 min
The heat of fusion related to the Tm-high1 melting peak (ΔHTm-high1) was estimated as shown by the
area marked with the dashed lines in Fig. 3.28. Overall, annealing under butane pressure resulted
in a higher ΔHTm-high1 in both PR-TPU and TPU-1GMS samples compared to annealing at
ambient pressure (1 bar). However, the increase in the ΔHTm-high1 was more pronounced in TPU-
1GMS samples (Fig. 3.31) over a wide range of annealing temperatures. Hence, the

88
microstructure of the TPU-1GMS has a greater number of larger phase-separate HS domains as
well as highly perfected HS crystals as compared to PR-TPU. However, the Tm-high1 of both the
PR-TPU and the TPU-1GMS samples (Fig. 3.32) decreased at butane pressures beyond 23 bar
which suggests the formation of less perfected HS crystals due to the excessive plasticizing
effect of butane [59-61]. The maximum observed Tm-high1 depression was around 5-6°C under
103 bar and 55 bar butane pressures for PR-TPU and TPU-1GMS samples, respectively.
150 155 160 1650
3
6
9
12
15
18
PR-TPU (55 bar)
PR-TPU (1 bar)
TPU-1GMS (1 bar)
m-h
igh1 (
J/g
)
Saturation temperature ( C)
TPU-1GMS (55 bar)
Figure 3-31 ΔHTm-high1 of PR-TPU and TPU-1GMS annealed under ambient pressure and
butane pressure of 55 bar over a range of annealing temperature’s for 60 min
0 20 40 60 80 100165
170
175
180
185
TPU-1GMS
Tm
-hig
h1 (
oC
)
Saturation pressure (bar)
neat-TPU
Figure 3-32 The Tm-high1 variations of PR-TPU and TPU-1GMS samples versus butane
pressures saturated at 165°C for 60 min
Figure 3.33 compares the changes in the Tg of PR-TPU and TPU-1GMS samples after annealing
at 150°C at ambient pressure and various butane pressures. As expected, the Tg of both samples
decreased with butane treatment. Because of its plasticizing effect, the dissolved butane must
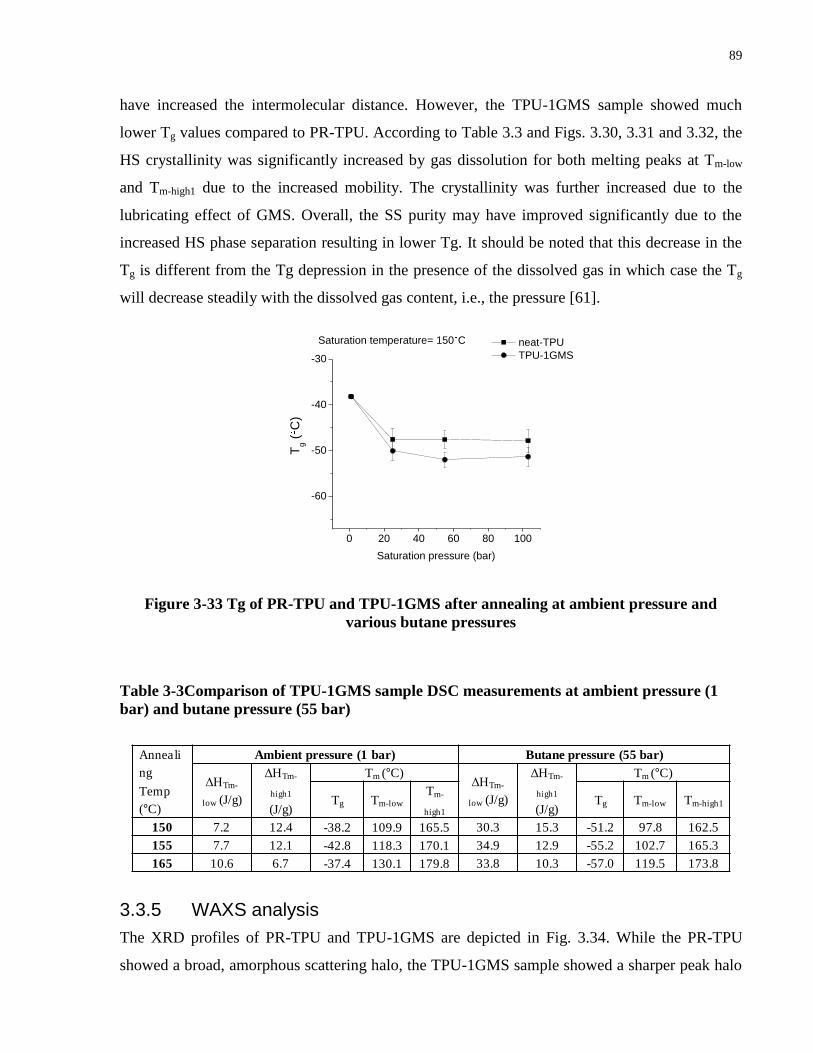
89
have increased the intermolecular distance. However, the TPU-1GMS sample showed much
lower Tg values compared to PR-TPU. According to Table 3.3 and Figs. 3.30, 3.31 and 3.32, the
HS crystallinity was significantly increased by gas dissolution for both melting peaks at Tm-low
and Tm-high1 due to the increased mobility. The crystallinity was further increased due to the
lubricating effect of GMS. Overall, the SS purity may have improved significantly due to the
increased HS phase separation resulting in lower Tg. It should be noted that this decrease in the
Tg is different from the Tg depression in the presence of the dissolved gas in which case the Tg
will decrease steadily with the dissolved gas content, i.e., the pressure [61].
0 20 40 60 80 100
-60
-50
-40
-30
Tg (
C)
Saturation pressure (bar)
neat-TPU
TPU-1GMS
Saturation temperature= 150 C
Figure 3-33 Tg of PR-TPU and TPU-1GMS after annealing at ambient pressure and
various butane pressures
Table 3-3Comparison of TPU-1GMS sample DSC measurements at ambient pressure (1
bar) and butane pressure (55 bar)
Anneali
ng
Temp
(°C)
Ambient pressure (1 bar) Butane pressure (55 bar)
ΔHTm-
low (J/g)
ΔHTm-
high1
(J/g)
Tm (°C)ΔHTm-
low (J/g)
ΔHTm-
high1
(J/g)
Tm (°C)
Tg Tm-low
Tm-
high1
Tg Tm-low Tm-high1
150 7.2 12.4 -38.2 109.9 165.5 30.3 15.3 -51.2 97.8 162.5
155 7.7 12.1 -42.8 118.3 170.1 34.9 12.9 -55.2 102.7 165.3
165 10.6 6.7 -37.4 130.1 179.8 33.8 10.3 -57.0 119.5 173.8
3.3.5 WAXS analysis
The XRD profiles of PR-TPU and TPU-1GMS are depicted in Fig. 3.34. While the PR-TPU
showed a broad, amorphous scattering halo, the TPU-1GMS sample showed a sharper peak halo

90
between 10° and 30° of 2θ. The previous XRD studies based on MDI/BDO TPU crystals have
shown similar peak [16].
0 10 20 300
1000
2000
3000
4000
TPU-1GMSIn
ten
sity (
a.u
)
2 (degrees)
PR-TPU
Figure 3-34 Comparison of XRD profiles of PR-TPU and TPU-1GMS
Figure 3.35 shows the diffracted X-ray intensity as a function of the scattering angle (2θ),
measured in the structural changes in the TPU-1GMS sample induced by annealing at 150°C at
ambient pressure (1 bar) and with butane saturation at pressures of 55 bar and 103 bar. As
discussed earlier, the plasticizing effect of butane tends to increase the molecular mobility of HS
chains. Thus, the HS chains stack into a more stable and perfected crystallites and hence the
overall crystallinity increases. It is evident from the traces that by increasing the butane pressure,
the sharpness and broadness of XRD halo increases (55 bar and 103 bar data are shown in Fig.
3.35). These results indicate on the development of HS crystallites, which occurred during the
saturation process in the presence of dissolved butane.

91
12 14 16 18 20 22 24 26 28 30 32 34 36 38 400
1000
2000
3000
4000
5000
1 bar
55 bar
Sca
tte
rin
g in
ten
sity
Scattering angle (2 )
103 bar
Figure 3-35 Comparison of XRD profiles of TPU-1GMS annealed at ambient pressure
(1bar) and various butane pressures at a saturation temperature of 150°C
3.3.6 SAXS analysis
Figure 3.36 shows the SAXS profiles of TPU-1GMS after the samples were annealed at 165°C at
ambient pressure (1 bar) and in the presence of butane at two pressures of 55 bar and 103 bar,
respectively. The horizontal axis represents the scattering vector (q) defined by Equation 3.1.
(Eq 3.1)
where, λ is the wavelength and θ is the scattering angle. The peaks were observed in all the
SAXS profiles. Based on the AFM phase image (Figs. 3.6, 3.7 and 3.8), the HS domains are
dispersed in the SS and hence these SAXS peaks are attributed to the inter-distance between the
HS domains.
Overall, the SAXS intensities increased and the width of the scattering curve decreased after
increase in the butane pressure compared to the case of annealing at ambient pressure. The
increase in the SAXS intensity with the increase in butane pressure signifies improvement in the
phase-separation of HSs within the TPU microstructure. The width of the scattering curve
decreases after annealing with butane, which is related to the increase in the average HS domain
size [62-64].
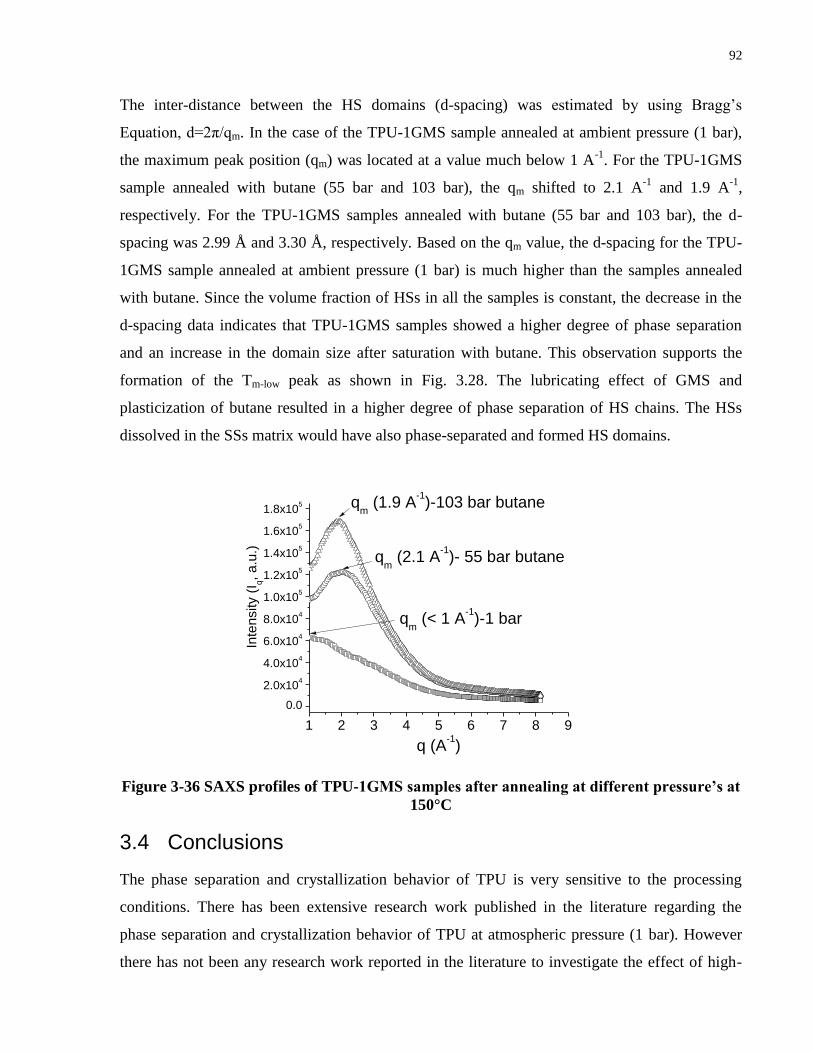
92
The inter-distance between the HS domains (d-spacing) was estimated by using Bragg’s
Equation, d=2π/qm. In the case of the TPU-1GMS sample annealed at ambient pressure (1 bar),
the maximum peak position (qm) was located at a value much below 1 A-1
. For the TPU-1GMS
sample annealed with butane (55 bar and 103 bar), the qm shifted to 2.1 A-1
and 1.9 A-1
,
respectively. For the TPU-1GMS samples annealed with butane (55 bar and 103 bar), the d-
spacing was 2.99 Å and 3.30 Å, respectively. Based on the qm value, the d-spacing for the TPU-
1GMS sample annealed at ambient pressure (1 bar) is much higher than the samples annealed
with butane. Since the volume fraction of HSs in all the samples is constant, the decrease in the
d-spacing data indicates that TPU-1GMS samples showed a higher degree of phase separation
and an increase in the domain size after saturation with butane. This observation supports the
formation of the Tm-low peak as shown in Fig. 3.28. The lubricating effect of GMS and
plasticization of butane resulted in a higher degree of phase separation of HS chains. The HSs
dissolved in the SSs matrix would have also phase-separated and formed HS domains.
1 2 3 4 5 6 7 8 9
0.0
2.0x10⁴
4.0x10⁴
6.0x10⁴
8.0x10⁴
1.0x10⁵
1.2x10⁵
1.4x10⁵
1.6x10⁵
1.8x10⁵
qm (< 1 A
-1)-1 bar
qm (2.1 A
-1)- 55 bar butane
Inte
nsity (
I q,
a.u
.)
q (A-1)
qm (1.9 A
-1)-103 bar butane
Figure 3-36 SAXS profiles of TPU-1GMS samples after annealing at different pressure’s at
150°C
3.4 Conclusions
The phase separation and crystallization behavior of TPU is very sensitive to the processing
conditions. There has been extensive research work published in the literature regarding the
phase separation and crystallization behavior of TPU at atmospheric pressure (1 bar). However
there has not been any research work reported in the literature to investigate the effect of high-

93
pressure dissolved gas on the crystallization behavior of TPU. In this PhD work, for the first time
the crystallization behavior of TPU in the presence of dissolved gas has been systematically
investigated and published. The crystallization behavior of dissolved CO2 was investigated using
a HP-DSC. However, to investigate the effect of aliphatic hydrocarbon (butane), which cannot be
used in a HP-DSC, a specially designed high-pressure saturation system was developed. It was
observed that the presence of dissolved CO2 and butane induced a large number of less perfected
HS crystallites, which was a result of increase in the HS crystal nucleation mechanism during the
cooling from the annealing temperature after the completion of the annealing process. The
blending of GMS with TPU significantly improved the phase separation and crystallization
behavior of TPU. The presence of GMS acted as a lubricating agent and assisted the HS chains
to stack into higher degree of perfection and also assisted in the growth of HS crystallites to form
spherulitic crystals. Thus the overall crystallinity of the TPU was significantly improved after
annealing with CO2, butane and GMS. The presence of nano-clay and nano-silica did not
significantly affect the HS phase separation and crystallization behavior in the TPU
microstructure both independently and in synergy with dissolved gas. Another interesting
observation was the effect of melt-compounding, which resulted in the breakage of HS chains
and assisted the chains to stack and form HS crystallites with higher degree of perfection.
Overall the increase in the phase-separation and crystallization of HSs due to annealing with
dissolved gas and with GMS resulted in improved SS purity, which was observed with decrease
in the glass transition temperature. Thus the SS elasticity is also improved as a result the
annealing with dissolved gas and GMS compared to annealing at ambient pressure.
3.5 References
[1] Gibson PE, Wallace MA, Cooper AL. Development in Block Copolymer. London;
Elsevier; 1982.
[2] Cooper SL, Tobolsky AV. J Appl Polym Sci 1966; 10:1837-1844.
[3] Koberstein JT, Galambos AF. Macromolecules 1992; 25:5618-5624.
[4] Schollenberger CS. Polyurethane Technol 1969; 197-214.
[5] Scholl A, Wever W De. Kunststoffe 1998; 4:556.
[6] Yilgor E, Yilgor I, Yurtsever. Polymer 2002; 43: 6551-6559.

94
[7] Garrett JT, Runt J, Lin JS. Macromolecules 2000; 33: 6353-6359.
[8] Leung LM, Koberstein JT. Macromolecules 1986; 19: 706-713.
[9] Schneider NS, Paik Sung CS, Matton RW, Illinger JL. Macromolecules 1975; 8: 62-67.
[10] Seymour RW, Cooper SL. Macromolecules 1973; 6: 48-53.
[11] Coleman MM, Lee KH, Skrovanek DJ, Painter PC. Macromolecules 1986; 19: 2149-2157.
[12] Skrovanek DJ, Howe SE, Painter PC, Coleman MM. Macromolecules 1985; 18: 1676-
1683.
[13] Camargo RE, Macosko CW, Tirrell M, Wellinghoff ST. Polymer 1985; 26: 1145-1154.
[14] Brunette CM, Hsu SL, Rossman M, MacKnight WJ, Schneider NS. Polym Eng Sci 1981;
21: 668-674.
[15] Bonart R, Morbitzer L, Hentze GL. Macromol Sci, Phys 1969; B3: 337-356.
[16] Blackwell J, Lee CD. Adv. Urethane Sci Technol 1984; 9: 25-46.
[17] Koberstein JT, Russell TP. Macromolecules 1986; 19: 714-720.
[18] Benegir A, Michielsen S, Pourseyhimi B. J Appl Polym Sci 2009; 111: 1246-1256.
[19] Tocha E, Janik H, Debowski H, Vancso GJ. J Macromol Sci Phys 2002; B41: 1291-1304.
[20] Wagner KB. Macromolecules 1992; 25: 5591-5595.
[21] Miller JA, Lin SB, Hwang KKS, Wu KS, Gibson PE, Cooper SL. Macromolecules 1985;
18: 32-44.
[22] Martin DJ, Meijis GF, Gunatillake PA, Renwick GM. J Appl Polym Sci 1997; 63: 803-817.
[23] Briscoe BJ, Kelly CT. Polymer 1996; 37: 3405-3410.
[24] McBride JS, Massaro TA, Cooper SL. J Appl Polym Sci 1997; 23: 201-214.
[25] Wang C, Leung SN, Park CB. Ind Eng Chem Res 2010; 49(24): 12783-12792.
[26] Leung SN, Wong A, Wang C, Park CB. J Supercrit Fluids 2012; 63: 187-198.
[27] Wong A, Park CB. Chem Eng Sci 2012; 75(1): 49-62.
[28] Wong A, Guo Y, Park CB. J Supercrit Fluids 2013; 79: 142–151.
95
[29] Lips PAM, Velthoen IW, Dijkstra PJ, Wessling M, Feijen J. Polymer 2005; 46: 9396-9403.
[30] Mihai M, Huneault MA, Favis BD. Polym Eng Sci 2010; 50(3): 629-642.
[31] Taki K, Kitano D, Ohshima M. Ind Eng Chem Res 2011; 50: 3247-3252.
[32] Li YG, Park CB, Li HB, Wang J. Fluid Phase Equilibria 2008; 270: 15-22.
[33] Li YG, Park CB. Ind Eng Chem Res 2009; 48(14): 6633-6640.
[34] Park H, Park CB, Tzoganakis C, Tan KH, Chen P. Ind Eng Chem Res 2006; 45(5): 1650-
1658.
[35] Park H, Thompson RB, Lanson N, Tzoganakis C, Park CB, Chen P. J Phys Chem B 2007;
111: 3859-3868.
[36] Park H, Park CB, Tzoganakis C, Chen P. Ind Eng Chem Res 2007; 46: 3849-3851.
[37] Park H, Park CB, Tzoganakis C, Tan KH, Chen P. Ind Eng Chem Res 2008; 47(13): 4369-
4373.
[38] Liao X, Li YG, Park CB, Chen P. J Supercrit Fluids 2010; 55: 386-394.
[39] Nofar M, Zhu W, Park CB. Polymer 2012; 53: 3341-3353.
[40] Nofar M, Tabatabaei, Park CB. Polymer 2013; 54: 2382–2391.
[41] Zhai WT, Kuboki T, Wang L, Park CB, Naguib HE. Ind Eng Chem Res 2010; 20: 9834-
9845.
[42] Keshtkar M, Nofar M, Majithiya K, Park CB, Carreau P. “Extruded PLA/Clay
Nanocomposite Foams Blown with Supercritical CO2”. Macromolecular Bioscience,
submitted 2013.
[43] Biemond GJE, Feijen J, Gaymans RJ. Macromol Mater Eng 2009; 294: 492-501.
[44] Holden G, Legge NR, Schroeder HE. Thermoplastic elastomers: a comprehensive review;
Munich: Hanser Publishers; 1987.
[45] Armistead JP, Wilkes GL. J Appl Polym Sci 1988; 35: 601-629.
[46] Okamoto M, Nam PH, Maiti P, Kotaka T, Hasegawa N, Usuki A. Nanoletters 2001; 1: 295-
298.
[47] Yuan M, Song Q, Turng LS. Polym Eng Sci 2007; 47: 765-779.
[48] Martini-Vvedensky JE, Waldman FA, Suh NP. SPE-ANTEC 1982; 28: 674-676.

96
[49] Koberstein JT, Gancarz I, Clark TC. J. Polym Sci Part B- Polym Physics 1986; 24: 2487-
2498.
[50] Eisenbach CD, Nefzger H. Multiphase macromolecular systems, contemporary topics in
polymer science; New York: Plenium Publ Corp; 1989.
[51] Eisenbach CD, Baumgartner M, Guenter C. Advances in elastomer and rubber elasticity;
New York: Plenum Publ Corp; 1986.
[52] Gaymans RJ. Prog Polym Sci 2011; 36: 713-748.
[53] Koberstein JT, Stein RS. J Polym Sci, Polym Phys Ed 1983; 21: 1439-1472.
[54] Koberstein JT, Gancarz I, Clark TC. J Polym Sci Part B- Polym Phys 1986; 24: 2487-2498.
[55] Eisenbach CD, Nefzger H. Multiphase macromolecular systems, contemporary topics in
polymer science; New York: Plenium Publ Corp; 1989.
[56] Seymour RW, Cooper SL. Macromolecules 1973; 16: 48-53.
[57] Van Bogart JWC, Bluemke DA, Cooper SL. Polymer 1981; 22 :1428-1438.
[58] Hesketh TR, Van Bogart JWC, Cooper SL. Polym Eng Sci 1980; 20(3): 190-197.
[59] Hossieny NJ, Barzegari MR, Nofar M, Mahmood SH, Park CB. Polymer 2014; 55, 651-
662.
[60] Nofar M, Zhu W, Park CB. Polymer 2012; 53: 3341-3353.
[61] Nofar M, Tabatabaei A, Park CB. Polymer 2013; 54: 2382–2391.
[62] Van Bogart JWC, Bluemke DA, Cooper SL. Polymer 1981; 22:1428-1438.
[63] Van Bogart JWC, Gibson PE, Stuart L. J Polym Sci Polym Phys Ed 1983; 21: 65-95.
[64] Leung SN, Wong A, Park CB, Zong J. J Appl Polym Sci 2008; 108(6): 3997-4003.
97
Chapter 4 Foaming Behavior of TPU in Simulation Foaming Setup:- Effects of HS Crystallites, Nano-/Micro-Sized Additives, Blowing Agent
Types and Foaming Methods
4 Foaming Behavior of TPU in Simulation Foaming Setup
4.1 Introduction
In recent years, researchers have identified the effect of polymer crystallites on bubble nucleation
in foam processing - the crystalline domain in semi-crystalline polymers can promote cell
nucleation through local pressure variations [1-3] around the crystals [4-7] while the surrounding
area of newly formed (or growing) crystals have a supersaturated condition with the gas released
from the crystals, favorable for cell nucleation [7].
In this context, some studies have reported the crystallization kinetics of various polymers in the
presence of dissolved gas to understand better the role of crystals in foaming. The dissolved gas
causes swelling of the polymer matrix [8,9], which in turn increases the chain mobility, and
thereby, affects the surface tension [10-14], the viscosities [15-17], and the thermal behaviors
including the crystallization kinetics [18-20]. Therefore, the varying crystallization kinetics at
various gas contents can influence the final foam morphology.
Aliphatic hydrocarbons with a low boiling temperature (such as n-pentane, n-butane, etc.) are
commonly used blowing agents due to their high solubility and low diffusivity, which make
foam processing easier in industry [21,22]. Gendron et al. [23] reported production of
microcellular polycarbonate foams using n-pentane as the blowing agent, which must be due to
the crystals formed by the dissolved gas [24]. Tang et al. [25] produced microcellular foams
from blends of PP and PLA using n-pentane as the blowing agent. However, both the studies
reported non-uniform cell morphology with bimodal cell size distribution. In terms of the crystal
effect in polymer foaming, there has not been any study on the crystallization kinetics of a
polymer with the presence of dissolved butane.

98
There have been few reports on microcellular TPU foams [26,27]. Recently, Yeh et al. [28]
reported production of microcellular TPU foams using nanoparticles as bubble nucleating agent.
Nanoparticles behave as effective bubble nucleating agents [29-32] due to the existence of local
pressure variations [2-4] around the nanoparticles, and thereby they can be advantageous for
manufacturing of microcellular foams [33]. It should also be noted that the nucleation efficiency
of nanoparticles is highly dependent on the particle dispersion [29,30,34,35], the particle aspect
ratio [36], and the particle surface treatment [30]. In many instances, it was found that better
particle dispersion resulted in higher nucleation efficiency, higher cell density, and smaller cell
size. On the contrary, uniformly intercalated nanoclay particles with high rigidity turned out to
be more effective in cell nucleation than the well exfoliated nanoclay particles with pliability,
because of the higher local pressure variations around the more rigid nanoparticles [35]. Also,
the non-uniform dispersion of nanoparticles may lead to a bimodal cell size distribution [37].
Hence, incorporating nanoparticles as nucleating agents in foaming technology presents many
challenges.
In this chapter, different techniques of producing microcellular TPU bead foams in a simulation
bead foaming system is discussed. The results and processing parameters will be utilized to
manufacture TPU beads in a lab-scale autoclave bead foaming setup. In the first technique, we
present a novel technology to produce microcellular TPU foams by redistributing the HSs with
the dissolved butane without addition of any micro and/or nanoparticles as a bubble nucleating
agent. Moreover, we elucidated a wider processing window to produce microcellular TPU foams
using widely distributed nano-sized phase-separated HS crystalline domains. This was done by
reproducing the TPU material through a twin-screw extruder, which resulted in the breakage of
HS chains and hence formation of a broad distribution of HS crystalline domains. These well
distributed crystalline domains behaved as effective heterogeneous cell nucleating sites to
achieve microcellular TPU foams even at a moderate saturation pressure of butane. The foaming
was further improved by controlling the HS crystallites in the presence of GMS, which resulted
in a large number of highly perfected HS crystallites in the TPU microstructure. The third
technique discusses the effect of water, which is used to evenly distribute the heat during the
saturation step whole processing of TPU in lab-scale autoclave foaming process. It was observed
that water significantly plasticized TPU and results in high degree of perfection or growth of HS
crystallites. The growing HS crystallites in synergy with the presence of nano-clay increased the

99
heterogeneous nucleation rate and resulted in microcellular TPU nanocomposite foams at a very
mild processing condition with CO2.
4.2 Experimental Procedure
4.2.1 Materials
The TPU used in this study was Elastollan manufactured by BASF with a melting temperature of
171°C, a specific density of 1.13 g/cm3, and a hardness of Shore 90A. The HSs are composed of
reaction between MDI and BDO. The SSs are polyether diols, with a high hydrolysis resistance
tendency. Glycerol monosterate (GMS) used as a diffusion retarder and also an element which
modifies the crystallization behavior of HS was Pationic 915. The nano-clay used was Cloiste
30B. The N-butane and CO2, supplied by Linde Gas Canada, was used as the blowing agent.
4.2.2 Sample preparation
The “as-received” TPU material (AR-TPU) was compounded in a twin screw extruder DSM
Micro-compounder. Prior to compounding, the AR-TPU was dried in a CONAIR drier at 105°C
for 4 hours to remove moisture. The compounding was implemented at a processing temperature
of 190°C for 3 min and a rpm of 50. The samples of the extruded “processed” TPU (PR-TPU)
and the AR-TPU were used in the foaming experiments.
The AR-TPU and GMS were dry blended and then compounded in a twin screw extruder (DSM
Microcompounder). Prior to compounding, the “as-received” TPU was dried in a CONAIR drier
at 105°C for 4 hours to remove moisture. The compounding was implemented at a processing
temperature of 190°C for 3 min and a screw speed of 50 rpm. A series of TPU-GMS samples
with GMS contents of 0.5, 1 and 2 wt%, named as TPU-05GMS, TPU-1GMS and TPU-2GMS,
respectively, were prepared.
The AR-TPU and nano-clay (Cloisite 30B) were compounded in a twin screw extruder (DSM
Microcompounder). Prior to compounding, the AR-TPU was dried in a CONAIR drier at 105°C
for 4 hours to remove moisture. A series of TPU/nano-clay sample with nano-clay contents of
0.5, 1 & 2 wt% (TPU-05NCl, TPU-1NCl and TPU-2NCl) were prepared.

100
4.2.3 Butane sorption experiment
The sorption behaviors of butane in the AR-TPU and the PR-TPU samples were measured using
a Magnetic Suspension Balance (MSB) from Rubotherm GmbH. The swelling ratio was obtained
by means of an in-house PVT visualization setup [38]. A complete description of the
experimentation process is described elsewhere [39]. Approximately 0.3 g of a disk shaped
sample of TPU was placed in an aluminum container. The melt was heated at a desired
temperature (T) and in a vacuum (P=0), and a weight reading was obtained from the balance
readout W (0, T). Butane was then supplied at 20.7 bar to the system, and an appropriate time
was given to reach the saturation stage, after which another reading was obtained from the
balance readout, W (P, T).
4.2.4 Foaming setup and procedure
4.2.4.1 Foaming setup and procedure
The AR-TPU, PR-TPU and TPU-GMS samples were foamed in an autoclave foaming chamber.
The overall setup of the batch foaming process is shown in Fig. 4.1. Samples were first placed
inside the high-pressure vessel. The pressure vessel was then vacuumed to remove residual
moisture. Subsequently, butane was fed into the pressure vessel using a Teledyne ISCO high-
pressure syringe pump, and then maintained at a constant saturation pressure. The system was
heated to various saturation temperatures and kept for 60 min. The saturation temperature range
used in this study was between 150oC-170
oC and the selected saturation pressures were 53 bar
and 103 bar. The pressure was then rapidly released by opening a ball-valve connected to the
vessel and the chamber vessel was cooled in a water bath.

101
Figure 4-1 Schematic of the simulation foaming setup with butane
4.2.4.2 Foaming with CO2 and water
The processing of expanded polymer bead foams in an autoclave bead foaming setup requires a
media to evenly distribute heat to the material during the saturation process close to the melting
point the material. Water is a popular and cheap media to distribute the heat and avoid the
material from sticking together during the bead foaming process. However water may also affect
the foaming behavior of a material. In this setup the PR-TPU and the TPU-NCl nanocomposite
samples were foamed in an autoclave foaming chamber with the presence of water and CO2. The
overall setup of the batch foaming process is shown in Fig. 4.2. The system was heated to
various saturation temperatures and kept for 60 min. The pressure was then rapidly released by
opening a ball-valve connected to the vessel and the sample was foamed.
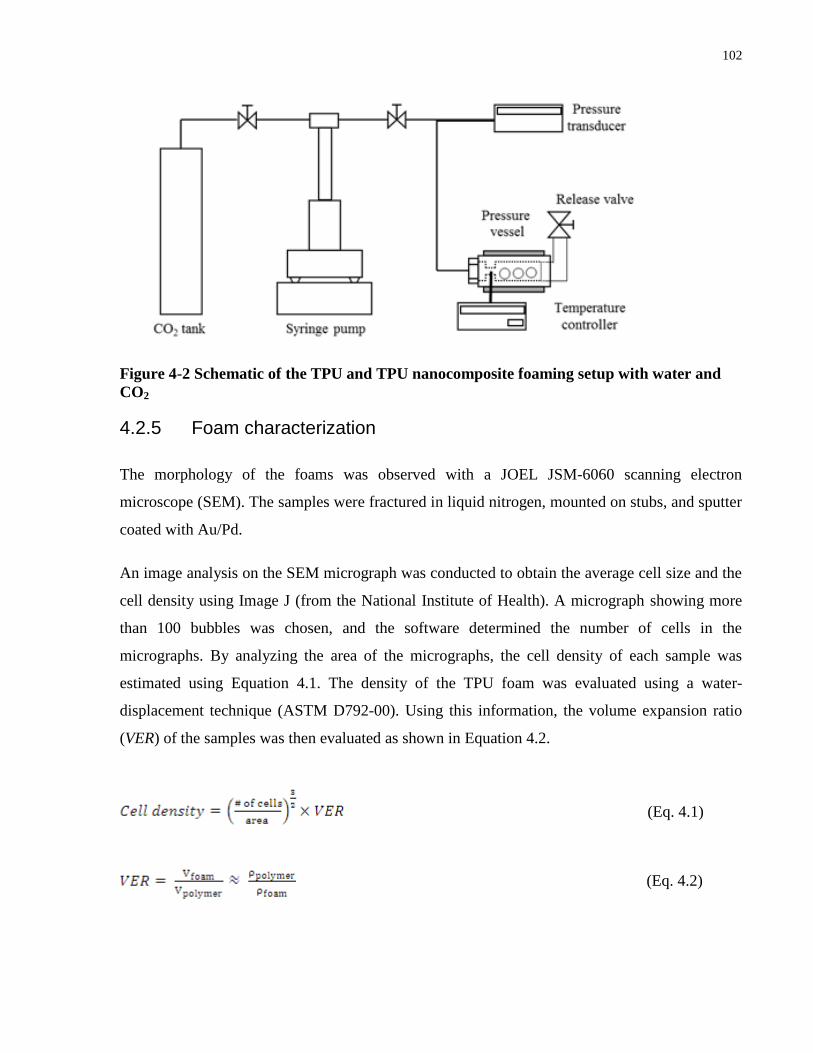
102
Figure 4-2 Schematic of the TPU and TPU nanocomposite foaming setup with water and
CO2
4.2.5 Foam characterization
The morphology of the foams was observed with a JOEL JSM-6060 scanning electron
microscope (SEM). The samples were fractured in liquid nitrogen, mounted on stubs, and sputter
coated with Au/Pd.
An image analysis on the SEM micrograph was conducted to obtain the average cell size and the
cell density using Image J (from the National Institute of Health). A micrograph showing more
than 100 bubbles was chosen, and the software determined the number of cells in the
micrographs. By analyzing the area of the micrographs, the cell density of each sample was
estimated using Equation 4.1. The density of the TPU foam was evaluated using a water-
displacement technique (ASTM D792-00). Using this information, the volume expansion ratio
(VER) of the samples was then evaluated as shown in Equation 4.2.
(Eq. 4.1)
(Eq. 4.2)

103
4.3 Results and Discussion
4.3.1 Sorption of butane in TPU
The increase in the molecular weight of the SS chains and the decrease in the concentration of
HSs affect the amount of gas impregnation of the TPUs [40]. The HS domains formed via
hydrogen bonding between the urethane groups have very limited diffusion of gas. Figure 4.3
compares the sorption of butane in the AR-TPU and the PR-TPU samples at temperatures of
150ºC and 190ºC. The saturation pressure of butane was 20.7 bar. Overall, the two TPU samples
showed a very similar sorption of butane at the investigated saturation temperatures.
0.000
0.001
0.002
0.003
0.004
0.005
0.006
0.007
0.008
190 CSo
lub
ility
(g
of b
uta
ne
/ g
of p
oly
me
r AR-TPU
PR-TPU
150 C
Figure 4-3 The solubility of butane in AR-TPU and PR-TPU at 20.7 bar
4.3.2 Effect of HS crystallites on foaming of TPU with butane
Figures 4.4 and 4.5 show the SEM micrographs of the foamed AR-TPU and the PR-TPU
samples saturated at different temperatures, and at saturation pressures of 55 bar and 103 bar,
respectively. As shown, the PR-TPU depicted a higher cell density than the AR-TPU in all the
foaming conditions. Moreover, the PR-TPU showed microcellular morphologies with fine cell
sizes in the range of 2 μm to 10 μm, and cell densities between 109
cells/cm3
and 1011
cells/cm3
as shown in Fig. 4.6. The microcellular morphologies in the PR-TPU were also observed over a
wider range of temperatures compared to the AR-TPU.

104
(a) 150
oC (b) 160
oC (c) 165
oC
(d) 150
oC (e) 160
oC (f) 165
oC
Figure 4-4 Foam morphology of TPU prepared at 55 bar and 150ºC, 160ºC, and 165ºC: (a),
(b), and (c) AR-TPU; (d), (e), and (f) PR-TPU; Scale bars: 10 µm
(a) 150
oC (b) 160
oC (c) 165
oC
(d) 150
oC (e) 160
oC (f) 165
oC
Figure 4-5 Foam morphology of TPU prepared at 103 bar and 150ºC, 160ºC and 165ºC:
(a), (b), and (c) AR-TPU; (d), (e), and (f) PR-TPU; Scale bars: 10 µm
One of the critical requirements for the production of microcellular foams is a very high degree
of thermodynamic instability generated from the super-saturation of a gas with a low solubility
[41]. It is very interesting to note, that the manufactured microcellular TPU foam was achieved
using butane that has a much higher solubility than the inert gas blowing agents such as CO2 and
N2 that are commonly used for microcellular foaming [39,42,43]. This indicates that despite the
lower volatility of butane itself, the generated large pressure variations around the formed HS

105
crystals with the help of dissolved butane must have generated enough thermodynamic
instability. Similar observations were made by Gendron et al. [23] from the polycarbonate foams
processed with pentane. We believe the local pressure variations [2, 4] around the crystals of the
polycarbonate matrix generated from a dissolved blowing agent [24] were responsible for the
microcellular cell density from this case.
The high cell density achieved in microcellular foams is largely determined by the cell
nucleation power during the foam processing. Nucleation is a classical phenomenon which
requires molecules to overcome an energy barrier and gather together (via local density and
energy fluctuation) to form embryos of the new phase. The free-energy barrier is often lower if a
bubble is nucleated on the surface of a second phase (heterogeneous nucleation as seen in
Equation 4.4), such as solid additives and impurities, when compared to the case where the
bubble is nucleated in the bulk phase of the polymer-gas mixture (homogeneous nucleation as
seen in Equation 4.3) [44-47].
(Eq. 4.3)
(Eq. 4.4)
where is the geometrical factor that relates to the surface geometry of the nucleating
agents, is the contact angle between the bubble surface and the solid surface measured in the
liquid phase. Based on the Equations 3 and 4, the increase in the saturation pressure, is expected
to reduce the free-energy barrier for bubble nucleation, and hence increase the bubble nucleation
rate. Thus, as anticipated with an increase in the saturation pressure to 103 bar, the cell densities
of both the AR-TPU and the PR-TPU increased significantly as shown in Fig. 4.6 (cell density
vs. T graph).

106
150 155 160 165 1700
5
10
15
20
25
30
35
40
45
50
PR-TPU (103 bar)
AR-TPU (103 bar)
PR-TPU (55 bar)
Ave
rag
e c
ell
siz
e (
m)
Temperature ( C)
AR-TPU (55 bar)(a)
150 155 160 165 17010
110
110
210
310
410
510
610
710
810
910
1010
1110
1110
12
PR-TPU (103 bar)
PR-TPU (55 bar)
AR-TPU (55 bar)
Ce
ll d
en
sity (
ce
lls/c
m3)
Temperature ( C)
AR-TPU (103 bar)
(b)
Figure 4-6 Characterization of AR-TPU and PR-TPU foams: (a) average cell size and (b)
cell densities
The free-energy barrier is also affected via localized stress variations ( , around the solid
fillers, which influence the degree of supersaturation [3].The presence of crystals also induces
stresses in the polymer matrix, which may cause bubbles to form via heterogeneous nucleation
mechanism (Equation 4.4). In the system consisting of dissolved butane in the TPU matrix (Fig.
4.7), the mobility of HS chains, including the HS crystalline domains, is increased due to the
swelling of the matrix [8,9]. Consequently, the HS crystalline domains are increasing, and the
surrounding area of the growing HS crystallites has a supersaturated condition with the gas
released from the crystals [7]. Further, the SS chains in the vicinity of these newly growing HS
crystallites are constrained because of the connection of surrounding molecules with the crystals
[35]. The SS chains that are constrained by the HS crystallites would generate locally varying
shear, compressive and tensile stresses. In the area where a tensile stress is applied to the SS
matrix, a negative occurs. This reduces the activation energy for cell nucleation, which
leads to the increase in the heterogeneous nucleation rate (Equation 4.4).
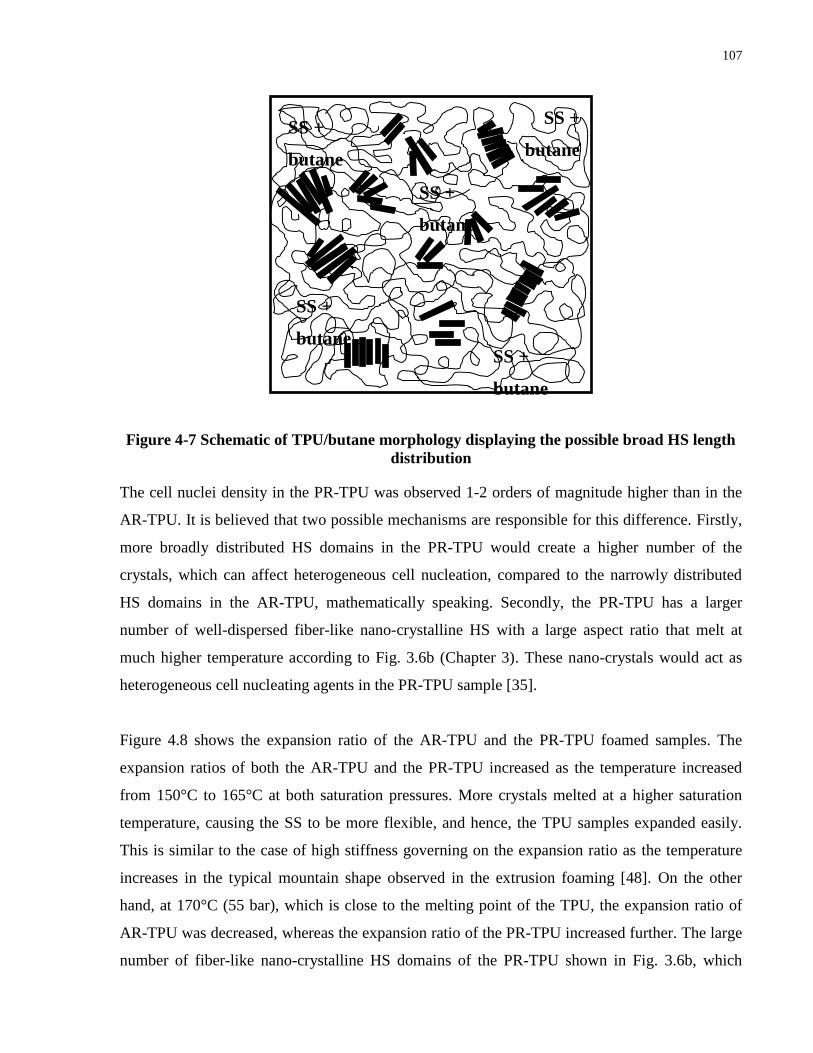
107
Figure 4-7 Schematic of TPU/butane morphology displaying the possible broad HS length
distribution
The cell nuclei density in the PR-TPU was observed 1-2 orders of magnitude higher than in the
AR-TPU. It is believed that two possible mechanisms are responsible for this difference. Firstly,
more broadly distributed HS domains in the PR-TPU would create a higher number of the
crystals, which can affect heterogeneous cell nucleation, compared to the narrowly distributed
HS domains in the AR-TPU, mathematically speaking. Secondly, the PR-TPU has a larger
number of well-dispersed fiber-like nano-crystalline HS with a large aspect ratio that melt at
much higher temperature according to Fig. 3.6b (Chapter 3). These nano-crystals would act as
heterogeneous cell nucleating agents in the PR-TPU sample [35].
Figure 4.8 shows the expansion ratio of the AR-TPU and the PR-TPU foamed samples. The
expansion ratios of both the AR-TPU and the PR-TPU increased as the temperature increased
from 150°C to 165°C at both saturation pressures. More crystals melted at a higher saturation
temperature, causing the SS to be more flexible, and hence, the TPU samples expanded easily.
This is similar to the case of high stiffness governing on the expansion ratio as the temperature
increases in the typical mountain shape observed in the extrusion foaming [48]. On the other
hand, at 170°C (55 bar), which is close to the melting point of the TPU, the expansion ratio of
AR-TPU was decreased, whereas the expansion ratio of the PR-TPU increased further. The large
number of fiber-like nano-crystalline HS domains of the PR-TPU shown in Fig. 3.6b, which
SS +
butane
SS +
butane
SS +
butane
SS +
butane
SS +
butane

108
seem to be highly perfected and thereby were not melted at 170°C, must have acted as a physical
branching network with high melt strength favorable for cell growth. In contrast, the AR-TPU
did not have these highly compacted HS domains, and therefore, a much smaller number of
crystals existed in the polymer matrix. Consequently, the volume expansion ratio decreased and
it must have been governed by the loss of the blowing agent at elevated temperature [48].
150 155 160 165 1700
1
2
3
4
5
6
7
8
9
10
PR-TPU (103 bar) AR-TPU (55 bar)
PR-TPU (55 bar)
Exp
an
sio
n R
atio
Temperature ( C)
AR-TPU (103 bar)
Figure 4-8 Expansion ratios of AR-TPU and PR-TPU foams
Figures 4.9 and 4.10 show the SEM micrographs and the cell density of the PR-TPU and TPU-
GMS samples, respectively, foamed after saturation at a pressure of 55 bar and at various
temperatures. Both samples showed microcellular morphologies, i.e., with cell sizes less than 10
μm and cell densities greater than 109 cell/cm
3. Moreover, with the addition of only 0.5% GMS
(TPU-05GMS), the foam morphology improved with the formation of fine cells in the range of
2-10 μm and an increase in the cell density above 1010
cells/cm3. At a saturation temperature of
170°C, the PR-TPU foams showed bigger cells (> 10 μm) with thinner cell walls, while the TPU-
GMS sample showed finer cells (≤ 10 μm) with thicker cell walls.

109
(a) 150°C (b) 160°C (c) 165°C (d) 170°C
(e) 150°C (f) 160°C (g) 165°C (h) 170°C
(i) 150°C (j) 160°C (k) 165°C (l) 170°C
Figure 4-9 Foam morphology under 55 bar butane pressure at different saturation
temperatures. (a-d) PR-TPU; (e-h) TPU-05GMS; (i-l) TPU-1GMS
150 155 160 165 17010
6
107
108
109
1010
1011
TPU-05GMS
TPU-1GMSCe
ll D
en
sity (
ce
lls/c
m3)
Saturation Temperature ( C)
PR-TPU
Figure 4-10 Cell densities of PR-TPU and TPU-GMS foams
During cell nucleation, molecules have to overcome the energy barrier to form embryos
of the new phase. From a thermodynamic perspective, the free-energy barrier is often lower if a
bubble is nucleated on the surface of a second phase (heterogeneous nucleation as seen in
Equation 4.4), such as solid additives and impurities [37,41-42].

110
where is the geometrical factor that relates to the surface geometry of the nucleating
agents, is the contact angle between the bubble surface and the solid surface measured in the
liquid phase. is expressed as seen in Equation 4.5, and considers the surface of the
nucleating agents to be rough due to formation of agglomerates [49]. Thus nucleating agents
such as inorganic fillers, organic phases and nanoparticles have been commonly employed to
reduce and induce a high degree of nucleation to achieve microcellular foams.
(Eq. 4.5)
The free-energy barrier is also affected via localized stress variations ( , around the solid
fillers, which influence the initial degree of super-saturation [49,50]. The presence of crystals
also induces around growing bubbles in the polymer matrix, which reduces the critical
radius and facilitates heterogeneous nucleation (Equation 4.4) [51].
In the TPU-GMS matrix consisting of dissolved butane and GMS, the mobility of HS chains
including the existing HS crystalline domains, is significantly increased due to the swelling of
the matrix [1,2]. Consequently, the phase separated HS crystalline domains are increasing, and
the surrounding area of the growing HS crystallites has a supersaturated condition with the gas
released from the crystals [1]. Further, the SS chains in the vicinity of these newly growing HS
crystallites are constrained because of the connection of surrounding molecules with the crystals
[13,50]. The SS chains could generate locally varying shear, compressive and tensile stresses,
causing potentially negative . This reduces the activation energy for cell nucleation,
which leads to the increase in the heterogeneous nucleation rate (Equation 5). The spherulites in
the TPU-GMS matrix would also reduce the nucleation energy due to its rough surface (Equation
5). Hence, the overall cell density in the TPU-GMS foams was higher than that in the PR-TPU
foams (Fig.4.10).

111
Figure 4.11 shows the expansion ratio of the PR-TPU and the TPU-GMS foams. In all the cases,
the expansion ratio increased as the temperature was increased from 150°C to 165°C. However,
the expansion ratio of the TPU-GMS foams was higher than that of the PR-TPU foams in the
temperature range of 150-160°C. The improved elasticity of the SS from better phase separation
of HS chains would have assisted with higher expansion of the TPU-GMS foamed samples
compared to the PR-TPU samples.
150 155 160 165 170
0
2
4
6
8
TPU-05GMS
TPU-1GMS
Exp
an
sio
n R
atio
Saturation Temperature ( C)
PR-TPU
Figure 4-11 Expansion ratios of PR-TPU and TPU-GMS foams
4.3.3 Foaming of TPU and TPU nano-clay nanocomposites with CO2 and water
4.3.3.1 Isothermal crystallization analysis with CO2 and water
To investigate the effect of dissolved CO2 and water (CO2+water) on the isothermal
crystallization behavior of TPU-1NCl, the sample was saturated at 150oC with 55 bar CO2
pressures in the high-pressure batch setup shown in Fig.4.2. The samples were heated to the
desired saturation temperature at a rate of 20°C/min and equilibrated for 60 min. Next, the
samples were cooled by quenching the chamber in water bath. Then, CO2 and water mixture was
released at a very low-pressure drop rate to avoid any cell nucleation (and thereby to avoid the
influence of expansion on the crystallization of HS).Then, the sample was degassed at room
temperature for 48 hours and was heated to 250°C at a rate of 10°C/min in DSC. Thereby, the
effects of isothermal saturation on the crystallization behavior of the samples were investigated
in the presence of dissolved CO2 and water.

112
Figure 4.12 compares the melting behaviors of the TPU-1NCl after the samples were
isothermally treated at 150°C at ambient pressure (1 bar), with the presence of CO2 (55 bar), and
with the presence of CO2 and water (CO2+water). It should be noted that the PR-TPU showed a
similar behavior and hence is not shown. Overall, in all the annealing settings, the Tm-high melting
peak existed in the TPU-1NCl samples. But after annealing in the presence of CO2, the Tm-high
shifted to a higher temperature by approximately 5°C to 6°C. On the other hand, saturation with
CO2+water, the Tm-high shifted further to a much higher temperature by approximately 11°C and
also a new high melting peak at 207.4°C was generated as shown in Fig. 4.12. Hence the
plasticization effect of water caused in the increased mobility of the existing un-melted HS
crystals and resulted in much better perfection. There is also significant increase in the total heat
of fusion (ΔHT) value after annealing with CO2 and also CO2+water compared to annealing at
ambient pressure. However the ΔHT of the sample annealed with CO2+water was slightly higher
compared to the sample annealed with CO2 as shown in Fig. 4.12. This must have also been due
to the plasticization effect of water, which may have facilitated the HS chain mobility (i.e., HS
flexibility) that further promotes the HS phase separation (i.e., the crystallization).
0 30 60 90 120 150 180 210 240-0.6
-0.4
-0.2
0.0
0.2
19.0 J/g
46.4 J/g
118.5
64.9
67.4
155.3 207.4
182.8
171.4
Saturation time= 60 min
55 bar- CO2+ water
55 bar- CO2
He
at flo
w (
J/g
)
Temperature (°C)
1 bar
Endo
Saturation temp= 150 C
165.6 (Tm-high
)
48.2 J/g ( HT)
Figure 4-12 Comparison of DSC melting endotherm of TPU-1NCl after annealing at
ambient pressure (1bar), in the presence of CO2 (55 bar) and in the presence of CO2 and
water at 150°C for 60 min

113
4.3.3.2 Isothermal crystallization analysis with CO2 and water
Figures 4.13 and 4.14 show the SEM micrographs of foamed PR-TPU and the TPU-1NCl
samples prepared at 150°C, and a saturation pressure of 55 bar with CO2 and CO2+ water. As
shown, both the PR-TPU and the TPU-1NCl samples depicted a higher cell density after foaming
with CO2+water compared to foaming with only CO2. Although, nano-clay behave as an
effective bubble nucleating agents [52], it is observed that the nucleation efficiency of the nano-
clay was not very high in the case of the samples foamed using CO2. However in the TPU-1NCl
system consisting of dissolved CO2 and water, the mobility of HS chains and the HS crystalline
domains, is increased due to the plasticization effect as discussed earlier. The HS crystalline
domains act as a heterogeneous nucleation site and increase the nucleation rate. This mechanism
is confirmed as observed with the increase in the cell density of PR-TPU as shown in Fig. 4.13b.
The nucleation rate is higher in TPU-1NCl caused due to synergistic effects of the nano-clay
particles and the HS crystalline domains acting as nucleation sites [53].
(a) (b)
Figure 4-13 Foam morphology of PR-TPU prepared at 55 bar and 150°C: (a) CO2 and (b)
CO2+water
(a) (b)

114
Figure 4-14 Foam morphology of TPU-1NCl prepared at 55 bar and 150°C: (a) CO2 and
(b) CO2+water
4.4 Conclusions
In this study, a novel technique of utilizing the HS domains in the TPU microstructure was used
to prepare microcellular TPU foams using butane as the foaming agent over a wide range of
foaming conditions. Since butane has not been used for microcellular plastics because of its low
volatility and high solubility, and thereby low thermodynamic instability generated from the
rapid solubility drop, it is interesting to note the microcellular cell nucleation induced with the
butane used in this study. Although butane generates a relatively low thermodynamic instability,
its impact on the crystallization caused microcellular nucleation. It was observed that the melt
processing of AR-TPU caused a breakage of the HS chains. Thus, the PR-TPU sample showed
broad distribution of HS domains, which also included some highly ordered HS nano-crystals
with very high melting temperature. Moreover, the saturation temperature and butane’s
plasticizing impact significantly induced larger content of HS domains with higher perfection in
the PR-TPU. Consequently, without addition of any nucleating agents, the cell nucleation was
promoted in the vicinity of the largely distributed and perfected HS domains over a wide
saturation temperature range of 150°C-170°C at a saturation pressure of 55 bar. Overall, the PR-
TPU showed very a high nucleation rate compared to the AR-TPU due to the presence of broad
HS domains in their microstructure.
The crystallization kinetics of TPU was significantly improved in the presence of GMS and
dissolved butane, which resulted in the formation of large number of less perfect HS crystallites
dispersed in the SS matrix whereas some highly perfected HS crystals are also formed. Unlike its
low volatility and high solubility, butane was successfully utilized in the fabrication of
microcellular TPU foams. This was facilitated through the impact of butane on the crystallization
of HSs. The HS crystallites acted both as heterogeneous nucleating sites as well as reinforcement
leading to the microcellular morphology with a high expansion ratio in TPU-GMS samples.
Consequently, without addition of any nucleating agents, cell nucleation was promoted in the
vicinity of the largely distributed and perfected HS domains over a wide saturation temperature
range of 150-170°C at a saturation pressure of 55 bar. Overall, the TPU-GMS showed very high
nucleation rates compared to the PR-TPU.

115
This study also investigated the effect of water and super-critical CO2 as co-blowing agents for
the production of PR-TPU and TPU nano-clay nanocomposite microcellular foams at a moderate
CO2 pressure of 55 bar and saturation time of 60 min. The cell density increased significantly
due to the synergistic effects of nano-clay particles and the HS crystalline domains acting as
bubble nucleation sites.
4.5 References
[1] Wang C, Leung SN, Park CB. Ind Eng Chem Res 2010; 49(24): 12783-12792.
[2] Leung SN, Wong A, Wang C, Park CB. J Supercrit Fluids 2012; 63: 187-198.
[3] Wong A, Park CB. Chem Eng Sci 2012; 75(1): 49-62.
[4] Wong A, Guo Y, Park CB. J Supercrit Fluids 2013; 79: 142–151.
[5] Lips PAM, Velthoen IW, Dijkstra PJ, Wessling M, Feijen J. Polymer 2005; 46: 9396-9403.
[6] Mihai M, Huneault MA, Favis BD. Polym Eng Sci 2010; 50(3): 629-642.
[7] Taki K, Kitano D, Ohshima M. Ind Eng Chem Res 2011; 50: 3247-3252.
[8] Li YG, Park CB, Li HB, Wang J. Fluid Phase Equilibria 2008; 270: 15-22.
[9] Li YG, Park CB. Ind Eng Chem Res 2009; 48(14): 6633-6640.
[10] Park H, Park CB, Tzoganakis C, Tan KH, Chen P. Ind Eng Chem Res 2006; 45(5): 1650-
1658.
[11] Park H, Thompson RB, Lanson N, Tzoganakis C, Park CB, Chen P. J Phys Chem B 2007;
111: 3859-3868.
[12] Park H, Park CB, Tzoganakis C, Chen P. Ind Eng Chem Res 2007; 46: 3849-3851.
[13] Park H, Park CB, Tzoganakis C, Tan KH, Chen P. Ind Eng Chem Res 2008; 47(13): 4369-
4373.
[14] Liao X, Li YG, Park CB, Chen P. J Supercrit Fluids 2010; 55: 386-394.
[15] Lee M, Park CB, Tzoganakis C. Polym Eng Sci 1999; 39(1): 99-109.
[16] Ladin D, Park CB, Park SS, Naguib HE, Cha SW. J Cell Plast 2001; 37(2): 109-148.
[17] Wang J, James DF, Park CB. J Rheology 2010; 54(1): 95-116.

116
[18] Naguib HE, Park CB, Song SW. Ind Eng Chem Res 2005; 44: 6685-6691.
[19] Nofar M, Zhu W, Park CB. Polymer 2012; 53: 3341-3353.
[20] Nofar M, Tabatabaei, Park CB. Polymer 2013; 54: 2382–2391.
[21] Yu L, Dean K, Li L. Prog Polym Sci 2006; 31: 576-602.
[22] Pillin I, Momtrelay N, Grohens Y. Polymer 2006; 47: 4676-4682.
[23] Gendron R, Daigneault LE. Polym Eng Sci 2003; 43(7): 1361-1377.
[24] Li YG, Park CB. J Appl Polym Sci 2010; 118(5): 2898-2903.
[25] Tang L, Zhai W, Zheng W. J Cell Plast 2011; 47 (5): 429-446.
[26] Dai X, Liu Z, Wang Y, Yang G, Xu J, Han B. J Supercrit Fluids 2005; 33: 259-267.
[27] Ito S, Matsunaga K, Tajima M, Yoshida Y. J Appl Polym Sci 2007; 106: 3581-3586.
[28] Yeh SK, Liu YC, Wu WZ, Chang KC, Guo WJ, Wang SF. J Cell Plast 2013,
DOI:10.1177/0021955X13477432.
[29] Han X, Zeng C, Lee LJ, Koelling KW, Tomasko DL. Polym Eng Sci 2003; 43(6): 1261-
1275.
[30] Zeng C, Han X, Lee LJ, Koelling KW, Tomasko DL. Advanced Materials 2003; 15(20):
1743-1747.
[31] Okamoto M, Nam PH, Maiti P, Kotaka T, Hasegawa N, Usuki A. Nanoletters 2001; 1:
295-298.
[32] Yuan M, Song Q, Turng LS. Polym Eng Sci 2007; 47: 765-779.
[33] Martini-Vvedensky JE, Waldman FA, Suh NP. SPE-ANTEC 1982; 28: 674-676.
[34] Lee YH, Wang KH, Park CB, Sain M. J Appl Polym Sci 2007; 103(4): 2129-2134.
[35] Wong A, Wijnands SFL, Kuboki T, Park CB. J Nanoparticle Res 2013; 15: 1815-1829.
[36] Chen L, Ozisik R, Schadler LS. Polymer 2010; 51 (11): 2368-2375.
[37] Zeng C, Hossieny N, Zhang C, Wang B. Polymer 2010; 51 (3): 655-664.
[38] Li YG, Park CB, Li HB, Wang J. Fluid Phase Equilibria 2008; 270: 15-22.
[39] Hasan MM, Li YG, Li G, Park CB. J. Chem Eng Data 2010; 55: 4885-4895.

117
[40] Briscoe BJ, Kelly CT. Polymer 1996; 37: 3405-3410.
[41] Guo Q. PhD thesis. Mechanical Engineering Department, University of Toronto; 2007.
[42] Li G, Gunkel F, Wang J, Park CB, Altstädt V. J Appl Polym Sci 2007; 103(5): 2945-2953.
[43] Li G, Wang J, Park CB, Simha R. J Polym Sci Part B- Polym Physics 2007; 45(17): 2497-
2508.
[44] Leung SN, Wong A, Park CB, Zong J. J Appl Polym Sci 2008; 108(6): 3997-4003.
[45] Leung SN, Wong A, Guo Q, Park CB. Chem Eng Sci 2009; 64: 4899-4907.
[46] Gibbs JW. The scientific papers of J. Willard Gibbs. In Thermodynamics, vol. 1;
Woodbridge, Connecticut: Ox Bow Press; 1993.
[47] Ward CA, Tucker AS. J Appl Phy 1975; 46: 233-238.
[48] Naguib HE, Park CB, Reichelt N. J Appl Polym Sci 2004; 91(4): 2661-2668.
[49] Tocha E, Janik H, Debowski H, Vancso GJ. J Macromol Sci Phys 2002; B41: 1291-1304.
[50] Wagner KB. Macromolecules 1992; 25: 5591-5595.
[51] Martin DJ, Meijis GF, Gunatillake PA, Renwick GM. J Appl Polym Sci 1997; 63: 803-
817.
[52] Cooper SL, Tobolsky AV. J Appl Polym Sci 1966; 10:1837-1844.
[53] Koberstein JT, Galambos AF. Macromolecules 1992; 25:5618-5624.

118
Chapter 5 Modification of Steam-Chest Molding Technology
5 Modification of Steam-Chest Molding Technology
5.1 Introduction
Expanded polymeric bead foams are popular materials used in packaging, thermal and sound
insulation applications [1, 2]. Expandable polystyrene (EPS), expanded polyethylene (EPE), and
expanded polypropylene (EPP) are widely used modern moldable bead foams. The successful
commercialization of EPP has caused the application of polymeric bead foams into more
advanced applications in areas such as automotive production [3]. Currently, there is an
increasing interest in investigating the processing behavior and mechanical properties of EPP 4-
8], because it has a higher service temperature and better mechanical properties compared to
those of EPS and EPE. In addition, EPP has some other advantages such as excellent impact
resistance, energy absorption, insulation, heat resistance, and flotation. Furthermore, it is
lightweight and recyclable, exhibits good surface protection and high resistance to oil, chemical,
and water. Due to these advantages, the use of EPP is gaining increased momentum in the
automotive, packaging, and construction industries [2, 4-8]. For instance, EPP molded foams are
utilized as bumper cores, providing significantly higher energy absorption upon impact as
opposed to conventional systems [3]. EPP bead foams have also been moving into more complex
applications in such areas as energy management, acoustic preference, and structural support [2-
9].
For all applications of EPP, the physical and mechanical properties of EPP bead foams are
influenced mainly by inter-bead bonding, because the bead boundaries usually develop into
fracture paths when a force is applied [10]. Inter-bead bonding is highly dependent on the
temperature of the medium transferring heat, and inter-bead bonding management is essential for
quality control [11].
Steam-chest molding technology is a commercially available and utilized high-temperature
steam to cause sintering of EPP beads. The processing steam temperature in a steam-chest
molding machine is coupled with the steam pressure [12]. The EPP bead foam has a high melting

119
peak of about 150-170ºC, and hence high steam temperatures and pressures are required for
processing, which causes a higher operating cost. The final physical and mechanical properties
of EPP molded product depend on the strength of the inter-bead bonding, which is significantly
affected by the molding conditions such as the steam pressure, steam temperature and molding
time. During processing, however, the steam pressure varies because of the resistance of the flow
through the beads, which makes it difficult to determine the actual temperature in the mold.
Moreover, considering the large volume and complicated shape of the mold cavity, the
temperature distribution across the mold cavity is not uniform. Nakai et al. [13] reported reduced
heat conduction to the core area of the mold caused by decrease in steam temperature due to
decrease in steam pressure. Zhai et al.[14, 15] also showed that both the degree of inter-bead
bonding and the tensile strength had a direct relationship with the steam pressure/temperature.
Other studies also reported that inter-bead bonding strength normally increased with the molding
pressure and time [11-16], and that improved the tensile and compressive strengths and fracture
toughness [17]. However, if beads are steamed for a too long time, their cell structure might
collapse [18]. Furthermore, a higher operating steam pressure relates to higher temperature
leading to an increase in localized temperature near the steam entry and hence beads exposed to
this high temperature may melt resulting in shrinkage at the surface of the product. This
dramatically deteriorates the surface property of the molded product.
In this study, the existing steam-chest molding machine was modified with the introduction of
hot air in an attempt to reduce the sensitivity of the decrease in the steam temperature with a
pressure drop. The hot air conditions were optimized using different critical parameters such as
the hot air flow rate, hot air temperature and hot air pressure. Also, the effects of adding hot air
on the process heating time, surface quality, thermal property, and tensile properties of the
molded EPP products are thoroughly investigated.
5.2 Theoretical Background
A double-peak melting behavior (Fig. 5.1) is required for EPP beads to have good sintering
during steam-chest molding. The hatched area in Fig. 5.1 represents the desirable steam
temperature range between the low and high melting peaks of EPP within the steam-chest
molding machine. When the foamed beads are processed in the steam-chest molding machine,
crystals associated with the low melting temperature (Tm-low) melt and contribute to the fusing

120
and sintering of individual beads. Meanwhile, the un-melted high melting temperature (Tm-high)
crystals help to preserve the overall cellular morphology of the bead foams [19]. A very narrow
processing window between the two melting peaks poses significant challenge in setting the
processing steam temperature. The steam temperature is sensitive and depends on the
corresponding steam pressure. The slight variation in steam temperature may cause the Tm-high
crystals to get affected and destroy the cellular morphology of the beads and hence cause
shrinkage of the molded product. The ratio between the low and high melting peaks is thus
crucial in determining the surface quality and mechanical properties of bead foam products [20].
The phenomenon of creating multiple crystal melting peaks for semi-crystalline polymers was
reported in earlier studies [21, 22]. The appearance of a new peak can be attributed to various
crystal structures, crystal sizes and their arrangement and perfection during the heating or
annealing treatments. In the case of EPP, the Tm-high peak originates from the perfection of
crystals during the gas-saturation stage in an autoclave at an elevated temperature around the
melting point (Tm) of polypropylene (PP) [14, 19]. The less perfect PP crystals are allowed to
partially melt and re-stack. During the prolonged gas impregnation stage, the remaining crystals
behave as crystallization nuclei that grow and become more perfect crystals due to the
rearrangement of the polymer molecular chains. The Tm-high melting peak is typically 15-20oC
above the annealing temperatures [14,19]. The Tm-low melting peak is created during the
subsequent foaming and rapid cooling stage.
30 60 90 120 150 180 210-1.4
-1.2
-1.0
-0.8
-0.6
-0.4
-0.2 actual variation of steam
temperature
Tm-high
Tm-low
He
at
Flo
w (
W/g
)
Temperature (°C)
Endo
Figure 5-1 Double-peak melting behavior of EPP foamed beads

121
The steam supplied for molding of EPP beads in steam-chest molding machine is in the
superheated state, which flows via small ports into the mold cavity. As the steam flows from the
surface toward the core of the cavity, its pressure decreases due to resistance from the EPP
beads. Overall, the steam temperature decreases with a decline in the pressure. Thus at a low
pressure, the superheated steam changes to saturated steam and finally condenses to saturated
water. The decrease in the steam temperature with the pressure decline can be estimated by
considering a throttling process caused by the resistance of the passage amongst the closely
packed beads. Both the fixed and moving mold in the steam-chest molding machine was
insulated, and hence for simplicity we can consider the process to be adiabatic. The decline in
steam temperature with a decrease in pressure can be described using Joule-Thompson
coefficient (μJ)[23]. Considering a steady-state throttling process with a steady flow across a
restrictor, Joule-Thompson coefficient is given by
(Eq. 5.1)
where T is the temperature, P is the pressure and denotes a partial derivative at constant
enthalpy. Goodenough computed values of μJ for superheated steam covering a wide range of
pressure and temperatures [24]. For a range of temperature between 121°C and 176°C and
pressure of 2.44 atm, the μJ of superheated steam was 13 °C/atm [25]. This range of pressure and
temperature is very similar to the actual condition of steam used for melting the Tm-low crystals
and create sintering of EPP bead foams in a steam-chest molding machine. As observed from μJ
of superheated steam, the steam temperature is very sensitive to the steam pressure and decreases
significantly with a decline in pressure. The actual steam temperature during sintering of EPP
beads in a steam-chest molding machine varies over a broad range between 120°C and 167°C
(Fig. 5.1) due to a decrease in the pressure. Due to the broad temperature range, proper heat
transfer would not occur in the core area of the molded EPP part, which results in poor sintering
of EPP beads and hence leads to poor mechanical properties. In order to maintain a high
temperature in the core area, an undesirable high steam pressure (i.e., high temperature) will
therefore be required on the surface. This will melt high temperature peak crystals (Tm-high) on the
surface, and thereby causes a non-uniform morphology with a high operating cost.
122
In our new design, we propose to use a mixture of steam and hot air to reduce the resultant μJ.
Compared to superheated steam, μJ of hot air at the same pressure and temperature is
significantly low at 0.01°C/atm [25]. Hot air can potentially present a very attractive, cost-
effective method to fundamentally reduce the sensitivity of a decrease in the steam temperature
with a drop in pressure. However, hot air is a very poor heat conductor and has a thermal
conductivity value of 36.6×10⁻³
W/m.C [26]. On the other hand, steam has a very high thermal
conductivity of 32.1×10³ W/m.C.
27 Hence, using a mixture of hot air and steam can provide a
synergistic effect of low μJ of hot air and high thermal conductivity of saturated steam. Overall,
much superior heat transfer can be achieved at the core of the mold by supplying a mixture of hot
air and steam during the steam-chest molding of EPP beads. The introduction of hot air in the
steam-chest molding process may result in EPP bead products with improved surface quality,
enhanced mechanical properties and shortened cycle time resulting in a reduced operating cost.
5.3 Modifications on Steam-Chest Molding Machine to Incorporate Hot Air
The steam chest molding machine was modified to accomplish the following main functions: (i)
preventing steam condensate from entering the mold during the heating cycle, (ii) supplying hot
air into the steam injection pipe during the heating cycle, and (iii) monitoring the processing
temperature and pressure of steam and hot air mixture entering both the moving and fixed mold
channels. Figure 5.2 shows a schematic of the modified steam chest molding machine. To
facilitate the first function, i.e., preventing the steam condensate from entering the mold, the
steam supply piping was redirected to enter from the bottom of both the fixed and moving molds.
To maintain the steam above its condensation temperature, band heaters with proportional-
integral-derivation (PID) feedback control (Omega, CN7833) was located on the steam supply
piping and special heaters were inserted on the mold surface. Furthermore, all the exposed steam
supply piping and the metal surface of the fixed and moving molds were insulated. The steam
could be supplied in a wide range of pressure from 0 MPa to maximum working steam pressure
of 0.4 MPa. To supply hot air into the steam injection line, special heaters using coiled copper
piping were designed to heat the supplied compressed air. The compressed air could be heated to
approximately 200°C (T2 and T4 in Fig. 5.2). The compressed pressure could be controlled over
a wide range from 0 to 0.69 MPa using a pressure controller as seen in Fig. 5.2. The flow rate of
the supplied hot air could be varied from 0 to 120 l/min using a flow control valve as seen in Fig.

123
5.2. To achieve a good mixing of hot air and steam, hot air was introduced into the center of the
steam supply line to create annular flow of the steam into the hot air (marked with circle in Fig.
5.2). To monitor the processing temperature of steam and hot air mixtures, thermocouples were
located inside both the molds (T1 and T3 in Fig. 5.1). Similarly, pressure gauges were located to
monitor the pressure during processing (P1-P4 in Fig. 5.2).
Figure 5-2 A schematic of modified steam chest molding machine with hot air supply
5.4 Experimentation
5.4.1 Materials
The EPP beads, APPRO 5415 were supplied by JSP International. The beads have an expansion
ratio of 15 with bulk density of 60.9 g/L. The melting behavior of the EPP beads was examined
by DSC (TA Instruments, Q2000). The melting behavior of the beads showed a double peak
melting characteristics with a low melting (Tm-low) and high melting (Tm-high) peaks at 141.2°C
and 160.9°C, respectively (Fig. 5.1).
124
5.4.2 Steam-chest molding setup and experimental design
A laboratory-scale steam-chest molding equipment (DABO Precision, Korea) was used in this
study. The dimensions of the mold cavity were 15 cm × 6 cm × 5 cm. The steaming process in
the steam-chest molding included: 1) steam injection from the fixed side of the mold (1st
steaming cycle), 2) steam injection from the moving side of the mold (2nd
steaming cycle), and 3)
steam injection from both sides of the mold (3rd
steaming cycle). The 1st and 2
nd steaming cycles
were conducted to create the fusion between the EPP beads. The 3rd
steaming cycle was used to
remove pores on the surface of the molded EPP part. In the 1st steaming cycle, the steam was
flushed from the fixed side, passed through the bed of EPP beads in the mold cavity, and exited
from the moving side. During the 2nd
steaming cycle, the process is reversed and the steam was
flushed from the moving mold side. For the 3rd
steaming cycle, the steam was flushed from both
fixed and moving sides of the mold. The hot air was introduced during all three steam injection
cycles. For each set of experiments, the sample cooling time was remained unchanged.
To investigate and optimize the effect of hot air on the surface quality and the tensile properties
of the molded EPP, the temperatures of air and air flow rate were varied at three levels as shown
in Table 5.1. Since the inter-bead bonding usually increases with the steam pressure and the
heating time [11, 14, 16], the steam pressure was kept constant at 0.38 MPa (gauge pressure).
The unit of steam pressure/gauge pressure used in this study is the relative pressure in MPa,
which is 0.1 MPa lower than the absolute pressure. The corresponding steam temperature at the
gauge pressure of 0.38 MPa was 151°C from the steam table. The hot air pressure was also kept
constant at 0.41 MPa. Table 5.2 shows the complete experimental matrix.
To investigate the effect of air pressure on the surface quality and the tensile properties of the
molded EPP, the air pressure was varied at two levels of 0.41 MPa and 0.69 MPa as seen in
Table 5.1. At the lower air pressure, the air heaters have a higher possibility of getting damaged
and hence only two pressures could be investigated. The hot air temperature and the flow rate
were kept constant at 160°C and 80 l/min, respectively.

125
Table 5-1 Experimental parameters and design variables
Fixed Parameters Variables
Steam
pressure
(MPa)
Steam
temperature
(°C)
Air flow rate
(liters/min)
Air temperature
(°C)
Air pressure
(MPa)
0.38
151
80
100
120
110
160
200
0.41
0.69
Table 5-2 Experimental matrix
Run Air temperature
(°C)
Air flow rate
(l/min)
Steam
pressure
(MPa)
Hot air pressure
(MPa)
1 110 80
2 110 100
3 110 120
4 160 80
5 160 100 0.38 0.41
6 160 120
7 200 80
8 200 100
9 200 120
5.4.3 Surface quality characterization
Line scans were performed over 10 mm at six different locations on the fixed and moving
mold side of each sample (Fig. 5.3) using an optical profilometer (Nanovea ST 400,
Microphotonics Inc., Irvine, CA, USA) to measure the surface profile, and thereby, the surface
roughness of the samples. The locations on the moving mold side are designated by M1 to M6.
The sampling rate was 500 data points per mm in all the scans. ISO 4287 standard was adapted
in the calculations. The surface quality was characterized by the roughness values of Ra and Rz,
the waviness value of Wa, and the surface roughness profile. The roughness values of Ra and Rz
are calculated using Eqs. 5.2 and 5.3[28]:
(Eq. 5.2)
where, yi is the vertical distance from the mean line to the ith
data point. The roughness profile
contains n ordered, equally spaced points along the trace.

126
(Eq. 5.3)
Rz is the average distance between the highest peak and lowest valley in each sampling length. s
is the number of sampling lengths and Rti is Rt for the ith
sampling length. Surface profiles were
measured using similar line scans with 5 μm intervals between each line scan. In order to capture
the surface irregularities with spacing greater than the roughness sampling length (2 μm), the
waviness value (Wa) was used. Wa was calculated using the same equation as for Ra (Eq. 5.2) but
by using data over a wider sampling length (i.e., 20 μm) [29]. The morphologies of the molded
EPP samples were also observed by SEM (JEOL JMS 6060).
Figure 5-3 Rectangular area showing the location of line scans to characterize the surface
property on fixed mold and moving mold surface of molded EPP sample
5.4.4 Tensile property characterization
The tensile strength of molded EPP samples was measured using a Micro tester (Instron 5858) at
a crosshead speed of 5 mm/min. Rectangular specimens were cut from three different locations
across the thickness of the molded samples as shown in Fig. 5.4. Typical dimensions of the
specimens were as follows: thickness = 14 mm, width = 19 mm, and height = 155 mm. At least
five specimens were tested at each condition.

127
Figure 5-4 Schematic of specimen preparation for tensile tests
5.4.5 Thermal property characterization
The thermal history of molded EPP samples was analyzed by using Differential Scanning
Calorimeter, DSC (Q2000, TA Instruments), calibrated against characterized indium. The
thermal behavior was investigated at three different locations of the fix mold and moving mold
surface of the molded EPP samples. A temperature ramp process from 20°C to 230°C at a
heating rate of 10°C/min was carried out to investigate the melting behavior of the EPP samples.
The degree of crystallinity was calculated from the integration of the DSC melting peaks by
using 290 J/g as the heat of fusion (ΔHm) of 100 % crystallized PP [30].
5.5 Results and Discussion
5.5.1 Effect of hot air on the steaming time
In order to increase the productivity and reduce the operating cost, it is necessary to shorten the
processing time. One of the major impediments to shorten the processing time is the time
required to build-up the steam pressure to flow through the EPP beads in the mold during the
steaming cycles. The introduction of hot air may affect the build-up time of the steam pressure
and hence the overall steaming time, which will ultimately affect the processing time.
The steam pressure supplied to the equipment was 0.45 MPa. However, the desired processing
steam pressure (0.38 MPa) during the individual steaming cycle was controlled by using a
compound gauge. The gauge measured the pressure inside the mold cavity during the steaming

128
cycle using a pressure transducer and signaled to start the subsequent cycle after the desired
processing pressure was achieved. As discussed earlier the 1st and 2
nd steaming cycles were
crucial for the overall sintering of the EPP part, and hence, the time required to complete these
cycles with pure steam and steam mixed with hot air was recorded. The 3rd
steaming cycle was
set for 10 sec for all the experiments. The total steaming time to complete the molding of one
EPP part was calculated by adding the times for the three steaming cycles. Figure 5 depicts the
total steaming time for pure steam and steam mixed with hot air with various flow rates and
fixed temperature and pressure of 160 °C and 0.41 MPa, respectively. Overall, the total steaming
time decreased with the increase of the hot air flow rate and the highest air flow rate of 120 l/min
resulted in a time decrease of approximately 32 %. The reduction in the total steaming time
shows the effective use of hot air to reduce the overall processing time. The total steaming time
to complete the molding of one EPP part by increasing the hot air pressure to 0.69 MPa showed
similar result as observed at the hot air flow rate of 120 l/min.
56
60
64
68
72
76
Pure
steam
80 100 120
To
tal
ste
am
ing
tim
e (
se
c)
Hot air flow rate (l/min)
Figure 5-5 Effect of hot air and its flow rate on the total steaming time
5.5.2 Effect of hot air on the total processing temperature
Figures 5.6a and 5.6b compare the final processing temperatures after the completion of 1st and
2nd
steaming cycles for pure steam and steam mixed with hot air having various flow rates. The
processing temperature was measured at locations T1 and T3 as shown in Fig. 5.6c. Two
important observations can be made from the actual temperatures measured at T1 and T3 and
from the difference between the temperatures of T1 and T3 (ΔTcycle1 and ΔTcycle2 in Figs. 5.7a
and 5.7b). First, the introduction of hot air resulted in the decrease of ΔTcycle1 and ΔTcycle2. The

129
ΔTcycle1 and ΔTcycle2 values for EPP part molded with pure steam was 47°C and 48°C,
respectively. The introduction of hot air at low flow rate of 80 l/min resulted in ΔTcycle1 and
ΔTcycle2 values of 31°C and 22°C, respectively. By increasing the hot air flow rate, ΔTcycle1 and
ΔTcycle2 further decreased and at the highest flow rate of 120 l/min, the ΔTcycle1 and ΔTcycle2
reached 3°C and 4°C, respectively, which corresponded to roughly 94% and 92% reduction,
compared to those of pure steam. The high ΔTcycle1 and ΔTcycle2 values of pure steam suggest that
the process of expansion and sintering of EPP beads restricted the flow of steam and caused a
decrease in its pressure. Due to the high Joule-Thompson coefficient of steam, there was a
significant decrease in the steam temperature leading to very poor heat transfer across the mold.
With the introduction of hot air, however, the heat transfer across the mold improved
significantly and thus resulted in a more uniform temperature profile.
The second observation is that the localized source temperatures (T1 and T3) at the end of the
steaming cycles decreased with the introduction of hot air. It can be observed that after the
completion of the 1st and 2
nd steaming cycles with pure steam, the temperature at T1 and T3 was
167°C and 166°C, respectively, which were approximately 11.5°C and 10.5°C higher than the
supplied steam temperature of 155.5°C at 0.45 MPa. This can be understood considering the
quick sintering of EPP beads on the surface exposed to the high temperature steam. The sintered
beads started restricting the flow of steam and created a plugging behavior. Consequently, the
latent heat caused an increase of the steam temperature, and this further aggravated the
temperature gradient; i.e., further overheating on the surface whereas the core has not received
the enough heat to sinter each other because of the lowered temperature of the steam flowing at a
lower pressure.
But by introducing hot air, the temperature in the core could be maintained high to be able to
cause more uniform sintering across the thickness. So instead of causing a premature sintering on
the surface and an increase in the source temperatures (T1 and T3), the temperature of the beads
became more uniform. At a low hot air flow rate of 80 l/min, the temperatures at T1 and T3
decreased slightly to 164°C and 162°C, respectively. By increasing the hot air flow rate to 120
l/min, the temperatures further decreased to 151°C and 155°C, respectively. Thus with the
introduction of hot air, the flow of steam is improved significantly and the source temperature
increase (i.e., T1 and T3) due to the blockage of the flow could be successfully decreased.

130
120
130
140
150
160
170T
em
pe
ratu
re (
C)
Temperature T1
Temperature T3
Hot air flow rate (l/min)
Pure
steam80 100 120
(a) 1st steaming cycle
Tcycle1
Air temperature = 160 CSteam temperature = 151 C
110
120
130
140
150
160
170
(b)
Te
mp
era
ture
(C
)
Temperature T1
Temperature T3
Pure
steam
80
Hot air flow rate (l/min)
100 120
2nd
steaming cycle
Tcycle2
Steam temperature = 151 CAir temperature = 160 C
Figure 5-6 Effect of hot air and its flow rate on the processing temperature during (a)1st
steaming cycle and (b) 2nd steaming cycle. (c) A schematic illustrating the locations where
the processing temperatures of T1 and T3 were measured.
Controlling the pressure of the hot air resulted in a similar trend to the case of controlling the
flow rate of hot air. Figures 5.7a and 5.7b compare the final processing temperatures after
completion of the 1st and 2
nd steaming cycles for pure steam and steam mixed with hot air at two
pressures of 0.41 MPa and 0.69 MPa. The introduction of hot air at a pressure of 0.41 MPa
resulted in the decrease of ΔTcycle1 and ΔTcycle2 values by 53% and 58% to 31°C and 27°C,
respectively. By further increasing of the hot air pressure to 0.69 MPa, the ΔTcycle1 and ΔTcycle2
values significantly decreased and reached to only 2°C, which accounted for about 95%
reduction. The variation in the hot air temperature did not significantly change the processing
temperatures and hence is not discussed.

131
120
130
140
150
160
170
Te
mp
era
ture
(C
)
Pure
steam0.41 0.69
Hot air pressure, MPa
(a) Temperature T1
Temperature T31
st steaming cycle
Tcycle1
Steam temperature = 151 C
Air temperature = 160 C 120
130
140
150
160
170
Temperature T1
Temperature T3(b)
Te
mp
era
ture
(C
)
Pure
steam0.41
Hot air pressure, MPa
0.69
2nd
steaming cycle
Tcycle2
Steam temperature = 151 C
Air temperature = 160 C
Figure 5-7 Effect of hot air and its pressure on the processing temperature during (a) 1st
steaming and (b) 2nd steaming cycles
5.5.3 Effect of hot air flow rate on surface properties
Figure 5.8 compares the actual profile data from the line scans performed using the optical
profilometer on the EPP parts molded using pure steam and steam mixed with hot air. The data
was measured at six different locations (shown in Fig.5.3) on the surface of the molded EPP part
on moving mold side and designated from M1 to M6. As seen in Fig. 5.8a, for the EPP part
molded with pure steam, the variation of the line profile over the scan length of 10 mm spanned
a range of 195 μm between -120 μm and 75 μm. However, by introducing hot air, the variation
of line profile decreased significantly and spanned within a range of 75 μm between -50 μm and
25 μm (Fig. 5.8b). To obtain more quantitative information on surface quality, the surface
roughness (Ra and Rz) and waviness values (Wa) were calculated and the results are discussed.
Figure 5.9 compares the surface roughness values (Ra and Rz) of EPP parts molded using pure
steam and steam mixed with hot air. The roughness was measured for the surfaces of the molded
EPP part on the fixed and moving mold sides, since these surfaces are exposed to the steam and
hot air entrance ports on the molds. To investigate the effect of the hot air flow rate, the
temperature and pressure were kept constant at 160°C and 0.41 MPa, respectively. The flow rate
was varied from 80 l/min to 120 l/min. Overall, the introduction of hot air improved the surface
quality. It is observed that at a low hot air flow rate of 80 l/min, the surface roughness was not
significantly improved compared to the pure steam case with similar standard deviations. But by

132
increasing the hot air flow rate to 120 l/min, the surface roughness values decreased by
approximately 50 % reaching an Ra value of only about 1 μm, which is considered a soft touch
finish and thus a significant improvement. Furthermore, the high hot air flow rate resulted in
very similar surface roughness values on both the surfaces indicating improved uniformity in the
surface quality. Both Ra and Rz roughness values showed similar dependency on the hot air flow
rate.
0 2000 4000 6000 8000 10000
-100
-50
0
50
100
Lin
e p
rofile
(m
)
M1
M2
M3
M4
M5
M6
Line scan length ( m)
Pure steam (a)
0 2000 4000 6000 8000 10000
-100
-50
0
50
100
Steam + hot air
Line scan length ( m)
Lin
e p
rofile
(m
)
M1
M2
M3
M4
M5
M6
(b)
Figure 5-8 Comparison between actual line profile values measured over the scan length of
EPP parts molded with (a) pure steam and (b) steam mixed with hot air at 120 l/min
.
0.0
0.5
1.0
1.5
2.0
2.5
3.0
3.5
Hot air flow rate, l/min
Ro
ug
hn
ess v
alu
e [
Ra
] (
m)
Fixed surface
Moving surface
Pure
steam80 100 120
(a)
0
4
8
12
16
20
24
120
Fixed surface
Moving surface
Ro
ug
hn
ess v
alu
e [
Rz]
(m
)
Pure
Steam80 100
Hot air flow rate, l/min
(b)
Figure 5-9 Effect of hot air and its flow rate on (a) Ra and (b) Rz surface roughness
parameters
Figure 5.10 shows the waviness values (Wa) of the EPP parts molded using pure steam and steam
mixed with hot air. Similar to the roughness values, the EPP parts molded with mixture of steam

133
and hot air possessed lower waviness values. The waviness values decreased proportionally with
an increase in the hot air flow rate. The improvement in waviness is visualized in Fig. 5.11 by
the surface profiles. In both Figs 5.11a and 5.11b, the solid arrows show the surface topography
of a single bead. The surface height within a single bead of the samples molded with steam
spanned a range of 150 µm as shown in Fig. 5.11a. But with the introduction of hot air, the
surface height varied within a range of only 50 µm (Fig. 5.11b).
0
9
18
27
36
45
120 100 80
Wa
vin
ess v
alu
e [W
a]
(m
) Fixed surface
Moving surface
Pure
steam Hot air flow rate, l/min
Figure 5-10 Effect of hot air and its flow rate on the waviness (Wa) values of molded EPP’s
surface
µm
0
25
50
75
100
125
150
175
200
225
250
275
300
325
350
0 2000 4000 6000 8000 µm
µm
0
1000
2000
3000
4000
5000
6000
7000
8000
µm
0
25
50
75
100
125
150
175
200
225
250
0 2000 4000 6000 8000 µm
µm
0
1000
2000
3000
4000
5000
6000
7000
8000
(a) (b)
Figure 5-11 Fixed mold surface micro-topography of EPP bead molded products using (a)
pure steam and (b) steam mixed with hot air with an air flow rate of 100 l/min
Molded EPP samples produced using pure steam and steam mixed with hot air at
different flow rates were cut directly with a sharp knife. SEM micrographs of the cut surfaces of

134
the samples are shown in Fig. 5.12. The samples were prepared from the fixed mold side of the
molded part. The sample molded with pure steam showed a high degree of cell collapse in the
structure of the EPP beads at the surface, which caused formation of a thick skin (marked by
arrow) as shown in Fig.5.12a. Overall, the introduction of hot air reduced the cell collapse of
EPP beads. It is observed that at a low hot air flow rate of 80 l/min (Fig. 5.12b), the cell collapse
improved slightly compared to the pure steam case. But by increasing the hot air flow rate to 120
l/min (Fig. 5.12c), the cell collapse of EPP beads decreased significantly.
(a) (b)
(c)
Figure 5-12 SEM micrographs of the cut surfaces of fixed mold surface of EPP samples
produced using steam and steam mixed with hot air at different flow rates (a) pure steam,
(b) 80 l/min, and (c) 120 l/min

135
5.5.4 Effect of hot air temperature on surface properties
To investigate the effect of hot air temperature, the air pressure and flow rate were kept constant
at 0.41 MPa and 100 l/min, respectively, and three temperatures of 110ºC, 160ºC, and 200ºC
were investigated. Figures 5.13a and 5.13b show the Ra and Rz roughness values measured for
the surfaces of the molded EPP part on the fixed and moving mold sides. It can be noted that
varying the hot air temperature did not cause any significant change in the surface quality of the
molded parts. Compared to the roughness values of EPP molded part with pure steam, the
molded part with a mixture of steam and hot air at 110ºC and 160ºC showed slight improvement
in the overall surface property. However, at a higher temperature of 200 ºC, the overall Ra value
became more inconsistent.
0.0
0.5
1.0
1.5
2.0
2.5
3.0
3.5
Fixed surface
Moving surface
Pure
steam110 160 200
Ro
ug
hn
ess v
alu
e [
Ra
] (
m)
Hot air temperature, C
(a)
0
4
8
12
16
20
24
Fixed surface
Moving surface
Pure
steam110 160 200
Ro
ug
hn
ess v
alu
e [
Rz]
(m
)
Hot air temperature, C
(b)
Figure 5-13 Effect of hot air temperature on (a) Ra and (b) Rz surface roughness
parameters
5.5.5 Effect of hot air pressure on surface properties
To investigate the effect of the hot air pressure, the air temperature and flow rate were kept
constant at 160°C and 80 l/min, respectively, and two pressures of 0.41 MPa and 0.69 MPa were
investigated. Figures 5.14a and 5.14b show the Ra and Rz roughness values measured on the
fixed and moving mold side surfaces of the molded EPP part. It is seen that by introducing hot
air at a low flow rate of 80 l/min and a pressure of 0.41 MPa, the surface roughness became more
inconsistent with an increase by about 9% on the fixed mold surface. However, by increasing the
hot air pressure to 0.69 MPa, the surface roughness decreased by approximately 50% reaching an
Ra value of about only 1.12 μm and thus a significant improvement. Furthermore, a hot air
pressure of 0.69 MPa resulted in very similar surface roughness values on both the surfaces

136
indicating an improved uniformity in the surface quality. Both Ra and Rz roughness values
showed similar dependency on the hot air pressure.
0.0
0.5
1.0
1.5
2.0
2.5
3.0
3.5
R
ou
gh
ne
ss v
alu
e [
Ra
] (
m)
Air flow rate = 80 l/min
Air temperature = 160 C
Fixed surface
Moving surface
0.41 0.69
Hot air pressure, MPa
Pure
steam
(a)
0
4
8
12
16
20
24
R
ou
gh
ne
ss v
alu
e [
Rz]
(m
)
Pure
steam0.41 0.69
Hot air pressure, MPa
Fixed surface
Moving surface
Air flow rate = 80 lts/min
Air temperature = 160 C
(b)
Figure 5-14 Effect of hot air pressure on (a) Ra and (b) Rz surface roughness parameters
Figure 5.15 shows the waviness values (Wa) of the EPP parts molded using pure steam and steam
mixed with hot air at two different air pressures. It is seen that by introducing hot air at lower
pressure of 0.41 MPa, the waviness value (Wa) decreased by 9% and 45% at the fixed and
moving molds surfaces, respectively. By increasing the hot air pressure to 0.69 MPa, the
waviness value (Wa) showed a further decrease by 28% and 55% at the fixed and moving molds
surfaces, respectively. Furthermore, at both hot air pressures, both the surfaces indicated
significant uniformity in the surface quality.
0
9
18
27
36
45
Air flow rate = 80 l/min
0.69
Fixed surface
Moving surface
Pure
steam0.41
Hot air pressure, MPa
Wa
vin
ess v
alu
e [W
a]
(m
)
Air temperature = 160 C
Figure 5-15 Effect of hot air pressure on the waviness (Wa) values of molded EPP’s surface

137
5.5.6 Thermal properties of molded EPP samples
Figure 5.16 shows the DSC thermographs for the surfaces of the molded EPP part on the fixed
and moving sides of the mold. Table 5.3 also lists the melting behavior and crystallinity of the
molded EPP samples at different conditions. As seen in Fig. 5.16, the molded EPP samples
exhibited three melting peaks from high to low temperatures, denoted as Tm-high, Tmi, and Tmc,
respectively. The Tm-high was the original high melting peak of the EPP beads (Tm-high = 160.4ºC),
which remains constant at all the processing conditions. The lowest melting peak, Tmc in the DSC
curve (marked with arrow in Fig. 5.16) was reported to be the melting peak of crystals formed
during the cooling process [15]. Generally, this temperature was reported to be slightly lower
than the original low melting temperature of EPP beads (Tm-low =140.6ºC) [14], and a similar
behavior was observed in the melting endotherm of samples from the surface of the molded EPP
part on the fixed mold side in the presence of pure steam and steam mixed with hot air at
different conditions. The total crystallinity (XT) of the EPP samples molded with pure steam and
steam mixed with hot air is also shown in Table 5.3. It appears that the XT value decreased with
an increase in the hot air flow rate. The samples of the EPP part on the moving mold side showed
similar decreasing trend in XT after the introduction of hot air. The increase in XT is caused by
treatment at higher temperatures causing melting of original crystals and subsequent formation
during cooling [14]. The formation of crystals during cooling is related to Tmc [14]. The
crystallinity during cooling was estimated by the shaded area from the DSC plots (Fig. 5.16) and
their corresponding values (Xc) are listed in Table 5.3. Overall, Xc decreased with the
introduction of hot air with various flow rates. This further indicated that the melting of original
crystals was lower on the surface of samples molded using steam mixed with hot air.
The melting peak Tmi in the DSC curve (dashed line in Fig. 5.16) was reported to be created by
melting of the crystals that had possibly been induced by the fast heating and annealing treatment
that followed [14]. As seen in Table.5.3, Tmi decreased from 151.2ºC for pure steam to 148.4°C
with the introduction of hot air at the flow rate of 120 l/min. Another important observation is
that the Tmi peak was the weakest in the case of pure steam and became more pronounced with
the increase in the hot air flow rate for the surfaces of the EPP part, on both the fixed and moving
mold sides. This further confirms the decrease in the processing temperatures with hot air which
reduces the annealing temperature on the surface of the molded EPP part. Zhai et al. [14] also
found and reported that Tmi tends to become weak or even disappears at higher processing

138
temperature. They also reported that the Tmi was very sensitive and increased linearly with
increased treatment temperature. This strongly confirms that the improved surface quality seen
with an increase of hot air flow rate was due to the reduced local surface temperature, which
ultimately caused less melting of original crystals in the EPP beads.
The EPP beads molded at different hot air temperatures showed similar correlation between their
thermal behaviors and surface properties. As also discussed earlier, the hot air temperature does
not cause any significant effect on the surface properties and hence the thermal behaviors at
different hot air temperatures are not discussed in detail.
60 90 120 150 180
0
1
2
120 l/min
100 l/min
80 l/min
He
at
flo
w (
W/g
)
Temperature (°C)
Pure
steam
Fixed Mold Surface
Endo
(a)
60 90 120 150 180
0
1
2
He
at
flo
w (
W/g
)
Temperature (°C)
Pure
steam
80 l/min
100 l/min
120 l/min
Endo
Moving mold surface(b)
Figure 5-16 DSC thermographs of molded EPP samples (a) fixed mold surface and (b)
moving mold surface
Table 5-3 Melting points and crystallinity of molded EPP samples at fix and moving mold
surface at different processing conditions of pure steam and steam with hot air
Fixed Mold Surface Moving Mold Surface
Pure
steam
80
lts/min
100
lts/min
120
lts/min
Pure
steam
80
lts/min
100
lts/mi
n
120
lts/min
T mc (ºC) 139.3 139.9 138.9 139.1 142.4 141.9 138.2 138.6
T mi (ºC) 151.2 151.1 149.1 148.4 152.7 152.2 150.3 149.7
T m-high
(ºC)
159.7 159.4 159.3 159.2 159.6 159.1 159.4 159.4
XC (%)
[cooling]
25.7 28.2 21.5 20.1 29.0 27.1 24.8 19.7
XT (%)
[total]
38.0 37.2 35.5 34.6 38.0 38.1 34.6 31.1
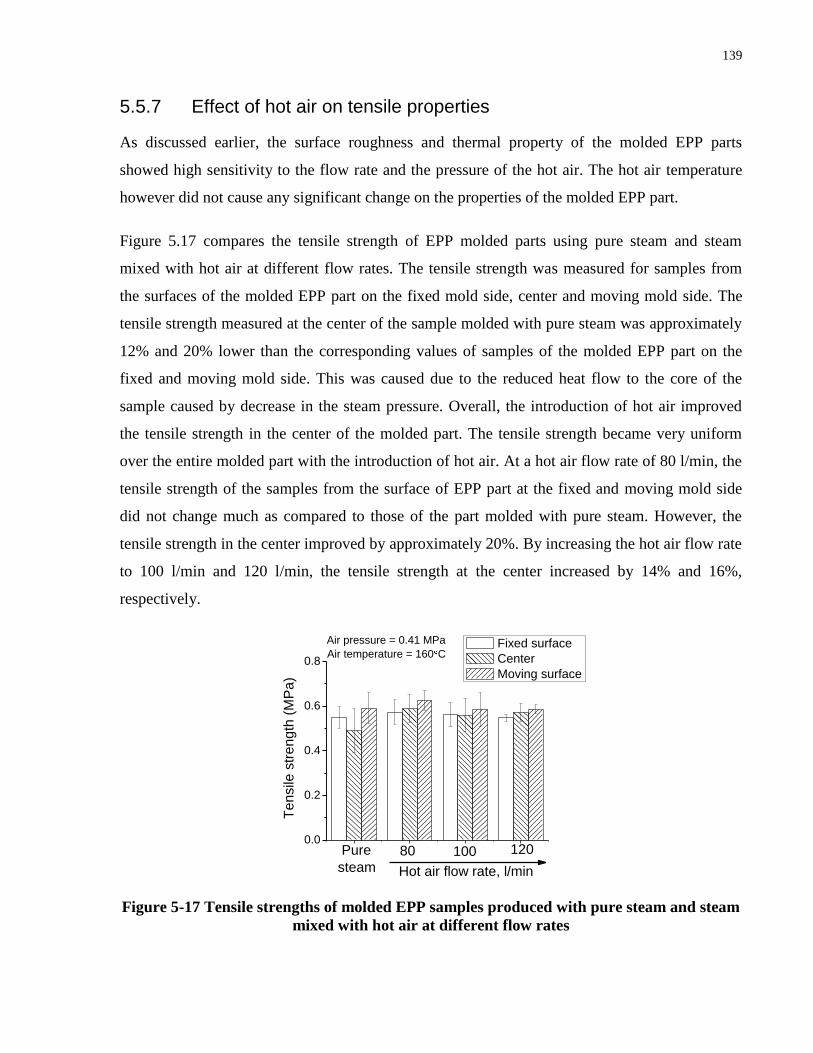
139
5.5.7 Effect of hot air on tensile properties
As discussed earlier, the surface roughness and thermal property of the molded EPP parts
showed high sensitivity to the flow rate and the pressure of the hot air. The hot air temperature
however did not cause any significant change on the properties of the molded EPP part.
Figure 5.17 compares the tensile strength of EPP molded parts using pure steam and steam
mixed with hot air at different flow rates. The tensile strength was measured for samples from
the surfaces of the molded EPP part on the fixed mold side, center and moving mold side. The
tensile strength measured at the center of the sample molded with pure steam was approximately
12% and 20% lower than the corresponding values of samples of the molded EPP part on the
fixed and moving mold side. This was caused due to the reduced heat flow to the core of the
sample caused by decrease in the steam pressure. Overall, the introduction of hot air improved
the tensile strength in the center of the molded part. The tensile strength became very uniform
over the entire molded part with the introduction of hot air. At a hot air flow rate of 80 l/min, the
tensile strength of the samples from the surface of EPP part at the fixed and moving mold side
did not change much as compared to those of the part molded with pure steam. However, the
tensile strength in the center improved by approximately 20%. By increasing the hot air flow rate
to 100 l/min and 120 l/min, the tensile strength at the center increased by 14% and 16%,
respectively.
0.0
0.2
0.4
0.6
0.8
Fixed surface
Center
Moving surface
Hot air flow rate, l/min
Te
nsile
str
en
gth
(M
Pa
)
Pure
steam
80 100 120
Air pressure = 0.41 MPa
Air temperature = 160 C
Figure 5-17 Tensile strengths of molded EPP samples produced with pure steam and steam
mixed with hot air at different flow rates

140
Figure 5.18 compares the tensile strength of EPP molded parts using pure steam and steam
mixed with hot air at different air temperatures. Three temperatures of 110ºC, 160ºC, and 200ºC
were investigated. Overall, the tensile strength was seen to be consistent over the entire molded
part at all the investigated air temperatures. It can be seen that by introduction of hot air at
temperature of 100ºC, the tensile property of the samples from surfaces of the molded EPP part
on the fixed mold and moving mold side increased by 16% and 8 %, respectively as compared to
those of the parts molded with pure steam. With increase of the air temperature to 160ºC, the
tensile strength remained approximately unchanged, compared to the case of pure steam. Further
increase in the hot air temperature to 200ºC, did not change the tensile strength at the fixed mold
surface, but it decreased the tensile strength of the moving mold surface by approximately 10 %,
compared to the pure steam case. On the other hand, at all three hot air temperatures of 110ºC,
160ºC and 200ºC, the tensile property of the center of the molded sample increased by 27%, 14%
and 20%, respectively, compared to corresponding values of the pure steam samples. As
discussed earlier, the steam temperature did not play a major role in the overall quality of the
molded EPP parts. However, the observed improvement in the tensile property of the molded
samples in the center originated from the improved heat flow caused by the hot air flow rate.
0.0
0.2
0.4
0.6
0.8
T
en
sile
str
en
gth
(M
Pa
)
Fixed surface
Center
Moving surface
Pure
steam
110 160 200
Hot air temperature, C
Air flow rate = 100 l/minAir pressure = 0.41 MPa
Figure 5-18 Tensile strengths of molded EPP samples produced with pure steam and steam
mixed with hot air at different temperatures
Figure 5.19 compares the tensile strength of EPP molded parts using pure steam and steam
mixed with hot air at different pressures. Overall, the uniformity of the tensile strength across the
molded sample increased with the increase of air pressure. By introduction of hot air at pressure
of 0.41 MPa, the tensile strength at fixed mold surface, center and moving mold surface

141
increased by 4%, 6% and 20% respectively, compared to their corresponding values in pure
steam case. Further increase in hot air pressure to 0.69 MPa resulted in further improvement in
tensile strength. The tensile strength at fixed mold surface, center and moving mold surface
increased by 19%, 12% and 34%, respectively compared to their corresponding values in pure
steam case.
0.0
0.2
0.4
0.6
0.8
Fixed surface
Center
Moving surface
Pure
steam
0.41 0.69
Hot air pressure, MPa
Te
nsile
str
en
gth
(M
Pa
)
Air temperature = 160 C
Air flow rate = 80 l/min
Figure 5-19 Tensile strengths of molded EPP samples produced with pure steam and steam
mixed with hot air at different pressures
5.6 Conclusions
In this study, the existing steam-chest molding machine was modified to accommodate the
application of hot air in an attempt to reduce the sensitivity of the steam temperature decrease
with a pressure drop. The introduction of hot air was optimized to investigate the effect of
different parameters such as the hot air flow rate, the hot air temperature and the hot air pressure,
while the steam pressure was kept constant. The steaming time decreased by 32% and the local
temperature at entry port decreased by 8% at the highest available air flow rate of 120 l/min. The
overall heat transfer improved significantly with an increase in the hot air flow rate. The surface
roughness values (Ra and Rz) decreased by approximately 50% at the hot air flow rate of 120
l/min. An increase in the hot air pressure also showed a decrease in the surface waviness (Wa) by
approximately 50%. However, varying the hot air temperature did not cause any significant
change on the surface property.
The use of hot air with steam showed significant improvement in the overall consistency of the
tensile property across the molded EPP part as compared to the samples molded with pure steam.

142
The corresponding consistency was achieved due to an improved heat flow to the core of the
molded sample. This is possible due to the synergistic effect of the high thermal conductivity of
steam and the low Joule-Thompson coefficient of hot air. With either an increase in the hot air
flow rate or in the pressure, the heat flow is improved leading to an overall improvement in the
tensile property. Hence the results of this work reveal the potential application of hot air in the
steam-chest molding process to produce EPP bead products with improved surface quality,
enhanced mechanical properties and a shortened cycle time resulting in a reduced operating cost.
5.7 References
(1) Eaves, D. Handbook of Polymer Foams; Rapra Technology: Shawbury, Shrewbury, U.K,
2004.
(2) Schut, J.H. Expandable Bead Molding goes High-Tech. Plast. Technol. 2005, 51, 68.
(3) Sopher, S.R. Advanced Development of Molded Expanded Polypropylene and
Polyethylene Bead Foam Technology for Energy Absorption. SPE ANTEC Tech. Pap.
2005, 2577.
(4) Avalle, M.; Belingardi, G.; Montanini, R. Characterization of Polymeric Structural Foams
under Compressive Impact Loading by Means of Energy-Adsorption Diagram. Int. J.
Impact Eng. 2001, 25, 455.
(5) Beverte, I. Deformation of Polypropylene Foam Neopolen®P in Compression. J. Cell.
Plast. 2004, 40, 191.
(6) Bouix, R.; Viot, P.; Lataillade, J.L. Polypropylene Foam Behavior under Dynamic
Loading. Int. J. Impact Eng. 2009, 36, 329.
(7) Bureau, M.N.; Champagne, M.F.; Gendron, R. Impact-Compression-Morphology
Relationship in Polyolefin Foams. J. Cell. Plast. 2005, 41, 73.
(8) Viot, P. Hydrostatic Compression on Propylene Foam. Int. J. Impact Eng. 2009, 36, 975.
(9) Britton, R. Update on Mouldable Particle Foam Technology; Rapra Technology:
Shawbury, Shrewsbury, UK, 2009.
(10) Mills, N.J.; Kang, P. The Effect of Water Immersion on the Fracture Toughness of
Polystyrene Foam used in Soft Shell Cycle Helmets. J. Cell. Plast. 1994, 30, 196.
(11) Rossacci, J.; Shivkumar, S. Bead Fusion in Polystyrene Foams. J. Mater. Sci. 2003, 38,
201.

143
(12) Mills, N.J. Polymer Foams Handbook: Engineering and Biomechanics Application and
Design Guide; Butterworth Heinemann: Oxford, 2007.
(13) Nakai, S.; Taki, K.; Tsujimura, I.; Oshima, M. Numerical Simulation of a Polypropylene
Foam Bead Expansion Process. Polym. Eng. Sci. 2008, 48, 107.
(14) Zhai, W.; Kim, Y.W.; Jung, D.W.; Park, C.B. Steam-Chest Molding of Expanded
Polypropylene Foams. 1. DSC Simulation of Bead Foam Processing. Ind. Eng. Chem. Res.
2010, 49, 9822.
(15) Zhai, W.; Kim. Y.W.; Jung, D.W.; Park, C.B. Steam-Chest Molding of Expanded
Polypropylene Foams. 2. Mechanism of Interbead Bonding. Ind. Eng. Chem. Res. 2011, 50,
5523.
(16) Sands, M. An Analysis of Mold Filling and Defect Formation in Lost Foam Castings; M.S.
Thesis: Worcester Polytechnic Institute, Worcester, MA, 1998.
(17) Stupak, P.R.; Donovan, J.A. The Effect of Bead Fusion on the Energy Absorption of
Polystyrene Foams, Part II: Energy Absorption. J. Cell Plast. 1991, 27, 506.
(18) Stupak, P.R.; Frye, W.O.; Donovan, J.A. The Effect of Bead Fusion on the Energy
Absorption of Polystyrene Foam. Part I: Fracture Toughness. J. Cell. Plast. 1991, 27, 484.
(19) Nofar, M.; Guo, Y.; Park, C.B. Double Crystal Melting Peak Generation for Expanded
Polypropylene Bead Foam Manufacturing. Ind. Eng. Chem. Res. 2013, 52, 2297.
(20) Guo, Y.; Hossieny, N.; Chu, R.K.M.; Park, C.B.; Zhou, N. Critical Processing Parameters
for Foamed Bead Manufacturing in a Lab-Scale Autoclave System, Chemical Engineering
Journal. 2013, 214, 180.
(21) Choi, J.B.; Chung, M.J.; Yoon, J.S. Formation of Double Melting Peak of Poly(propylene-
co-ethylene-co-1-butane) during the Pre-expansion Process for Production of Expanded
Polypropylene, Ind. Eng. Chem. Res. 2005, 44, 2776.
(22) Sharudin, R.W.B.; Ohshima, M. CO2-induced Mechanical Reinforcement of Polyolefin-
based Nanocellular Foams, Macromol. Mater. Eng. 2011, 296, 1054.
(23) Van Wylen, G.J.; Sonntag, R.E., Fundamentals of Classical Thermodynamics, third ed.;
John Wiley and Sons: New Jersey, 1986.
(24) Goodenough, G.A. Thermal Properties of Steam: University of Illinois Bulletin. 75, 1914.
(25) Roebuck, J.R. The Joule-Thomson Effect in Air. Am. Acad. of Arts and Sciences, 1925,60,
537.

144
(26) Kadoya, K.; Matsunaga, N.; Nagashima, A. Viscosity and Thermal Conductivity of Dry
Air in the Gaseous Phase, J. Phys. Chem. Ref. Data. 1985, 14, 947.
(27) Keyes, F.G.; Vines, R.G. The Thermal Conductivity of Steam, Int. J. Heat Mass Transfer.
1964, 7, 33.
(28) Degarmo, E.P.; Black, J.T.; Kohser, R.A. Materials and Processing in Manufacturing,
ninth ed.; John Wiley and Sons: New Jersey, 2002.
(29) Whitehouse, D. Handbook of Surface Nanometrology, second ed.; CRC Press: Florida,
2011.
(30) Wunderlich, B. Macromolecular Physics, Vol. 1, Crystal Structure, Morphology, Defects,
first ed.; Academic Press: New York, 1973.

145
Chapter 6 Processing of TPU Bead Foams In Lab-Scale Bead Foaming System and Sintering Mechanism With Steam-Chest Molding
Technology
6 Production and Sintering of E-TPU Beads
6.1 Introduction
Thermoplastic polyurethanes (TPUs) are multi-block copolymers that exhibit a unique
combination of strength, flexibility and processability due to their phase-separated
microstructure [1,2]. These properties result from a molecular structure with rigid HS domains
dispersed in the soft segment (SS) matrix. The SS is a polyol with an ester or ether group in the
main chain having a low glass transition temperature and is viscous at service temperature,
imparting flexibility to TPU. The HS is formed by the reaction of diisocyanate and short-chain
diols, which crystallizes and influences the mechanical properties in TPU such as hardness and
tear strength. As a result of this unique microstructure, TPUs exhibit very good impact properties
at low temperature, excellent chemical resistance and great flexibility over a broad service
temperature, which make them suitable for a wide range of demanding applications such as
automobile parts, construction materials, sports equipment, and medical instruments. A major
limitation for the use of TPU is its middle up to high hardness. Addition of plasticizers can
achieve soft grade TPUs. However processing is much more challenging and the plasticizers tend
to migrate out of the material in long-term applications. The production of foamed TPU can
reduce the material hardness without additional plasticizers. The reduced density due to foaming
can open new fields of applications for TPU materials. TPUs can be foamed using different
techniques such as extrusion process, batch or continuous process in producing expanded bead
foams.
Recently, expanded TPU bead foams (E-TPU) that can be molded into complex three-
dimensional products have been developed [3]. At the present, industry utilizes soft grade TPUs
to process E-TPU beads in order to make sintering of the beads more effective and easier during
the steam-chest molding process. However, softer grade TPUs has less concentration of HS (i.e.,
crystallinity) and hence suffers from lower mechanical properties and lower service

146
temperatures. Further, the soft TPUs may suffer from severe dimensional instability from
exposure to high temperature steam during the steam-chest molding process [4]. The expanded
TPU beads can also suffer from a high degree of shrinkage after foaming due to the loss of gas.
Glycerol esters are predominant additives used commercially which provides anti-collapse
protection by forming a barrier on the surface of the foam, slowing the egress of the blowing
agent. This allows time for air to enter the cells, replace the blowing agent, and prevent collapse
of the foam. After acting as a plasticizer, GMS eventually migrates to the surface of the bubbles
within the polymer matrix. Hence the amount of GMS collected on the skin of the foams is
minimal. The use of glycerol esters may also affect the crystallization kinetics of a polymer.
Naguib et al. reported increase in the crystallization temperature and the degree of crystallinity of
linear and branched polypropylene in presence of GMS [5]. The crystals generated during the
foaming process can lead to the production of high quality foams with fine cell size and high cell
density. The crystals can also be effectively used in the sintering of beads during the steam-chest
molding process. In this context, investigating the crystallization behavior of TPU with the
presence of GMS and butane can provide new strategies on the processing and molding of E-
TPU bead foams and their products.
In this chapter, a lab-scale autoclave bead foaming setup was used to manufacture E-TPU beads
with desirable crystalline structure. Furthermore, the processed E-TPU beads were sintered using
a steam-chest molding machine into rectangular three dimensional samples. The effect of
varying HS concentration on the bubble nucleation and the cell density of the processed E-TPU
beads was investigated. The processing techniques to produce E-TPU beads were also
investigated. The E-TPU beads were characterized to investigate the morphology and the
expansion ratio. The thermal behavior was also investigated to characterize the effect of foaming
on the development of HS crystalline domains in the E-TPU foams. Finally, the tensile property
of the moulded sample was studied to investigate the sintering behavior of the E-TPU beads.
6.2 Materials and Experimental Procedure
6.2.1 Materials
Three types of commercially available TPUs (Elastollan) from BASF were selected to
manufacture E-TPU bead foams. The densities of the selected TPU resins were 1.08 g/cm3, 1.11
g/cm3 and 1.13 g/cm
3, with a hardness of Shore 70A, Shore 80A and Shore 90A, respectively.

147
The higher hardness is caused due to the higher concentration of HS. The E-TPU beads based on
the base TPU materials are designated as E-TPU-70A, E-TPU-80A and E-TPU-90A
respectively. CO2 with a 99 % purity produced by Linde Gas was used as the impregnation gas.
6.2.2 Lab-scale bead foaming setup
Figure 6.1 shows a schematic of the overall lab-scale autoclave bead foaming system that has
been designed and constructed at our laboratory. The autoclave consists of a cylindrical chamber,
a guided cylinder which is welded on the lid of the chamber, and a rotary shaft driven by a DC
motor with three propellers mounted on it. The chamber has a exit valve situated at the bottom
through which the samples are discharged and the foaming of the material occurs.
Figure 6-1 A schematic of autoclave bead foaming set-up
6.2.3 Expanded TPU (E-TPU) bead foaming procedure
Three processing techniques were used to manufacture E-TPU bead foams.
6.2.3.1 Pressure-drop method without water
To conduct foaming experiments, 10 grams of TPU pellets was put into the autoclave chamber.
The chamber was then maintained at designated CO2 pressure and temperature for a period of
time to impregnate the TPU pellets with CO2. A wide range of saturation temperature (Tsat)
ranging between 140°C to 170°C was utilized during the impregnation stage. The saturation time

148
(tsat) was fixed as 60 min based on the simulation experiments described in Chapter 4. After the
saturation process, the shut-off valve was opened and the TPU pellets were discharged from the
chamber. Once the saturated TPU pellets exited the chamber, foaming occurred due to the
thermodynamic instability to form expanded TPU bead foams.
6.2.3.2 Pressure-drop method with water
In this method, the chamber was filled with 750 ml of water and 30 grams of TPU pellets. The
water was used as a mixing media and to uniformly distribute the heat to the TPU pellets. Next,
CO2 was supplied at the desired pressure and the chamber was heated to the desired saturation
temperature. The Tsat was selected based on the results from previous method and the tsat was 60
min. The samples were saturated for a certain saturation time for the impregnation of CO2.
Subsequently, the depressurization was accomplished by opening the shut-off valve and the
saturated TPU pellets, water and CO2 were discharged from the chamber. Once the saturated
pellets exited the chamber, foaming occurred due to thermodynamic instability.
6.2.3.3 Temperature-jump method
In this method, the chamber was filled with 30 grams of TPU pellets and saturated with CO2 at
room temperature for a desired time (tsat). After the saturation process, the CO2 was released
from the autoclave and the impregnated TPU pellets was transferred to a hot oil bath set at the
desired foaming temperature (Tfoam) to induce the thermodynamic instability. The foaming time
(tfoam) was fixed at 60 sec and then the expanded TPU beads were removed. The E-TPU beads
were washed prior to the characterization process.
6.2.4 Thermal behavior of E-TPU beads
The thermal behavior of processed E-TPU beads was measured in a differential scanning
calorimetry (DSC 2000, TA Instruments) by heating the foamed samples to 230oC at a rate of
10oC/min.
6.2.5 Gel Permeation Chromatography (GPC)
Although the TPU used in the experiments are polyether based with high hydrolysis resistance,
the chance of hydrolysis increases during the annealing experiments at high temperature in
presence of water. Hence the Mw of the foamed beads was measured using a gel permeation

149
chromatography (GPC) (experiments were conducted at Nike, Beaverton, USA). The Mw was
analyzed relative to linear polystyrene standards with RI detection in THF mobile phase.
6.2.6 Water up-take analysis
The water-uptake percentage was measured by saturating the E-TPU-90A beads over a range of
temperatures. Wetted E-TPU-90A beads were obtained by entirely immersing in water for
different saturation times. Then the E-TPU beads were wiped with paper towel, and immediately
weighed using a digital scale to measure the water up-take to 0.001 g accuracy (ASTM D570).
The water up-take percentage was calculate based on Equation 6.1.
Water-uptake rate = [(Wt – W0)/W0] x 100% Eq. 6.1
where Wt is the weight of the water saturated E-TPU bead and W0 is the initial mass of the
sample. The E-TPU beads with water were also used in the sintering process with the steam-
chest molding machine to investigate the effect of water on the sintering process.
6.2.7 Foam characterization
The morphology of the E-TPU bead foams was observed with a JOEL JSM-6060 scanning
electron microscope (SEM). The samples were fractured in liquid nitrogen, mounted on stubs,
and sputter coated with Au/Pd.
An image analysis on the SEM micrograph was conducted to obtain the average cell size and the
cell density using Image J (from the National Institute of Health). A micrograph showing more
than 100 bubbles was chosen, and the software determined the number of cells in the
micrographs. By analyzing the area of the micrographs, the cell density of each sample was
estimated using Equation 6.2. The density of the E-TPU foam was evaluated using a water-
displacement technique (ASTM D792-00). Using this information, the volume expansion ratio
(VER) of the samples was then evaluated as shown in Equation 6.3.
(Eq. 6.2)
(Eq. 6.3)

150
6.2.8 Steam-chest molding of E-TPU beads
A lab-scale steam-chest molding machine commercially manufactured by DABO Precision
(DPM-0404VS) from Korea was used for the sintering of the processed E-TPU bead foams. The
mold cavity was 15 cm x 6 cm x 2.5 cm. The mold consists of a fixed side and a moving side.
Both the mold surfaces have ports for injection of the steam into the mold cavity. The basic
process of steam-chest molding process consists of three main steps. Figure 6.2 summarizes
these steps. In the first step, the E-TPU beads are filled into the mold cavity. In the second step,
the steam is injected from the fixed mold at the desired processing steam pressure (P1). Then
steam is injected from the moving mold (P2). Subsequently, the steam is injected from both
molds (P3) followed by depressurization and holding to stabilize the sample. In the third step, the
mold and the sample is cooled with water and followed by vacuuming to remove the water.
Finally the sample is ejected from the mold. The unit of steam pressure used in this study is the
gauge pressure in bar, which is 1 bar lower than the absolute pressure.
6.2.9 Mechanical property measurement
Dog-bone shaped specimens were prepared from the molded part for tensile test experiments.
The dimensions of the specimen were based on the ASTM D3574-11 standard test for flexible
cellular materials such as slab, bonded and molded urethane foams. Tensile strengths of the
specimens were measured using a Zwick Roell tensile tester at a crosshead speed of 100
mm/min.

151
Figure 6-2 Steam-chest molding procedure
6.3 Results and Discussions
6.3.1 Foaming behavior of E-TPU beads
As per the earlier discussion in chapter 4, the HS crystals play a very important role as
heterogeneous nucleating agents to increase the cell density of TPU beads foams. By controlling
the HS crystalline domains the overall morphology and expansion ratio of the TPU beads can be
effectively controlled. In the lab-scale autoclave foaming of TPU beads, the effect of different
processing techniques (pressure drop method and temperature jump method) and processing
parameters (effect of water, saturation temperature and saturation pressure), which ultimately
affects the HS crystalline domains and hence the overall morphology of TPU beads foams is
systematically investigated.

152
6.3.1.1 Effect of water on foaming behavior of E-TPU beads
Figure 6.3 depicts the SEM morphologies of the AR-TPU-90A beads processed without water
and with water. The tsat and CO2 pressure were 30 min and 55 bar, respectively. The AR-TPU-
70A and AR-TPU-80A beads showed similar results and hence have not been included in the
results. Overall foaming with water significantly improved the foaming behavior of TPU beads.
It can also be observed that foaming in presence of water decreased the saturation temperature
(Tsat) to manufacture TPU bead foams. The Tsat decreased by approximately 20°C after
processing TPU beads in the presence of water.
(a) (b)
(c) (d)
Figure 6-3 Morphology of AR-TPU-90A beads at 55 bar CO2 pressure: (a), (b) without
water; (c), (d) with water
6.3.1.2 Effect of water on foaming behavior of E-TPU beads
Figures 6.4 and 6.5 shows the SEM morphologies of TPU beads processed without water and
with water at different Tsat and CO2 pressures (Psat). Two interesting observations can be made
from the morphologies of TPU beads shown in Figs 6.4 and 6.5. First, the effect of saturation
pressure is quite visible in the TPU foam morphologies processed without water and with water.
By increasing the Psat from 55 bar to 82 bar, the cell density significantly increased. At higher

153
saturation pressure, the concentration of CO2 in the TPU matrix increases, which decreases the
Rcr (Equation 6.4) and results in higher nucleation rate.
Eq. 6.4
The second observation is the effect of a critical saturation temperature (Tcritical) at which the
foaming behavior of TPU beads improved significantly. In the case of TPU beads processed
without water, the Tcritical was at 160°C at both the investigated saturation pressures as shown in
Figs. 6.4c and 6.4f. The foaming of TPU beads at Tcritical is observed to have improved
dramatically. However, the Tcritical for the TPU beads processed with water decreased to 145°C as
shown in Figs. 6.5b and 6.5d.
(a) (b) (c)
(d) (e) (f)
Figure 6-4 Morphology of AR-TPU-90A beads processed without water: (a), (b), (c) 55 bar
CO2; (d), (e), (f) 83 bar CO2

154
(a) (b)
(c) (d)
Figure 6-5 Morphology of AR-TPU-90A beads processed with water: (a), (b) 55 bar CO2;
(c), (d) 83 bar CO2
6.3.1.3 Effect of processing methods on foaming behavior of E-TPU beads
Figures 6.6a and 6.6b compares the AR-TPU-70A beads processed by pressure-drop and
temperature-jump method described in section 6.2.3.2 and section 6.2.3.3, respectively.
Similarly, Figs. 6.7a and 6.7b compares the AR-TPU-90A beads processed by pressure-drop and
temperature-jump method. Overall, in both AR-TPU-70A and AR-TPU-90A beads the
temperature-jump method significantly increased the cell density and reduced the cell size. In the
temperature-jump method the TPU pellets are saturated with CO2 at the room temperature and
the thermodynamic instability is achieved by suddenly increasing the temperature to the foaming
temperature. On the other hand, in the pressure-drop method the TPU pellets are saturated at the
foaming temperature and the thermodynamic instability is achieved by sudden drop in the
pressure of the system. Two possible reasons may have resulted in the observed difference in the
foaming mechanism with the two different methods. First, at the same saturation pressure (55 bar
CO2) the solubility of CO2 is much higher at lower temperature compared to saturation done at
higher temperature. Hence higher concentration of CO2 will reduce the critical radius and result
in higher nucleation. Second at higher saturation temperature more of the existing HS crystals
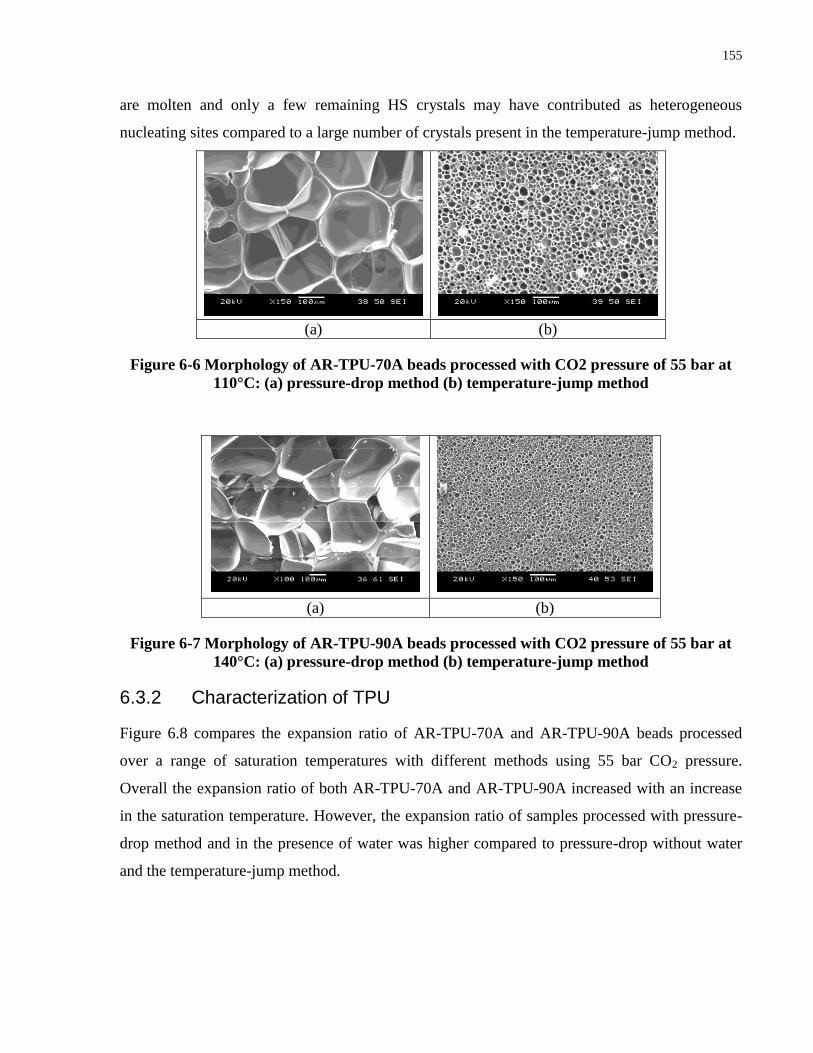
155
are molten and only a few remaining HS crystals may have contributed as heterogeneous
nucleating sites compared to a large number of crystals present in the temperature-jump method.
(a) (b)
Figure 6-6 Morphology of AR-TPU-70A beads processed with CO2 pressure of 55 bar at
110°C: (a) pressure-drop method (b) temperature-jump method
(a) (b)
Figure 6-7 Morphology of AR-TPU-90A beads processed with CO2 pressure of 55 bar at
140°C: (a) pressure-drop method (b) temperature-jump method
6.3.2 Characterization of TPU
Figure 6.8 compares the expansion ratio of AR-TPU-70A and AR-TPU-90A beads processed
over a range of saturation temperatures with different methods using 55 bar CO2 pressure.
Overall the expansion ratio of both AR-TPU-70A and AR-TPU-90A increased with an increase
in the saturation temperature. However, the expansion ratio of samples processed with pressure-
drop method and in the presence of water was higher compared to pressure-drop without water
and the temperature-jump method.

156
120 140 1600
2
4
6
8
10
12
14
16 Pressure drop- without water
Temp Jump
Exp
an
sio
n r
atio
Saturation temperature (oC)
Pressure drop- with water(a) AR-TPU-70A
100 120 140 160 1800
2
4
6
8
10
12
14
16
18
Expansio
n R
atio
Saturation temperature (oC)
AR-TPU-90A(b)
Pressure drop- without water
Temp Jump
Pressure drop- with water
Figure 6-8 Expansion ratio of E-TPU beads produced with different methods: (a) AR-TPU-
70A, (b) AR-TPU-90A
Figure 6.9 compares the expansion ratios of AR-TPU-70A, AR-TPU-80A and AR-TPU-90A
beads processed over a range of foaming temperature with the temperature-jump method.
Overall the expansion ratio of all the samples increased with an increase in the foaming
temperature. However, the expansion ratio of samples processed with pressure drop method and
in the presence of water was higher compared to pressure drop without water and the

157
temperature jump method. More HS crystals melted at a higher foaming temperature, causing the
SS to be more flexible, and hence, the TPU bead foams expanded easily. It is also interesting to
compare the expansion ratios of the beads based on the type of TPU. The HS concentration (i.e
crystallinity) increases with higher hardness (AR-TPU-70A < AR-TPU-80A<AR-TPU-90A).
Hence AR-TPU-70A with lower HS concentration is more elastic and had a higher expansion
compared to AR-TPU-80A and AR-TPU-90A at lower foaming temperatures. However at higher
foaming temperature the expansion ratio of AR-TPU-90A was higher compared to AR-TPU-70A
and AR-TPU-80A bead foams as shown in Fig. 6.9. This is similar to the case of high stiffness
governing on the expansion ratio as the temperature increases in the typical mountain shape
observed in the extrusion foaming [6]. The presence of higher amount of HS crystallites in AR-
TPU-90A assisted with higher expansion at higher foaming temperatures.
100 110 120 130 140 150 160 170
1
2
3
4
5
6
7
8
9
10
Exp
an
sio
n r
atio
Saturation temperature (0C)
AR-TPU-70A
AR-TPU-80A
AR-TPU-90A
Figure 6-9 Expansion ratio of different TPU foam beads processed with temperature-jump
method
6.3.3 Thermal behavior of E-TPU bead foams
6.3.3.1 Effect of water on thermal behavior of E-TPU beads
Figure 6.10 compares the DSC melting curves of AR-TPU-90A after annealing at 150°C for 30
min with different annealing conditions. The first curve at the bottom is the heating curve of the
sample, which was annealed at ambient pressure (1 bar). The second curve from the bottom is

158
the sample that was annealed in HP-DSC in presence of 55 bar CO2 pressure and without the
effect of foaming. The third curve depicts the melting behavior of the TPU bead foams processed
without water with 55 bar CO2. Finally, the fourth curve at the top shows the melting behavior of
the TPU bead foams processed in the presence of water with 55 bar CO2. Compared to annealing
at ambient pressure (1 bar), annealing with CO2 resulted in the decrease of the high temperature
(Tm-high ) melting peak from 165°C to 163.7°C due to the plasticizing effect of CO2. However the
formation of a new low temperature melting peak (Tm-low) at 62°C is observed after annealing
with CO2. Hence, CO2 assisted with nucleation of less perfected HS crystals. After foaming
without water, the Tm-high shifted to 167.2°C and the Tm-low shifted to 64°C. The foaming action
would have caused extensional stress and hence resulted in perfection of HS crystals and hence
the melting peaks shifted to higher temperatures. Further, foaming with water resulted in the
shifting of the Tm-high by approximately 20oC to 185
oC. The Tm-low also shifted to higher
temperature by 11oC. Also a new melting peak was formed at 159°C. The presence of water may
have acted as a plasticizer and assisted the mobility of HS crystals. On the other hand, the
extensional stress caused by the foaming action resulted in the perfection or growth of the HS
crystals forming the new very high melting temperature peak. Whereas, during the cooling action
after the foaming, new HS crystallites may have nucleated forming the low temperature melting
peaks. The total heat of fusion (ΔHT) (J/g) also increased after foaming with water compared to
foaming without water and annealing at different conditions. Thus the overall crystallinity of the
TPU foams increases after foaming.
The observed improvement in the foaming of TPU beads in the presence of water, which was
discussed in the section 6.3.1.1 can also be attributed to the formation and perfection of HS
crystallites that decreases the Rcr (Equation 6.3) by inducing local pressure variation (ΔPlocal) in
the amorphous SSs.

159
Figure 6-10 DSC melting curves of AR-TPU-90A after annealing at 150°C for 30 min with
different annealing conditions
6.3.3.2 Effect of annealing temperature on thermal behavior of E-TPU beads
Figure 6.11 depicts the DSC melting curves of AR-TPU-90A bead foams processed at different
saturation temperature’s and saturation time of 30 min in the presence of 55 bar CO2. These
beads are processed with pressure-drop method with water. Overall at all the annealing
temperatures, the bead foams showed three distinct melting peaks. A very low temperature
melting peak (Tm-low) was observed at 75°C. A new high melting peak (Tmc) was formed in the
range of 150°C to 160°C. This peak is related to the melting of the HS crystals formed during the
cooling phase after the saturation step and the foaming was completed. The third peak (Tma) is
observed at very high temperature in the range of 178 °C to 185°C depending on the saturation
temperature. This peak is related to the melting of the HS crystals, which are perfected during the
annealing process and also due to the extensional stress caused by the foaming action.
However it is interesting to observe the sudden increase in the Tmc and Tma melting peaks after
foaming at saturation temperature of 145°C. The Tmc and Tma temperature’s increased by
approximately 9°C and 6°C by changing the saturation temperature from 140°C to 145°C.
Further increase in the saturation temperature to 150oC did not affect the Tmc and Tma melting
30 60 90 120 150 180 210 240-0.5
0.0
0.5
165 (Tm-high
)
1.2 J/g
16 J/g
2.8 J/g
11.7 J/g
167.2
163.7
62 (Tm-low
)
64
75
159
foam-with water
foam-w/o water
Unfoamed
Heat flow
(J/g
)
Temperature (°C)
1 bar
1859.6 J/g
Endo
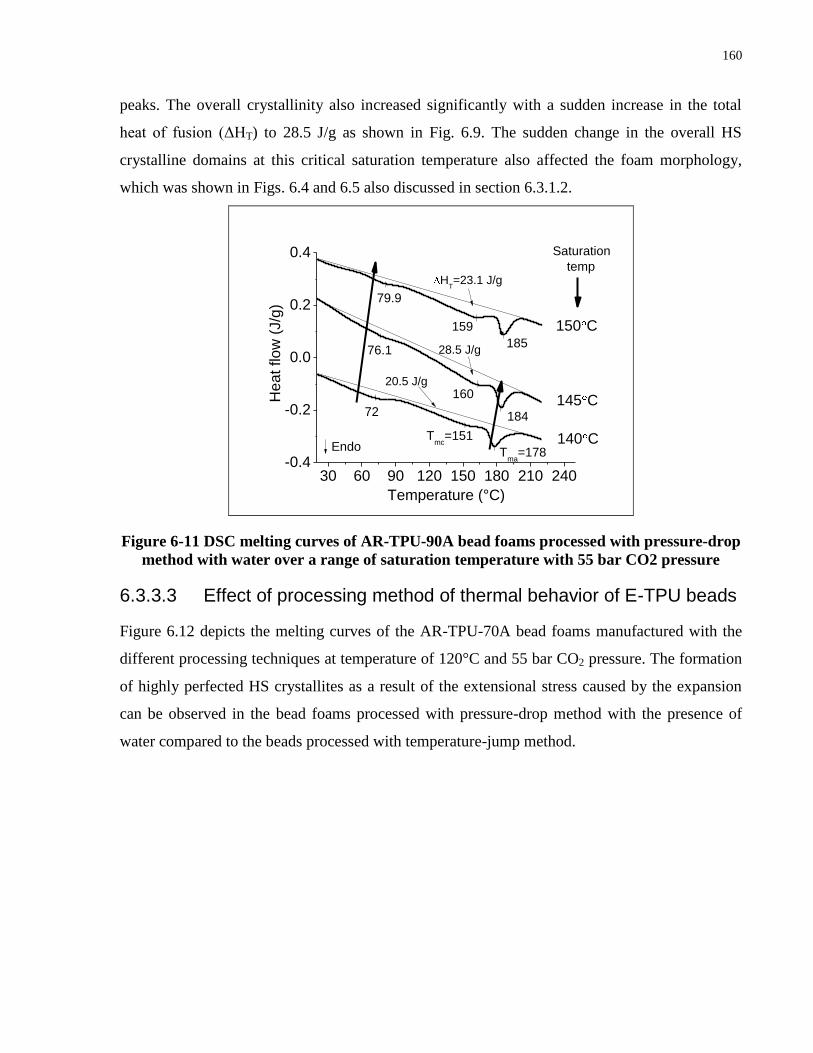
160
peaks. The overall crystallinity also increased significantly with a sudden increase in the total
heat of fusion (ΔHT) to 28.5 J/g as shown in Fig. 6.9. The sudden change in the overall HS
crystalline domains at this critical saturation temperature also affected the foam morphology,
which was shown in Figs. 6.4 and 6.5 also discussed in section 6.3.1.2.
30 60 90 120 150 180 210 240-0.4
-0.2
0.0
0.2
0.4
20.5 J/g
28.5 J/g
79.9
76.1
Tmc
=151
160
159
185
184
150 C
145 CHe
at flo
w (
J/g
)
Temperature (°C)
140 CT
ma=178
HT=23.1 J/g
Saturation
temp
72
Endo
Figure 6-11 DSC melting curves of AR-TPU-90A bead foams processed with pressure-drop
method with water over a range of saturation temperature with 55 bar CO2 pressure
6.3.3.3 Effect of processing method of thermal behavior of E-TPU beads
Figure 6.12 depicts the melting curves of the AR-TPU-70A bead foams manufactured with the
different processing techniques at temperature of 120°C and 55 bar CO2 pressure. The formation
of highly perfected HS crystallites as a result of the extensional stress caused by the expansion
can be observed in the bead foams processed with pressure-drop method with the presence of
water compared to the beads processed with temperature-jump method.

161
0 50 100 150 200 2500.0
0.2
0.4
16.5 J/g
16.3 J/g
151.1oC
68.2oC
141.7oC
65.7oC
166.8oC
136.1oC
He
at
flo
w (
J/g
)
Temperature (°C)
Press-drop-withwater
Press-drop-w/owater
Temp-Jump
66.9oC
13.6 J/g
AR-TPU-70A
Figure 6-12 DSC melting curves of AR-TPU-70A bead foams processed with different
methods
6.3.4 GPC analysis
Figure 6.13 compares the molecular weight of the AR-TPU-70A and AR-TPU-90A bead
foams processed in water with the unfoamed TPU materials. As seen in the Fig. 6.13, the
saturation of TPU at high temperature in the presence of water causes breakage of SS chains due
to hydrolysis and results in decrease of the overall molecular weight. However the AR-TPU-90A
foams had much lower decrease in the molecular weight. This might be due to the higher
concentration of HS in AR-TPU-90A beads, which may have acted as filler strengthening the
overall material.

162
Figure 6-13 Average molecular weight of the E-TPU beads processed with pressure-drop in
the presence of water: (a) AR-TPU-70A, (b) AR-TPU-90A
6.3.5 Sintering of E-TPU beads with steam-chest molding machine
To investigate the sintering behavior of TPU beads processed with the temperature-jump method
with the steam-chest molding machine, three beads were selected based on the cell morphology,
expansion ratio and processing method. Table 6.1 shows the different TPU bead foam materials
processed with the temperature-jump method used for the molding experiments, the expansion
Unfoamed-70A Foamed-70A
0.0
5.0x10⁴
1.0x10⁵
1.5x10⁵
2.0x10⁵
2.5x10⁵
3.0x10⁵
Mw
(g
/mo
l)
(a) Tsat
= 115oC
tsat
= 60 min
Psat
= 800 psi
Unfoamed- 90A Foamed-90A0.0
5.0x10⁴
1.0x10⁵
1.5x10⁵
2.0x10⁵
2.5x10⁵
Tsat
= 145oC
tsat
= 60 min
Psat
= 800 psi
Mw
(g
/mo
l)
(b)

163
ratio and the processing conditions (steam pressure/time) used in the steam-chest molding
machine to produce the E-TPU samples from the respective beads. To investigate the sintering
behavior of TPU beads processed with the pressure-drop method with water, E-TPU-90A beads
were selected. Table 6.2 shows the different processing conditions (steam pressure/time) used in
the steam-chest molding machine to produce the molded samples. Figure 6.14 depicts the actual
beads and their respective SEM images showing their cellular morphologies. It can be observed
that the beads processed with the temperature-jump method showed very glossy surface finish as
a result of the microcellular morphology achieved in their microstructure compared to the beads
processed with pressure-drop method.
Table 6-1 Different E-TPU beads and conditions (steam pressure/time) used to produce
molded E-TPU samples Sample Processing
method
Expansion
ratio
Fixed mold Moving mold Both Molds
Pressure
(bar)
Time
(sec)
Pressure
(bar)
Time
(sec)
Pressure
(bar)
Time
(sec)
E-TPU-
70A
Temp-
jump
14 1.6 25 1.6 5 1.6 15
E-TPU-
80A 8 1.6 25 1.6 5 1.6 15
E-TPU-
90A 8 3.8 75 3.8 75 3.8 20
Table 6-2 Different conditions (steam pressure/time) used to produce molded E-TPU-90A
samples
Sample Processing
method
Expansion
ratio
Fixed mold Moving mold Both Molds
Pressure
(bar)
Time
(sec)
Pressure
(bar)
Time
(sec)
Pressure
(bar)
Time
(sec)
E-TPU-
90A
Pressure-
drop with
water
13
1.5 25 1.5 5 1.5 15
2 25 2 5 2 15
2.2 25 2.2 5 2.2 15
2.4 25 2.4 5 2.4 15

164
(a) (b)
(c) (d)
(e) (f)
Figure 6-14 Actual E-TPU beads and their cellular morphologies: (a), (b) E-TPU-70A; (c),
(d) E-TPU-80A; (e), (f) E-TPU-90A
Figure 6.15 shows the molded E-TPU-90Abeads processed with the pressure-drop method with
water over range of steam pressure in the steam-chest molding machine. By increase in the steam
pressure, the overall sintering of the E-TPU-90A beads improved. By increasing the steam-
pressure to 2.2 bar (Fig. 6.15c), the overall dimensional stability of the molded sample started to
decrease and bead shrinkage was observed. At a steam pressure of 2.4 bar (Fig. 6.15d), the
molded part completely collapsed due to high degree of shrinkage in the beads. There is an
optimal pressure, which resulted in the best bonding of the E-TPU-90A beads while maintaining
the overall dimensional stability of the product. However, it is interesting to observe the
fractured E-TPU-90A molded part in Fig. 6.16, which was processed at 2 bar steam pressure and

165
showed the best overall sintering and dimensional stability. Although, the surface of the beads
was deformed due to the high temperature steam, the sintering of the beads was not very
effective. The fractured sample cracked very easily as a result of inter-bead failure, which is a
cause of very poor bead-to-bead bonding.
(a) (b)
(c) (d)
Figure 6-15 E-TPU-90A beads molded over range of steam pressure; (a) 1.5 bar, (b) 2 bar,
(c) 2.2 bar, (d) 2.4 bar
Figure 6-16 Fractured E-TPU-90A bead foam molded part manufactured with 2.2 bar
steam pressure

166
There might be two possible reasons for the observed bead shrinkage after the steam-chest
molding procedure at steam pressure 2.2 bar and above. First, the high steam temperature may
cause excessive melting which results in the percolation of the HS crystals. However, at the
steam pressure of 2.2 bar, approximately 50 % of the HS crystals still exists in the E-TPU bead
foams and hence it suggests that the shrinkage might not have been caused due to the percolation
of the HS crystals. The second possible reason for the shrinkage might be due to the thermal
stress induced in the beads during the bead foam processing step at high annealing temperature
of 145oC. The thermal stress is released during the molding step and due to the elastomeric
nature of TPU there is excessive shrinkage of the E-TPU beads. One possible technique would
be to use water laden beads during the steam-chest molding procedure. The water trapped in the
beads would vaporize due to the high temperature steam and cause the beads to expand and thus
reduce the effect of shrinkage and improve sintering.
To investigate the effect of water during the steam-chest molding process, the processed E-TPU
beads were immersed completely in water at different temperatures and soaking times and the
up-take amount of water was measured. Figure 6.17 shows the uptake percentage of water
absorbed in the E-TPU beads. At soaking temperatures of 25°C and 50°C, there was not
significant intake of water in the E-TPU beads. By increasing the soaking time to 70°C, the
percentage of water uptake increased significantly. With increase in the soaking time to 90°C,
the percentage of water uptake increased even further. However it should be noted that there was
also significant shrinkage after the E-TPU beads soaked with water at 90°C were exposed to
atmosphere. This again may have been as a result of the high thermal stress induced in the E-
TPU beads at higher soaking temperature. The “Req” value signifies the time of soaking and it
can be observed in Figure 6.17 that the water uptake percentage reaches a plateau after certain
time. The time that the percentage of water uptake reaches saturation is 3 hours.
To investigate the effect of water on the sintering behavior of E-TPU-90A beads, the beads
soaked at 50°C and 70°C for 3 hours were selected as marked by the box in Figure 6.17. Figure
6.18 depicts the E-TPU-90A beads soaked with water at 50°C and 70°C, and subsequently
molded at steam pressure of 2 bars. Both the samples still showed high degree of shrinkage. The
E-TPU-90A beads molded without any water intake showed much better overall dimensional
stability at the same molding condition as shown in Figure 6.15b. Thus processing of E-TPU
beads at higher processing temperatures might not be the best method to manufacture beads as

167
they tend to induce high degree of thermal stress and result in shrinkage during the molding
process.
0 2 4 6 8 10 12 14 16 18 200
10
20
30
40
50
60
70
80
90
Wa
ter
Up
take
%
Req
250C
500C
700C
900C
Figure 6-17 Water uptake percentage in E-TPU-90A beads over a range of temperature’s
and times
(a) (b)
Figure 6-18 E-TPU-90A beads soaked with water molded at 2 bar steam pressure ; (a) 50°C
water temperature, (b) 70°C water temperature

168
Figure 6.19 shows the E-TPU-70A, E-TPU-80A and E-TPU-90A beads molded into rectangular
parts. The steam pressure used to mold the beads was 1.6 bar. Qualitatively, it can be observed
that there is a very effective sintering of the three beads. Furthermore, the dimensional stability
of the molded part also is very good. To get a more quantitative data on the sintering behavior of
the molded samples, the tensile properties of the molded products was measured. Figure 6.20
shows the overall process from the loading to the final fracture of the sample being tested for the
tensile property. The samples extended by approximately 350% until the fracture.
(a) (b) (c)
Figure 6-19 Steam-chest molded E-TPU bead foams: (a) E-TPU-70A, (b) E-TPU-80A, (c)
E-TPU-90A
(a) (b)
Figure 6-20 Tensile property testing of E-TPU-70A molded sample: (a) loaded sample, (b)
fractured sample
Figure 6.21 shows the stress v/s strain plot for a series of E-TPU-70A and E-TPU-80A samples.
Further, Fig. 6.22 shows the Young’s modulus and tensile strength’s of the E-TPU-70A and E-

169
TPU-80A samples and the values are compared with EPP and EPLA molded bead foam parts
with the same density. The Young’s modulus of E-TPU-70A and E-TPU-80A is much lower
compared to the EPP and EPLA samples as shown in Fig. 6.22a. The lower Young’s modulus is
due to the elastomeric property of the TPU. However, the Young’s modulus of E-TPU-80A is
slightly higher than the E-TPU-70A sample. The tensile strength of the E-TPU beads was also
observed to be higher than EPP and EPLA beads as shown in Fig. 6.22b. Furthermore, the tensile
strength of E-TPU-80A was significantly higher than E-TPU-70A as shown in Fig. 6.22b. The E-
TPU-80A has higher concentration of HSs and hence the overall crystallinity of the material is
higher compared to E-TPU-70A sample. The higher HS crystalline domains would have acted as
filler and hence increased the overall tensile strength of the material.
Figure 6-21 Stress v/s strain curves of the samples: (a) E-TPU-70A, (b) E-TPU-80A

170
0
5
10
15
20
25
30
EPLA
EPP
E-TPU-80A
Yo
un
g's
Mod
ulu
s (
MP
a)
E-TPU-70A
(a)
0.0
0.2
0.4
0.6
0.8
1.0
1.2
1.4
EPLAEPP
E-TPU-80A
Te
nsile
Str
en
gth
(M
Pa
)
(b)
E-TPU-70A
Figure 6-22 Comparison of Young’s modulus and tensile strength of E-TPU, EPP and
EPLA molded samples: (a) Young’s modulus, (b) Tensile strength
The bead-to-bead sintering was further investigated by observing the SEM images of the molded
part. The surface, cut surface and fractured surface of the molded E-TPU-70A and E-TPU-80A
were observed and the results are shown in Fig. 6.23. As seen, the surface of the molded E-TPU-
70A and E-TPU-80A samples showed a good surface quality with inter-bead bonding between
the TPU beads. Qualitatively, the inter-bead bonding between the TPU beads can be visualized
in the cut surface of the molded sample. The beads are effectively sintered with well-defined

171
bead-to-bead surface. However, the fractured surface images give the best indication on a very
good bonding between the beads. Both, the E-TPU-70A and E-TPU-80A samples showed a
complete intra-bead failure which indicates a strong bead-to-bead sintering quality. The intra-
bead failure observed in E-TPU-70A and E-TPU-80A is much higher than other fractured
surface of other polymer bead foam parts such as EPP and EPLA.

172
Figure 6-23 SEM micrographs of the surfaces, the cut surfaces, and the fracture surfaces of
molded E-TPU-70A and E-TPU-80A samples
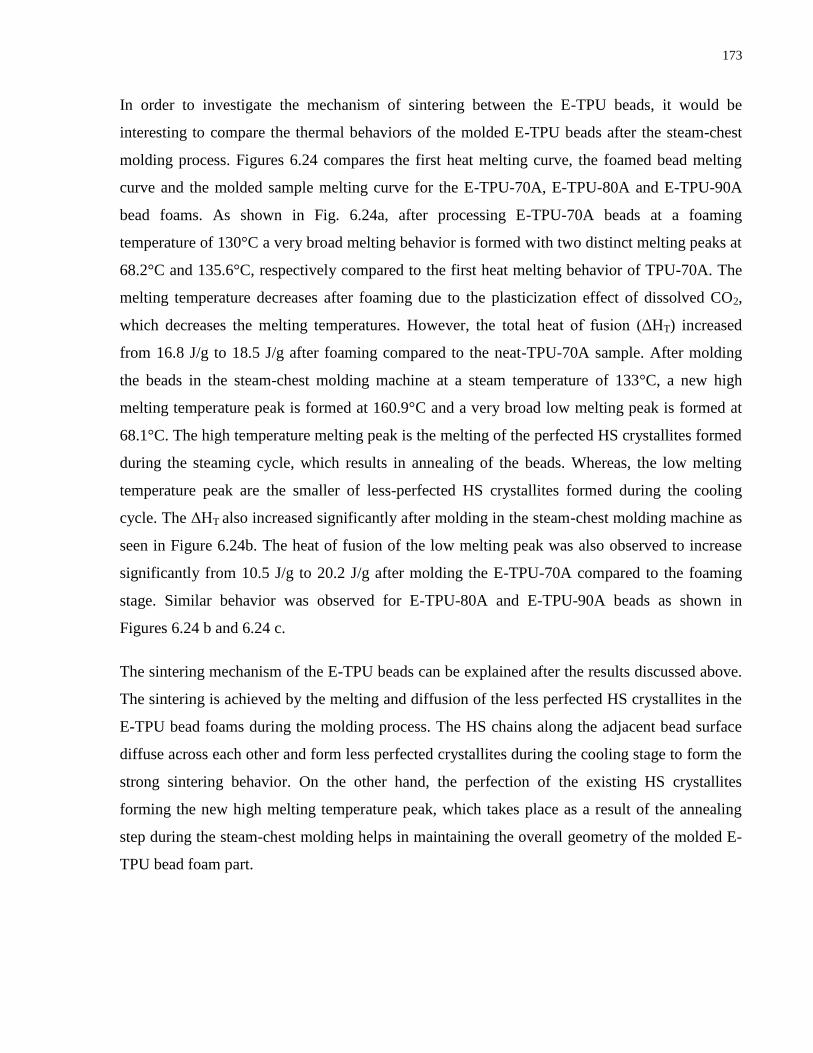
173
In order to investigate the mechanism of sintering between the E-TPU beads, it would be
interesting to compare the thermal behaviors of the molded E-TPU beads after the steam-chest
molding process. Figures 6.24 compares the first heat melting curve, the foamed bead melting
curve and the molded sample melting curve for the E-TPU-70A, E-TPU-80A and E-TPU-90A
bead foams. As shown in Fig. 6.24a, after processing E-TPU-70A beads at a foaming
temperature of 130°C a very broad melting behavior is formed with two distinct melting peaks at
68.2°C and 135.6°C, respectively compared to the first heat melting behavior of TPU-70A. The
melting temperature decreases after foaming due to the plasticization effect of dissolved CO2,
which decreases the melting temperatures. However, the total heat of fusion (ΔHT) increased
from 16.8 J/g to 18.5 J/g after foaming compared to the neat-TPU-70A sample. After molding
the beads in the steam-chest molding machine at a steam temperature of 133°C, a new high
melting temperature peak is formed at 160.9°C and a very broad low melting peak is formed at
68.1°C. The high temperature melting peak is the melting of the perfected HS crystallites formed
during the steaming cycle, which results in annealing of the beads. Whereas, the low melting
temperature peak are the smaller of less-perfected HS crystallites formed during the cooling
cycle. The ΔHT also increased significantly after molding in the steam-chest molding machine as
seen in Figure 6.24b. The heat of fusion of the low melting peak was also observed to increase
significantly from 10.5 J/g to 20.2 J/g after molding the E-TPU-70A compared to the foaming
stage. Similar behavior was observed for E-TPU-80A and E-TPU-90A beads as shown in
Figures 6.24 b and 6.24 c.
The sintering mechanism of the E-TPU beads can be explained after the results discussed above.
The sintering is achieved by the melting and diffusion of the less perfected HS crystallites in the
E-TPU bead foams during the molding process. The HS chains along the adjacent bead surface
diffuse across each other and form less perfected crystallites during the cooling stage to form the
strong sintering behavior. On the other hand, the perfection of the existing HS crystallites
forming the new high melting temperature peak, which takes place as a result of the annealing
step during the steam-chest molding helps in maintaining the overall geometry of the molded E-
TPU bead foam part.

174
40 60 80 100 120 140 160 180 2000.0
0.1
0.2
0.3
0.4
0.5
Molded- 133 C
Foam- 130 C
68.10C
160.90C
7.9J/g20.2 J/g
156.9oC
he
at
Flo
w (
J/g
)
Temperature (°C)
121.7oC
16.8 J/g
10.52 J/g
68.20C
135.60C
8.0 J/g
Tsteam
= 1330C
E-TPU-70A Sintering Mechansims
First Heat
(a)
-60 -30 0 30 60 90 120 150 180 210 2400.0
0.5
1.0
E-TPU-80A Sintering Mechansims
Mold- 1330C
Foam- 1000C
Tsteam
= 133.30C
Tg=-44.0
Tg=-46.3
7.2 J/g0.9 J/g
3.5 J/g5.2 J/g
86.6
0.6 J/g10.6J/g
153.166.1
134.268.7
156.9
Heat F
low
(J/g
)
Temperature (°C)
86.6
Tg=-49.2
First Heat
(b)

175
-30 0 30 60 90 120 150 180 210 240-0.5
0.0
0.5
1.0
E-TPU-90A Sintering Mechansims
32.0 J/g
101.90C
179.30C
160.50C90.9
0C
19.3 J/g29.9 J/g
35.6 J/g
1720C
Mold- 1650C
Foam- 1650C
He
at
Flo
w (
J/g
)
Temperature (°C)
First Heat
1260C
6.8 J/g
(c)
Tsteam
= 1650C
Figure 6-24 DSC melting peak comparisons of neat-TPU, foamed E-TPU beads and molded
E-TPU beads: (a) E-TPU-70A, (b) E-TPU-80A, (c) E-TPU-90A

176
6.4 Conclusions
In a lab-scale autoclave bead foaming setup, E-TPU beads with desirable crystalline structure
was manufactured and the beads were sintered using a steam-chest molding machine. The effect
of varying HS concentration on the bubble nucleation and the cell density of the processed E-
TPU beads was investigated. It was observed that the perfection in the existing HS crystalline
domains and the new HS crystallites developed during the saturation process induced a higher
degree of bubble nucleation which resulted in high cell density with smaller cell size in the E-
TPU bead foams. The processing techniques to produce E-TPU beads were also investigated. It
was observed that processing with pressure-drop method in the presence of water significantly
improved the overall foaming behavior (cell density and expansion ratio) of E-TPU beads
compared to the pressure-drop method without water. The presence of water resulted in higher
plasticization of the TPU matrix, which caused formation of some highly perfected HS crystals.
On the other hand, a large number of less-perfected HS crystallites (i.e. nucleation) also were
formed after processing E-TPU beads with water. These HS crystallites improved the cell
nucleation of E-TPU beads. Another interesting observation was the significant increase in the
cell nucleation at the critical saturation temperature, which was also reduced by 15-20ºC due to
the plasticization effect of water.
Compared to the pressure-drop methods, the temperature-jump method was found to be more
effective to achieve microcellular E-TPU beads due to the existence of large number of less-
perfected HS crystallites, which can be utilized as heterogeneous bubble nucleating agents. The
E-TPU beads produced via temperature-drop method also showed very good bead-to-bead
sintering using the steam-chest molding machine compared to the samples produced with the
pressure-drop method with water. It was also observed that the TPUs with lower HS
concentrations were more effective for sintering of the E-TPU beads using steam-chest molding
machine.

177
6.5 References
[1] Gibson PE, Wallace MA, Cooper AL. Development in Block Copolymer. London;
Elsevier; 1982.
[2] Cooper SL, Tobolsky AV. J Appl Polym Sci 1966; 10:1837-1844.
[3] Bonart R, Morbitzer L, Hentze GL. Macromol Sci, Phys 1969; B3: 337-356.
[4] Blackwell J, Lee CD. Adv. Urethane Sci Technol 1984; 9: 25-46.
[5] Park H, Park CB, Tzoganakis C, Chen P. Ind Eng Chem Res 2007; 46: 3849-3851.
[6] Naguib HE, Park CB, Reichelt N. J Appl Polym Sci 2004; 91(4): 2661-2668.

178
Chapter 7 Conclusion and Future Recommendations
7 Conclusion and Future Recommendations
7.1 Summary of Major Contributions
In this thesis, we successfully developed expanded TPU (E-TPU) bead foams with desirable hard
segment (HS) crystal melting peak structure for the sintering of the beads using steam-chest
molding machine. The effect of melt processing, micro/nano-additives and different gases on the
crystallization and phase separation behavior of the HSs in the TPU microstructure was
systematically investigated using regular DSC, high-pressure differential scanning calorimetry
(HP-DSC) and a specially designed saturation system for liquid-state hydrocarbons. It is shown
that the phase-separation and crystallization that can be induced in presence of different gas at
different pressures and also in the presence of micro/nano additives can significantly influence
the TPU’s foaming behavior (i.e. cell nucleation and expansion behavior). The HS crystallites
were also successfully utilized to create a very strong sintering of the E-TPU beads into three
dimensional rectangular parts using the steam-chest molding machine. The important
conclusions are given below.
7.1.1 Effect of processing, nano-/micro-sized additives and dissolved gas on the phase separation and crystallization behavior of TPU
The phase separation and crystallization behavior of TPU is very sensitive to the processing
conditions. There has been extensive research work published in the literature regarding the
phase separation and crystallization behavior of TPU at atmospheric pressure (1 bar). However
there has not been any research work reported in the literature to investigate the effect of high-
pressure dissolved gas on the crystallization behavior of TPU. In this PhD work, for the first time
the crystallization behavior of TPU in the presence of dissolved gas has been systematically
investigated and published. The crystallization behavior of dissolved CO2 was investigated using
a HP-DSC. However, to investigate the effect of aliphatic hydrocarbon (butane), which cannot be
used in a HP-DSC, a specially designed high-pressure saturation system was developed. It was
observed that the presence of dissolved CO2 and butane induced a large number of less perfected
HS crystallites, which was a result of increase in the HS crystal nucleation mechanism during the

179
cooling from the annealing temperature after the completion of the annealing process. The
blending of GMS with TPU significantly improved the phase separation and crystallization
behavior of TPU. The presence of GMS acted as a lubricating agent and assisted the HS chains
to stack into higher degree of perfection and also assisted in the growth of HS crystallites to form
spherulitic crystals. Thus the overall crystallinity of the TPU was significantly improved after
annealing with CO2, butane and GMS. The presence of nano-clay and nano-silica did not
significantly affect the HS phase separation and crystallization behavior in the TPU
microstructure both independently and in synergy with dissolved gas. Another interesting
observation was the effect of melt-compounding, which resulted in the breakage of HS chains
and assisted the chains to stack and form HS crystallites with higher degree of perfection.
Overall the increase in the phase-separation and crystallization of HSs due to annealing with
dissolved gas and with GMS resulted in improved SS purity, which was observed with decrease
in the glass transition temperature. Thus the SS elasticity is also improved as a result the
annealing with dissolved gas and GMS compared to annealing at ambient pressure.
7.1.2 Effect of HS crystallites on the foaming behavior of TPU
In this study, a novel technique of utilizing the HS domains in the TPU microstructure was used
to prepare microcellular TPU foams using butane as the foaming agent over a wide range of
foaming conditions. Since butane has not been used for microcellular plastics because of its low
volatility and high solubility, and thereby low thermodynamic instability generated from the
rapid solubility drop, it is interesting to note the microcellular cell nucleation induced with the
butane used in this study. Although butane generates a relatively low thermodynamic instability,
its impact on the crystallization caused microcellular nucleation. It was observed that the melt
processing of AR-TPU caused a breakage of the HS chains. Thus, the PR-TPU sample showed
broad distribution of HS domains, which also included some highly ordered HS nano-crystals
with very high melting temperature. Moreover, the saturation temperature and butane’s
plasticizing impact significantly induced larger content of HS domains with higher perfection in
the PR-TPU. Consequently, without addition of any nucleating agents, the cell nucleation was
promoted in the vicinity of the largely distributed and perfected HS domains over a wide
saturation temperature range of 150°C-170°C at a saturation pressure of 55 bar. Overall, the PR-
TPU showed very a high nucleation rate compared to the AR-TPU due to the presence of broad
HS domains in their microstructure.
180
The crystallization kinetics of TPU was significantly improved in the presence of GMS and
dissolved butane, which resulted in the formation of large number of less perfect HS crystallites
dispersed in the SS matrix whereas some highly perfected HS crystals are also formed. Unlike its
low volatility and high solubility, butane was successfully utilized in the fabrication of
microcellular TPU foams. This was facilitated through the impact of butane on the crystallization
of HSs. The HS crystallites acted both as heterogeneous nucleating sites as well as reinforcement
leading to the microcellular morphology with a high expansion ratio in TPU-GMS samples.
Consequently, without addition of any nucleating agents, cell nucleation was promoted in the
vicinity of the largely distributed and perfected HS domains over a wide saturation temperature
range of 150-170°C at a saturation pressure of 55 bar. Overall, the TPU-GMS showed very high
nucleation rates compared to the neat-TPU.
This study also investigated the effect of water and super-critical CO2 as co-blowing agents for
the production of PR-TPU and TPU nano-clay nanocomposite microcellular foams at a moderate
CO2 pressure of 55 bar and saturation time of 60 min. The cell density increased significantly
due to the synergistic effects of nano-clay particles and the HS crystalline domains acting as
bubble nucleation sites.
7.1.3 Effect of HS crystallites on the foaming behavior of TPU
Steam is a powerful medium for transferring heat rapidly and therefore it is commonly used in
polymer bead foam sintering. But because of the thermodynamic property, the pressure loss
unavoidable during flow through the beads causes a temperature decrease and thereby negatively
affects the sintering behavior and the mechanical properties in the core of steam-chest molding.
In order to reduce the sensitivity of the temperature to the pressure variation inside the mold, hot
air was added to the steam line. The introduction of hot air was optimized to investigate the
effect of different parameters such as the hot air flow rate, the hot air temperature and the hot air
pressure, while the steam pressure was kept constant. The steaming time decreased by 32% and
the local temperature at entry port decreased by 8% at the highest available air flow rate of 120
l/min. The overall heat transfer improved significantly with an increase in the hot air flow rate.
The surface roughness values (Ra and Rz) decreased by approximately 50% at the hot air flow
rate of 120 l/min. An increase in the hot air pressure also showed a decrease in the surface
181
waviness (Wa) by approximately 50%. However, varying the hot air temperature did not cause
any significant change on the surface property.
The use of hot air with steam showed significant improvement in the overall consistency of the
tensile property across the molded EPP part as compared to the samples molded with pure steam.
The corresponding consistency was achieved due to an improved heat flow to the core of the
molded sample. This is possible due to the synergistic effect of the high thermal conductivity of
steam and the low Joule-Thompson coefficient of hot air. With either an increase in the hot air
flow rate or in the pressure, the heat flow is improved leading to an overall improvement in the
tensile property. Hence the results of this work reveal the potential application of hot air in the
steam-chest molding process to produce EPP bead products with improved surface quality,
enhanced mechanical properties and a shortened cycle time resulting in a reduced operating cost.
7.1.4 Lab-scale autoclave processing of E-TPU beads and sintering with steam-chest molding machine
In a lab-scale autoclave bead foaming setup, E-TPU beads with desirable crystalline structure
was manufactured and the beads were sintered using a steam-chest molding machine. The effect
of varying HS concentration on the bubble nucleation and the cell density of the processed E-
TPU beads was investigated. It was observed that the perfection in the existing HS crystalline
domains and the new HS crystallites developed during the saturation process induced a higher
degree of bubble nucleation which resulted in high cell density with smaller cell size in the E-
TPU bead foams. The processing techniques to produce E-TPU beads were also investigated. It
was observed that processing with pressure-drop method in the presence of water significantly
improved the overall foaming behavior (cell density and expansion ratio) of E-TPU beads
compared to the pressure-drop method without water. The presence of water resulted in higher
plasticization of the TPU matrix, which caused formation of some highly perfected HS crystals.
On the other hand, a large number of less-perfected HS crystallites (i.e. nucleation) also were
formed after processing E-TPU beads with water. These HS crystallites improved the cell
nucleation of E-TPU beads. Another interesting observation was the significant increase in the
cell nucleation at the critical saturation temperature, which was also reduced by 15-20ºC due to
the plasticization effect of water.

182
Compared to the pressure-drop methods, the temperature-jump method was found to be more
effective to achieve microcellular E-TPU beads due to the existence of large number of less-
perfected HS crystallites, which can be utilized as heterogeneous bubble nucleating agents. The
E-TPU beads produced via temperature-drop method also showed very good bead-to-bead
sintering using the steam-chest molding machine compared to the samples produced with the
pressure-drop method with water. It was also observed that the TPUs with lower HS
concentrations were more effective for sintering of the E-TPU beads using steam-chest molding
machine.
7.2 Summary of Major Contributions (Publications)
Published Journal Articles
1- Hossieny, N., Barzegari, M.R., Nofar M., Mahmood S.H., Park, C.B., “Crystallization of
Hard Segment Domains With the Presence of Butane for Microcellular Thermoplastic
Polyurethane Foams”, Polymer, 2014, 55, 651-662. (Chapter 3 and 4)
2- Hossieny, N., Ameli, A., Park, C.B., “Characterization of Expanded Polypropylene Bead
Foams With Modified Steam-Chest Molding”, Industrial & Engineering Chemistry Research,
2013, 52 (24), 8236-8247. (Chapter 5)
Submitted and Ready to Submit Articles
1- Hossieny, N., Shaayegan, V., Ameli, A., Saniei, M., Jahani, D., Park, C.B., “Effects of
Glycerol Monosterate and Butane on Phase Separation of Hard Segment and Its Impact on
Microcellular Thermoplastic Polyurethane Morphology”, RSC Advances, submitted in May
2014 and minor revision received. (Chapter 3 and 4)
2- Hossieny, N., Raps, D., Altstädt, V., Park, C.B., “Past and Present Developments in Bead
Foams and Bead Foaming Technology”, Polymer, submitted in July 2014. (Chapter 2)
3- Hossieny, N., Ameli, A., Saniei, M., Park, C.B., “Expanded Thermoplastic Polyurethane
Beads: Thermal, Foaming and Sintering Behaviors”, ready and will be submitted in August
2014. (Chapter 5)

183
7.3 Recommendations for Future Research
The processing of E-TPU bead foams with the conventional pressure-drop bead foaming method
provided some very interesting insight on the effect of water. The water plasticized the TPU and
decreased the processing temperature. The HS crystalline domains were also affected with the
presence of water. However the cell morphology was not seen to improve with the changes in the
HS crystalline domain. Especially, considering other bead foams such as EPP and EPLA, which
successfully utilized the crystals generated during the bead processing to produce microcellular
morphologies. The HS crystalline domains during E-TPU processing was not used effectively to
produce microcellular morphologies. Hence for future work, it would be very interesting to
systematically investigate using the simulation system described in Chapter 4 and decouple the
effect of water on the HS crystalline domains and their subsequent effect on the foam
morphology of TPU.
Another area to explore based on the scientific knowledge of the E-TPU bead foams generated
from this research is to develop other bead foam materials based on elastomeric materials .
Polyether-block-amide (Pebax) is a very good material to initially investigate based on the E-
TPU beads developed in this research. The processing of the beads can also be investigated using
continuous efficient process with extruder and an underwater pelletizer. Further, the sintering of
the investigated and developed elastomeric beads materials can be systematically investigated
using the modified steam-chest molding machine, which was developed in this research. The use
of hot air can reduce the moulding time and energy consumption, which would significantly
promote the use of expanded elastomeric materials for a wide range of applications. The
mechanical properties of the parts can also be improved with hot air thus making it very
attractive in a variety of industrial applications.