development of analytical methods in … · hereditary and acquired genetic disease ... hereditary...
TRANSCRIPT

DDEVELOPMENTEVELOPMENT OFOF ANALYTICALANALYTICAL METHODSMETHODS ININ
METABOLOMICSMETABOLOMICS FORFOR THETHE STUDYSTUDY OFOF
HEREDITARYHEREDITARY ANDAND ACQUIREDACQUIRED GENETICGENETIC
DISEASEDISEASE
Raffaele Arvonio
Dottorato in Scienze Biotecnologiche – XXIVcicloIndirizzo Biotecnologie MedicheUniversità di Napoli Federico II


Dottorato in Scienze Biotecnologiche – XXIVcicloIndirizzo Biotecnologie MedicheUniversità di Napoli Federico II
DDEVELOPMENTEVELOPMENT OFOF ANALYTICALANALYTICAL METHODSMETHODS ININ
METABOLOMICSMETABOLOMICS FORFOR THETHE STUDYSTUDY OFOF
HEREDITARYHEREDITARY ANDAND ACQUIREDACQUIRED GENETICGENETIC
DISEASEDISEASE
Raffaele Arvonio
Dottorando: Raffaele Arvonio
Relatore: Prof.ssa Margherita Ruoppolo
Coordinatore: Prof. Giovanni Sannita


Allo staff del Laboratorio di Screening di Malattie Metaboliche Ereditarie
(2006-2011)


INDEX ABBREVIATIONS pg. 3
RIASSUNTO pg. 5
SUMMARY pg. 9
Chapter 1 METABOLOMICS AND MASS SPECTROMETRY
1.1 Metabolomics pg. 13
1.2 Metabolome analysis pg. 14
1.3 Mass spectrometry for metabolomics pg. 15
3.1.1 Instrumentation pg. 15
1.3.1.1 Electron Ionization pg. 17
1.3.1.2 Chemical Ionization pg. 18
1.3.1.3 Electrospray Ionization pg. 18
1.3.1.4 Atmospheric Pressure Chemical Ionization pg. 19
1.3.1.5 Mass analyzers pg. 20
1.5.1 Magnetic analyzer pg. 20
1.5.2 Quadrupole mass analyzer pg. 20
1.5.3 Time-of-flight analyzer pg. 21
1.5.4 Ion trap pg. 21
1.5.5 Fourier transform-ion cyclotron resonance
pg. 21
1.3.1.6 Detectors pg. 21
1.3.1.7 Mass spectrum pg. 22
1.3.2 Chromatographic techniques and interfacing pg. 22
1.3.3 Tandem MS pg. 23
1.4 Objectives of research project pg. 24
Chapter 2 NEWBORN SCREENING OF INBORN ERROR OF METABOLISM
2.1 NEWBORN SCREENING pg. 25
1

2.1.1 Disorders of amino acid metabolism pg. 26
2.1.2 Fatty acid and organic acid disorders pg. 26
2.1.3 MCADD pg. 27
1.2 MATERIALS AND METHODS pg. 30
1.1 Expanded Newborn Screening programs pg. 30
1.2 Sample preparation pg. 30
1.3 Acylcarnitines and amino acids profile pg. 30
1.3 RESULTS AND DISCUSSION pg. 33
1.4 CONCLUSIONS pg. 34
Chapter 3 THERAPEUTIC DRUG MONITORING IN CML PATIENTS
3.1 Chronic myeloid leukemia pg. 35
3.1.1 Clinical features pg. 353.1.2 Molecular pathophisiology pg. 353.1.3 Treatment pg. 36
3.1.3.1 Imatinib mesylate pg. 373.1.3.2 Nilotinib pg. 37
3.2 MATERIALS AND METHODS pg. 39 3.2.1 Materials pg. 393.2.2 Patients pg. 393.2.3 Calibrators and quality controls preparation pg. 393.2.4 HPLC-UV and LC-MSMS methods pg. 403.2.5 Bland –Altman plot pg. 423.2.6 Real time quantitative PCR pg. 42
3.3 RESULTS AND DISCUSSION pg. 43 3.4 CONCLUSIONS pg. 47
REFERENCES pg. 49
COMMUNICATIONS AND PUBBLICATIONS pg. 52
2
ABBREVIATIONS
Aa: amino acidABL: Abelson leukemia virusAc: acylcarnitineAPI 2000: type of tandem mass spectrometry Applied BiosystemBCR: breakpoint cluster regionC0: free carnitine CAD: collision gasCE: collision energyCEP: collision cell entrance potentialCI: chemical ionizationCML: Chronic Myeloid LeukemiaCUR: curtain gasDP: declustering potentialEI: electronic ionizationEP: entrance potentialESI: electrospray ionizationFAB: fast atom bombardment FP: false-positiveHPLC: high performance liquid chromatographyIhe: interface heaterIS: ion-spray voltageLC-MS/MS: liquid chromatography/tandem mass spectrometrym/z: mass/charge ratioMADD: multiple acyl-CoA dehydrogenase deficiency MALDI: matrix assisted laser ionizationMCADD: medium-chain acyl-CoA dehydrogenase deficiencyMMR: major molecular response MRM: multiple reaction monitoringMS/MS: triple quadrupole spectrometerMS1: first quadrupole (Q1) of a triple quadrupole analyzerMS2: the third quadrupole (Q3) of a triple quadrupole analyzerQ1, Q2, Q3: first, second and third quadrupole of a triple quadrupole analyzerSCADD: short-chain acyl-CoA dehydrogenase deficiencySD: standard deviationTIC: total ion currentTOF: time of flight analyzeVLCAD: very long-chain acyl-CoA dehydrogenase deficiency
3

4

RIASSUNTO
METABOLOMICA E SPETTROMETRIA DI MASSA
Il progetto di ricerca ha avuto come obiettivo lo sviluppo di metodi di metabolomica. La metabolomica si propone lo studio sistematico dei metaboliti presenti in una cellula e in questo campo la spettrometria di massa, grazie alla sua potenzialità di effettuare esperimenti di frammentazione controllata, gioca un ruolo fondamentale come metodologia d’identificazione.Inoltre, la possibilità di accoppiare il potere risolutivo di differenti tecniche cromatografiche all’elevata specificità e selettività della spettrometria di massa tandem ha permesso l’enorme sviluppo della metabolomica. Le linee di ricerca seguite durante il progetto di dottorato sono fondamentalmente due: 1) sviluppo di metodologie analitiche per ampliare lo spettro dei metaboliti diagnostici nello screening neonatale di errori congeniti del metabolismo; 2) sviluppo di metodi analitici per l’identificazione e quantizzazione di farmaci presenti in concentrazioni anche molto basse in fluidi biologici.
SCREENING ALLARGATO E ERRORI CONGENITI DEL METABOLISMO
Il presente progetto di dottorato è stato condotto nel Laboratorio di Screening di Malattie Metaboliche Ereditarie del Dipartimento Assistenziale di Medicina di Laboratorio dell’Azienda Ospedaliera Universitaria “Federico II” di Napoli che, in convenzione con il CEINGE, da maggio 2007 ha intrapreso un progetto pilota per lo screening neonatale metabolico allargato.Lo screening neonatale consiste in una serie di esami effettuati nelle prime 48-72 ore di vita del bambino attraverso un’analisi LC-MS/MS: da una goccia di sangue prelevata dal tallone del neonato, si dosano i markers diagnostici delle varie malattie metaboliche. La diagnosi precoce permette d’intraprendere una terapia in grado di prevenire totalmente, o parzialmente, i danni provocati dalla malattia. Lo spettrometro su cui sono condotte le analisi è un sistema LC-MS/MS API 2000 Applied Biosystem. Lo strumento in questione è costituito da un HPLC come sistema d’introduzione del campione, da un’ESI (electrospray ionization) come sorgente, un triplo quadrupolo come analizzatore e un rivelatore per l’elaborazione dei dati. Sono state sviluppate metodologie che consentono l’identificazione sullo spot di sangue di aminoacidi e acilcarnitine e il dosaggio quantitativo mediante l’uso di standards deuterati a concentrazioni note.Nell’ambito del progetto di screening neonatale allargato, che ha coinvolto 14 centri nascita campani, sono stati sottoposti a screening dal 01/05/2007 al 30/09/2011 23.753 neonati e fra questi sono stati diagnosticati 10 casi di malattie metaboliche ereditarie: 2 casi di Medium-Chain Acyl CoA Dehydrogenase Deficiency (MCADD), 1 caso di β-Ketothiolase Deficiency (BKTD), 1 caso di Short Branched Chain Amino acid Deficiency (SBCAD), 1 caso di Propionic Aciduria (PA), 2 casi di maternal vitamin B12 Deficiency, 1 caso di Isovaleric Aciduria, 1 caso di Methylmalonic Aciduria e 1 caso di Isobutirryl CoA Dehydrogenase Deficiency. I casi diagnosticati hanno condotto a effettuare test genetici sulla famiglia dei neonati. In questo modo è stato possibile non solo avere la conferma genetica della patologia nel neonato, ma è stato possibile diagnosticare, nel ceppo familiare, anche i soggetti portatori sani della malattia genetica.Durante lo svolgimento della tesi è stato studiato un caso di deficit di Acil-CoA deidrogenasi a catena media (MCADD). Dopo la diagnosi è stata avviata per il piccolo paziente una terapia endovena di glucosio, come terapia d’urto della fase acuta. Le analisi
5

biochimiche e molecolari sono state estese anche ai familiari consentendo di definire che i parenti del bambino affetto sono portatori sani della malattia, eterozigoti per la stessa mutazione. Le analisi biochimiche e genetiche hanno inoltre permesso di scoprire che anche il fratellino di 15 mesi è affetto dalla stessa patologia, permettendo quindi di sottoporlo alle cure mediche appropriate. La diagnosi di MCADD in una fase presintomatica attraverso un’analisi LC-MS/MS, rispetto a una fase post-sintomatica, permette di abbattere la percentuale di coma dal 84% allo 0%, la percentuale di danni neurologici dal 40% allo 0,02% e la percentuale di mortalità dal 20% allo 0,02%.
MONITORAGGIO TERAPEUTICO DI FARMACI IN PAZIENTI AFFETTI DA LEUCEMIA MIELOIDE CRONICA
La seconda linea di ricerca, riguardante lo sviluppo di metodi analitici per il dosaggio di farmaci in fluidi biologici, si è focalizzata soprattutto sullo sviluppo di metodi analitici per il dosaggio di imatinib, farmaco usato nel trattamento dei pazienti affetti da Leucemia Mieloide Cronica. La leucemia mieloide cronica (LMC) è una neoplasia maligna, causata da un’alterazione acquisita della cellula staminale totipotente del midollo osseo. L’anomalia genetica della LMC è la traslocazione cromosomica tra i cromosomi 9 e 22 che dà luogo alla formazione di un cromosoma 22 più corto (cromosoma Philadelphia) e dà origine a un gene ibrido, il gene BCR/ABL, che codifica per un’oncoproteina (Bcr/Abl) con un’attività tirosino-chinasica deregolata. Nella cura della LMC è stato fatto un grande passo avanti nel 1998 quando è stato commercializzato l’imatinib.L’imatinib è il capostipite di una nuova classe di agenti chemioterapici che agiscono inibendo enzimi ad attività tirosin-chinasica piuttosto che inibendo la rapida divisione delle cellule: esso agisce come un inibitore allosterico, bloccando la proteina enzimatica in una conformazione tale da impedire l’accesso dell’ATP al sito attivo inibendo la fosforilazione del substrato.Il monitoraggio plasmatico dell’Imatinib è importante ai fini terapeutici poiché i pazienti in terapia, dopo 4-5 anni di trattamento, possono acquisire resistenza al farmaco; in caso di fallimento della terapia e comparsa di severi eventi avversi è importante intervenire tempestivamente con l’adeguamento della dose di imatinib o con altre scelte terapeutiche che si basano sulla somministrazione di farmaci di II generazione come nilotinib e dasatinib.Il laboratorio presso il quale si svolge il dottorato di ricerca, è inserito nel progetto EUTOS Imatinib BLT (Blood Level Testing) come centro di riferimento del centro-sud Italia e isole per il dosaggio plasmatico di imatinib.Per il dosaggio plasmatico di imatinib si è messa a punto una procedura analitica che utilizza la LC-MS/MS. Lo spettrometro su cui si è sviluppato il metodo è uno spettrometro di massa a triplo quadrupolo, cioè formato da tre quadrupoli posti in serie, in cui il primo e il terzo Q1 e Q3 funzionano da filtri di massa mentre il secondo funziona da cella di collisione. La possibilità d’impostare singolarmente i quadrupoli su determinati range di massa permette un’analisi altamente selettiva e specifica.Si effettuano delle scansioni al primo analizzatore di massa al fine di ottenere la massima sensibilità sul rapporto massa/carica dello ione precursore attraverso l’ottimizzazione di una serie di parametri strumentali.Una volta che lo ione precursore è stato ottimizzato in termini di sensibilità e selettività, si procede alla sua frammentazione nella cella di collisione (Q2), in modo da stabilire i suoi ioni prodotto caratteristici. La scelta degli ioni prodotto è molto importante poiché, a determinate condizioni, una molecola frammenterà sempre allo stesso modo e si
6

formeranno sempre gli stessi frammenti, quindi gli ioni prodotto che si scelgono in questa fase saranno quelli che andranno a caratterizzare la molecola e a permetterne l’identificazione in matrici anche molto complesse.Una volta ottimizzati i parametri per le frammentazioni caratteristiche, si ottimizzano le condizioni cromatografiche. Una volta sviluppato e ottimizzato il metodo, si è passati a dosare le concentrazioni plasmatiche di imatinib per i pazienti arruolati nel progetto EUTOS.I dati dell’Imatinib blood level testing sono trattati tramite una piattaforma digitale, il “labnet” che fa da filo diretto tra i centri ematologici associati e i centri di riferimento per il dosaggio dell’imatinib. Un ulteriore obiettivo del progetto è stata la valutazione della correlazione di due metodi per il dosaggio plasmatico dell’imatinib: LC-MS/MS e HPLC-UV/VIS. Per lo studio, è stato dosato l’imatinib plasmatico di 162 pazienti, classificati in cinque gruppi in base alla dose di imatinib giornaliera: 9 pazienti con dose da 200 mg al giorno, 29 con dose da 300 mg, 91 con dose da 400 mg, 24 con dose da 600 mg e 9 con dose da 800 mg. I campioni sono stati analizzati in triplicato mediante l’applicazione di entrambi i metodi: il coefficiente di correlazione tra i due metodi è stato calcolato utilizzando il set totale dei dati e per ogni gruppo di dati corrispondenti ai cinque gruppi di pazienti. I risultati non mostrano differenze significative tra i dati ottenuti con entrambi i metodi. Per confrontare i dati ottenuti con HPLC-UV e con LC-MS/MS è stato utilizzato il metodo di Bland-Altman. Questo metodo prevede l’analisi grafica delle differenze tra le due tecniche in funzione delle medie: due metodiche sono intercambiabili allorquando le misure delle medie rientrino nell’intervallo “media delle differenze ± 1,96 deviazioni standard”. Applicando il metodo delle differenze ai risultati dei dosaggi dei 162 campioni analizzati con HPLC-UV/VIS e LC-MS/MS, si dimostra che le misurazioni rientrano nei limiti di concordabilità e che le due metodiche sono, quindi, intercambiabili. Nel tempo, sono stati monitorati sei pazienti rilevando la concentrazione plasmatica d’imatinib usando LC-MS/MS e la risposta molecolare (MR) per valutare la correlazione tra le due analisi. Dal confronto emerge che l’analisi LC-MS/MS conferma i dati della risposta molecolare: in caso di risposta molecolare maggiore, si riscontra una concentrazione plasmatica d’imatinib di circa 1000 ng/mL (concentrazione ottimale); al contrario, in assenza di risposta alla terapia, si riscontra una concentrazione plasmatica d’imatinib inferiore o superiore alla concentrazione plasmatica ottimale.
Durante il corso di dottorato sono stati effettuati esperimenti per l’identificazione e quantizzazione, tramite un’analisi LC-MS/MS, dei metaboliti derivanti dalla biotrasformazione di imatinib. Studi con marcatura radioattiva hanno dimostrato che l’imatinib e il suo principale metabolita (N-demetilato) sono insieme responsabili solo del 65% della radioattività in circolo, quindi il resto della radioattività è da ricondurre a un numero di metaboliti minori ancora poco caratterizzati. Per questo motivo è stato sviluppato un metodo per dosare contemporaneamente l’imatinib inteso come parent drug e alcuni suoi metaboliti che potrebbero avere un certo significato se bioattivi. Il monitoraggio di nuovi biomarkers potrebbe permettere di utilizzare l’imatinib calibrandolo sul metabolismo individuale, in modo da massimizzare l’efficacia e minimizzare il numero degli effetti collaterali.Il laboratorio presso il quale si è svolto il dottorato di ricerca è inserito anche nel protocollo internazionale GIMEMA (Gruppo Italiano Malattie Ematologiche dell’Adulto) CML 0408. Il protocollo GIMEMA CML 0408 è uno studio sperimentale di fase II, prospettico e multicentrico, per il trattamento di prima linea della CML, BCR-ABL positiva, con i due inibitori tirosino-chinasici, imatinib e nilotinib. L’uso di più inibitori in combinazione o in rotazione, secondo il principio di polichemioterapia del cancro, può permettere un sostanziale miglioramento del trattamento.
7

Nilotinib e imatinib non sono somministrati insieme, ma secondo un calendario a rotazione, 3 mesi nilotinib, 3 mesi imatinib, per 24 mesi (study core), e per altri 36 mesi (study extension) se è nell’interesse del paziente. Il nilotinib è somministrato per via orale due volte al giorno, per una dose totale giornaliera di 800 mg; l’imatinib è somministrato per via orale una volta al giorno con una dose di 400 mg.L’obiettivo primario di tale progetto è valutare la correlazione tra la risposta ai farmaci e il livello plasmatico dei farmaci. A tal fine, oltre a sviluppare un metodo per il dosaggio di imatinib, si è sviluppato anche un metodo LC-MS/MS per il dosaggio di nilotinib. Ad oggi, i pazienti arruolati nello studio sono 123 ed escludendo i 23 drop out, tutti i pazienti hanno raggiunto i 12 mesi di trattamento. Dopo 30 giorni di trattamento con nilotinib, i pazienti hanno una concentrazione plasmatica media di 2438 ng/mL; al giorno 90 una concentrazione media di 2625 ng/mL. Ai giorni 120 e 180 i pazienti hanno una concentrazione media di imatinib rispettivamente di 1265 e 1220 ng/mL. Al giorno 270, dopo altri 3 mesi di trattamento con nilotinib, la concentrazione media è di 2958 ng/mL e al giorno 360 la concentrazione media di imatinib è 1180 ng/mL. Non sono riportate in letteratura concentrazioni plasmatiche ottimali di nilotinib, mentre recenti studi riportano che concentrazioni plasmatiche di imatinib leggermente superiori a 1000 ng/mL sono associate con risposte ottimali citogenetiche e molecolari. I dosaggi di imatinib relativi al protocollo GIMEMA 0408 confermano che ad un anno di trattamento con somministrazioni a rotazione di imatinib e nilotinib la concentrazione media di imatinib è di 1180 ng/mL. Questo dato è molto confortante in quanto dà forza alla prospettiva ottimale dell’impiego di nilotinib che è quella di utilizzare questo farmaco di nuova generazione non quando l’imatinib ha fallito, ma di utilizzarlo prima, in modo da evitare fallimenti della terapia con I’imatinib e ottenere risultati a lungo termine migliori rispetto all’impiego dell’uno o dell’altro farmaco da soli.
8

SUMMARY
METABOLOMICS AND MASS SPECTROMETRY
The research project take place in the branch of metabolomics, which involves the systematic study of the metabolites present in a cell and in this area MS, thanks to its potential to carry out controlled experiments of fragmentation, plays a role as a key methodology for identification of various metabolites.The work of thesis project is focused on the analytical methods development for the diagnosis of metabolic diseases and is divided as follows:
Newborn screening of inborn error of metabolism;
Therapeutic drug monitoring in CML patients.
NEWBORN SCREENING OF INBORN ERROR OF METABOLISM
Newborn screening is the process by which infants are screened shortly after birth for a list of disorders that are treatable, but difficult or impossible to detect clinically.The history of neonatal screening of inherited metabolic disease has seen a continuous and positive change limits screening to duplicate the examinative confirmation, through the introduction of new analytical technologies, such as tandem mass spectrometry (MS/MS), which allow testing not only qualitative but also quantitative. It has allowed to move from single test to multiple screening tests for other diseases such as metabolic aminoacidopathies a lower incidence, organic acidurias and defects of fatty acid oxidation.Disorders detected by most MS/MS newborn screening programs can be divided in three major categories:
Amino acid disorders including urea cycle defects
Organic acid disorders
Fatty acid oxidation defects
Fatty acid oxidation disorders are a group of inherited metabolic conditions that lead to an accumulation of fatty acids, and a decrease in cell energy metabolism. Each fatty acid oxidation disorder is associated with a specific enzyme defect in the fatty acid metabolic pathway and affects utilization of dietary and stored fat. Newborn screening includes testing for a panel of acylcarnitines. In some cases, an elevated level of a particular acylcarnitine may indicate the possibility of one of several different fatty acid oxidation disorders; the specific disorder cannot be determined without diagnostic further testing. It has been demonstrated that the following fatty acid oxidation disorders may be detected in newborn dried blood spot samples using a testing panel.Fatty acids with carbon chain lengths of primarily 18 carbons or less are metabolized in the mitochondria by a process known as β-oxidation. Several disorders in mitochondrial β-oxidation have been characterized and include very long-chain acyl-CoA dehydrogenase (VLCAD) deficiency, medium-chain acyl-CoA dehydrogenase (MCADD) deficiency, short-chain acyl-CoA dehydrogenase (SCAD) deficiency, multiple acyl-CoA dehydrogenase deficiency (MADD) etc. A pilot expanded newborn screening programme to detect inherited metabolic disorders, by means of liquid chromatography coupled with tandem mass spectrometry (LC-MS/MS), began in the Campania region, southern Italy, in 2007. By October 2011, >23.753 dried blood samples on filter paper from 14 hospitals in the region had been screened in our laboratory. Within this programme, we detected two cases of Medium Chain acyl CoA
9

Dehydrogenase (MCADD) deficiency, one case of β-ketothiolase Deficiency, one case of Short Branched Chain Amino acid Deficiency, two cases of maternal vitamin B12 deficiency, one case of Propionic aciduria, one case of Isovaleric aciduria, one case of Methymlonic aciduria and one case of Isobutirryl CoA Dehydrogenase Deficiency.In the elaborate, it is reported a clinical case describing the situation of a newborn to whom is diagnosed a Medium-Chain Acyl CoA Dehydrogenase Deficiency at birth. Immediately after the diagnosis, the patient underwent emergency therapy with glucose, after which the carnitine concentration decreased significantly as described in the Figure 9 where is shown the profile of acylcarnitine during therapy.The results of therapy are evident: LC-MS/MS analysis shows that C0 decreases from 0.62 µmol/L to 0.2 µmol/L , the C8 decreases from 6.14 µmol/L to 0.98 µmol/L , the C10 decreases from 0.60 µmol/L to 0,11 µmol/L and C10: 1 decreases from 0.51 µmol/L to 0.25 µmol/L .The biochemical and molecular analysis are extended to family members, and in this way, the early detection allows not only to discover that the relatives of affected child were healthy carriers of the disease, heterozygous for the mutation, but also to discover that her brother, one year and three months old, was affected with the same pathology, thereby allowing to save the baby treating him with proper medical care.
THERAPEUTIC DRUG MONITORING IN CML PATIENTS
The second line of research has focused on the development of analytical methods for qualitative and quantitative assessments of drugs in biological fluids, especially on the assay of imatinib, a drug used to treat patients with chronic myeloid leukemia.Chronic Myeloid Leukemia (CML) is a malignant neoplasia caused by an acquired alteration of the totipotent stem cell of the bone marrow. The genetic abnormality of CML is the translocation between chromosomes 9 and 22, which causes the shaping of a shorter chromosome 22 (Philadelphia chromosome) and creates an hybrid gene, the BCR/ABL gene, which encodes an oncoprotein (Bcr/Abl) with tyrosine-kinase activity deregulated.In 1998, when imatinib was distributed in the marked, a great improvement in the treatment of CML was made.Imatinib is the first of a new category of chemotherapeutic agents that act by inhibiting enzymes with tyrosine-kinase activity rather than inhibiting the rapid cells division; imatinib acts as an allosteric inhibitor: it inhibits the substrate phosphorylation by ATP, blocking the enzymatic protein in a conformation that prevents ATP access to the active site.Imatinib plasma monitoring is important for treatment because patients being treated can acquire resistance to the drug after 4-5 years of treatment; in case of failure of the therapy and occurrence of severe adverse events it is important to intervene promptly by adjusting the dose of imatinib or making other therapeutic choices based on the administration of II generation drugs such as nilotinib and dasatinib.The doctorate was conducted in a laboratory included in the project EUTOS imatinib BLT (Blood Level Testing) as reference center in central and southern Italy and islands to evaluate plasma imatinib concentrations.To evaluate plasma imatinib concentrations, an analytical procedure was developed that uses LC-MS/MS. The spectrometer on which the method has been developed is a triple quadrupole mass spectrometer, it consists of three quadrupoles in series, in which the first and third, Q1 and Q3, work as mass filters while the second acts as a collision cell. The possibility to set individually the quadrupoles on specifics mass range allows a highly selective and specific analysis.We make scans of the first mass analyzer to obtain the maximum sensitivity on the mass/charge ratio of the precursor ions through the optimization of a series of instrumental parameters.
10

Once the precursor ion was optimized in terms of sensitivity and selectivity, we proceed to its fragmentation in the collision cell (Q2), in order to establish its characteristic product ions. The choice of product ions is very important because, under certain conditions, a molecule fragment in the same way and they will be always the same fragments, so the product ions selected at this stage will be those that will characterize the molecule and will allow the identification in very complex matrices.Once optimized the parameters for the characteristics fragmentation, chromatographic conditions are optimized too.Once developed and optimized the method, imatinib plasma concentrations for patients enrolled in the EUTOS project were dosed.Imatinib blood-level testing data are processed through a digital platform, the "Labnet" that acts as a direct connection between hematology centers associated and reference centers for imatinib dose monitoring. A further objective of the project was to evaluate the correlation of two methods for the assay of imatinib plasma concentration: LC-MS/MS e HPLC-UV/VIS. So, were dosed imatinib plasma concentrations of 162 patients classified in five groups according to the daily dose of imatinib: 9 patients with a 200 mg daily dose, 29 with 300 mg, 91 with 400 mg, 24 with 600 mg and 9 with 800 mg dose. The samples were analyzed in triplicate applying both methods: the correlation coefficient between the two methods is calculated using the total set of data for each group of data corresponding to the five groups of patients. The results showed no significant differences between the data obtained applying both methods. The Bland-Altman method is used to compare the data obtained by HPLC-UV and LC-MS/MS. The Bland and Altman plot is a statistical method to compare two measurements techniques in clinical chemistry. The plot represents a graphical method in which the differences (or alternatively the ratios) between the two techniques are plotted against the average of the difference of the two techniques. If the differences between measurements using the two assay methods lie within the limits of agreement of the Bland–Altman test 95% of the time, this indicated that the two methods were not producing different results. Applying the method of differences to the dose results of the 162 samples analyzed by LC-MS/MS HPLC-UV/VIS it was shown that the measurements lie within the limits of agreement and the two methods were, therefore, interchangeable.Over the time, six patients were monitored detecting the plasma imatinib concentration using LC-MS/MS and molecular response (MR) to assess the relationship between the two analysis. This comparison showed that the LC-MS/MS analysis confirmed molecular response data: in case of major molecular response, there was a plasma concentration of imatinib of about 1000 ng/mL (optimal concentration), instead, in absence of good response to therapy, there was an imatinib plasma concentration lower or higher than the optimal one.During the PhD course, experiments have been undertaken for the identification and quantification of metabolites resulting from biotransformation of imatinib, through LC-MS/MS analysis. For this reason, a method was developed for determining simultaneously the imatinib parent drug and some its metabolites that may have relevance if bioactive.The monitoring of new biomarkers could allow the use of imatinib calibrated on individual metabolism, in order to maximize effectiveness and minimize adverse effects. The laboratory, where PhD project was performed, is included in the international protocol GINEMA (Italian Group for Haematological Diseases) CML 0408. The Protocol GINEMA CML 0408 is an experimental study of phase II, for the first-line treatment of CML, BCR-ABL positive, with two tyrosine-kinase inhibitors: imatinib and nilotinib. Nilotinib and imatinib don’t were given together, but according to a schedule rotation, 3 months nilotinib, 3 months imatinib, for 24 months (core study), and for other 36 months (study extension) if the patient was interested to continue.
11

The nilotinib was administered orally twice a day, for a total daily dose of 800 mg. Imatinib was given orally once daily with a dose of 400 mg. The primary objective of this project was to evaluate the correlation between drug response and the plasma level of drugs.
For this purpose, in addition to developing a method for determination of imatinib, it was also developed a LC-MS/MS method for the dosage of nilotinib. To date, 123 patients enrolled in the study, excluding 23 dropouts, all patients have reached 12 months of treatment. After 30 days of treatment with nilotinib, patients had a plasma mean concentration of 2438 ng/Ml; at day 90 they had a mean concentration of 2625 ng/mL. At days 120 and 180, patients had a mean concentration of imatinib, respectively 1265 and 1220 ng/mL. At 270 day, after 3 months of treatment with nilotinib, mean concentration was 2958 ng/mL and at day 360, mean concentration of imatinib was 1180 ng/mL. Optimal concentrations of nilotinib were not reported in the literature, while recent studies showed that imatinib plasma concentrations slightly higher than 1000 ng/mL were associated with cytogenetic and molecular responses optimal. The dosages of imatinib for the GIMEMA 0408 protocol, confirmed that, after a year of treatment with rotating doses of imatinib and nilotinib, imatinib mean concentration was 1180 ng/mL. This information was very encouraging because it has given strength to the best perspective of the nilotinib use: to use this next generation drug not when imatinib has failed, but using it before, in order to avoid treatment failures with imatinib and achieve long-term results better than using a single type of drug.
12

Chapter 1
METABOLOMICS AND MASS SPECTROMETRY
1.1 Metabolomics
Metabolomics is the scientific study of chemical processes involving metabolites. Specifically, metabolomics is the "systematic study of the unique chemical fingerprints that specific cellular processes leave behind", the study of their small-molecule metabolite profiles [1]. The metabolome represents the collection of all metabolites in a biological cell, tissue, organ or organism, which are the end products of cellular processes. Thus, while mRNA gene expression data and proteomic analyses do not tell the whole story of what might be happening in a cell, metabolic profiling can give an instantaneous snapshot of the physiology of that cell. One of the challenges of systems biology and functional genomics is to integrate proteomic, transcriptomic, and metabolomic information to give a more complete picture of living organisms. Therefore, changes observed in the transcriptome or in the proteome do not always correspond to phenotypic alterations (Figure 1). The idea that biological fluids reflect the health of an individual has existed for a long time. The concept that individuals might have a “metabolic profile” that could be reflected in the makeup of their biological fluids was introduced by Roger Williams in the late 1940s [2], who used paper chromatography to suggest characteristic metabolic patterns in urine and saliva were associated with diseases such as schizophrenia. However, it was only through technological advancements in the 1960s and 1970s that it became feasible to quantitatively (as opposed to qualitatively) measure metabolic profiles.
Metabolites are the intermediates and products of metabolism. Within the context of metabolomics, a metabolite is usually defined as any molecule less than 1 kDa in size [3]. In human-based metabolomics, it is common to describe metabolites as being either endogenous (produced by the host organism) or exogenous. Metabolites of foreign substances such as drugs are termed xenometabolites. The metabolome forms a large network of metabolic reactions, where outputs from one enzymatic chemical reaction are inputs to other chemical reactions.
Analysis of cellular function at the molecular level requires recruitment of several different analytical techniques. Whereas comprehensive methods for analysis at the transcriptional level (transcriptome) and at the translational level (proteome) are currently in a rapid state of development, and high throughput analytical methods are already in use [4] [5] [6].
Mass spectrometry is the most frequently employed method of detection in the analysis of the metabolome. The most important advantages of MS are its high sensitivity, selectivity and “high-throughput” in combination with the possibility to confirm the identity of the components present in the complex biological samples as well as the detection and, in most of the cases, the identification of unknown and unexpected compounds. Furthermore, the combination of the separation techniques (e.g., chromatography) with MS tremendously expands the capability of the chemical analysis of highly complex biological samples. Usually, the MS applications are distinguished in three basic groups:
13

small metabolites such as organic acids, amino acids, fatty acids, steroids and their conjugates; peptides, proteins and glycoproteins and oligonucleotides derived from biopolymers (DNA, RNA).
Figure 1. The complex interrelationship between the genome, transcriptome (RNA molecules), proteome (proteins) and metabolome (metabolites that exist in any metabolic and environmental state). Alterations in any of these levels of control might influence the final phenotype.
1.2 Metabolome analysis
For analysis of metabolome, there are basically only two different strategies: target analysis and metabolite profiling. Generally, target analysis is restricted to quantitative analysis of a class of compounds that are related to a specific pathway or to intersecting pathways. Targeted analysis is very useful for the study of the primary effect of a genetic alteration, and the analytical procedures must include identification and absolute quantification of the selected metabolites in the sample. Metabolite profiling or metabolic profiling involves rapid analysis, often not quantitative, of a large number of different metabolites with the objective to identify a specific metabolite profile that characterizes a given sample. This approach can be sub-divided into:
- Metabolic fingerprinting
- Metabolic footprinting
Fingerprinting covers the scanning of a large number of intracellular metabolites detected by a selected analytical technique or by a combination of different techniques in a defined situation [7]. Not all metabolites must be identified and quantified, and “raw” data can be
14

used; i.e., one may use the information content from mass spectrometry (MS) profiles or nuclear magnetic resonance (NMR) spectra directly, but the method must give a reproducible profile of the sample.Metabolic footprinting is more recently proposed approach, which is technically similar to finger printing, but is focused on the measurements of all extracellular metabolites present in a spent culture medium. The compounds determined are metabolites secreted by the cells into the medium and the medium components biochemically transformed by the organism.Mass spectrometry and NMR are the most frequently employed methods of detection in the analysis of the metabolome.NMR in particular, is very useful for structure characterization of unknown compounds and has been applied to the analysis of metabolites in biological fluids and cells extracts [8]. It is also low sensitivity and the equipment costs are much higher compared to MS based techniques. The most important advantages of MS are its high sensitivity, selectivity and high-throughput in combination with the possibility to confirm the identity of the components present in the complex biological samples as well as the detection and, in most of the cases, the identification of unknown and unexpected compounds. Since the ordinary mass spectrometry is quite limited in the analysis of mixtures of compounds, combined methods have been developed, where mass spectrometers are were coupled to efficient separation devices, such as gas chromatography (GC) and high-performance liquid chromatography (HPLC). In the experimental work of this thesis we have used HPLC.
1.3 Mass spectrometry for metabolomics
3.1.1 Instrumentation
Mass Spectrometry (MS) is an analytical technique that measures the mass-to-charge (m/z) ratio of charged particles. MS is an analytic method that employs ionization and mass analysis of compounds in order to determine the mass, formula and structure of the compound being analyzed. The technique has both qualitative and quantitative uses. These include identifying unknown compounds, determining the isotopic composition of elements in a molecule, and determining the structure of a compound by observing its fragmentation. MS is now in very common use in analytical laboratories that study physical, chemical, or biological properties of a great variety of compounds. It is used for determining masses of particles, for determining the elemental composition of a sample or molecule, and for elucidating the chemical structures of molecules, such as peptides and other chemical compounds.All this can be done with very limited amount of sample (in some cases less than a ρg) at very low concentrations in complex mixtures. The mass spectrometry is used to measure the mass of a molecule after it is ionized, that is which has been given an electric charge. In fact, that which is measured is the m/z ratio of ions that are formed; the charge, in fact, being expressed as the number z of elementary charges (those possessed by an electron
15

or a proton), the measure unit is Da/z. A Dalton (Da) is 1/12 the mass of an atom carbon (12C) and is the measure unit currently used to express the mass of molecules (too small entities because they use the grams). The technique consists in the transformation of the sample into ions, in their separation according to their mass ratio of charge (m/z) and in their detection.In Figure 2 we can see the scheme that represents the different parts of a generic mass spectrometer [9].
Figure 2. General components of mass spectrometers.
The sample, which can be a solid, liquid or gas, is introduced in a atmospheric pressure or vacuum chamber, before being ionized. The purpose of the introduction system is to allow the input, in the ion source, an appropriate amount of sample without, thereby, cause significant loss of vacuum. The introduction of the analyte can occur by direct infusion or by connecting the mass spectrometer to a chromatographic system (Gas Cromatoraphy - GC or High Performance Liquid Cromatography - HPLC). Several different types of ion sources are commonly used for LC/MS; each is suitable for different classes of compounds. Independently of the introduction system and ionization techniques used, the sample may already exist in ionic form in solution, or it can be ionized simultaneously to its volatilization.These ions, which are found in the gas phase, are separated in the analyzer according to their mass/charge ratio, and then collected by a detector. In the detector, they generate an electrical signal proportional to the number of present ions. The data processing system records these electrical signals according to their m/z ratio and converts them into a mass spectrum.In synthesis, the processes that take place in a mass spectrometer are:
production and fragmentation of ions;
separation of ions according to mass/charge ratio;
16

detection of ions.
A mass spectrometer is an instrument that work under high vacuum conditions (10 -7 Torr) in all components of the instrument, except in the detector and the viewer the signal.The appearance of the mass spectrum for a given species is strictly related to the method used for the formation of ions.Techniques for ionization have been key to determining what types of samples can be analyzed by mass spectrometry. The types of ion sources may be divided into two main categories:
Source in gas phase
- Electron Ionization (EI)
- Chemical Ionization (CI)
- Atmospheric Pressure Chemical Ionization (APCI)
in which the sample is first evaporated and the gaseous components are then ionized in various ways.
Desorption ionization techniques
- Fast Atom Bombardment (FAB)
- Thermospray
- Matrix Assisted Laser Desorption Ionization (MALDI)
- Electrospray Ionization (ESI)
which do not require total vaporization of the sample. The main advantage of the ionization desorption is the fact that it allows the analysis of non-volatile molecules and low thermal stability.
1.1.1 Electron Ionization
In many studies, "EI" is used as an abbreviation of "electron impact". Actually this attribution is not exactly correct, because the electrons, without mass, not "impact" with the molecules or atoms, but "interact" with them [10].In fact, when an electron passes through to a molecule, is established a mechanism of energy transfer to obtain the extraction of one or more electrons form the outer valence levels, more rarely, by a process one hundred times less efficient. It is possible that the electron is captured by the molecule thus creating a negative ion. The curves representing the ionization efficiency of a beam electronic energy function change from molecule to molecule. If the energy transferred to the molecules is greater than necessary for its ionization, the phenomenon of fragmentation can occur, so ion splits into one or more parties creating new ions, the so-called product ions, or neutral particles.
17

This technique of ionization is called hard because the high energy provided to precursor ions cause its fragmentation and thus the "destruction", leading to very complicate mass spectra.Since, in reproducible conditions, the process of fragmentation of an ion is always the same, the profile of the mass spectrum turns out to be a reliable "fingerprint digital" for the recognition of the compound.The electron impact ionization is generally obtained through the interaction between the sample, gaseous or vaporized, and a flow of electrons emitted from a filament tungsten or rhenium, which is rendered incandescent by the passage of a current. The impact of electrons with molecules of the analyte produces a mixture of positive ions begin to be accelerated toward the separation chamber by an electric field appropriately calibrated [11].Primary products are, therefore, positive ions with a unit charge, and the proximity of high-energy electrons to molecules is such as to cause the loss of electrons per repulsion electrostatic:
M + e - → M · + + 2e -
where, M represents the molecule of the analyte, while M • + is its molecular ion, which is a radical ion, with the same molecular weight of the molecule.
1.1.2 Chemical Ionization
Chemical ionization (CI) is a lower energy process than electron ionization. The lower energy yields less fragmentation, and usually a simpler spectrum. A typical CI spectra has an easily identifiable molecular ion. In a CI experiment, ions are produced through the collision of the analyte with ions of a reagent gas that are present in the ion source. Some common reagent gases include: methane, ammonia, and isobutane. Inside the ion source, the reagent gas is present in large excess compared to the analyte. Electrons entering the source will preferentially ionize the reagent gas. The resultant collisions with other reagent gas molecules will create an ionization plasma (in physics and chemistry, plasma is a state of matter similar to gas in which a certain portion of the particles are ionized. Heating a gas may ionize its molecules or atoms, thus turning it into a plasma, which contains charged particles: positive ions and negative electrons). Positive and negative ions of the analyte are formed by reactions with this plasma.
1.1.3 Electrospray Ionization
Electrospray ionization (ESI) is an ionization technique for small amounts of large and/or labile molecules such as peptides, proteins, organometallics, and polymers. The ESI source operates at atmospheric pressure. A sample solution is sprayed from a small tube into a strong electric field in the presence of a flow of warm nitrogen to assist desolvation. The typical solvents for electrospray ionization are prepared by mixing water with volatile organic compounds (e.g. methanol, acetonitrile).The droplets formed evaporate in a region maintained at a vacuum of several Torr causing the charge to increase on the droplets. To decrease the initial droplet size, compounds that increase the conductivity (e.g. acetic
18
acid) are
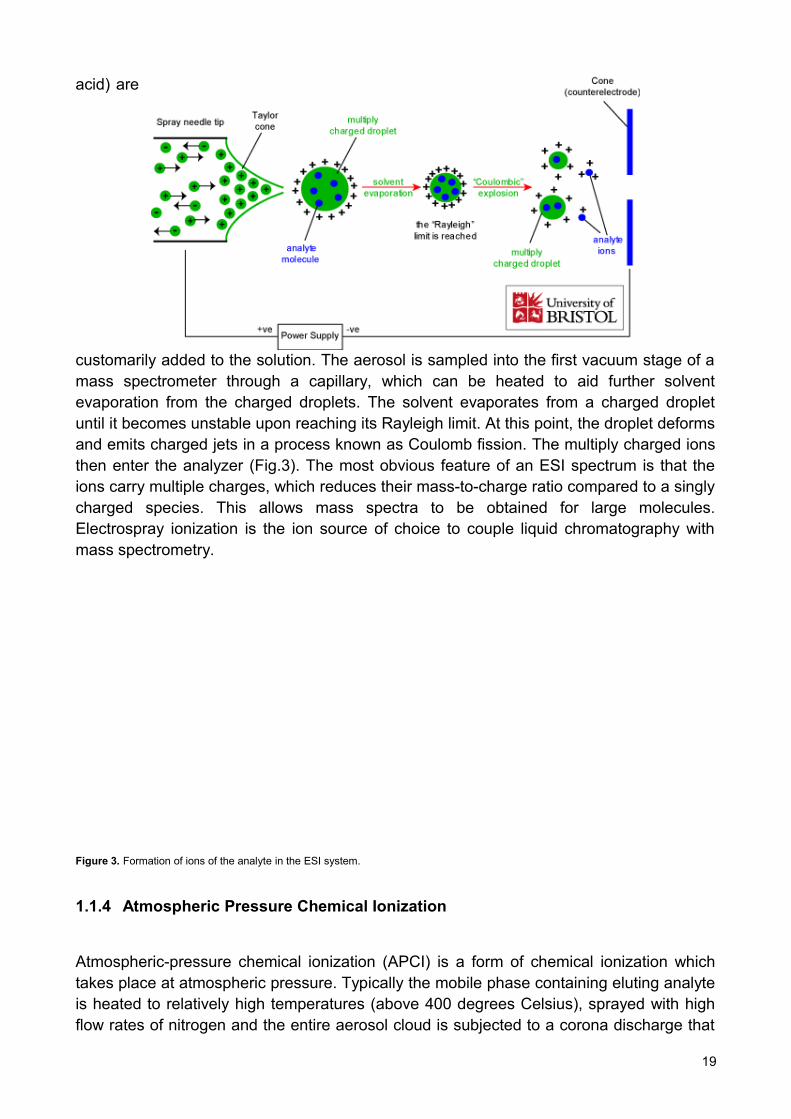
customarily added to the solution. The aerosol is sampled into the first vacuum stage of a mass spectrometer through a capillary, which can be heated to aid further solvent evaporation from the charged droplets. The solvent evaporates from a charged droplet until it becomes unstable upon reaching its Rayleigh limit. At this point, the droplet deforms and emits charged jets in a process known as Coulomb fission. The multiply charged ions then enter the analyzer (Fig.3). The most obvious feature of an ESI spectrum is that the ions carry multiple charges, which reduces their mass-to-charge ratio compared to a singly charged species. This allows mass spectra to be obtained for large molecules. Electrospray ionization is the ion source of choice to couple liquid chromatography with mass spectrometry.
Figure 3. Formation of ions of the analyte in the ESI system.
1.1.4 Atmospheric Pressure Chemical Ionization
Atmospheric-pressure chemical ionization (APCI) is a form of chemical ionization which takes place at atmospheric pressure. Typically the mobile phase containing eluting analyte is heated to relatively high temperatures (above 400 degrees Celsius), sprayed with high flow rates of nitrogen and the entire aerosol cloud is subjected to a corona discharge that
19
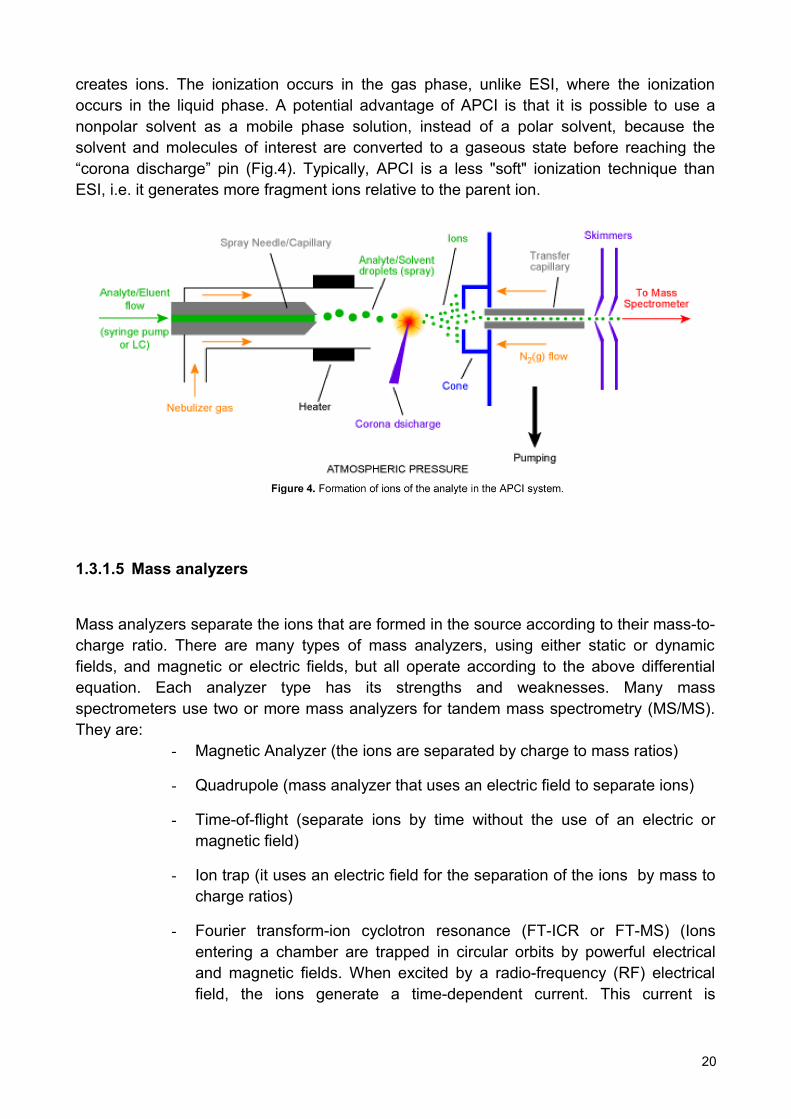
creates ions. The ionization occurs in the gas phase, unlike ESI, where the ionization occurs in the liquid phase. A potential advantage of APCI is that it is possible to use a nonpolar solvent as a mobile phase solution, instead of a polar solvent, because the solvent and molecules of interest are converted to a gaseous state before reaching the “corona discharge” pin (Fig.4). Typically, APCI is a less "soft" ionization technique than ESI, i.e. it generates more fragment ions relative to the parent ion.
1.3.1.5 Mass analyzers
Mass analyzers separate the ions that are formed in the source according to their mass-to-charge ratio. There are many types of mass analyzers, using either static or dynamic fields, and magnetic or electric fields, but all operate according to the above differential equation. Each analyzer type has its strengths and weaknesses. Many mass spectrometers use two or more mass analyzers for tandem mass spectrometry (MS/MS). They are:
- Magnetic Analyzer (the ions are separated by charge to mass ratios)
- Quadrupole (mass analyzer that uses an electric field to separate ions)
- Time-of-flight (separate ions by time without the use of an electric or magnetic field)
- Ion trap (it uses an electric field for the separation of the ions by mass to charge ratios)
- Fourier transform-ion cyclotron resonance (FT-ICR or FT-MS) (Ions entering a chamber are trapped in circular orbits by powerful electrical and magnetic fields. When excited by a radio-frequency (RF) electrical field, the ions generate a time-dependent current. This current is
20

converted by Fourier transform into orbital frequencies of the ions which correspond to their mass-to-charge ratios).
1.3.1.5.1 Magnetic analyzer
A sector field mass analyzer uses an electric and/or magnetic field to affect the path and/or velocity of the charged particles in some way. As shown above, sector instruments bend the trajectories of the ions as they pass through the mass analyzer, according to their mass-to-charge ratios, deflecting the more charged and faster-moving, lighter ions more. The analyzer can be used to select a narrow range of m/z or to scan through a range of m/z to catalog the ions present [12].
1.1.5.2 Quadrupole mass analyzer
The quadrupole consists of four parallel metal rods. Each opposing rod pair is connected together electrically, and a radio frequency (RF) voltage is applied between one pair of rods and the other. A direct current voltage is then superimposed on the RF voltage. Ions travel down the quadrupole between the rods. Only ions of a certain mass-to-charge ratio m/z will reach the detector for a given ratio of voltages: other ions have unstable trajectories and will collide with the rods. This permits selection of an ion with a particular m/z or allows the operator to scan for a range of m/z-values by continuously varying the applied voltage.
1.3.1.5.3 Time-of-flight analyzer
The time-of-flight (TOF) analyzer uses an electric field to accelerate the ions through the same potential, and then measures the time they take to reach the detector. If the particles all have the same charge, the kinetic energies will be identical, and their velocities will depend only on their masses. Lighter ions will reach the detector first.
1.3.1.5.4 Ion trap
The quadrupole ion trap works on the same physical principles as the quadrupole mass analyzer, but the ions are trapped and sequentially ejected. Ions are trapped in a mainly quadrupole RF field, in a space defined by a ring electrode (usually connected to the main RF potential) between two endcap electrodes (typically connected to DC or auxiliary AC potentials). The sample is ionized either internally (e.g. with an electron or laser beam), or externally, in which case the ions are often introduced through an aperture in an endcap electrode.There are many mass/charge separation and isolation methods but the most commonly used is the mass instability mode in which the RF potential is ramped so that the orbit of
21

ions with a mass a > b are stable while ions with mass b become unstable and are ejected on the z-axis onto a detector. There are also non-destructive analysis methods.
1.1.5.5 Fourier transform-ion cyclotron resonance
Fourier transform ion cyclotron resonance mass spectrometry, also known as Fourier transform mass spectrometry, is a type of mass analyzer for determining the m/z ratio of ions based on the cyclotron frequency of the ions in a fixed magnetic field. The ions are trapped in a Penning trap (a magnetic field with electric trapping plates) where they are excited to a larger cyclotron radius by an oscillating electric field perpendicular to the magnetic field. The excitation also results in the ions moving in phase (in a packet). The signal is detected as an image current on a pair of plates which the packet of ions passes close to as they cyclotron. The resulting signal is called a free induction decay (FID), transient or interferogram that consists of a superposition of sine waves. The useful signal is extracted from this data by performing a Fourier transform to give a mass spectrum.Fourier transform ion cyclotron resonance (FTICR) mass spectrometry is a very high resolution technique in that masses can be determined with very high accuracy.
1.1.6 Detectors
The final element of the mass spectrometer is the detector. The detector records either the charge induced or the current produced when an ion passes by or hits a surface. In a scanning instrument, the signal produced in the detector during the course of the scan versus where the instrument is in the scan (at what m/z) will produce a mass spectrum, a record of ions as a function of m/z.Typically, some type of electron multiplier is used, though other detectors including Faraday cups and ion-to-photon detectors are also used. Because the number of ions leaving the mass analyzer at a particular instant is typically quite small, considerable amplification is often necessary to get a signal. In fact, a photomultiplier electronic records the weak current produced by ions that have passed the analyzer, amplifies it and converts it into a signal which is then transmitted to a computer equipped with software that will give us the final mass spectrum.
1.1.7 Mass spectrum
A mass spectrum is an intensity m/z (mass-to-charge ratio) plot representing a chemical analysis. Hence, the mass spectrum of a sample is a pattern representing the distribution of ions by mass (more correctly: mass-to-charge ratio) in a sample. It is a histogram usually acquired using a mass spectrometer. Not all mass spectra of a given substance are the same. For example some MS break the analyte molecules into fragments; others observe the intact molecular masses with little fragmentation. A mass spectrum can represent many different types of information based on the type of mass spectrometer and the specific experiment applied; however, all plots of intensity versus mass-to-charge are referred to as mass spectra.
22

The x-axis of a mass spectrum represents a relationship between the mass of a given ion and the number of elementary charges that it carries.The y-axis of a mass spectrum represents signal intensity of the ions. When using counting detectors the intensity is often measured in counts per second (cps). When using analog detection electronics the intensity is typically measured in volts.
2.3.2 Chromatographic techniques and interfacing
MS is employed in combination with prefractionation methods such as gas chromatography (GC), liquid chromatography (LC) and capillary electrophoresis (CE) to reduce the complexity of target samples before MS analysis. GC coupled to MS has been extensively used in metabolome analysis because of its high separation efficiency that can resolve very complex biological mixtures. Only volatile compounds like ketones and alcohols can be examined directly by GC-MS. Analysis of semi-volatile compounds such as amino acids and lipids require additional chemical derivation process; this step adds time to the analysis as well as causes more complex sample-handling and an increased variance in the analysis. Furthermore, heat-labile compounds can’t be analyzed and identification of unknown derivatized compounds can be difficult because they are chemically modified [7] [13]. By combining MS with LC, molecular identification and quantification of polar, less-polar and neutral metabolites can be achieved, even when they are present at relatively low concentrations levels and in a complex matrix.
LC-MS can provide information on analytes that display chemical diversities, are labile or are difficult to separate at the preparative scale. By using LC-MS, known and unknown compounds that are present in a biological matrix can be detected and identified without any prior knowledge of their exact chemical structure. LC-MS is therefore an important tool for metabolite profiling. CE is a powerful technique for the separation of charged metabolites, offering high-analyte resolution. The combination whit mass spectrometry makes CE-MS an ideal tool for the analysis of the metabolome [7][13][14].
1.3.3 Tandem MS
Tandem mass spectrometry (MS/MS) was developed over 20 years ago [15] and was first applied to biochemical genetics soon afterwards.The technique is most commonly performed using a triple quadrupole mass spectrometer which comprises an ionization source, three mass filters connected in tandem and a photomultiplier detector (Fig.5).
23

Figure 5. Tandem MS scheme.
Ions produced in the source are selected by the first quadrupole (MS1) for the transmission to the second quadrupole, which is designed as the collision cell. In this region, the ions are accelerated and collide with molecules of an inert collision gas (usually argon) and undergo collision-induced dissociation (CID). The fragments produced are transmitted to the final quadrupole (MS2) where they are again selected for transmission to the detector. Ions transmitted by MS1 to the collision cell are called precursor ions (formerly referred to as “parent” ions), and the fragments produced from CID are product ions (formerly “daughter” ions) [16].Multiple stages of mass analysis separation can be accomplished with individual mass spectrometer elements separated in space or using a single mass spectrometer with the MS steps separated in time.In MS-MS in space, the separation elements are physically separated and distinct, although there is a physical connection between the elements to maintain high vacuum. These elements can be sectors, transmission quadrupole, or time-of-flight. By doing tandem mass spectrometry in time, the separation is accomplished with ions trapped in the same place, with multiple separation steps taking place over time.MS/MS can be used for analysis of complex mixtures with little or no sample clean up. It allows rapid analysis time, typically around 2-3 min per sample. The methodology does have limitations, however: it cannot separate isomers and, in complex biological mixtures, the likelihood of encountering more than one compound with the same molecular weight and producing the same fragments is sometimes high.An important application using tandem mass spectrometry is in protein identification. It is more sensitive, specific, reliable, and comprehensive than traditional assays, into their newborn-screening programs. MS/MS is rapidly replacing these one-analysis, one-metabolite, one-disease classis screening techniques with a one-analysis, many-metabolities, many-diseases approach that also facilitates the ability to add new disorders to existing newborn-screening panels.
1.4 Objectives of research project
24

My project will then take place in the branch of metabolomics, which involves the systematic study of the metabolites present in a cell and in this area MS due to its potential to carry out controlled experiments of fragmentation, plays a role as a key methodology for identification of various metabolites.The work of thesis project is focused on the analytical methods development for the diagnosis of metabolic diseases and is divided as follows:
Newborn screening of inborn error of metabolism;
Therapeutic drug monitoring in CML patients.
25

Chapter 2
NEWBORN SCREENING OF INBORN ERROR OF METABOLISM
INTRODUCTION
2.1 NEWBORN SCREENING
Newborn screening is the process by which infants are screened shortly after birth for a list of disorders that are treatable, but difficult or impossible to detect clinically. Screening programs are often run by state or national governing bodies with the goal of screening all infants born in the jurisdiction. Newborn screening originated in the 1960s when Robert Guthrie developed a method to screen for phenylketonuria, a disorder which could be managed by dietary adjustment if diagnosed early [17]. Whole blood samples are collected from the infant's heel on specially designed filter paper, and then tested for a panel of disorders. The disorders tested can vary from region to region, based on funding and the prevalence of a condition in the population. Universal newborn screening (NBS) aims to identify infants that appear healthy at birth, but are afflicted with conditions that can cause severe illness or death. With early detection, these conditions can be managed to prevent complications.The history of neonatal screening of inherited metabolic disease has seen a continuous and positive change limits screening to duplicate the examinative confirmation, through the introduction of new analytical technologies, such as tandem mass spectrometry (MS/MS), which allow testing not only qualitative but also quantitative. It has allowed to move from single test to multiple screening tests for other diseases such as metabolic aminoacidopathies a lower incidence, organic acidurias and defects of fatty acid oxidation.Newborn screening tests are most commonly done from whole blood samples collected on specially designed filter paper. The filter paper is often attached to a form containing required information about the infant and parents. This includes date and time of birth, date and time of sample collection, the infant's weight and gestational age. The form will also have information about whether the baby has had a blood transfusion and any additional nutrition the baby may have received. Most newborn screening cards also include contact information for the infant's physician in cases where follow up screening or treatment is needed (Fig.6).
26

Figure 6. Impregnation of blood from the heel of a newborn into a filter paper card.
Ideally, newborn screening samples are collected from the infant between 24 hours and 7 days after birth. Samples can be collected at the hospital, or at the screening center.Disorders detected by most MS/MS newborn screening programs can be divided in three major categories [18]:
Amino acid disorders including urea cycle defects
Organic acid disorders
Fatty acid oxidation defects
2.1.1 Disorders of amino acid metabolism
Aminoacidopathies involve an inherited deficiency of an enzyme or transport system that mediates the metabolism of a particular amino acid. As a result, the amino acid accumulates and evokes a toxicity syndrome that commonly extends to the CNS (Central Nervous System). The severity of the clinical picture depends on the amino acid involved, the duration of its accumulation and the supervention of other medical complications.Tandem mass spectrometry technology can measure the amount of various amino acids present in the blood spot. The amino acids on the panel were chosen for their ability to indicate the presence of specific disorders. In general, they should be detectable after 24 hours of age despite feeding status and, when disease is present, will continue to increase with time. The presentation of primary disorders of amino acid metabolism in general is insidious and slow, and patients do not commonly have major metabolic decompensations. However, when untreated, the symptoms may present to neurologist as ataxia, mental retardation and seizures. Treatment consist of limiting the offending amino acid in the diet.
1.1.2 Fatty acid and organic acid disorders
Fatty acid oxidation disorders are a group of inherited metabolic conditions that lead to an accumulation of fatty acids, and a decrease in cell energy metabolism. Each fatty acid
27

oxidation disorder is associated with a specific enzyme defect in the fatty acid metabolic pathway and affects utilization of dietary and stored fat. In chemistry, especially biochemistry, a fatty acid is a carboxylic acid with a long unbranched aliphatic tail (chain), which is either saturated or unsaturated. Most naturally occurring fatty acids have a chain of an even number of carbon atoms, from 4 to 28. Fatty acids are usually derived from triglycerides or phospholipids. When they are not attached to other molecules, they are known as "free" fatty acids. Fatty acids are important sources of fuel because, metabolized, they yield large quantities of ATP. Many cell types can use either glucose or fatty acids for this purpose. In particular, heart and skeletal muscle prefer fatty acids. The brain cannot use fatty acids as a source of fuel; it relies on glucose or ketone bodies.Newborn screening includes testing for a panel of acylcarnitines. In some cases, an elevated level of a particular acylcarnitine may indicate the possibility of one of several different fatty acid oxidation disorders; the specific disorder cannot be determined without diagnostic further testing. It has been demonstrated that the following fatty acid oxidation disorders may be detected in newborn dried blood spot samples using a testing panel.Fatty acid oxidation disorders are inherited in an autosomal recessive pattern, which means two copies of a gene must be changed for a person to be affected with a fatty acid oxidation disorder.Fatty acids with carbon chain lengths of primarily 18 carbons or less are metabolized in the mitochondria by a process known as β-oxidation [19]. They are transported through the cellular membrane into the cell cytosol and are translocated across the outer mitochondrial membrane to from fatty acyl-CoA thioesters. Each round of metabolism produces a single molecule of Acetyl-CoA.Intermediates of mitochondrial β-oxidation or peroximal β-oxidation are important clinical diagnostic markers for many disorders of fatty acid and organic acis metabolism.These mitochondrial fatty acids can be found in blood and plasma and detected using methods such as MS/MS.Several disorders in mitochondrial β-oxidation have been characterized and include very long-chain acyl-CoA dehydrogenase (VLCAD) deficiency, medium-chain acyl-CoA dehydrogenase (MCADD) deficiency, short-chain acyl-CoA dehydrogenase (SCAD) deficiency, multiple acyl-CoA dehydrogenase deficiency (MADD) etc. (Fig.7).
28

Figure 7. Fatty Acid Oxidation Pathway.
1.1.3 MCADD
Medium chain acyl CoA dehydrogenase deficiency (MCADD) is an autosomal recessive disorder of beta-oxidation of fatty acids, which occurs in approximately 1 in 20,000 live births. MCADD generally presents clinically between the second month and second year of life, although presentation as early as two days old and as late as 6 years old has been noted (**be aware that asymptomatic and symptomatic adults are now also being diagnosed, some after having their own MCADD children diagnosed or after an episode). MCAD deficiency occurs primarily in Caucasians of northern European background. Parental consanguinity and recurrence in siblings is observed.The enzymatic deficiency is of the medium chain acyl CoA dehydrogenase, one of four mitochondrial acyl-CoA dehydrogenases that carry out the initial dehyrdogenation step in the beta-oxidation cycle. MCAD deficiency impairs oxidation of dietary and endogenous fatty acids of medium chain length (6-12 carbon).Clinical presentation is often triggered by a seemingly innocuous illness (like otitis media). The initiating event is probably due to prolonged fasting, which may lead to vomiting, lethargy, coma, cardiopulmonary arrest, or sudden unexplained death. Symptoms often precede the onset of profound hypoglycemia and are probably related to high free fatty acid levels. Hypoglycemia occurs from an inability to meet gluconeogenic requirements during fasting despite activation of an alternate pathway of substrate production, proteolysis. Physical examination of the acutely ill child is remarkable for mild to moderate hepatomegaly. Some patients may also have demonstrable muscle weakness.
29
Initial laboratory examination of blood may reveal hypoglycemia, mild metabolic acidosis, mild lactic acidosis, hyperammonemia, elevated BUN (Blood Urea Nitrogen), and high uric acid levels. Liver function studies are also usually elevated. Examination of the urine often shows inappropriately low or absent ketones.Biochemical testing of blood and urine for carnitine, acylcarnitines, acylglycines, and organic acids is diagnostic for this disorder. Low serum and urine carnitines are consistently found in the untreated patient. A generalized dicarboxylic aciduria is noted characterized by elevation of suberylglycine and hexanoylglycine. Plasma or blood spot acylcarnitine profiles show elevations of medium chain length fatty acid derived acylcarnitines, especially octanoylcarnitine [20].Without prior indication of metabolic disease, 20-25 percent of patients with this disease will die with their first episode of illness. Analysis of fibroblasts from individuals tested for the activity of medium chain acyl CoA dehydrogenase clearly reveal the affected individuals while heterozygous carriers for the disease usually have intermediate levels of activity, but are otherwise clinically and bio-chemically unaffected. Detection of mutations in the DNA of chromosome 1 in affected individuals allows for confirmation of biochemical testing and accurate detection of asymptomatic carriers in other family members. DNA analysis of postmortem tissue is possible when plasma and urine samples are not available, and has been diagnostic in fixed tissue over 20 years old.Fundamental to the medical management of MCADD is to avoid fasting, particularly during periods of high metabolic stress, such as illness. Overnight fasts should last no longer than twelve hours, and infants should continue to receive nighttime or late evening feedings to reduce this period even further. High carbohydrate intake should be encouraged during illness, with initiation of intravenous glucose supplementation if the child is unsuccessful in keeping down fluids, or unable to take adequate oral feedings. The preventative efficiency of a low fat diet versus a normal fat diet is unclear, but high intake of long and medium chain fatty acids should be avoided.Supplementation with oral L-carnitine at 100 mg/kg/day has been associated with a reduction in the frequency and severity of episodes in many patients. We recommend that the dose be increased to 200 mg/kg/day during acute illness. The continued need for carnitine supplementation post puberty is uncertain, and has not been adequately studied. The addition of 1 - 3 tablespoons of food grade cornstarch mixed in liquid at bedtime to some infants has also helped to decrease the frequency of morning hypoglycemia.It is imperative that, on arrival in an emergency room while lethargic, 10% glucose is started immediately following blood chemistry sampling. The standard of emergency practice with the lethargic child is to use only normal saline. Several deaths have occurred because of this with MCAD deficient patients. The 2-3 hour delay, while waiting for results of chemistries, and receiving only saline deprives the child of the glucose that is critically needed. Several lawsuits are currently pending because of this. It is recommended that parents have written instructions in their wallets to present to emergency personnel to prevent this catastrophe.Prenatal diagnosis is possible through amniocyte culture. In vitro probe of the beta-oxidation pathway or enzyme assay, and DNA analysis for the G985 (gene ACADM) mutation in amniocytes or chorionic villi can also be helpful in the diagnosis of affected and carrier fetuses in pregnancies at risk where both parents carry that mutation. Most families
30

choose to test the infant postnatally during the neonatal periods since prophylactic treatment of MCADD, pending test results, is safe. Prenatal supplementation of the mother of a potentially affected fetus with L-carnitine to improve fetal carnitine stores may be an effective prenatal treatment, ensuring adequate carnitine availability in the newborn period.
31

1.2 MATERIALS AND METHODS
2.2.1 Expanded Newborn Screening programs
A pilot expanded newborn screening programme to detect inherited metabolic disorders by means of liquid chromatography coupled with tandem mass spectrometry (LC-MS/MS) began in the Campania region, southern Italy, in 2007. By October 2011, >23.753 dried blood samples on filter paper from 14 hospitals in the region had been screened in our laboratory. Within this programme, we detected two cases of Medium Chain acyl CoA Dehydrogenase (MCADD) deficiency, one case of β-ketothiolase Deficiency, one case of Short Branched Chain Amino acid Deficiency, two cases of maternal vitamin B12 deficiency, one case of Propionic aciduria, one case of Isovaleric aciduria, one case of Methymlonic aciduria and one case of Isobutirryl CoA Dehydrogenase Deficiency.
2.2.2 Sample preparation
From each dried blood filter card a 3 mm spot, containing 3.3 µL of blood, was punched and transferred into tubes, where 200 µL of methanol containing deuterated aminoacids and acylcarnitines standards was added. The standards were used to quantify aminoacids and acylcarnitine that are extracted into the methanol.The sample were vortexed and shaked for 20 minutes. After that, the solvent was evaporated under a gentle streem of N2. The most common method for extracted metabolite preparation requires esterification that facilitates ionization and improves sensitivity. The derivatization requires addition of 75 µL of acidified butanol for butyl esters formation. After incubation at 65° C for 25 minutes, the excess derivatization agent was removed under a gentle stream of N2. Just prior to MS/MS analysis the specimen was reconstituted in 300 µL of a solvent containing acetonitrile/water/formic acid (70:30:0,05 by volume) that assist in protonation and ionization [21].
2.2.3 Acylcarnitines and amino acids profile
We describe below a clinical case of a newborn to whom is diagnosed a Medium-Chain Acyl CoA Dehydrogenase Deficiency at birth. The comparison between a normal profile of acylcarnitine and a profile referring to a child affected by MCADD highlights the anomalous concentrations of hesanoylcarnitine (C6), octanoylcarnitine (C8), decanoylcarnitine (C10) and decenoylcarnitine (C10:1), respectively observed at m/z ratio of 316, 344,372 and 370 in the patient (Fig. 8-9).
32

31-1-2008
+Prec (85.10): Exp 1, 0.404 to 1.536 min from Sample 1 (Sicignano Martina) of Sicignano Marti... Max. 2.4e4 cps.
200 220 240 260 280 300 320 340 360 380 400 420 440 460 480 500 520 540 560m/z, amu
1000.0
2000.0
3000.0
4000.0
5000.0
6000.0
7000.0
8000.0
9000.0
1.0e4
1.1e4
1.2e4
1.3e4
1.4e4
1.5e4
1.6e4
1.7e4
1.8e4
1.9e4
2.0e4
2.1e4
2.2e4
2.3e4
In
te
ns
ity
, c
ps
260.1
227.1344.2
218.1
263.1
459.3
204.1 311.2291.2 347.2 456.3 482.3274.2 437.2316.2370.2288.2 342.2 508.3243.1208.1 480.3388.2215.1 270.1 538.3400.2 445.2
C8
C10:1C6
+Prec (85.10): Exp 1, 0.404 to 1.941 min from Sample 6 (Senatore Assunta) of 27 novembre 0... Max. 2.8e4 cps.
200 220 240 260 280 300 320 340 360 380 400 420 440 460 480 500 520 540 560m/z, amu
2000.0
4000.0
6000.0
8000.0
1.0e4
1.2e4
1.4e4
1.6e4
1.8e4
2.0e4
2.2e4
2.4e4
2.6e4
2.8e4
In
te
ns
ity
, c
ps
260.1
227.1
218.1
263.1
459.3
274.2311.2 482.3221.1 291.2 347.2277.2 437.2314.2288.2 508.3243.1 480.3209.1 454.2321.2 428.2374.2237.1 400.2 538.3342.2270.1
C6= 0.05-0.25 umol/L
C8= 0.01-0.31 umol/L
C10= 0.01-0.36 umol/L
C10:1= 0.01-0.29 umol/L
MCADD
C6= 0.62 umol/L
C8= 6.14 umol/L
C10= 0.60 umol/L
C10:1= 0.51 umol/L
Figure 8. Comparison between a normal profile of acylcarnitine and a profil relating to a child affected by MCADD.
33

Disorder Abbrev. MARKER
Propionyl CoA Carboxylase Deficiency PA C3Methylmalonic Acidemia MMA C3, C4DC
Isovaleryl CoA Dehydrogenase Deficiency IVA C5Short-branched chain acyl-CoA dehydrogenase
deficiency SBCAD C5
Glutaryl CoA Dehydrogenase Deficiency Type I GA-I C5DCGlutaric Acidemia Type II GA-II C4,C5,C6,C8,C10
3-Methylcrotonyl CoA Carboxylase Deficiency 3MCC C5OHMitochondrial Acetoacetyl CoA Thiolase Deficiency BKT C5:1, C5OH, C4OH
2-Methyl-3-Hydroxybutyryl CoA Dehydrogenase Deficiency MHBD C5:1, C5OH
Medium/Short Chain Hydroxylacyl CoA Dehydrogenase M/SCHAD C4OH, C6OH
Isobutyryl CoA Dehydrogense Deficiency IBD C4Medium Chain Acyl-CoA Dehydrogenase Deficiency MCADD C6,C8,C10,C10:1
Short Chain Acyl-CoA Dehydrogenase Deficiency SCAD C4Very Long Chain Acyl-CoA Dehydrogenase
Deficiency VLCAD C14,C14:1,C14:2,C16:1
Carnitine Palmitoyltransferase Deficiency Type II CPT-II C16,C18:1,C18:2
Figure 9. The table shows the symptomatic markers of some diseases. In red are highlighted the acyl carnitines altered in cases of MCADD.
1.3 RESULTS AND DISCUSSION
34

Immediately after the diagnosis, the patient underwent emergency therapy with glucose, after which the carnitine concentration decreased significantly as described in the figure 10 where is shown the profile of acylcarnitine during therapy.The results of therapy are evident: LC-MS/MS analysis shows that C0 decreases from 0.62 µmol/L to 0.2 µmol/L , the C8 decreases from 6.14 µmol/L to 0.98 µmol/L , the C10 decreases from 0.60 µmol/L to 0,11 µmol/L and C10: 1 decreases from 0.51 µmol/L to 0.25 µmol/L .Subsequently, the newborn is subjected to long-term treatment with carnitine.
31-1-2008
+Prec (85.10): Exp 1, 0.404 to 1.779 min from Sample 2 (Sicignano Martina s'' 041207) of Sicig... Max. 1.4e4 cps.
200 220 240 260 280 300 320 340 360 380 400 420 440 460 480 500 520 540 560m/z, amu
1000.0
2000.0
3000.0
4000.0
5000.0
6000.0
7000.0
8000.0
9000.0
1.0e4
1.1e4
1.2e4
1.3e4
1.4e4
In
te
ns
ity
, c
ps
227.1260.1
263.1
459.3
218.1311.2
291.2347.2
437.2204.1277.2
344.2482.3
456.3316.2
243.1209.1 370.2274.2 298.2 538.3508.3480.3342.2
C6 C10:1C8
S M campione in correzione con glucosio 48 hr
C6= 0.21 umol/L (0.62)
C8= 0.98 umol/L (6.14)
C10= 0.11 umol/L (0.60)
C10:1= 0.25 umol/L (0.51)
+Prec (85.10): Exp 1, 0.404 to 1.941 min from Sample 6 (Senatore Assunta) of 27 novembre 0... Max. 2.8e4 cps.
200 220 240 260 280 300 320 340 360 380 400 420 440 460 480 500 520 540 560m/z, amu
2000.0
4000.0
6000.0
8000.0
1.0e4
1.2e4
1.4e4
1.6e4
1.8e4
2.0e4
2.2e4
2.4e4
2.6e4
2.8e4
In
te
ns
ity
, c
ps
260.1
227.1
218.1
263.1
459.3
274.2311.2 482.3221.1 291.2 347.2277.2 437.2314.2288.2 508.3243.1 480.3209.1 454.2321.2 428.2374.2237.1 400.2 538.3342.2270.1
C6= 0.05-0.25 umol/L
C8= 0.01-0.31 umol/L
C10= 0.01-0.36 umol/L
C10:1= 0.01-0.29 umol/L
Figure 10. Comparison between a normal profile of acylcarnitine and a profil relating to a child affected by MCADD during teraphy with glucose.
35

1.4 CONCLUSIONS
The biochemical and molecular analysis are extended to family members, and in this way, the early detection allows not only to discover that the relatives of affected child were healthy carriers of the disease, heterozygous for the mutation, but also to discover that her brother, one year and three months old, was affected with the same pathology, thereby allowing to save the baby treating him with proper medical care.This result was obtained thanks to MS/MS technology. It offers a new vision to newborn-screening programs that now have the ability to screen for 30 or more metabolic disorders in a single analysis from one small disk of dried blood in a few minutes. This approach was revealed a reliable method for the early diagnosis of different inborn errors of metabolism: amino acidemias, fatty-acid organic disorders and organic acidurias. Now it is possible to screen rapidly, simultaneously, and inexpensively many very rare disorders. Due to the robustness of tandem MS technology, a number of metabolic disorders with unclear natural history have been added to the screening programs. The large increase in the number of inherited metabolic disorders detectable in the newborn period because of tandem MS screening greatly extends the possibilities of early, generally presymptomatic, diagnosis and treatment to minimize morbidity and mortality for many affected children.
36

Chapter 3
THERAPEUTIC DRUG MONITORING IN CML PATIENTS
INTRODUCTION
3.1 CHRONIC MYELOID LEUKEMIA
3.1.1 Clinical features
The second line of research, concerning the development of analytical methods for qualitative and quantitative assessments of drugs in biological fluids, has focused primarily on the development of analytical methods for the assay of imatinib, a drug used to treat patients with chronic myeloid leukemia.Chronic myelogenous leukemia (CML), also known as chronic myeloid leukemia, is a myeloproliferative disorder characterized by increased proliferation of the granulocytic cell line without the loss of their capacity to differentiate. Consequently, the peripheral blood cell profile shows an increased number of granulocytes and their immature precursors, including occasional blast cells. The median age at presentation is 53 years, but all age groups, including children, are affected. Most patients also have thrombocytosis, which is consistent with the presence of a defect in a pluripotent hematopoietic stem cell. The typical symptoms at presentation are fatigue, anorexia, and weight loss, but about 40 percent of patients are asymptomatic, and in these patients, the diagnosis is based solely on an abnormal blood count. The most common abnormality on physical examination is splenomegaly, which is present in up to half of patients.CML progresses through 3 phases:
- chronic- accelerated- blast
In the chronic phase of disease, mature cells proliferate; in the accelerated phase, additional cytogenetic abnormalities occur; in the blast phase, immature cells rapidly proliferate [22]. Approximately 85% of patients are diagnosed in the chronic phase and then progress to the accelerated and blast phases after 3-5 years.
3.1.2 Molecular pathophisiology
CML was the first malignancy to be linked to a clear genetic abnormality, the chromosomal translocation known as the Philadelphia chromosome. This chromosomal abnormality is so named because it was first discovered and described in 1960 by two scientists from Philadelphia, Pennsylvania, USA: Peter Nowell of the University of Pennsylvania and David Hungerford of Fox Chase Cancer Center.In this translocation, parts of two chromosomes, the 9th and 22nd, switch places. As a result, part of the BCR ("breakpoint cluster region") gene from chromosome 22 is fused with the ABL (Ableson leukemia virus) gene on chromosome 9. This abnormal "fusion" gene generates a protein of 210 kDa or sometimes 185 kDa (Fig. 11).
37

Recently, a larger, 230kDa BCR–ABL fusion protein was found in a subgroup of patients with CML who presented with a lower white-cell count than is usual for the disease and in whom progression to blast crisis was slow [23]. The fact that fusion proteins of different sizes can be correlated with different outcomes has led to laboratory studies of the biologic activity of the proteins. The results indicate that the 190-kDa BCR–ABL protein has greater activity as a tyrosine kinase and is a more potent oncogene than the 210-kDa protein, suggesting that the magnitude of the tyrosine kinase signal affects the expression of the disease [24] [25].
Figure 11. Structure of BCR-ABL fusion proteins.
Because abl carries a domain that can add phosphate groups to tyrosine residues (a tyrosine kinase), the bcr-abl fusion gene product is also a tyrosine kinase. The fused BCR-ABL protein interacts with the interleukin-3 receptor (also known as CD123 antigen), that is a molecule found on cells which helps transmit the signal of interleukin-3, a soluble cytokine important in the immune system. The BCR-ABL transcript is continuously active and does not require activation by other cellular messaging proteins. In turn, BCR-ABL activates a cascade of proteins that control the cell cycle, speeding up cell division. Moreover, the BCR-ABL protein inhibits DNA repair, causing genomic instability and making the cell more susceptible to developing further genetic abnormalities. The action of the BCR-ABL protein is the pathophysiologic cause of chronic myelogenous leukemia.
3.1.3 Treatment
The goals of treatment are to achieve hematologic, cytogenetic, and molecular remission. Although a variety of medications have been used in CML, including myelosuppressive agents and interferon α, the tyrosine kinase inhibitor Imatinib mesylate is currently the agent of choice because it can induce complete remissions in CML, confirming the central importance of bcr-abl as the cause of CML.Other drugs in this category are playing increasingly important roles. However, allogeneic bone marrow transplantation is currently the only proven cure for CML.
38

3.1.3.1 Imatinib mesylate
Imatinib (designated chemically as 4-[(4-methyl-1-piperazinyl)methyl]-N-[4-methyl-3-[[4-(3-pyridinyl)-2-pyrimidinyl]amino]-phenyl]benzamide methanesulfonate) is a drug used to treat certain types of cancer. It is currently marketed by Novartis as Gleevec (USA) or Glivec (Europe/Australia/Latin America) as its mesylate salt, Imatinib mesylate (INN). It is used in treating chronic myeloid leukemia, in treating gastrointestinal stromal tumors (GISTs) and some other diseases. Imatinib is the first member of a new class of agents that act by specifically inhibiting a certain enzyme that is characteristic of a particular cancer cell, rather than non-specifically inhibiting and killing all rapidly dividing cells, and served as a model for other targeted therapy modalities through tyrosine kinase inhibition.It is a competitive inhibitor of the Bcr-Abl tyrosine kinase, a constitutively active oncoprotein involved in CML pathogenesis [26]. In CML, the tyrosine kinase enzyme ABL is locked in its activated form. It induces the abnormal phenotypes of CML: excessive proliferation and high white blood cell count. Imatinib binds to the site of tyrosine kinase activity, and prevents its activity.Imatinib was developed by rational drug design. After the Philadelphia chromosome mutation and hyperactive bcr-abl protein were discovered, the investigators screened chemical libraries to find a drug that would inhibit that protein. With high-throughput screening, they identified 2-phenylaminopyrimidine. This lead compound was then tested and modified by the introduction of methyl and benzamide groups to give it enhanced binding properties, resulting in Imatinib. Gleevec received FDA approval in May 2001.Gleevec also holds the record for the drug with the fastest approval time by the FDA. According to Brian Druker, one of the developers of Imatinib, the biggest obstacle to being approved was the name of the drug. At that time, the drug was being called "Glivec", which is also the current spelling in most parts of the world. However, the United States Food and Drug Administration did not want people to mispronounce "Glivec" as "GLIE-VEC" which could be confused with a diabetic drug at the time. Therefore, Novartis, the pharmaceutical company who markets Gleevec, changed the name of "Glivec" to include two "e's" and avoid the phonetic confusion: Gleevec. Shortly thereafter, Gleevec was approved by the FDA.The most common side effects include weight gain, reduced number of blood cells (neutropenia, thrombocytopenia, anemia), headache, edema, nausea, rash, and musculoskeletal pain.Severe congestive cardiac failure is an uncommon but recognized side effect of Imatinib and mice treated with large doses of Imatinib show toxic damage to their myocardium [27].If Imatinib is used in prepubescent children, it can delay normal growth, although a proportion will experience catch-up growth during puberty [28].Imatinib is rapidly absorbed when given by mouth, and is highly bioavailable: 98% of an oral dose reaches the bloodstream. Metabolism of Imatinib occurs in the liver and is mediated by several isozymes of the cytochrome P450 system. The major route of elimination is in the bile and feces; only a small portion of the drug is excreted in the urine.
39

Most of Imatinib is eliminated as metabolites, only 25% is eliminated unchanged. The half-lives of Imatinib and its main metabolite are 18 and 40 hours, respectively. It blocks the activity of Abelson cytoplasmic tyrosine kinase (ABL), c-Kit and the platelet-derived growth factor receptor (PDGFR). As an inhibitor of PDGFR, Imatinib appears to have utility in the treatment of a variety of dermatological diseases.Mechanism of action of Imatinib is to function as a specific inhibitor of a number of tyrosine kinase enzymes. It occupies the TK active site, leading to a decrease in activity.There are a large number of TK enzymes in the body, including the insulin receptor. Imatinib is specific for the TK domain in abl (the Abelson proto-oncogene), c-kit and PDGF-R (platelet-derived growth factor receptor).In CML, the Philadelphia chromosome leads to a fusion protein of abl with bcr (breakpoint cluster region), termed bcr-abl. As this is now a constitutively active tyrosine kinase, Imatinib is used to decrease bcr-abl activity.The active sites of tyrosine kinases each have a binding site for ATP. The enzymatic activity catalyzed by a tyrosine kinase is the transfer of the terminal phosphate from ATP to tyrosine residues on its substrates, a process known as protein tyrosine phosphorylation. Imatinib works by binding close to the ATP binding site of bcr-abl, locking it in a closed or self-inhibited conformation, and therefore inhibiting the enzyme activity of the protein semi-competitively [29]. This fact explains why many BCR-ABL mutations can cause resistance to Imatinib by shifting its equilibrium toward the open or active conformation [30].Imatinib is quite selective for bcr-abl. It does also inhibit other targets as c-kit and PDGF-R, but no other known tyrosine kinases. Imatinib also inhibits the abl protein of non-cancer cells but cells normally have additional redundant tyrosine kinases which allow them to continue to function even if abl tyrosine kinase is inhibited. Some tumor cells, however, have a dependence on bcr-abl. Inhibition of the bcr-abl tyrosine kinase also stimulates its entry in to the nucleus, where it is unable to perform any of its normal anti-apoptopic functions [31]. Imatinib plasma monitoring is important for treatment because patients being treated can acquire resistance to the drug after 4-5 years of treatment; in case of failure of the therapy and occurrence of severe adverse events it is important to intervene promptly by adjusting the dose of imatinib or making other therapeutic choices based on the administration of II generation drugs such as nilotinib and dasatinib.
3.1.3.2 Nilotinib
Nilotinib (designated chemically as 4-methyl-N-[3-(4-methyl-1H-imidazol-1-yl)-5-(trifluoromethyl)phenyl]-3-[(4-pyridin-3-ylpyrimidin-2-yl)amino]benzamide) is a selective Bcr/Abl tyrosine kinase inhibitor. This type of medicine is used in treatment of leukemia (specifically CML). Nilotinib is considered a "second-generation" Bcr/Abl tyrosine kinase inhibitor, building on the success of Imatinib. Because many patients develop resistance to Imatinib, there is excitement about Nilotinib. A recent research report concluded it has "great potential" for leukemia treatment. The "binding mode" of Nilotinib is energetically more favorable than that of Imatinib. This results in a more selective targeting of the malignancy. Nilotinib has been shown to have an approximately 20-fold increased potency in kinase and proliferation assays compared to Imatinib. This is especially important for
40

older patients and they tend to have trouble tolerating Imatinib treatment. The higher dosages required for Imatinib make it tough; Nilotinib is hoped to alleviate the side effects but still be effective [32].
3.2 MATERIALS AND METHODS
3.2.1 Materials
Imatinib mesylate, the internal standard for LC-MSMS (imatinib-D8) and the internal standard for HPLC-UV methods (nilotinib) were kindly given by Novartis Pharma AG (Basel, Switzerland); HPLC grade acetonitrile and methanol were purchased from JT Baker (Mallinckrodt Baker B.V., Deventer, Netherlands) or VWR International (Milan, Italy). Formic acid was purchased from JT Baker (Mallinckrodt Baker B.V., Deventer, Netherlands); triethylamine was purchased from VWR International (Milan, Italy). Ammonium formate 10 M solution was purchased from Sigma-Aldrich (Milan, Italy); all solutions were prepared using highly purified water produced by a Millipore Milli-RO/Milli-Q system (Millipore, Bedford, Ma, USA) or by a Milli-DI system coupled with a Synergy 185 system (Millipore, Bedford, Ma, USA) and used without any further purification.
3.2.2 Patients
Chronic phase myeloid leukemia patients included in this study were treated daily with 200, 300, 400, 600 and 800 mg dose of imatinib for a minimum of 3 month. Plasma from the 162 patients and healthy donors was received by Azienda Ospedaliero-Universitaria “San Luigi Gonzaga” (Orbassano, Italy) or by Azienda Ospedaliera Universitaria “Federico II” (Naples, Italy) and CEINGE Biotecnologie Avanzate, s.c.a r.l. (Naples, Italy).Plasma samples were divided in two aliquots: one aliquot was analyzed by HPLC-UV in Orbassano and the other one was analyzed by LC-MSMS in Naples. Samples were stored at -20°C until analysis. Analyses were performed within two months from their arrival in laboratory.
3.2.3 Calibrators and quality controls preparation
LC-MS/MS stock solution of imatinib was prepared at a final concentration of 1 mg/mL in methanol and stored at -20°C. The stability of stored imatinib solution was measured in triplicates during two months period. No significant differences were noted. Stock solution was then added to 200 μL of human plasma from healthy donor (calibrators) to produce final concentration of 78, 157, 313, 625, 1250, 2500, 5000 ng/mL. 100 μL of a 500 ng/mL solution of internal standard (imatinib-D8) in methanol were added to 200 μL of each calibrator and to 200 μL of patient plasma. To measure inter and intra assay variability, we used quality controls (QC) prepared as previously described calibrators at an imatinib concentration of 50, 500 and 5000ng/mL.
41

Proteins were precipitated by adding 500 μL of acetonitrile to each tube. The samples were then vortexed for 30 s and centrifuged at 10.000 g for 10 min. The suvranatants were transferred in 1.5mL vials and evaporated under a nitrogen stream at 45° C. Sample were reconstituted in 200 μL of Acetonitrile/Water MilliQ (10:90, v/v), vortexed briefly, diluted 1:20. Finally 5 μL were injected into the LC-MS/MS system. For HPLC-UV method, imatinib was added to healthy donor blank plasma to obtain calibrators with concentrations of 50, 100, 500, 1000, 2500, and 5000 ng/mL. Nilotinib was
used as internal standard (IS). Working solutions of IS were made at 50g/ml in methanol and used immediately. 50μL of IS were added to 500μL of each calibrator and to 500μL of patient plasma. Imatinib was extracted from plasma by protein precipitation: 750μL of acetonitrile/methanol (50:50) were added to each sample. Samples were then vortexed for 30s and then centrifuged at 12,000g for 10 min. 800μL of supernatant were transferred into HPLC vials [33-34]. HPLC and LC-MSMS analyses were performed in duplicate and all procedure steps were carried out at room temperature.
3.2.4 HPLC-UV and LC-MS/MS methods
The HPLC-UV analyses were performed on a VWR-Hitachi system (LaChrom Elite) equipped with autosampler, spectrophotometer, and heated column compartment. 20μL of each described sample were injected. The chromatographic separation was achieved on a HyPurity 150x4.6mm, 3μm C18 reversed-phase narrowbore column (Superchrom, Milan, Italy) preceded by a SecurityGuard Cartridges 4.0x3.0mm C18 guard column (Phenomenex, Castel Maggiore, Italy). The mobile phase was composed by 40% solvent A (Water:Methanol:Triethylamine/72.5:25:2.5, pH 9.3), 20% methanol, 40% acetonitrile. The flow rate was 0.5ml/min at 35°C and the eluate was monitored at 267 nm. Chromatogram processing and data acquisition were performed by using the EzChrom Elite software.The LC-MSMS analysis were performed on an Applied Biosystems MDS Sciex API 4000 Triple–Quadrupole Mass Spectrometer equipped with TurboIonSpray source (Applied Biosystems/Sciex, Toronto, Canada) and coupled with the Agilent 1100 series HPLC instrument (Agilent Technologies, Waldbronn, Germany). 5μL of the each described sample were injected into LC column. Chromatographic separations were performed on an Xterra RP18 column (2.1x100 mm, 5 μm, Waters, Milford, MA, USA) using water/formic acid 0.05% (v/v), ammonium formiate 4mM (A) and acetonitrile/formic acid 0.05% (v/v) (B) as eluent. A gradient was delivered at 300µL/min starting from 1% phase B; it was maintained for 3min at 1% phase B and then raised to 25% in 7 min and to 100% in 2 min; and then an isocratic wash of 100% B was held for 4 min before the column was equilibrated back to the initial condition in 2 min. The total analysis time was 18 min. The source temperature (at set-point) was 550°C with 5300 V applied as the ion spray voltage. All data were acquired in positive-selected reaction monitoring (SRM) to monitor m/z 494.3 > 394.2 transition for imatinib and m/z 502.4 > 394.2 transition for the internal standard (Fig. 12).
42

Figure 12. Correlation between measurements obtained with HPLC-UV (X-axis) and LC-MSMS method (Y-axis) on total set of patient plasma samples (A), on plasma samples from patients treated by 200mg/daily (B), 300mg/daily (C), 400mg/daily (D), 600mg/daily (E) and 800mg/daily (F) of imatinib.
The data were processed using the Analyst 1.4.2 software (Applied Biosystems/Sciex).The linearity of method was determined by performing calibration curves using 7 concentrations as previously described. The calibration curves of both methods were generated using the results of the calibration samples by linear least-squares regression analysis according to the equation y=a+bx, where y was the peak–area ratio of substance to internal standard, x was the
43

concentration of analyte in the calibration sample, a was the intercept, and b was the slope of the regression line. A weighted (1/x2) linear least-squares regression was used. Subsequently, concentrations of the quality control (QC) samples were calculated from the regression equation of the calibration curve.
3.2.5 Bland –Altman plot
The Bland and Altman plot is a statistical method to compare two measurements techniques in clinical chemistry. The plot represents a graphical method in which the differences (or alternatively the ratios) between the two techniques are plotted against the average of the difference of the two techniques. If the differences between measurements using the two assay methods lie within the limits of agreement of the Bland–Altman test 95% of the time, this indicates that the two methods are not producing different results [35].
3.2.6 Real time quantitative PCR
Real time quantitative PCR (RQ-PCR) provides the best monitoring strategy for patients with Chronic Myeloid Leukemia. To assess molecular responses, total RNA was extracted from peripheral blood samples and the amount of BCR-ABL fusion transcript was quantified with respect to BCR transcript via RT-QPCR (Taqman assay) and expressed as a log ratio [36]. The RQ-PCR method used TaqMan probes and the 7700 Sequence Detection System (Applied Biosystems, Foster City, CA). RQ-PCR analysis with hybridization probe uses two juxtaposed sequence-specific probes, one labeled with a donor fluorochrome (eg FAM) at the 3’ end and the other labeled with an acceptor fluorochrome at its 5’ end. Both probes should hybridize to closely juxtaposed target sequences on the amplified DNA fragment, thereby bringing the two fluorochromes into close proximity (i.e. within 1–5 nucleotides). Upon excitation of the donor fluorochrome, light with a longer wavelength will be emitted. When the two fluorochromes are in close proximity, the emitted light of the donor fluorochrome will excite the acceptor fluorochrome. Clinical applicability of MRD (Minimal Residual Disease) detection in hematologic malignancies process referred to as fluorescence resonance energy transfer. This results in the emission of fluorescence, which can be detected during the annealing phase and the first part of the extension phase of the PCR reaction.
44

45
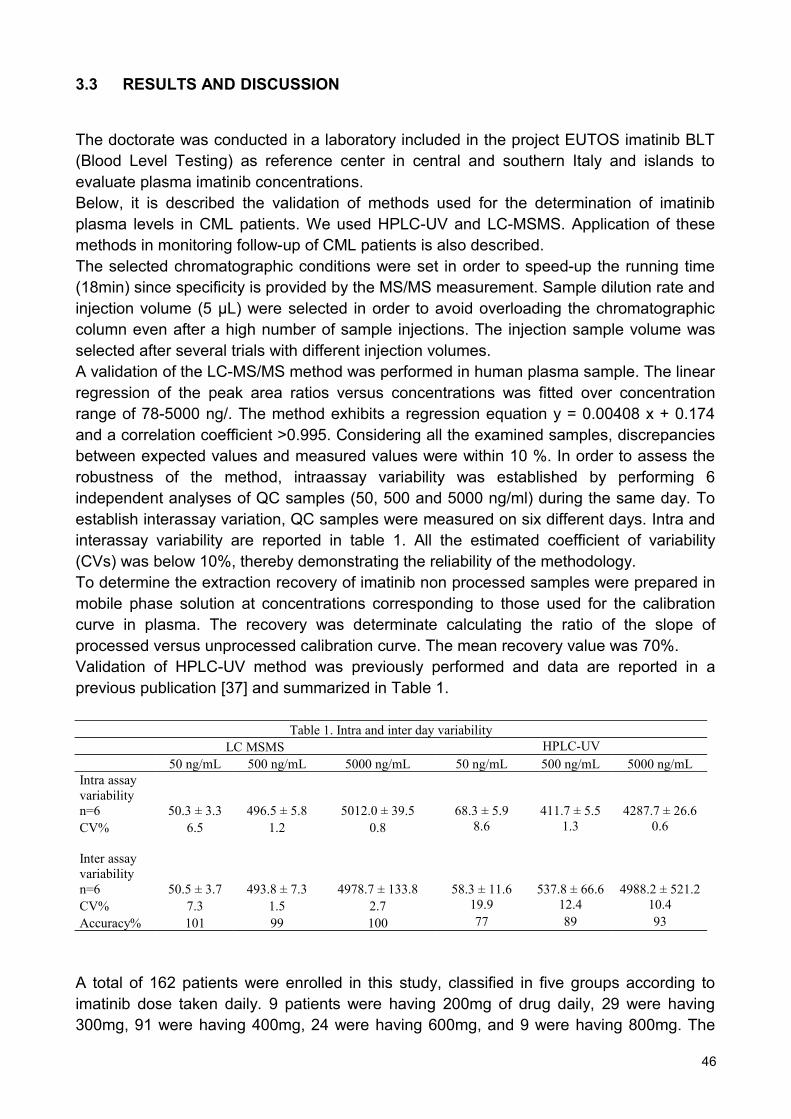
3.3 RESULTS AND DISCUSSION
The doctorate was conducted in a laboratory included in the project EUTOS imatinib BLT (Blood Level Testing) as reference center in central and southern Italy and islands to evaluate plasma imatinib concentrations.Below, it is described the validation of methods used for the determination of imatinib plasma levels in CML patients. We used HPLC-UV and LC-MSMS. Application of these methods in monitoring follow-up of CML patients is also described.The selected chromatographic conditions were set in order to speed-up the running time (18min) since specificity is provided by the MS/MS measurement. Sample dilution rate and injection volume (5 μL) were selected in order to avoid overloading the chromatographic column even after a high number of sample injections. The injection sample volume was selected after several trials with different injection volumes. A validation of the LC-MS/MS method was performed in human plasma sample. The linear regression of the peak area ratios versus concentrations was fitted over concentration range of 78-5000 ng/. The method exhibits a regression equation y = 0.00408 x + 0.174 and a correlation coefficient >0.995. Considering all the examined samples, discrepancies between expected values and measured values were within 10 %. In order to assess the robustness of the method, intraassay variability was established by performing 6 independent analyses of QC samples (50, 500 and 5000 ng/ml) during the same day. To establish interassay variation, QC samples were measured on six different days. Intra and interassay variability are reported in table 1. All the estimated coefficient of variability (CVs) was below 10%, thereby demonstrating the reliability of the methodology. To determine the extraction recovery of imatinib non processed samples were prepared in mobile phase solution at concentrations corresponding to those used for the calibration curve in plasma. The recovery was determinate calculating the ratio of the slope of processed versus unprocessed calibration curve. The mean recovery value was 70%.Validation of HPLC-UV method was previously performed and data are reported in a previous publication [37] and summarized in Table 1.
Table 1. Intra and inter day variabilityLC MSMS HPLC-UV
50 ng/mL 500 ng/mL 5000 ng/mL 50 ng/mL 500 ng/mL 5000 ng/mLIntra assay variability n=6 50.3 ± 3.3 496.5 ± 5.8 5012.0 ± 39.5 68.3 ± 5.9 411.7 ± 5.5 4287.7 ± 26.6CV% 6.5 1.2 0.8 8.6 1.3 0.6
Inter assay variability n=6 50.5 ± 3.7 493.8 ± 7.3 4978.7 ± 133.8 58.3 ± 11.6 537.8 ± 66.6 4988.2 ± 521.2CV% 7.3 1.5 2.7 19.9 12.4 10.4Accuracy% 101 99 100 77 89 93
A total of 162 patients were enrolled in this study, classified in five groups according to imatinib dose taken daily. 9 patients were having 200mg of drug daily, 29 were having 300mg, 91 were having 400mg, 24 were having 600mg, and 9 were having 800mg. The
46

samples were analyzed in triplicates by applying both methods (HPLC-UV and LC-MSMS). The correlation coefficient between the two methods was calculated using the total set of data. In addition the correlation coefficient was calculated for each group of data corresponding to the five groups of patients. The correlation coefficients are showed in Figure 12. Results showed no significant differences between data obtained by both methods. We performed Bland–Altman analysis to compare HPLC-UV with LC-MS/MS data. We plotted the difference between the methods against the averages of values from the two techniques, as showed in Figure 13A. The statistical analysis showed a good agreement with a bias value of 88, in the range mean ±2 SD (-816.2 - 640.3). After logarithmic transformation of data (Fig. 13B), the mean difference detected by the two
Figure 13. Bland–Altman plot of the differences on imatinib measurements obtained with HPLC-UV and LC-MSMS as a function of their mean value (A). Logarithmic transformation of the Bland–Altman plot (B).
47

Plasma of six selected patients was monitored on time detecting the imatinib plasma levels using LC-MSMS methods and the molecular response (MR) to evaluate the correlation between two analyses. Data reported in Table 2 show that the LC-MSMS analysis confirms the results of molecular response: where the major molecular response was achieved the plasma imatinib concentration is around 1000ng/ml (REF); conversely the plasma imatinib concentration is lower or higher than threshold value in absence of response to therapy (patients 2 and 5). MR patients show imatinib concentration medium, median and range respectively 1346, 1275 and 836-1920 ng/mL. Conversely, the no-MMR patients show medium, median and range respectively 1877, 2470 and 430-3150 ng/mL.
During the PhD course, experiments have been undertaken for the identification and quantification of metabolites resulting from biotransformation of imatinib, through LC-MS/MS analysis. Studies with radioactive labeling have showed that imatinib and its main metabolite (N-desmethyl) are together responsible for only 65% of the radioactivity in circle, then the rest of the radioactivity is due to a number of minor metabolites still poorly characterized. For this reason, a method was developed for determining simultaneously the imatinib parent drug and some its metabolites that may have relevance if bioactive. The monitoring of new biomarkers could allow the use of imatinib calibrated on individual metabolism, in order to maximize effectiveness and minimize adverse effects.
48
Table 2. Follow up of selected patients Time MR (X100) LC-MSMS (ng/mL)
PATIENTS 1 0 0.338 2470
5 months 0.094 1360 8 months 0.054 1800
10 months 0.000 PATIENTS 2
0 0.605 839 3 months 0.130 932 6 months 0.040 9 months 0.059
PATIENTS 3 0 0.009 1920
1 months 0.009 1310 4 months 0.013 836
12 months 0.000 PATIENTS 4
0 0.172 3150 2 months 0.077 924 4 months 0.085 1600 8 months 0.085
PATIENTS 5 0 48.000 430
1 months 16.926 2660 2 months 22.816 2660 3 months 14.340
PATIENTS 6 0 0.100 1140
1 months 0.047 1190 5 months 0.124 8 months 0.244

The laboratory where PhD project was performed, is also included in the international protocol GINEMA (Italian Group for Haematological Diseases) CML 0408. The Protocol GINEMA CML 0408 is an experimental study of phase II, for the first-line treatment of CML, BCR-ABL positive, with two tyrosine-kinase inhibitors, imatinib and nilotinib.Nilotinib and imatinib don’t are given together, but according to a schedule rotation, 3 months nilotinib, 3 months imatinib, for 24 months (core study), and for other 36 months (study extension) if the patient is interested to continue.The nilotinib is given orally twice a day, for a total daily dose of 800 mg. Imatinib is given orally once daily with a dose of 400 mg. The primary objective of this project is to evaluate the correlation between drug response and the plasma level of drugs. For this purpose, in addition to developing a method for determination of imatinib, has also developed a LC-MS/MS method for the dosage of nilotinib. To date, 123 patients enrolled in the study, excluding 23 dropouts, all patients have reached 12 months of treatment. After 30 days of treatment with nilotinib, patients have a plasma mean concentration of 2438 ng/mL; at day 90 they have a mean concentration of 2625 ng/mL. At days 120 and 180, patients have a mean concentration of imatinib, respectively 1265 and 1220 ng/mL. At 270 day, after 3 months of treatment with nilotinib, mean concentration is 2958 ng/mL and at day 360, mean concentration of imatinib is 1180 ng/mL. Optimal concentrations of nilotinib are not reported in the literature, while recent studies show that imatinib plasma concentrations slightly higher than 1000 ng/mL are associated with cytogenetic and molecular responses optimal. More than 600 assays were performed.
49

3.4 CONCLUSIONS
A further objective of the project was to evaluate the correlation of two methods for the assay of imatinib plasma concentration: LC-MS/MS e HPLC-UV/VIS. Applying the method of differences to the dose results of the 162 samples analyzed by LC-MS/MS HPLC-UV/VIS it is shown that the measurements lie within the limits of agreement and the two methods are, therefore, interchangeable.Over the time, six patients were monitored detecting the plasma imatinib concentration using LC-MS/MS and molecular response (MR) to assess the relationship between the two analysis. This comparison shows that the LC-MS/MS analysis confirms molecular response data: in case of major molecular response, there is a plasma concentration of imatinib of about 1000 ng/mL (optimal concentration), instead, in absence of good response to therapy, there is an imatinib plasma concentration lower or higher than the optimal one.The dosages of imatinib for the GIMEMA 0408 protocol, confirmed that, after a year of treatment with rotating doses of imatinib and nilotinib, imatinib mean concentration is 1180 ng/mL (Table 3). This information is very encouraging because it gives strength to the best perspective of the nilotinib use: to use this next generation drug not when imatinib has failed, but using it before, in order to avoid treatment failures with imatinib and achieve long-term results better than using a single type of drug.
•AV concentration of NIL at 30 days: 2438 ng/mL range= 755-4121 ng/mL
•AV concentration of NIL at 90 days: 2625 ng/mL range= 820-4430 ng/mL
•AV concentration of IM at 120 days: 1265 ng/mL range= 636-1894 ng/mL
•AV concentration of IM at 180 days: 1220 ng/mL range= 545-1895 ng/mL
•AV concentration of NIL at 270 days: 2958 ng/mL range= 1227-4689 ng/mL
•AV concentration of IM at 360 days: 1180 ng/mL range= 399-1961 ng/mL
Table 3. After a year of treatment with rotating doses of imatinib and nilotinib, imatinib mean concentration is 1180 ng/mL.
50

51

REFERENCES
[1] Daviss, Bennett (2005). Growing pains for metabolomics. The Scientist 19 (8): 25–28.
[2] Gates SC, Sweeley CC (1978). Quantitative metabolic profiling based on gas chromatography. Clin Chem. 24(10):1663-73.
[3] Samuelsson LM, Larsson DG (2008). Contributions from metabolomics to fish research. Mol Biosyst 4 (10): 974–9.
[4] Godovac-Zimmermann J, Brown LR (2001). Perspectives for mass spectrometry and functional proteomics. Mass Spectrom Rev 20(1):1-57.
[5] Hung SP, Baldi P, Hatfield GW (2002).Global gene expression profiling in Escherichia coli K12. The effects of leucine-responsive regulatory protein. J Biol Chem. 277(43):40309-23.
[6] Cristoni S, Bernardi LR (2003). Development of new methodologies for the mass spectrometry study of bioorganic macromolecules. Mass Spectrom 22(6):369-406.
[7] Villas-Bôas SG, Mas S, Akesson M, Smedsgaard J, Nielsen J (2005). Mass spectrometry in metabolome analysis. Mass Spectrom 24(5):613-46.
[8] Shockcor JP, Unger SE, Wilson ID, Foxall PJ, Nicholson JK, Lindon JC (1996). Combined HPLC, NMR spectroscopy, and ion-trap mass spectrometry with application to the detection and characterization of xenobiotic and endogenous metabolites in human urine. Anal Chem. 68(24):4431-5.
[9] D. Skoog, J. Leary (2000). Chimica Analitica Strumentale 603-658.
[10] O.D.Sparkman, Mass Spec Desk Reference, Global View Publishing, 2000.
[11] Robotz (2000). Mass Spectrometry in Cancer Research. CPR Press.
[12] John S Cottrell, Roger J Greathead (1986). Extending the Mass Range of a Sector Mass Spectrometer. Mass Spectrometry Reviews 5 (3): 215–247.
[13] Zhang J, Jin Y, Dong J, Xiao Y, Feng J, Xue X, Zhang X, Liang X. (2009). Systematic screening and characterization of tertiary and quaternary alkaloids from corydalis yanhusuo W.T. Wang using ultra-performance liquid chromatography-quadrupole-time-of-flight mass spectrometry. Talanta. 78(2):513-22.
[14] Di Bartolomeo M. et Al(2006). Feasibility of sequential therapy with FOLFIRI followed by docetaxel/cisplatin in patients with radically resected gastric adenocarcinoma. A randomized phase III trial. Oncology.71(5-6):341-6.
[15] McLafferty FW (1981). Tandem mass spectrometry. Science 214:280-7
[16] Carpenter KH, Wiley V (2002). Application of tandem mass spectrometry to biochemical genetics and newborn screening. Clin Chim Acta. 322(1-2):1-10.
[17] Guthrie R, Susi A. (1963) A simple phenylalanine method for detecting phenylketonuria in large populations of newborn infants. Pediatrics. 32:338-43.
52

[18] Garg U, Dasouki M. (2006). Expanded newborn screening of inherited metabolic disorders by tandem mass spectrometry: clinical and laboratory aspects. Clin Biochem. 39(4):315-32.
[19] Scriver CR. (1995). Disease, war, and biology: languages for medicine--and pediatrics. Pediatr Res. 38(6):819-29.
[20] W.R. Treem, C.A. Stanley And S.I. Goodman Medium chain acyl-CoA dehydrogenase Defincy: Metabolic effects and therapeutic efficacy of long-term L-carnitine Supplementation. Division of Pediatric Gastroenterology and Nutrition, Hartford Hospèital, University of Cunnecticut.
[21] Chace DH. (2001) Mass spectrometry in the clinical laboratory. Chem Rev 101: 445-477.
[22] Charles L. Sawyers (1999) Chronic Myeloid Leukemia, M.D. N Engl J Med 340:1330-1340
[23] Pane F, Frigeri F, Sindona M, et al. (1996) Neutrophilic-chronic myeloid leukemia: a distinct disease with a specific molecular marker. Blood 88: 2410-4.
[24] Lugo TG, Pendergast AM, Muller AJ, Witte ON. (1990) Tyrosine kinase activity and transformation potency of bcr-abl oncogene products. Science 247:1079-82.
[25] Voncken JW, Kaartinen V, Pattengale PK, Germeraad WT, Groffen J, Heisterkamp N. (1995) BCR/ABL P210 and P190 cause distinct leukemia in transgenic mice. Blood 86:4603-11.
[26] Bakhtiar R, Khemani L et al, (2002) Quantification of the anti-leukemia drug STI571 and its metabolite (CGP 74588) in monkey plasma using a semi automated solid phase extraction procedure and liquid chromatography-tandem mass spectrometry, Journ of Pharm and Biom Anal 28 1183-1194.
[27] Kerkelä R, Grazette L,et al. (2006) Cardiotoxicity of the cancer therapeutic agent imatinib mesylate. Nat Med. 12(8):908-16.
[28] Shima H, Tokuyama M, Tanizawa A et al. (2011) Distinct impact of imatinib on growth at prepubertal and pubertal ages of children with chronic myeloid leukemia . J. Pediatr (Online) 03.046. PMID 21592517.
[29] Takimoto CH, Calvo E. Principles of Oncologic Pharmacotherapy
[30] Gambacorti-Passerini CB, Gunby RH, Piazza R, Galietta A, Rostagno R, Scapozza L (2003) Molecular mechanisms of resistance to imatinib in Philadelphia-chromosome-positive leukaemias. Lancet Oncol. 4(2):75-85.
[31] Paolo Vigneri, Jean Y. J. Wang (2001) Induction of apoptosis in chronic myelogenous leukemia cells through nuclear entrapment of BCR–ABL tyrosine kinase. Nature Medicine 7, 228 – 234.
53

[32] Kantarjian HM. et Al. (2011) Nilotinib versus imatinib for the treatment of patients with newly diagnosed chronic phase, Philadelphia chromosome-positive, chronic myeloid leukaemia: 24-month minimum follow-up of the phase 3 randomised ENESTnd trial. Lancet Oncol. 12(9):841-51.
[33] Oostendorp RL, Beijnen JH, (2007) Determination of imatinib and its main metabolita in human plasma and murine specimens by ion-pairing reversed-phase high-performance liquid chromatography Biomed. Chromatogr. 21 747-754.
[34] Bakhtiar R, Lohne J, (2002) High-throughput quantification of the anti-leukemia drug STI571 (Gleevec™) and its main metabolite (CGP 75588) in human plasma using liquid chromatography-tandem mass spectrometry, Journal of Chromat. B 768 325-340.
[35] Bland JM, Altman DG, (1986) Statistical methods for assessing agreement between two methods of clinical measurement Lancet. 307–310.
[36] Branford S, Rudzki Z, (2004) Real-time quantitative PCR analysis can be used as a primary screen to identify patients with CML treated with imatinib who have BCR-ABL kinase domain mutations, Blood. 2926-32.
[37] E. Pirro et al. A New HPLC–UV Validated Method for Therapeutic Drug Monitoring of Tyrosine Kinase Inhibitors in Leukemic Patients. Journal of Chromat. Sci, in press.
54

Dr. Raffaele Arvonio, during his PhD, has participated in "14th Course of Mass Spectrometry for PhD Students 2010" - Charterhouse Pontignano (Siena, Italy), 21-26 March 2010.
During the PhD, the following publications were produced:
Communications
• Date and location: 27-29 October 2011 BOLOGNA (Italy)• Event name: Congresso nazionale congiunto SIMMESN e SIMGePeD Malattie
genetico-metaboliche tra tecnologia e assistenza• Abstract title: “Screening metabolico allargato degli errori congeniti del
metabolismo in regione Campania: risultato di quattro anni di progetto pilota”
• Authors: Emanuela Scolamiero, Generoso Andria, Raffaele Arvonio, Antonella Ansalone, Elena Bloise, Graziella Corbo, Carla Cozzolino, Cristina Di Stefano, Giulia Frisso, Paolo Giliberti, Lucia Giordano, Laura Ingenito, Giovanni Ippolito, Basilio Malamisura, Antonella Norma, Daniela Ombrone, Giancarlo Parenti, Silvana Pellecchia, Rita Pecce,
• Date and location: 26-27 November 2010 AVERSA (Italy)• Event name: III Congresso nazionale della società italiana di pediatria ospedaliera• Abstract title: “Extended metabolic newborn screening in Campania region”• Authors: M. Ruoppolo, D. Ombrone, E. Scolamiero, C. Cozzolino, R. Pecce, R.
Arvonio, G. Frisso, F. Salvatore
• Date and location: 24-26 November 2010 NAPOLI (Italy)• Event name: Giornate Scientifiche 2010 – Polo delle Scienze e delle Tecnologie per
la Vita• Abstract title: “Confronto tra un metodo HPLC-UV e un metodo LC-MS/MS per il
monitoraggio terapeutico di imatinib in pazienti leucemici”.• Authors: R. Arvonio, E. Pirro, S. De Francia, F.M. Piccione, G. Muccioli, F. Di
Carlo, M. Ruoppolo, F. Pane • Date and location: 18-21 November 2010 MILANO (Italy)• Event name: Congresso nazionale Malattie Metaboliche e Genetica Clinica
SIMMESN-SIMGePeD • Abstract title: “Extended metabolic newborn screening in Campania Region”• Authors: Daniela Ombrone, Emanuela Scolamiero, Carla Cozzolino, Raffaele
Arvonio, Rita Pecce, Giulia Frisso, Margherita Ruoppolo and Francesco Salvatore
• Date and location: 19-22 October 2010 LIONE (France)• Event name: 12th International meeting and workshop of the Society for
Biochromatography and Nanoseparations• Abstract title: “Comparison between an HPLC-UV method and an LC-MS/MS
method for therapeutic drug monitoring of imatinib in leukemic patients”.
• Authors: E. Pirro, S. De Francia, F.M. Piccione, R. Arvonio, G. Muccioli, M. Ruoppolo, F. Di Carlo.
55

Publications on international journals :
Journal: Analytical Biochemistry: Methods in the Biological Sciences (SUBMITTED)
Title: “Therapeutic drug monitoring of imatinib plasma levels in patients with chronic myeloid leukemia”.
Authors: Caterino Marianna, Muccioli Casadei Giada, Arvonio Raffaele, De Francia Silvia, Pirro Elisa, Piccione Francesca Maria, Pane Fabrizio, Ruoppolo Margherita.
56