development of an objective type achievement … filei am also thankful to prof, r.c, deva,...
TRANSCRIPT

DEVELOPMENT OF AN OBJECTIVE TYPE ACHIEVEMENT TEST IN SCIENCE
FOR CLASS VIII STUDENTS
D I S S E R T J L X I O N SUBMITTED TO THE ALIGARH MUSLIM UNIVERSITY, ALIGARH
FOR THE AWARD OP THE DEGREE OF
Mnittt of $I)Uo£iopi)p IN
EDUCATION
BY
POONAM CHAUHAN
UNDER THE SUPERVISION OF
Dr. C. p. S, Chauhan
DEPARTMENT OP EDUCATION
ALIGARH MUSLIM UNIVERSITY
ALIGARH (UP)

f «d In Co«--;>tKM
/y V / '^ m
4^' 8 '::•} 1992

Phone . 27047
DEPARTMENT OF EDUCATION DR. CP.S.CHAUHAH C ! " ? ^ ! * ) ALIGARH MUSLIM UNIVERSITY
E«ad«r ^ ^ ^ ^ AUGARH, 202002, u.p.
CB1TIFIC4TS
This ±8 to c«r | i fy that th« d i s s tr ta t ion •Bt i t lad •DSYBLOPMSNT OP AK OBJECTIVE T5fPE ACHISVSMEST TEST IN SCIENCE FOB CLASS VIII S!RJDS1^S*, subBlttad by Hi. Poonaa Chaahan«in part ia l falfilffiant of II.^Phil.(Bdu.) dagra« of Allgarh Hiallfli Ua iwrs l t r t Allgarh« ia her original oontrihution. Sh« prepared th i s diasartation aadar 07 gaidanoe and ouperTiaion.
I ooaaidar thia diaaa:»tatioa f i t for autaisaion for the degree of M.Phil, in Education.
O^J 27 Deoeaber. 1990 BR. C.P.S. CHAUHAW
Sup erriaor

A C K N O W L E D G E M E N T S
I find myself de f i c i en t of adequate words to express
my feel ing and sense of g r a t i t ude to my esteemed supervisor .
Dr. C,P.S, Chauhan, Reader, Department of Education, Aligarh
Muslim Univers i ty , Aligarh for valuable and expert guidance
which has enabled me to complete t h i s p r o j e c t ,
I am a lso thankful to Prof, R.C, Deva, Chairman,
Department of Education, Aligarh Muslim Univers i ty , Aligarh
for providing me necessary f a c i l i t i e s in the Department.
Thanks are also due to a l l the p r i n c i p a l s of the
schools concerned in which data co l l ec t i on was ca r r i ed out i
The cooperat ion provided by the students and teachers of
these schools i s also g r ea t l y appreciated,
I would be f a i l ing in my duty i f I do not express my
sense of g r a t i t ude to my f r iends , parents and husband,
Capt. Sanjay Singh who rendered a l l the help and whole
hearted cooperat ion and encouragement. These d i g n i t a r i e s
have been a continuous source of i n s p i r a t i o n to me through
out the course of accomplishment of t h i s s tudy.
%
POONAM CHAUHAN

C O N T E N T S
CHAPTERS
I
1.1
1.2
1 . 2 i l
1.22
1.3
1.4
I I
2 . 1
2 . 2
2 . 3
I I I
3 . 1
3 . 1 1
3 .12
3 .3
3 . 3 1
3,32
3 . 3 3
3 . 4
3 . 4 1
3 .42
CONTENTS
THEORETICAL BACKGROUND
Need f o r t e s t i n g
T r a d i t i o n a l T e s t i n g D e v i c e a
C r i t i c i s m of E s s a y t e s t s
Why E s s a y T e s t i n g P e r s i s t s
O b j e c t i v e T e s t i n g : An a l t e r n a t i v e
O b j e c t i v e T e s t i n g i n S c i e n c e i A R e s e a r c h Rev iew.
THE PROBLEM
R a t i o n a l e
O b j e c t i v e s
D e l i m i t a t i o n s
' METHODOLOGY
T e s t P l a n n i n g
A n a l y s i s of S u b j e c t C o n t e n t
Blue P r i n t
T r y o u t
Txryout Sample
s c o r i n g P r o c e d u r e
I t e m A n a l y s i s
Sample A d m i n i s t r a t i o n
S a m p l i n g ,
• S c o r i n g
PAGES
1-24
1
6
7
10
14
17
25-28
25
26
27
29-46
30
30
31
35
37
38
39
40
41
43

( i i )
3.5 Development of Norms 43
IV ITEM ANALYSIS DATA 47-66
4 . 1 I t a n Ana lys i s 49
4.11 Frequenc ies of Responses 49
4.12 F a c i l i t y Value 5l
4 .13 D i s t r i b u t i o n of F a c i l i t y Values 52
4.14 D i s c r i m i n a t i o n Index 54
4 .2 Using I t em Ana lys i s Data 56
4 .21 I tem S e l e c t i o n 57
4.22 Es t imat ing Mean and Var iance of 59 the Tes t as a Whole,
4 .23 Es t ima t ing R e l i a b i l i t y C o e f f i c i e n t 65
V
5 , 1
5 ,11
5 .12
5 .13
5 . 1 4
5 . 2
5 .21
5 .22
5 . 3
VI
6 . 1
6 . 2
6 .3
FINAL ADMINISTRATION AND DATA ANALYSIS
Study o f Score D i s t r i b u t i o n s
Boys' Sample
G i r l s * ' Sample
Combined Sample
Sex D i f f e r e n c e s
Development o f Norms
P e r c e n t i l e Norms
Computation of P e r c e n t i l e Ranks
67-83
67
68
10
72
73
74
76
76
A l t e r n a t i v e ' R e l i a b i l i t y C o e f f i c i e n t s 80
FINDINGS AND IMPLICATIONS
F i n d i n g s
Educat ional , I m p l i c a t i o n s
I m p l i c a t i o n s f o r Research
84-9 i
84
87
89

( i l l )
BIBLIOGRAPHy
APPENDIX - A
APPENDIX - B
APPENDIX - C
Raw S c o r e M a t r i x
Copy of t h e F i n i s h e d T e s t
S c o r i n g Key
LIST OP TABLES
TABLE NO,
3 . 1
3 . 2
4 . 1
4 . 2
4 . 3
5 . 1
5 ,2
5 . 3
5 .4
5 .5
5 .6
5 . 7
CONTENTS PAGES
A n a l y s i s of S u b j e c t C o n t e n t 32
D e t a i l s o f t h e Sample 42
Specimen I t e m A n a l y s i s 50
D i s t r i b u t i o n of F a c i l i t y V a l u e s 53
I t e m S t a t i s t i c s 62-64
D i s t r i b u t i o n of S c o r e s f o r Boys 69
D i s t r i b u t i 6 n of S c o r e s f o r G i r l s 7 l
D i s t r i b u t i o n of S c o r e s f o r 72 Combined Sample ,
Surmary S t a t i s t i c s Shwoing Sex 73 D i f f e r e n c e s .
D i s t r i b u t i o n of Raw S c o r e s f o r 77 Sample of B o y s .
D i s t r i b u t i o n o f Raw S c o r e s f o r 78 Sample of G i r l s
D i s t r i b u t i o n o f Raw S c o r e s f o r 79 Combined S a m p l e .

(iv)
LIST OP FIGURES
FIGURE NO, CONTENTS
4.2 Distribution of Facility Values
5.1 Distribution of Boys' Score
5.2 Distribution of Girls* Score
5.3 Distribution of Combined Sample Score

C H A P T E R - I
THEORETICAL BACKGROUND

THEORETICAL BACKGROUND
1.1 NEED FOR TESTING:
In the context of educational process, learning Is
defined as acquisition and change of behaviour brought about
by the school curriculum Including general environment and
InatructtonaL means. Really* the learner interacts with the
instructional environment, changes it, and in turn, is
changed by It as a result of interaction. What is taught
and how, depends on objectives and values of the school
system. The efficiency of a school system reflects in the
way in which it encourages the development of desirable
behaviour patterns and discourages certain undesirable ones.
Testing and measurement consist of those techniques and
methodologies which provide essential Information ( 'Iota )
regarding development, operation and evaluation of educational
enterprise. The fundamental task of testing and measurement
In education is to provide Information for making decisions
with respect to analysis of the subject matter domain, diag
nosis of the characteristics of the learner, design of
the instructional enviornment and evaluation of learning
outcomes. In the analysis of subject matter domain,
subject experts are assisted in analysing (Glaser and Nitko,
1971) their domains in terms of the performance competencies
which compose them. The second activity diagnosis of the
characteristics of the learner - involves the measurement
of behaviour with which the loirner enters into learning

p
s i t u a t i o n including already acquired re levan t behavioxir,
necessary p re requ i s tes and h is spec i f i c learn ing modes. This
i s followed by the a c t i v i t y of designing the i n s t r u c t i o n a l
environment involving the spec i f i ca t ion of condi t ions under
which learning takes p lace . This requires the designing of
teaching methods, mater ia ls and t e s t s to be employed for
evaluat ion . Finally* evaluat ing learning outcomes provides
informations regarding the extent to which the acquired
behavioxir of the learner approaches the performance c r i t e r i a
and the extent to which the values incorporated by the
designers of the system and associated with h i s performance
have been a t t a i n e d .
I t i s with the four th a c t i v i t y t ha t the procedure of
educational measurement i s mainly concerned. What in learned
and what i s not i s a fundamental question t h a t i s to be
answered by way of carrying out the whole l o t of a c t i v i t i e s
known as eva lua t ion . What i s learned becomes fundamental
since the inst jruct ional process requires information of the
l ea rner i n order to know how i n s t r u c t i o n should proceed.
When t h i s performance has been a t t a ined by an individual
learner to the degree Required ( c r i t e r i o n ) by the designers
of the i n s t r u c t i o n a l system, then the l ea rne r i s said to
have a t t a i ned the mastery of the i n s t r u c t i o n a l goal .
I n t e r p r e t a t i o n s of measurements tha t provide such information
may be tetroed absolute i n t e r p r e t a t i o n s . Teats constructed
with t h i s kind of i n t e r p r e t a t i o n in mind are ca l l ed c r i t e r i o n

referenced tests. The score assigned to the Individual as a
result of measurement is basically inert and must be related
semantically to the behaviour of the individual who is
measured ( Lord and Novick, 19 68 ). Another kind of score
interpretation in measurement Involves relating an individual
score to the performance of a defined group called norm. Such
an interpretation is called a norm referenced interpretation.
Both the ways of score interpretation are equally important.
Tests are administered to testees with the expectation
that measurements ( scores ) obtained from them will be
helpful in making certain crucial decisions with a minimis
of risk. Tests may be useful in deciding who should be
accepted or rejected by an institution. While using tests for
selection purposes* it is assumed or established that there
exists a high degree of correlation between the testing tasks
and those skills, abilities and attitudes required for succesr
in the institution. Such an use of testa is very widely
observed these days. All professional and technical colleges
in our country use some kind of admission tests for screening
of candidates who apply for admission. Here the assumption is
made that the performance on the admission test has a high
positive correlation with the subsequent performance in the
professional course. Once a candidate has been selected he
must be placed in a program where he is likely to be the most
successful. Tests used- for this purpose are called placement

t e s t s . I n school se t t ings* placement dec i s ions determine what
curriculxim a s tudent w i l l follow, which reading group he w i l l
be assigned t o , and what spec ia l c l a s s ( remedial or advanced )
he w i l l j o i n . A t e s t used to determine a pe r son ' s s t rengths
and wasknesses i n order to Improve performance serves a
d iagnost ic purpose.
There are several o the r pxorposes for which the t e s t s
can, be u t i l i s e d . For ins tance , i t has been es t ab l i shed t h a t
knowledge of r e s u l t s (KR) i s a s ign i f i can t motivating fac tor
which provides feed back to the l e a r n e r s . Therefore, i f
t e s t s are frequencly conducted in i n s t r u c t i o n a l s i t u a t i o n s ,
the r e s u l t s can be p ro f i t ab ly used for improvement of I n s t r u
c t ion ( formative evaluat ion ) , Recently advanced concept of
Comprehensive In t e rna l Assessment ( NPE, 1986 ) i s a modified
form of formative eva lua t ion . Such an approach can serve
dual purpose. On the one hand i t can p o t e n t i a l l y resume m
teaching learn ing environment in the i n s t i t u t i o n s and on
the o ther i t can provide va l id and dependable data regarding
progress of l ea rne r s in the c l a s s . Tests and rwsasurements
can also vised to counsel and guide young men and women in
educat ional i n s t i t u t i o n to make decis ions regarding future
vocation or ca ree r . Informations may be obtained about
t h e i r a b i l i t i e s , ap t i tudes , i n t e r e s t s and sentiments which
can be extremely helpful i n ca ree r planning. The data
obtained from t ^ s t s and measurements can also be used to

r
carry out useful researches which In turn can help in pol icy
planning and implementation.
Educational t e s t ing has acquired spec ia l s igni f icance
during the recen t decades, e spec ia l ly in the l a t t e r half of
t h i s century . The technological advancement in the recent
years has introduced dramatic changes in educat ional t e s t i n g
by providing o p t i c a l scanners and computers. The need for the
use of these devices in t e s t i n g was promoted by mushrooming
enrolments in high schools and co l l eges . Large scale entrance
examinations are very common in India and are successful ly
conducted by using information processing technology. Surveys
on massive sca les have even cut across na t iona l boundaries.
An i n t e r n a t i o n a l study of achievement in mathematics was
conrpleted i n 19 67, twenty three years ago ( Husen, 19 69 ) .
Computer technology has almost completely r evo lu t io
nized the t e s t i n g technology in the world. The large memory
storage ava i lab le in modem computers makes i t poss ib le to
s to re la rge number of t e s t items alongwith a l l the summary
s t a t i s t i c s descr ibing t h e i r d i f f i c u l t y l eve l s and d i sc r imi
nating powers. These s tored pools of t e s t i tems are corrmonly
Called • quest ion banks, *, Need for cons t ruc t ing cfuestion
banks in d i f f e r e n t subjec ts in higher educat ion, i s recen t ly
emphasized by the Universi ty Grants Commission, So, in the
years to come the en t e rp r i s e of t e s t ing i s l i k e l y to occupy
a prominent pos i t ion iA educat ional systems.

1.2 TRADITIONAL TESTING DEVICES I
The technology of testing has a large theory, but a
short history. Examinations were first used in China. After
this, the idea became popular in the whole world. Traditional]/,
two types of tests have been in use which measure the educationaJ
achievement. These broad categories of tests are oral tests
and easaytests* In the oral testing, the questions are asked
in the spoken words and the responses are also given in the
same manner. It is a direct individual interaction between
the examiner and examinee, but it does not measure knowledge
in sufficient details. It is very time consuming process,
but does not measure the same characteristics of the learner
under identical conditions. The oral test lack the compara
bility of sample the subject matter comprehensively. Conseqii-
ently, the oral response test lacks reliability, validity
and comparability of scores which are essential characteristics
of an examination. Since oral tests are scored at the time
they are administered, their scorer reliability is very low.
They are not equally fair and Just to all pupils and permit
favouritism or subjectivity by the examiner.
The other type of traditional examination is essay
type. According to Stalnaker (I95l), the essay question is
defined as a * test item which requires a response composed
by the examinee, usually in the form of one or more sentences
of a nature that no single response or pattern of responses
can be l i s t ed as correct, and the accuracy and quality of which
Can be judged subjectively only by one ski l led or informed
expert In the subject. The nxjst significant features of the
essay are the freedom of response allowed the examinee and
the fact that not only can no single answer be l i s ted as correct
and complete, and given to clerks to check, but even an expert
cannot usually classify a response categorically as r ight or
wrong. Rather, there are different degrees of quality or merit
which can be recognised (p. 49 5) ".
Essay t e s t can be used to measure educational objectives
which cannot otherwise be measured such as a t t i tudes , continuity
and the ab i l i ty to organise material, insight into personality.
At a superficial level, essay tes t s are easiest to prepare
among a l l kinds of t e s t s , because I t takes only a few minutes
to write standard introductory phrases to compose queatlons on
a variety of topics. But, this ease i s deceptive. Not only
I t Is d i f f i cu l t to decide what essays usually do assess, but
more Importantly, I t Is d i f f i cu l t to know jus t what inferences
about ab i l i ty can be drawn from them. Allied to this question
Is the siibjectlve nature of essay marking and frequently low
agreement between markers acting Independently.
1,21 Criticism of Essay Tests*
The most recurrent cr i t ic ism of essay tes t s and the
one about which most has been written, concerns the

8
u n r e l i a b i l i t y of evalxiating essay answers. While r e l i a b l e
reading can be obtained under inden t i ca l cond i t ions , the
cos t of reading essay quest ions i s apt to be high, and in
general the b e t t e r the reading, the more c o s t l y i t i s . The
accurate eva lua t ion of a well developed essay question i s a
long and d i f f i c u l t job and one which proper ly done requi res
i n t e l l i g e n c e , d i l igence and cons is tency. The essay t e s t has
also been c r i t i c i z e d on the ground tha t the sample of s tudent
performance i t usual ly ob ta ins i s too r e s t r i c t e d to be
dependably represen ta t ive of the svibject mat ter or the
a b i l i t i e s being measured. The essay t e s t conta ins a smaller
number of independent un i t s than an ob jec t ive t e s t made for
the same length of examination time. I t lacks content v a l i d i t y .
The essay t e s t s have been widely c r i t i c i z e d on the
ground t h a t they provide unre l iab le measure of student
performance. A cursory look a t research l i t e r a t u r e reveals
t ha t when d i f f e r e n t r a t e r s are asked to Judge same papers ,
they d isagree i n t h e i r judgement. Lack of consis tency in
marking i s , however, not the only weakness of these t e s t s .
Even i f i t were poss ib le to achieve high l eve l of consistency
i n marking, the re i s the problem of v a r i a b i l i t y in student
performance from sample to sample. Fur ther , there would be
the problem of var iable and systematic e r ro r associa ted with
the fac t t ha t the examinee has to wri te an extended answer

. J
to an esaay question whthin a limited time, and the quality
of answer produced within res t r i c ted time wil l certainly be
different from that of one produced if sufficient time i s
available. This sufficient required time i s also variable
from examinee to examinee ( Coffman, 1971 ) . If essay tes t s
are used by class room teacher, a different source of error
creeps in . The students who have been in close association
with the teacher from day to day have had an opportunity to
learn his value system, and he ( the teacher ) has had an
opportunity to teach the students the kinds of essay responses
he values. This will influence both s tudent 's response pattern
and examiners marking pat tern.
The problem of val id i ty is also equally serious in the
case of essay t e s t s . The advocates of essay t e s t s nrqun th'it
so long as such tes ts are able to measure higher cc^jnltlve
sk i l l s which are not measurable through other type of t e s t s ,
the use of essay tes t s i s jus t i f ied even if they have low
level of r e l i a b i l i t y . Unfortunately, the available evidence
does not support this argument. I t has been found empirically
that many i r re levant factors enter into picture when essay
tes t s are used to measure performance of students in a
certain subject area. Since, answer to an essay question i s
produced in the forro of language, language ab i l i ty plays a
prominent role in determining the performance of an examinee.
This problem of i r re levent factors has been investigated

0
by some r e sea r che r s . I t has been found t h a t wr i t ing speed
makes s i g n i f i c a n t con t r ibu t ion to the production of an answer.
Those who can wri te more in l imi ted time can score high» At
the same time, verbal fluency, an a b i l i t y to produce words
rapid ly and var ied ly , i s another s i g n i f i c a n t f ac to r . Third
factor i s hand wr i t ing , A good and beaut i fu l hand wri t ing
leaves a good impression on the eva lua tor . I t has been observe^]
tha t s tudents with good handwriting score higher than t h e i r
o ther covmterparts . So, the v a l i d i t y of essay t e s t i s a lso
ques t ionable ,
1,22 Why Essay Testing P e r s i s t s !
Nothing has been c r i t i c i s e d so much in the process
of education as essay t e s t i n g , but i t has survived a l l the
c r i t i c i s m s . Pa r t ly , t h i s may be due to i n e r t i a tha t a highly
condemioed p rac t i ce i s p e r s i s t i n g , Coffman ( I97i ) has
r i g h t l y pointed out t h a t " the old es tabl ishment usually
absorbs the revolut ionary t r i c k l e ; i t i s only in exceptional
cases t h a t the new idea survives or p rospers" . Par t ly , t h i s
may be due to the fact t ha t there i s some weight in logic of
advocates of essay t e s t i n g , t h a t i s , i t must have come pos i t i ve
and strong arguments in i t s favour.
The essay examination i s applicable in any paper and
penci l t e s t i n g s i t u a t i o n . The supporters of essay t e s t ing
argue tha t i t i s e s p e c i a l l y appropria te for measuring higher
order mental processes, such as ana lys i s , synthcs ia , evaluat ion
and organiza t ion of ma te r i a l . These hig-her order procecses

' 1
are d i f f i c u l t , somstimes impossible, to be measured witn
other types of test ing techniques. I t i s also argued tha t
i t provides a direct measure of complex learning outcomes
which Can not be measured by other means. I t should b ^
pointed out, however, that the use of essay questions needs
a careful and rigorous planning to ensure the mpasuretnent
of complex aspects of achievement. To serve such purposes,
the construction of essay questions must receive the sajne
degree of training that goes into the construction of
objective t e s t items.
A second advantage confined largely to the extended
response type question, i s the emphasis given to the
integration and application of thinking and problen solving
s k i l l s . Although objective items, such as the in te rpr ' i t ive
exercise, can be designed to measure various aspects of
complex achievement, the ab i l i t y to integrate and ,-\pply
these s k i l l s in a general attack on a problem requires the
unique features of the essay question. Research s tudies in
this area are rather old and are based on more general uses
of the essay question than we are considering here, but
they are in general agreement that pupils tend to d i r e c t
their attention toward the integration and appl ica t ion
of larger units of subject matter when essay quest ions
are included in the c lass room tes t s ( Stalnaker, 19 51 ) .
Since the pupil raxist present his answer in his ov/n

?.
handwriting, the essay t e s t i s frequently looked upon as a
device for improving wri t ing s k i l l s . No one would disclaim
tha t the a b i l i t y to express oneself in wr i t ing i s an educational
object ive of g rea t s ign i f i cance . I t would seem tha t wr i t ten
assignments which could be completed under more favour^ible
cotvditioTvs >iovLl<i con t r ibu te more to the attailn5r,ev.t of t h i s
ob jec t ive .
Another commonly c i t e d advantage of the essay quest ion
i s i t s ease of cons t ruc t ion . This fac tor , probably more than
any o ther , has led to i t s widespread use by classroom teache r s .
In a matter of minutesi most teachers can formulate severa l
ques t ions . Constructing essay quest ions which c a l l for th
the spec i f i c behaviours emphasized in a p a r t i c u l a r se t of
learning outcomes requi res considerable time and e f fo r t .
WlTGrc" ease of cons t ruct ion i s s t r essed , i t iigunl ly t^'forn
to the a l l too frequent p r a c t i c e of dashing off quest ions
a t the l a s t minute with l i t t l e regard for the course
ob jec t ives . In such cases there i s some quest ion whet^ter
ease of cons t ruc t ion can be considered an advantage. In
addit ion to the i n v a l i d i t y of the measurement, evaluat ing
the answers to ca re l e s s ly developed quest ions tends to be
a confusing and time consuming task .
When assigned an essay exeimination, s tudents tend
to use a global apprxjach in studying for the t e s t . They
tend to emphasize general understandings* com^parinq and

r e l a t i ng general concepts* and the organ iza t ion of ideas .
Furthermore, research i n d i c a t e s tha t the global approach
to studying i s more e f fec t ive than the b i t s and pieces
approach. Students who have prepared for an esoay 'Examination
tend to do b e t t e r on a l l types of t e s t s than do students who
have prepared for multiple choice or t rue f a l s e examinations.
Among the prominent advantages of essay t e s t s la the
fac t t h a t they uniquely assess c l u s t e r s of i n t e l l e c t u a l
components required to marshal fac t s and present an argument;
secondly, they are a v e r s a t i l e means whereby t e s t s can be
quickly compiled by most t eachers ; t h i r d l y , the most unques
tioned assumption t h a t the production of language and the
ve rba l i za t ion of thought i s the most scho la r ly of a l l a c t i v i
t i e s , lends support to t h e i r continued use; and f ina l ly p'ssayB
are thought to encourage l ea rne r s to develop study hinbits
wivich wi l l stand them in good s t read in higher oducotion. Tte
essay examination should be included as a v i t a l aspect of
the measurement program of most t eachers . Since i t s major
s t rength i s in the measurement of higher order p r o c ^ s c s , Itr;
use should be most frequent in the areas and at the gr.ide
l eve l s in which, these processes are emphasized or oxp«-'cted.
The r e l a t i v e frequency of the use of essay exa/ninations shoul'J
increase as s t u d e n t ' s verbal s k i l l s increase and as t e a c h e r ' s
emphases on higher order mental processes inc rease .

Many students have expressed a more favourable
attitude toward taking essay type tests than do they toward
other types of tests. They seem to feel that essay tests are
more valid as measures of higher order mental processes. This
attitddinal difference can be important to the success of any
measurement or teaching program. The attitude with which
students accept a teacher and his procedures can make a
difference in the effectiveness of the learning process.
1.3 OBJECTIVE TESTING ; AN ALTERNATIVE i
Dissatisfied with the weaknesses of traditional essay
type and oral examinations/ experts in educational measurement
and psychometricians devised an alternative mof'le of testing
wherein certain new kinds of test items are used to cornoose
a test. An important characteristic of thig kJn'l of \ ^ ^mn
ia that when ocorod by diCfcront scor'arD, Inny provl']'- \ \i<-^
same raw score for a particular examinee. Such a test is
called an objective type of test and a particular item in
the test is called an objective test item. Here, objectivity
is the characteristic of a test by virtue of which it gives
the same score irrespective of by whom, when and v/here it is
scored. The objective type test is generally recogniserJ ,is
the most widely applicable and useful type. It can measure
more effectively many of the simple learning outcomes as
well as the complex outcomes in the knowledge ^nrl 'iri('l',rstan''Ji.'','
areas.
The objectivG category'includes a variety of different.

'.J
type of items. Broadly, they can be c l a s s i f i e d in to tv/o
categories-those that require the pupil to supply the answer
and those that require the pupil to s e l e c t the r ight answer
from a given number of alternatives ( Gronlund, ]9BS p. 127 ) .
These broad categories are further divided in to dlfferf^nt
types of items such as: short answer type, completion type,
trxie fa lse type, matching type and multiple choice type. In
large scale measurement progratumes, multiple choice type
items are most commonly used because of certain inherent
advantages over others. The multiple choice item i s composed
of a stem, distractors and a keyed response. The stem serves
two primary functionsi i t presents the problem and i t s e t s an
appropriate frame of reference. Since the stem se t s the s tage
for answering the question, i t roust include a l l the condition.^
and l imitat ions needed in order to respond. In items df^nign^O
to measure higher order thought processes, i t i s not uncommon
to find, in an introductory statement, some data to be anal/z"d
synthesized or evaluated. This introductory statement plays
an important ro le . This part of a multiple choice question
which poses the problem, as a direct question or as an
incomplete statement, i s ca l l ed " stem " of the item. The
second part cons i s t s of the l i s t of suggested solutions in
the form of words, numbers, symbols or phrases, and i s
cal led * alternatives " or * options ". The co r r ec t a l t e r n a t i v e
in each item i s cal led " answer" or Key • and the remaining
options are ca l led " distractors ".

]G
The multiple choice has several advantages over
essay type and other objective type forms. It is the most
flexible and versatile of all objective type tests which
has led to its extensive use in achievement tentinq. it may
be used to measure instructional objectives at all levels of
the cognitive domain: knowledge, comprehension, application,
analysis/ synthesis and evalixation. The versatility of the
multiple choice item is further apparent in its adaptability
for use in essentially all subject matter areas and with
examinees at all grade levels. Since a large number of items
Can be answered during a normal examination period, it is
possible to include items covering several instructional
objectives in many content areas. It can cover a large
content area. When contrasted with essay type itemn, scoring
errors are of small concern in multiple clioico t,r.r,t.r-. Thf^y
may be scored rapidly, accurately and objectively by indivi
duals who are unqualified to teach the subject arc-ci beinj
examined. Furthermore, the scoring of these examinations is
not influenced by the previous performance, mode of dros^,
mannerisms, or general neatriess of the examinees. Although
the scoring is completely objective but expert judgement
must be exercised during the process of item construction.
There should be clarity. Ambiguity is a problem comnon to
all test questions but with an intelligence the test
developer can eliminate or at least reduce ambiguity.
The objective nature o^ a multiple choice type item
t '7
reduces the amoxint of subjective element In scoring process.
The personal factors associated with the examiner do not enter
Into the picture and the reliability of the test as a whole is
improved. Some people have criticised the multiple choice formot
aa allowing room for random guessing and measuring only recall
and memorization of facts. It is argued that multiple choice
items are useful only when higher abilities are not required
to be tested. But, this argument is not supported by evidence,
studies have shown that multiple choice items can be used to
assess higher mental processes as effectively as recall or
recognition. Therefore, this variety of objective items is
widely used in measurement and research,
1.4 OBJECTIVE TESTING IN SCIENCE: A RESEARCH REVIEW:
Objective testing has drawn the attention of research
workers in India* especially, after independence. Achievement
tests have been constructed in school subjects such as
mathematics, languages and social sciences. But, the number
of tests constructed in science is relatively very small. In
the case of general science tests are available for grades
V-VIII of the states of Tamil Nadu, Punjab, Haryana, Mahara
shtra, Andhra Pradesh, ,Gujrat, Kerala and Orissa ( Passi and
Hooda, 1986 ) , However, a few tests were also constructed
in Uttar Pradesh which covered the old syllabi being taught
in 60s and early 70s, There are a few studies which are
significant to report. Most of the studies reported here

18 are attempts to construct ob jec t ive type achievement t e s t s in
d i f f e ren t science sxibjects being taught a t d i f f e r en t l eve l s
of schooling. The research work on t e s t cons t ruc t ion in
other coun t r i e s i s very wide, but has not been reported
here due to d i f fe ren t c u r r i c u l a .
I n Ind ia also some researchers have developed achieve
ment t e s t s i n general science for various l eve l s of school
education. I t i s e s s e n t i a l to examine the methodology followed
and r e s u l t s obtained in these s tud ie s .
S ta te I n s t i t u t e of Education Kerala ( 1965 ) constructed
and s tandardized an achievement t e s t in General Science for
grade VIII s tudents of Kerala S ta t e . Based upon the ana lys is
of content courses and considering general ob jec t ives of
science teaching the t e s t items to assess c e r t a i n a b i l i t i e s
such ass
i . r ecogni t ion of f ac t s and information
i i , problem solving s k i l l
i i i , a b i l i t y to discover r e l a t i onsh ip s
i v . a b i l i t y to reorganise and
V, s k i l l in manipulation of instruments were const ructed .
The f i n a l form of the t e s t cons is ted of 156 items of
which 10 were completion type, 56 mul t ip le choice, 4 t rue
fa l se type, 26 matching type, 39 c l a s s i f i c a t i o n type and
19 p i c t o r i a l type. The p i l o t t e s t i n g was conducted on a
sample cons i s t ing of 500 pup i l s of grade IX a t the beginning

JO
of the ses s ion . The t e s t was s tandardised on a sample of 915
boys and 485 g i r l s se lec ted from urban and r u r a l schools of
Kerala s t a t e . The r e l i a b i l i t y of the t e s t was estimated by
s p l i t half method as 0 ,67. To find out the concurrent
v a l i d i t y of the test* a teacher made t e s t was used as a
c r i t e r i o n . Concurrent v a l i d i t y coe f f i c i en t so obtained was
found to be 0 .83 , Standard scores* normalized T-scores and
percen t i l e norms were also computed,
Mohd, Faizul Islam (1975) also cons t ruc ted and
standardized an achievement t e s t in general science for
students of c l a s s VII in the s t a t e of Bihar, After specifying
the ob jec t ives of teaching science in schools , content
analysis of the course was done. The prel iminary draf t of
the objec t ive type t e s t was adrtvLnistered to 264 students
of c l a s s VIII in two d i f f e r en t schools of Ranchi. The s tudents
were j u s t promoted from c l a s s VII to VI I I . The t ry out t e s t
cons is ted of 104 items* but a f t e r the item ana lys i s , 18 items
were r e j ec t ed . The f ina l fojrm of the t e s t , having 86 item
was s tandardized on a sample of 300 boys and 300 g i r l s
studying i n c l a s s VIII of se lec ted schools of Bihar. The
scores were s t a t i s t i c a l l y analyzed for f inding out skewness
and k u r t o s i s , standard score norms, T-score norms and
pe r cen t i l e norms for boys and g i r l s s epa ra t e ly .
Some of the achievements t e s t s were constructed to
find out the attainment to be used in educat ional guidance.

;'0
Saxena (1960) developed a standardized test in general science
for providing guidance to those students who wanted to opt
science as a subject of study. For this purpose, two parallel
forms of the test were drafted and administered to fifty
students Of classes VII, VIII and IX randomly selected from
the same institution. Results showed the two drafts were
parallel in terms of content and statistical properties and
were suitable for use in class VIII, The final test was
administered to a sample of 2,190 students of class VIII
which represented the seven educational regions of U,P. The
reliability of the test was determined by the method of
rational equivalence; empirical validity and predictive validity
of the test were also determined. Percentile norms were
calculated and a scale of standard scores was developed. The
differences in achievement of urban and rural children, both
for boys and girls wore compared. It was found that (i) the
reliability coefficient of the test by the method of rational
equivalence was 0,88 (ii) the empirical validity coefficent
of the test was 0,46 (iii) the predictive validity coefficient
of the test was 0,57 and (iv) there were significant differ
ences between the attainments of rural and urban boys and
urban boys and girls in science,
Gupta (19 62) constructed and standardised an attainment
test in general science in order to identify good, average and
weak students, A detailed- study of the syllabus of general
science was made and 230 items, mostly of multiple choice type.

?[
were prepared for the first experimental draft in two parallel
forms. Tryout of this draft was carried out on a sample of
450 students selected from 10 different higher secondary schoolrj
of Kanpur. On the basis of discriminating index and difficulty
value 165 items were selected in the second experimental draft.
Tliis draft was administered to the students of class Vlll and
item analysis was again carried out. Thus, 132 fixed answer
type and 8 free anawer type items were included in the final
draft. The time limit of the final draft was 90 minutes. This
test was administered to 1602 pupils of class VIII randomly
selected from both the sexes drawn from 23 schools of U,P.
Mean^ Median and mode of the test scores were computed and
were found to be nearly equal. The measures of skewness and
kurtosis, and the chi-square test showed that the obtained
distribution apprtjximated fairly well, the nomral curv .
Reliability coefficients calculated by split hall methrjd,
spearman Brown and K.R.formulae were found to be 0.94, 0.94
and 0,93 respectively. Construct and predictive validity
coefficients of the test were found to be 0.50 and 0.59
respectively. Percentile norms were also calculated.
Bountra (1970) constructed and standardized a battery
of objective type tests in physics and chemistry at the
high school level and to study its possible use in certain
types of educational research. The experimental drafts of
tests, one in physics and the other in chemistry, were

y.'d
developed a f t e r analysing the sy l l ab i of the two st±>jects
for c l a s ses IX and X in U,P. The objec t ives covered in the
ba t te ry were knowledge, app l ica t ion and s k i l l s . For item
analysis purpose the experimental forms of t e s t s were admi
n i s t e red to s tudents s e l ec t ed . On s t r a t i f i e d random sampling
b a s i s . Va l id i ty and r e l i a b i l i t y of t e s t s were ca lcu la ted . The
f ina l forms of t e s t s were administered on 1,739 students of
c l a s s X from 42 schools . The sample included both boys and
g i r l s from ru ra l and urban a reas . Va l id i ty of t e s t s was computed
by c o r r e l a t i n g scores with marks obtained by s tudents a t the
f ina l high school exam of U.P, Board, R e l i a b i l i t y coef f ic ien t
were found out by t e s t r e t e s t , r a t i ona l equivalence and s p l i t
half methods. Standard scores , pe rcen t i l e norms and s tanine
norms were ca lcu la t ed . The v a l i d i t y coe f f i c i en t of tne
physics t e s t was found to be 0.596 and t h a t of the chemistry
t e s t 0.605. The t e s t r e t e s t r e l i a b i l i t y coe f f i c i en t for the
physics t e s t came to be 0.932 and tha t for the chemistry t e s t
i t was 0,950, The r e l i a b i l i t y coe f f i c i en t by r a t i o n a l
equivalence method for the physics t e s t was 0.84 and that for
the chemistry t e s t was 0 .89 . The s p l i t half r e l i a b i l i t y
coe f f i c i en t for the physics t e s t was found to be 0.79 and
for the chemistry t e s t i t was 0.79, The performance of ru r a l
s tudents was found to be s i g n i f i c a n t l y b e t t e r than tha t of
xirban s tudents on both physics and chemistry t e s t and boys
performed s ign i f ican t ly , b e t t e r than g i r l s in chemistry.
S ta te Council of Educatignal Research and Tr.iining,

Andhra Pradesh (1971) constructed and standardized a science
attainment test for students of standard VIII of Telugu medium.
A large number of items were constructed in Telugu based on
the science syllabus of standard VIII of the high schools of
Andhra Pradesh. Items were also constructed for the new units
incorporated in the science syllabus of standard VIII. These
items were tested on a small sample of standard VIII students.
Some of the items were dropped and a few were refined after
the preliminary testing. The final version of the test was
administered to 1,288 boys and 403 girls of standard VIII from
Andhra Pradesh, Boys and girls were selected from the several
high schools spread over the entire state of Andhra Pradesh.
The standardised test consisted of 100 questions. It was
divided into two parts. Part I consisted of questions in
Physics and Chemistry and Part II of questions in Zoology
and Botany, Each part consisted of 50 queytiona. Ench queatir,',
had four options and the students were supposed to find the
correct answer out of four options. The mean acor' 3 of Pert J
for boys and girls were 21 and 19 respectively. Th"; critical
ratio for Part I was 6.33. The average mean scores of Part II
for boys and girls were 22 and 21 respectively. The critical
ratio for Part II was'2.83. The mean scores of the
complete test for boys and girls were 22 and 20 respectively.
The complete ratio for the complete test was 8.29. This
showed that achievement of boys and girls in

2^
physical sciences/ biological sciences and in combined
subject differed significantly. This was clear from the CR
values which were all significant at .01 level. The time
required for administering the complete test was 1 hour 70
minutes. Part I required 35 minutes and part II 32 minutes.
Scoring key was developed. The test could be used as yard
stick to assess the knowledge of VIII class boys and girls
of Telugu medium, regarding their science attainment.
Pexrcentile scores were established for boys and girls.
The above review of research on development of objective
tests in science subjects reveals two important things:
(a) Most of the tests were constructed to cover the old coursf-*a
which were being taught prior to the implementation of 10+2
pattern of school education, (b) Since elementary fjducation
in different states has been imparted in regional languages,
most of the tests constructed so far are useful only in
certain regions. For example a test constructed in Gujrati in
useful only in Gujrat, The present study is to be followed
by another study by the investigator leading to Ph.D. degree
in education. The test constructed in the present investigation
will be used in the proposed study. Since no suitable test
covering new coxirses is available, the present study is
underway.
C H A P T E R - I I
T H E P R O B L E M

THE PROBLEM
Research related to the construction of tests in science
has been reviewed in the previous chapter. Although, the review
is not exhaustive yet all the relevant studies have been reviewed
The review revealed that most of the studies avniln^le in t ie
literature were based on the old syllabi i.e. those b<=inq taugr.
before the implementation of 10+2 pattern of school edacation.
Moreover, most of the studies conducted in states other than
Uttar Pradesh were relevant only to those states because of
regional languages as the media of instruction. The researcher
was faced with the problem of selecting an appropriate achieve
ment test to be used in her research study leadino to Ph.D.
degree.
2.1 RATIONALE I
The i n v e s t i g a t o r was faced with two r e l a t e d problems:
(1) she needed a t e s t that covered the cou r se c o n t e n t c u r r e n t . ) /
beiiig taught i n c l a s s VIII of secondary s c h o o l s ot U .P . ;
(2) such a t e s t should be i n Hindi s ince Hindi i s the medium
of i n s t r u c t i o n in secondary schools of U.P. ^fc)st of tne t e s t
current ly a v a i l a b l e do not s a t i s f y both of t h e s e c o n d i t i o n s .
Some of the t e s t s ava i lab le i n the market covered the new
course but they were pr inted i n the languages o t h e r than
Hindi. On the other hand the t e s t s constructed in Hindi d id
not cover the new course content being taught in U.P,
The new pattern of school education as recorrmended by
Education Commission (1964-66) was implemented i n C e n t r a l
School i n e a r l y s e v e n t i e s . The s y l l a b i developed by t he

; 0
National Council of Educational Research and Training (NCERT)
for 10+2 pattern was not adopted in all the states. Some
states preferred to develop their own syllabi rather than folio/
the NCERT curriculum, Uttar Pradesh is one of such states which
did not adopt the NCERT curriculum. State Institute of Educati' ri,
Allahabad developed their own syllabus to be followed in
secondary and senior secondary schools in U.P. This process
was initiated in early eighties. Therefore^ researchers could
not construct achievement tests to cover the new courses as
approved by the Madhymik Shiksha Parishad Uttar Pradesh,
Keeping in view the scarcity of new achievement tests
in general and the requirement of the investigator for her
Ph.D. work in particular, the investigator felt the ne -d to
undertake the present study to constrxict an objective type
test in science for class VIII. The precise statement of tne
problem is as follows*
•DEVELOPMENT OF AN OBJECTIVE TYPE ACHIEVEMEI^ TEST
IN SCIENCE FOR CLASS VIII STUDENTS'.
2.2 OBJECTIVES:
The study was aimed a t achieving the following
ob jec t ives :
1, Tb cons t ruc t an ob jec t ive type achievement t e s t
i n science ( including Physics, Chemistry and
Biology) for c l a s s VI I I .
2, To atudy the d i s t r i b u t i o n s of scores on th.e t e s t
based on a sample of sub j ec t s . s e l ec t ed from the
populat ion of c l a s s VIII s tuden t s .

. '7
3, To inves t iga t e sex di f ferences in perform
Qjice on the t e s t ,
4. To compute pe r cen t i l e ranks of indiv idual scores
for use in i n t e r p r e t i n g the raw scores ,
2 . 3 DELIMITATIONSI
No reseai'ch study can be pe r fec t . There are c e r t a i n
cons t r a in t s which del imit the scope or app l i ca t ion of the
findings of a study. The present study i s no exception. This
also has c e r t a i n de l imi t a t ions which are given belowj
1. The subject matter (content) covered by the t e s t
items includes those aspects of the syllabus only
which had been taught in a l l the schools se lec ted , at
the time of t ryout phase. Hence, the t e s t does not
cover the e n t i r e course prescr ibed for c l a s s VI I I ,
2. The t ryout form and the f ina l form of tWf t m t wor*
administered to the s tudents of schools se lec ted froi"
Aligarh c i t y . Hence the u s - a b i l i t y of the t e s t i s
l imi ted to urban areas only. In ru ra l areas, the
norms of the t e s t performance may be d i f f e r en t .
3. Due to sca rc i ty of time and resources the norms of
the t e s t could not be developed on a large samole
for s t andard i sa t ion purixjse. The sample administrat l 'w
was made on only 300 students which i s a small sarnpl'
4. For c e r t a i n s t a b i s t i c a l reasons and for the sake of

; 8
:;,e
convenience only one format of ob jec t ive type
t e s t s was used. All the items in thie t e s t are
mul t ip le choice type with four a l t e r n a t i v e
responses.
5, The a p p l i c a b i l i t y of the t e s t i s l imi ted to t\,
measurement of achievement only. I t cannot be used
as a diagnost ic t e s t to iden t i fy the week points
of ch i ld ren . Since the scores were not co r re la ted
with o ther t r a i t s such as i n t e l l i g e n c e , the t e s t
cannot be used as a prognostic ins t rument .
However, i t i s a good instrument for use in
research which requ i res assessment of achievement.

C H A P T E R - I I I
M E T U 0 D 0 L 0 a Y

f 1
. • J
METHODOLOGY
T e s t c o n s t r u c t i o n , now a d a y s , has become a h i q h l y
t e c h n i c a l and s k i l l f u l a c t i v i t y and d o e s n o t mean m e r e l y
w r i t i n g a few q u e s t i o n s on c e r t a i n t o p i c s from a c o u r s e
c o n t e n t . R a t h e r , f o r a t e a t t o be s a t i s f a c t o r y nov; a ^Jays
c e r t a i n c r i t e r i a a r e t o be met which s e e k t o t e s t t h e a c h i e
vement and when t h e p u r p o s e of t e s t i n g i s t o a s s e s s t h e
a t t a i n m e n t o f some o b j e c t i v e s , e a c h i t e m i n t h e t e s t i s
p u r p o s e f u l l y and c a r e f u l l y c o n s t r u c t e d . The t e s t maker
s h o u l d be c l e a r i n h i s mind a s t o wha t t h e o b j e c t i v e s of
t e a c h i n g a r e and what t h e p u r p o s e of h i s t e s t i n g programme i s
T e s t c o n s t r u c t i o n i s a c r e a t i v e and s y s t e m a t i c -
a c t i v i t y wh ich n o t o n l y r e q u i r e s a d e q u a t e knowledge o t t h e
s u b j e c t m a t t e r , b u t a l s o n e e d s s p e c i a l i z e d t r a i n i n g on t h e
p a r t of t h e t e s t c o n s t r u c t o r i n t h e t e c h n o l o g y of t.of;t
d e v e l o p m e n t . The me thodo logy of t e s t c o n s t r u c t i o n i n v o l v e s
t h e f o l l o w i n g s t e p s j
1, Ttest planning.
2, Item wri t ing .
3, Tryout and item ana lys i s ,
4, Select ion of su i tab le i tems.
5, Sample adminis t ra t ion .
6, Development of liorms.
At each step of this test development process,
proper planning is essential since each step may Invr.ive

many piroblems. The investigator was fully aware of her
objective with regard to the present study. She followed the
above steps in the process of constructing the test. The
details of how the whole plan was carried out are given in
the following sections,
3,1 TEST PLANNING i
At this stage certain important decisions were taken.
First, it was decided that test items would be constructed
for each level of Bloom's Taxonomy, that is, knowledge,
comprehension, application and higher abilities (analysis,
synthesis and evaluation taken together) . Second, it was
decided that multiple choice type items would be constructed
in view of their- inherent advantages over other type of items,
Third, the appropriate number of items to be conRtructed frofn
each topic in the subject matter was decided tor cich level
of cognitive processes. Fourth, for the guidance of the
investigator, a test specification or blue print was orepared,
3,11 Analysis of Svibject Contenti
The investigator contacted some science teachers in
schools and collected informations regarding the course
content being taught in class VIII, The text book which was
generally followed in most of the schools was taken as a
guide. The whole syllabus was analysed into specific topics
and subtopics so that' the content involved in the final form

iil
of the test may be fairly representative of the course being
taught in class VIII. This analysis resulted in the listing
of eleven different topics.
3.12 Blue Printt
The main purpose of the test blue print is to define
for the test constructor, in a precise manner, the scope and
emphasis of the test. It is a plan of stratification that is
followed in drawing up a representative sample of test items
from the possible domain of tasks (items) covering the entire
course content. It is used not only to show what different
areas of sxibject matter are to be covered, but also the types
of behaviour to be elicited with respect to each area. It also
indicates the relative emphasis to be given to the various
topics and types of behaviours to be tested.
The investigator prepared a two dimensional ocheme
called blueprint, which represented content areas in the
vertical dimension and broad test objectives in the horizontal
dimension. As mentioned earlier, the objective dimension
consisted of only four categories namely, knowledge, compre
hension (understanding) , application and higher abilities.
This two dimensional scheme consisted of 44 cells in which
suitable numbers, indicating the number of test items to
be constructed for a particular cell, were entered. This
scheme is presented in table 3.1

:^2
Table No. 3.1
s. No.
1 .
2 .
3 .
4 .
5 ,
6 .
7 .
a.
9 .
0 .
Tbpics
Vibrat ion , Wave Motion and sound
Upthurst tti Liquids
Energy
Heat and Internal Energy
Structure of Atom
So lut ion
Metals
Flower1 Reproduct ion i n Plants
Fru i t s and Seeds
Vegetat ive
Knowledge
3
1
1
4
. 3
2
9
5
1
1
Unders t anding
1
3
1
3
6
1
7
7
5
1
Appl i c a t i o n
1
3
1
1
1
1
3
1
1
1
Higher A b i l i t i e s
1
1
1
1
1
1
1
1
1
1
Total
6
r,
(i
4
9
11
r
20
\'^
'',
4 reproduction
11. Different kinds of plants
8 ]4
Total 33 43 16 11 10 .

1 ) U
A glance over the t a b l e can show that the t o t a l
nxanber of i tems constructed for the prel iminary form of the
t e s t was 103. These items were d i s t r i b u t e d over the e n t i r e
course and measured a l l l e v e l s of behaviour. In a l l 33 i f-rns
were knowledge i tems, 43 itqms measured unde r s t and ing
(comprehension), 16 items measured a p p l i c a t i o n and i l i tems
measured higher a b i l i t i e s inc luding a n a l y s i s , s y n t h e s i s and
eva luat ion ,
3 .2 ITEM WRITINGt
A t e s t of any kind i s composed of tasks to be performed
by the examinees. An ind iv idua l task included i n a t e s t i s
c a l l e d a ' t e s t item* or a ' t e s t ques t ion* , Each item
provides an unique information about the person who t a k e s
the t e s t . The combination of informations o b t a i n e d throiKjh
ind iv idua l i tems i s a measure of an i n d i v i d u a l ' n p'-rffjrrruTnc
on the whole t e s t . An item, there fore , i s a s co r ing u n i t . An
o b j e c t i v e item i s one that can be scored by mecl a n i c a l dev ic^ -
or by c l e r k s who have no s p e c i a l competence i n the su'ojpct
matter under eva luat ion . In the present study, the i n v e s t i g a t o r
had decided to constr\x:t o b j e c t i v e type t e s t and chosen to
include mul t ip le choice type items i n her t e s t . I t was decide'-J
at the t e s t planning stage t h a t each mul t ip le cho ice i tem
w i l l have four a l t e r n a t i v e responses or op t ions i nc lud ing the
key, I tan cons truc t ion work was done by the i n v e s t i g a t o r

herself i n consu l ta t ion with her supervisor . Every care v/as
taken to achieve the optimum qua l i ty of items a t the
cons t ruct ion s t age .
Item wri t ing i s e s s e n t i a l l y a c r ea t i ve a r t and there
are no s e t s of rxiles or formulas to cons t ruc t good i tems.
Though there e x i s t c e r t a i n gxiidelines and suggestions for
item wr i te rs* ye t the qua l i t y of items depends mainly on the
judgement of the item wr i t e r in the long run. An item wr i t e r
shoxxld be an expert of the subject matter being tes ted on the
one hand and have adequate exper t i se in the technique of item
cons t ruc t ion on the o ther . Those who have had some experience
with item wri t ing business , can appreciate the a b i l i t y and
s k i l l s involved in i t . I t has been observed thiat t e s t items
const ructed by teachers not t r a ined in item wri t ing s k i l l s
are mostly defect ive i tems. Item wri t ing i s r e a l l y n v^ry
d i f f i c u l t and challenging t a sk . I t has been pointed out by
some experienced authors t h a t experienced profess ional item
wr i t e r s regard an output of 5 to 15 good achievoment ie5;t itf-.'(.
a day as a s a t i s f a c t o r y performance. Testing organisa t ions
have to spend huge amounts on item wr i t ing . I t i s comron in
our country t h a t item wr i t e r receives Rs,3/- to Ps. V - ^oc a
s ingle good i tem.
Some people think t h a t extensive use of s t a t i s t i c a l
methods for ana lys i s of responses to t e s t items can provide
good t e s t items and the s k i l l of item wr i t e r i s of a 5j"rondar/

i m p o r t a n c e . This no t ion i s based on a misconcep t ion of the
irole of i t em a n a l y s i s . I tem a n a l y s i s i s e v a l u a t i v e - n o t
c r e a t i v e . I t s e r v e s to i d e n t i f y bad i t e m s ; t hose which a r e too
d i f f i c u l t o r too easy» o r o the rwi se non d i s c r i m i n a t i n g .
I t does not improve the q u a l i t y of an i t e m .
The i n v e s t i g a t o r const rxjc ted every i tem very c a r e f u l l y .
F i r s t of a l l the i d e a for an i tem was s e l e c t e d from the
s u b j e c t c o n t e n t . This i d e a was d i s c u s s e d w i th s u p e r v i s o r and
f r i e n d s . Then, a d r a f t i t em was c o n s t r u c t e d which was
modif ied a f t e r d i s c u s s i o n . Each item was examined by a
language e x p e r t t o remove language vagueness . I tem o p t i o n s
were s e l e c t e d very j u d i c i o u s l y . All the d i s t r a c t o r s resembled
the key i n £orm. As f a r as p o s s i b l e , d i s t r a c t o r s were based
on the p o s s i b l e mis takes t h a t the c h i l d r e n could make i n
a t t e m p t i n g the i t em . I t took t h e i n v e s t i g a t o r over a month ' s
time to c o n t r u c t t h e p r e l i m i n a r y s e t of 10 3 t e s t i t ems . These
i tems were assembled i n the form of a b o o k l e t which was used
f o r t r y o u t purpose .
3.3 TRYOUT;
After a collection of items has been prepared and
examined by subject matter experts, it is revised on the basio
of their judgement. It must ordinarily be tried out experiment
ally on a representative sample of examinees. This sample
should be as nearly like the population with whom the final

3C
form of the t e s t i s to be used, as poss ible . Such a p r e l i
minary administration of original t e s t items on a cross
section of the population under consideration i s known as
•tryout*. Before tryout begins, the item pool should be
assembled in the form of a t e s t booklet. Such a t e s t booklet
i s ca l led 'tryout form* of the t e s t . Tryout helps the t e s t
constructor s e l e c t the best items from the avai lable pool
and make improvements in weaker items. The t ryout process
i s carried out in order to serve the following purposess
(a) lb ident i fy weak or defective items and to reveal needed
improvement.
(b) To determine the d i f f i cu l ty level of each individual item,
in order that a se lect ion of items may be made that w i l l
show a distribution of item d i f f i c u l t i e s appropriate to
the purpose of the finished t e s t .
(c) To deteinT\ine the discriminating power of each individual
item,
(d) lb provide data needed to determine how many items should
const i tute the finished t e s t .
(e) To provide data needed to determine appropr ia te time
l imits for the finished t e s t .
(f) lb discover weaknesses in the directions and other needed
improvement s.

(g) To determine i n t e r c o r r e l a t i o n s among the items to avoid too
much overlap or b ias in item se l ec t ion and to check the
grouping of items in to s u b t e s t s .
In the preliminary c o l l e c t i o n of i tems, the inves t iga tor
had 103 mul t ip le choice items (four option type) , covering about
a dozen d i f f e r e n t topics in c l a s s VIII sc ience . In order to
s e l ec t appropr ia te items for f i n a l t e s t , the inves t iga to r condu
cted a t r you t . Before t ryou t adirdnistrat ion, a l l the 10 3 items
were co l l e c t ed in a s ing le booklet , and over 300 copies of
t l i is booklet were dupl ica ted,
3,31 Tryout Samplet
Theoret ica l ly / t ryou t , forms should be ndininistered to
a s u f f i c i e n t l y large sample ranging from 400-500 examinees
(ffenrysson, 1971), However, some authors plead tha t if item.-;
ar^ properly prepared, a smaller sample can be e f fec t ive ly
used for the purpose of t ryou t . In the present inves t iga t ion
the researcher prepared t e s t items very ca re fu l ly in consul t
a t ion with her supervisor and other expe r t s . Therefore, i t wa:>
decided t h a t a smaller sample could be used for t ryout . The
t e s t cons t ruc to r not only t r i e d to obta in represen ta t ive sampi -
i n order to avoid bias, in her data , but a lso obtained sample
t ha t was e f f i c i e n t in the sense t ha t i t would yield maximum
information about the populat ion of ind iv idua l s t e s t ed . The
t ryout sample represented a several elementary and high school
and cons is ted of 315 s tudents of c l a s s VIII se lected by using

118
clxister sampling. For administering the tryout forms, the
investigator visited the schools personally. She explained
the directions verbally to the students before they began
answering the questions. The teachers of the concerned
schools also cooperated to ensure successful adrninistration
of booklets.
3.32 Scoring Procedure 2
A number of different standards have been suggested
for scoring of multiple choice test iesms. One approach is
to obtain differential weights for items by a method that
will tend to maximize the reliability of total test scores.
Such a method vould fit well with the procedure for selecting
items in terms of item total correlations. An appropriate
method for obtaining such differential weights is to weight
each item by its item total correlation. Tlie crucial guostlon
in seeking differential weights for items is how much
difference it makes to use differential weights. It could
make a difference if the weighted and unweighted scores on
the whole test did not correlate highly and if the reli-ibi-
lity of the weighted test were considerably higher than thiat
of the unweighted test: However, there is overwhelming
evidence to show that the use of differential weights
seldom makes an important difference (Dubey, 1986) . Also, tn*,
slight increase in reliability or predictive validity obtain- ^

by weighting items can be matched in nearly all instances
by adding several items to the unweighted test. Therefore,
determining and using differential weights for items seeking
differential weights is almost never worth the trouble
(Nunnally* 1981) .
Differential weighting of items is most effective in
short tests and usually pays little dividend when there are
more than 10 to 20 items. In a long test it matters little
what set of weights is used, provided they are of appropriate
algebraic sign.' Thus weights of one for all items in long
tests of ability are quite appropriate (Guilford, 19 54) »
Keeping in view these arguments, the investigator scored
the test booklets by using an easier approach. A right
answer was scored as 1, and a wrong one was scored as 0.
The score of candidate on the whole test was the number of
items he did right. For example, if an examinee provided
right responses to 50 items out of 103, his score was 50.
3,33 Item Analysis t
One of the major aims of tryout is to ascertain to
what extent each iten discriminates between good and poor
students as defined by a criterion. In selecting such a
criterion one wishes to find a good measure ot ability or
skill, the test is designed to measure. Ideally, the criteria
should be independent of the test item being evaluated.
It is said that a test is no better than its items.
If individual items ^re good%measures of the ability under
study, the test as a whole will be a good measure of the
ability. Therefore, before the test is finalised for use.

40
it is to be ensxired that individual items satisfy certain
statistical criteria. First, it is to be ensured that all the
responses inclxiding distracters function properly, and no
response, right or wrong, is dysfunctional or attracting
students unduly.. For this purpose the frequency of respo
ndents on each option of an item are studied. Second, it is
to ascertain that the test items are neither too easy nor
too difficult since such items do not contribute to the
purpose, reliability and validity of the test. Third, it
is to ascertain that each item discriminates between good
and poor examinees. The detailed item analysis data are
represented and analyzed in the next chapter. The item
analysis data can be used for finding reliability of the
test and for estimating certain test characteristics,
3.4 SAMPLE APMINISl^RATIONt
The final administration serves to indicate exactly
how the test will function in actual use. This means that
no material changes can be made after the final administration,
and that the sample employed must be essentially a cross
section of the population for whom the test is to be used
in future. The final administration provides a final check
on time limits and on the procedure of administration. In
the process of test construction, administration of selected

41
Items ( after item analysis ) on a representative sample
of the population under study i s a very imp>ortant step.
Once, the f inal collection of t e s t items has been obtained
additional data are needed for developing norms or for
analyzing the t e s t scores. Such an administration is made on
a fa i r ly large sample. This i s the final stage of test
constXMCtion which involves drawing out the sample, scoring
the final t e s t booklets and analyzing the data so obtained
for studying the dis t r ibut ion of scores and developing
norms. The investigator followed these steps in the
same order,
3.41 San^ling t
Keeping in view the pract ical f ea s ib i l i t y and
otlier conditions, the investigator selected a sample of
300 students of class VIII for obtaining final data. The
sample of 300 cases included 125 boys and 175 g i r l s drawn
from seven schools si tuated in Aligarh c i t y . The cluster
sampling technique was used because schools provide the
whole class for t es t administration. One section of class
VIII was' taken from each school. The de ta i l s of sarrrple
are given in table 3,2. In this case also like tryout ohage,
the invest igator vis i ted each school personally for
administering the t e s t .

^'^
Table - 3.2
Details of the Sample
S.No. Name of Institution No. of Stu'Jc r* .; Selecti-J
1. Shri Uday Singh Jain Kanya 7'j
Inter College, Aligarh,
2. Rajkiya Balika Inter College, 91
Aligarh.
3. Shrl Chlranjilal Kanya Inter 0 5
College, Aligarh.
4. Goplram Pallwal Inter College 25
Aligarh.
5. Shritnad Brahmanand Inter College, 47
Aligarh,
6. Raghuvir Sahai Inter College, ?1
Aligarh.
7. Shrl Maheshwari Inter College, 3?
Aligarh.
Total 300

43
3 . 4 2 Scor ing*
As i n t h e c a s e o f t r y o u t a d m i n i s t r a t i o n t h e s c o r i n g was
done by p r o v i d i n g one p o i n t f o r a r i g h t r e s p o n s e s and z e r o f o r
a wrong r e s p o n s e . The s c o r e o f an examinee was thn t o t n l number
of q u e s t i o n s he d i d r i g h t .
I t i s to be noted here t h a t no c o r r e c t i o n was a p p l i e d
f o r c l e v e r g u e s s i n g w h i l e s c o r i n g the b o o k l e t s . From t h e
measurement p o i n t of v i e w , i f a l l examinees have s u f f i c i e n t
t ime to answer a l l the q u e s t i o n s , t h e r e i s l i t t l e p r a c t i c a l
d i f f e r e n c e i n the r e l a t i v e ranking of s t u d e n t s on c o r r e c t e d
s c o r e s as compared w i t h * u n c o r r e c t e d s c o r e s ( T i n k e l m a n , 1 9 7 i ) .
Hence i t i s a common pract ices to encourage e x a m i n e e s to answer
a l l q u e s t i o n s even i f t h e y are not sure of t h e r i g h t a n s w e r s ,
and to make no c o r r e c t i o n f o r chance s u c c e s s , SI nop ^h*'
i n v e s t i g a t o r a l l o w e d the oxamineea s u f f i c i e n t t lmo fr,r . imwor i r . ' ,
a l l q u e s t i o n s , the use o f c o r r e c t i o n formula f o r g \ i e s s inq wa«?
n o t n e c e s s a r y ,
3 , 5 DEVELOPMENT OF NORMS<
A f t e r a d m i n i s t r a t i o n and s c o r i n g o f t e s t b o o k l e t s ,
the nex t s t e p i s t o a n a l y z e the q u a n t i t a t i v e i n f o r m a t i o n s so
o b t a i n e d . I n t h i s regard e v e r y i n v e s t i g a t o r u s e s r e l e v a n t
s t a t i s t i c a l t e c h n i q u e s . This i s one of the mos t c r u c i a l s t a j e t
i n r e s e a r c h p r o c e s s , b e c a u s e the c h o i c e o f s u i t a b l e s t a t i s t l c ^ J
t e c h n i q u e s depends on O b j e c t i v e s o f t h e s t u d y and t h e na ture

4'!
of quantitative Informations available with l imitod resources .
In the present study* the data were analysed so as to understand
and stiidy the nature of score distr ibutions of both the sub-
samples of subjects . The s t a t i s t i c a l aver^qcs cucfi -13 m^nu,
median* standard deviation, percentile rank, skeweness and
kurtosls were computed. Computed f a c i l i t i e s ava i lab le in
Allgarh Muslim University were ut i l i zed for computational work.
A typical frequency distribution can be charac te r i sed
by four chief features, a clustering of individuals towards
some central value, dispersion about t h i s value, symmetry or
lack of symmetry and f latness or steepness. Many var iab les
or t r a i t s y ie ld distributions which are said to be approximateiy
be l l shaped, but such a description i s not adequate for
sc i en t i f i c purposes. We want to know about what par t ica l . i r
value and with how much scatter the indivldunl ncor'-r, uo
distributed; to what extent the distribution i s ayinrnet,rical,
and to what degree i t i s peaked or f l a t . That i s , we need
measures of central value or tendency, measures of s c a t t e r
or dispersion or var iabi l i ty and measures of skewness (lack
of syminetery) and of kurtosls (peakedness or f la tness) . With
such measures, we can describe the distr ibution mathematically.
As already mentioned the s t a t i s t i c a l measures such as mean,
median, standard deviation, skewenass and ku r tos l s were
calculated.
The mean i s defined simply as the sum of a l l the score;; %

measures divided by their number. I t i s the most convenl'L'nt
measure of central tendency, and i s useful in connection with
advanced techniques of s t a t i s t i c s . Unless the d i s t r i b u t i o n
i s markedly skewed, mean should be used (Mc Nemar, 19 62) . The
median i s defined as the point on the scale of measurement
above and below which l i e 50 percent of the f requencies . I t
i s easy to compute and i s not affected by the extreme values
of scores. Standard deviation i s a measure of d ispers ion of
the dis tr ibut ion and i s given by the square root of average
squared deviations of the individual scores from the mean.
The square of standard deviation which i s ca l led var iance,
i s very useful in the development of s t a t i s t i c a l theory. If
a distr ibut ion i s not of the symmetrical b e l l shaped tyoe,
i t i s not suf f i c ient for descriptive purposes to reoort only
the mean aivi lack of symmetry, i . e . of skewenesn, mri ^ r<^r^Mi=>!,'> ,
i t i s desirable to describe the distr ibution s t i l l fur ther
by giving a measure which indicates whether the d i s t r i b u t i o n
i s r e la t ive ly peaked or f l a t topped, i . e . a measure of
kurtosis . Percentile are also measures of d ispers ion or
variation. The Pth percenti le i s defined as a p)oint kx'low
which P percent of the cases f a l l . These measures are ch ief ly
of Value in reporting the scores of individuals on osycnoloqi '
and educational t e s t s . Ordinarily a raw score g i v s no inVlJn'
of what i t means, whereas when i t i s said t h a t an individual
scores at or near the 85th percenti le , the impl icat ion i s

-ic
that 15 percent of his fel lows score highier or b e t t e r than
he. In other words WG can say t ha t his pe rcen t i l e rank i s 85,
Thus, a percenti le rank carries with i t some idea of the
location of the individual with reference to the group.
Furthermore, percentile ranks for ent ire ly d i f f e r en t t e s t s
are comparable i f derived from the same group or sample.
For these reasons percenti le ranks have been used as norms
in the present study.
For comparing the performance of boys and g i r l s on
the achievement in science, t - t e s t was used. Wherever
necessary, data were ptesented in tabular form, and graphs
were also prepared so that a clear picture of information
emerges. The detailed analysis of data , t ab le s and discussion
are presented in thu f i f t h chapter of t h i s rpr>ort.

C H A P T E R - IV
I T E M A N A L Y S I S D A T A

ITEM ANALYSIS DATA
As ment ioned i n t h e p r e v i o u s c h a p t e r , t r y o u t o p e r a t i o n
was c o n d u c t e d f o r t h e purpose o f g a t h e r i n g d a t a f o r i n d i v i d u a l
i t e m s i n c l u d e d i n the p r e l i m i n a r y form of the t e s t , and comput l ri
c e r t a i n i t e m s t a t i s t i c s . These i t em s t a t i s t i c s were used f o r
making d e c i s i o n s about s e l e c t i n g i t ems f o r the f i n a l t e s t .
I t was a l s o ment ioned t h a t p r e t e s t b o o k l e t s of 315 s t u d e n t s
we're s c o r e d by the i n v e s t i g a t o r h e r s e l f , a s t u d e n t ' s t o t a l
s c o r e on t h e t e s t b e i n g the number of i t e m s he d i d r i g h t ,
A r i g h t answer to an i t e m was g i v e n 1 p o i n t and t h e wrong
answer was g i v e n 0 p o i n t .
For c e r t a i n s t a t i s t i c a l r e a s o n s no g u e s s i n g c o r r e c t i o n
was a p p l i e d w h i l e s c o r i n g the t e s t b o o k l e t s . Any f i x e d cer^ponz'
t e s t i s l i a b l e to e r r o r s i n a s s e s s m e n t due t o g u e s s i n g
( F r a s e r and O i l l a n , 1972) , and i t i s necespnry to rin lOo
whether the marking system s h o u l d be a d j u s t e d so os to atterip'^-
to compensate f o r t h i s e r r o r . S inc e the ntimber o f i t e m s i n
the t r y o u t t e s t , i n the p r e s e n t s t u d y , was q u i t e lar'^jc and
each m u l t i p l e c h o i c e i t em had four a l t e r n a t i v e r e s p o n s e s ,
the p r o b a b i l i t y of accurence of h igh s c o r e due to gnessin ' - j
was v e r y s m a l l . A l s o , t h e r e would be no e f f e c t (Fras^-r -^nd
G i l l a n , . 1972) , on the rank o r d e r of c a n d i d a t e s by usin^,
o r not u s i n g a c o r r e c t i o n formula . When c o r r e c t i o n i s a p p l i e d
a C a n d i d a t e ' s t o t a l c o r r e c t e d s c o r e 'S* i s g i v e n by

s =c - ^ n- l
where,
C • number of c o r r e c t answers.
W • number o£ wrong answers.
n B number of op t ions for each I t em.
I f WaN-C, where N i s the t o t a l number of it^ms in the
t e s t , the formula for correc ted t o t a l score reduces to
g ^ n_ ^ N_ n- l n- l
which i s a l i n e a r funct ion of C, i . e . number of c o r r e c t
answers. Since the rank order or the r e l a t i v e p o s i t i o n of
examinees would not be e f f e c t e d by applying o r not ap:)lyin'g
c o r r e c t i o n for guess ing, the purposes of t he o r e s e n t s tudy
are not a f f e c t e d i f guess ing correc t ion in not us^d. The
comparisions based on uncorrected s co re s ond p ' rcont i l f^
ranks of candidates w i l l remain unaltered and thie ugp' of
correc t ion formula would hardly pay any d i v i d e n d .
Moreover, research s t u d i e s have shown t,h;it i f the
number of opt ions for mul t ip le choice i t ems a re rnore than
three , the p r o b a b i l i t y of securing high s c o r e by guess ing
i s cons iderably reduced. In the present c a s e the number of
opt ions i s four for each i tem.

4 .1 ITEM ANALYSIS «
After the scoring had been completed, t he o r e t e s t
booklets of a l l the candidates were arranged s e r i a l l y from
highest score to lowest s core . Then, these b o o k l e t s v/«>rfj
divided i n t o three parts* the top 27%, the bot tom 27% and
the middle 4696. The number of cases in these groupn v/ore 85,
95 and 145 r e s p e c t i v e l y , i . e . 85 booklets of t hose s t u d e n t s
who scored h i g h e s t , 85 of those who scored l owes t and the
remaining 145 of those who scored i n the middle. These t h r e e
a b i l i t y groups were used to analyse each item in terms of
• frequencies of responses*, " f a c i l i t y value" a n d ' d i s c r i m i n a t i r ,
power*. The d e t a i l e d procedxire i s described below.
4.11 Frequencies of Responses i
The purpose of p r e t e s t was to prodirje t.hrf>'- pi^c^n
of information about the i t e m s . The f i r s t oL tho.oe J n th'-
nviraber of candidates who chose each of the o p t i o n s to a
given i tem. Some would advocate that i n a d d i t i o n to the
opt ions i t i s a l so des i rab le to note the number of c^ndidat'^"';
who do not reach the item in the time allowed, bu t In the
present study the length (number of items) of the t e s t was
such that a l l or at Ifeast the majority of c a n d i d a t e s ^ould
have s u f f i c i e n t time to answer a l l the i t ems of the ^est
wi th in the allowed time. I t was, therefore , not cons ide red
worthwhile (Fraser and G i l l a n , 1972) to d i s t i n g u i s h i.etween

. J . ;
those who omit and those who do not reach a particular item.
For analysing the responses of Individual items a very
simple approach was followed. The main task was to count the
number of examinees who chose each of the alternative options
for a given item. This process was carried out for all the
three ability groups (high, medium and low) separately, and
the results were summarized in a tabular form. For 10 3 test
items included in the tryout form, 103 different item anaiysi;
tables were prepared on separate cards. The following table
(No, 4,1) shows* as an example, the results of the analysis
of item 49 of the achievement test under consideration.
Table - 4.1 *
Specimen Item Analysis
Item No. 49
Groups
High
Medium
Low
A
03
24
18
B
04
24
24
Options
C
01
05
10
D
75
87
27
0
02
05
06
P
0 .
0 .
0 ,
, 88
, 60
, 32
F.V.
0. ''0
D.!
0.'-'
* The entries in the table represent the number of f' cson; chc&ing the options A,B,C and D, The column 0 snov;n the number of persons who omitted the item.

This table presents the frequencies of cannidates
from high* medixrn and low a b i l i t y groups who chose each of
the options A#B,C and D, Here A,B^C and D are the a l t e r n a t i v e
options in which D i s the right answer for t h i s p a r t i c u l a r
item. The column headed by '0 ' shows the numbrr of c nn^l'J^tf'-
who omitted or did not reach this item. The r i g h t answer 'D'
i s also ca l l ed the 'key' . Fac i l i ty value (F.V) and Discrimi
nating Index (D.I) are also entered in the t a b l e . Ttrte
column headed by 'p* l i s t s the f a c i l i t y values of top,
middle and bottom groups,
4,12 Fac i l i ty Value t
The f a c i l i t y value of an item i s t ha t f rac t ion
(Fraser and Gillan/ 19 72) of the candidates, which gives tho
required (right) responses; for example, i f 60 out of 240
candidates give a desired response, the f a c i l i t y value i s
0,25, In the table 4,1 which shows the item analy.^jir. dat^i
of item 49 of the t e s t , f a c i l i t y value for ' h igh ' group
(p.) i s 0.88, for medium group i t i s 0,60, and for low
groi^ (p-) i t i s 0,32w The "p" column in the t a b l ' rc.oresen'
the proportion of examinees in each group who did th'- itf m
correctly. The overall " fac i l i t y value" based on the
proportion of right responses of the three groups combinod
i s entered below the head F.V. In this p a r t i c u l a r item
the f a c i l i t y value (or the d i f f i cu l ty value) i s 0.60.
This value has been bbtained by dividing the sum of

frequencies (189) below the D column in to 315 (the s ize
of the tryout sample) , I t i s interest ing to note tha t the
mean of the p values for "high" and "low" a b i l i t y groups i s
exactly 0.60. This i s also an alternative npproricyi to find
the f a c i l i t y value for an item. However, the r e s u l t m-ay
sometimes d i f fer , but difference wi l l be n eg l i g ib l e . If p^
and p , are the f a c i l i t y values for the "high" and "low"
groups respect ively . The f a c i l i t y value ' p ' for the item
can be given by
2
As a convention a f a c i l i t y value between 0.25 and 0.85
was considered desirable (Eraser and G i l l an , 1972) for the
se lect ion of an item for the f inal form of the t e s t . Most
of the se lected items have F.V, between t h i s range.
4.13 Diatribution of Fac i l i ty Valuest
In t e s t construction, f a c i l i t y values are important
for two interrelated reasons. First , they inf luenre tho
character is t ics of score d i s tr ibut ions . The f a c i l i t y values
direct ly determine the mean score, the mean being the sum
of the f a c i l i t y values. The mean i s only of the inc identa l
importance, however, in the construction of t e s t s . More
importantly, the f a c i l i t y values influence the shaoe and
dispersion of t e s t scores. (These are also influenced by the
number of items and the correlat ions among i t ems) . If the

\ ) <)
Table - 4 . 2
Distribution of F a c i l i t y Valuon
Class Interval Frequency
. 8 0 - . 8 4 1
. 7 5 - . 7 9 3
. 7 0 - . 7 4 2
. 6 5 - . 69 6
. 6 0 - . 64 4
. 5 5 - . 59 8
. 5 0 - . 5 4 6
. 4 5 - . 49 8
. 4 0 - . 4 4 14
. 3 5 - . 39 11
. 3 0 - . 3 4 6
. 2 5 - . 29 6

r- 1 . ) 1
average f a c i l i t y value i s far removed from 0.50 in • J th^-r
d i r e c t i o n , t h e d i s t r i b u t i o n w i l l tend to be skewed ( o - r t i -
cvilarly when the number of items i s small e . g . l e s s than 20/
and the standard d e v i a t i o n tends to be s m a l l , Connorpjontly,
s ince i t i s usua l ly des ired to have an approprifit-'=>l y symrnoi-
r i c a l d i s t r i b u t i o n and to d i sperse people a: much o^ f^o'^-lh •
an argument can be made for having an ave rage f a c i l i t y va lu '
of 0 . 5 0 , In addi t ion , even i f the average f a c i l i t y value i s
0,50 the standard d e v i a t i o n of t e s t scores i s l a r g e r v/nen
a l l the f a c i l i t y values are near 0 ,50 , rather than s c a t t e r e d
widely above and below that po in t . Then, t o disp^^^rse people
as much as p o s s i b l e ( to d i scr iminate among them), onn coulo
argue t h a t i t i s des i rab le for a l l t e s t i t ems to hav* - f a c l l .
value c l o s e to 0 , 50 . A t e s t composed of items of Lnnt kind
i s re ferred to as a peaked t e s t . The d i s t r i b u t i o n of f a c i l i *
values for the 75 items f i n a l l y s e l e c t e d for th' or ;,« -rit
study i s shown in table 4 , 2 , I t can be seen t h a t tYtf^ ' l i s t r i -
bution of p-values i s p o s i t i v e l y skewed showing t h a t scor^,-
d i s t r i b u t i o n w i l l assume the same shape.
4.14 Discr iminat ion Index:
The s u i t a b l e f a c i l i t y value i s not t h e only c r i t e r i o n
that o b j e c t i v e items must s a t i s f y . An item might have a
f a c i l i t y Value of 0.50 and s t i l l be u n a c c e p t a b l e i f the
number of candidates g iv ing the correc t response was not
larger i n the high a b i l i t y group than in the low a b i l i t y
group. Therefore, some measure of e f f i c i e n c y of an item

' / I
to pick out the *good' candidates i s required. This, in
turn/ means that we require a cr i ter ion of the candida tes '
abi l i ty in the subject which the item i s designed to t e s t .
The most readily available and dependable c r i t e r i o n i-, a
candidate's score on the complete t e s t . Once c r i t e r i o n hos
been decided upon^ there are various ways in which i t can
be used to arrive at an index of discrimination. The simples»-
method i s to calculate the f a c i l i t y values for each item for
high and low ab i l i ty groups (top and bottom) and find the
difference of these p-values. If p- and p are the f a c i l i t y
values for top and bottom 27% groups* the discrimination
index wi l l be given by D. p. - p
Alternatively, two phi-coeff ic ientn can l^ ca l'"'Jlr;ted,
one for the top third with the rest , and another fcjr the
bottom third with the r e s t . The average of thes*^ two ' ^('effi
c ients Can give an index of discrimination. Th^ ro ,ir'- a f<?>/
other methods also. In the present study the f i r s t m ;thod
was used. Although this method i s widely \jn»d, hu» I tn
val id i ty rests on certain assumptions (Guilford, 1954); on*-
i s that the distributions of ab i l i ty as represented by iterp
and by total score are synmetrical. Another i s th,it thf
regression i s l inear. Other conditions are, trie de-jioe of
correlation between item and total score and the dist.tnc^
of f a c i l i t y value based on ent ire sample from 0.50, rf, nnov/r,
by Michael and Perry (19 53), They demonstrated t h i t i
discrimination index imr n iases , the f a c i l i t y valur bf-.^d on
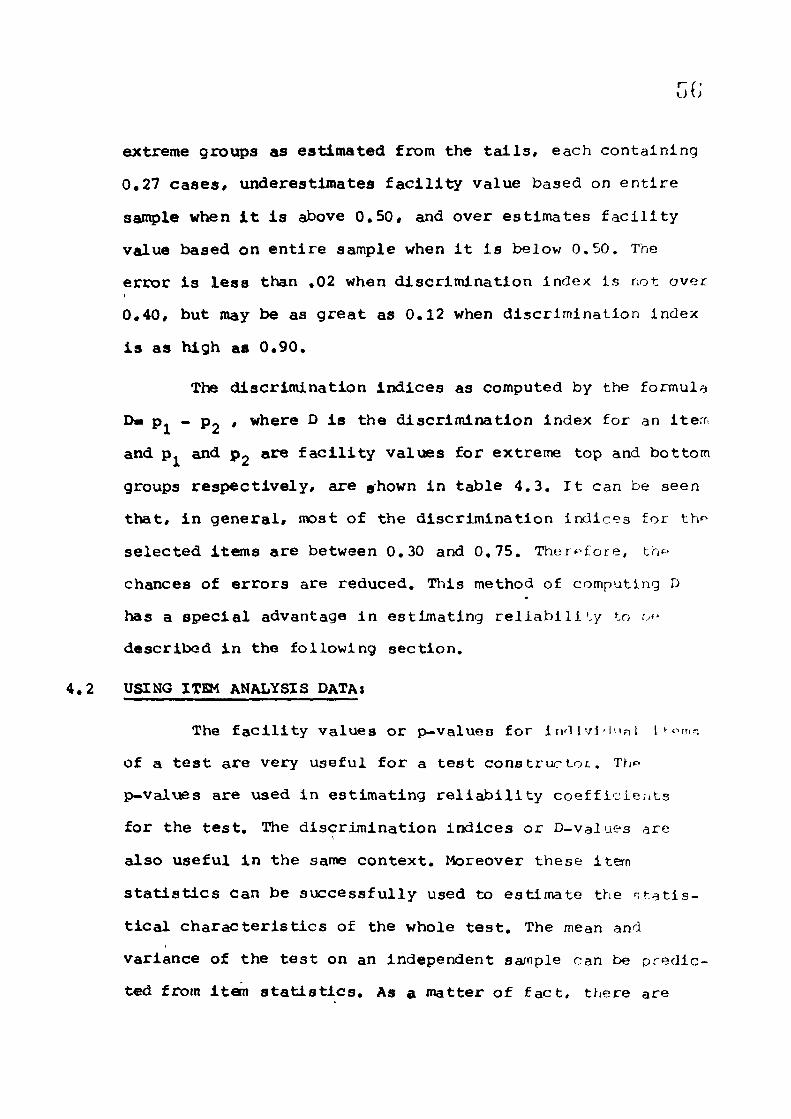
Gi;
extreme groups as e s t i m a t e d from the t a i l s , each c o n t a i n i n g
0.27 c a s e s * t m d e r e s t l m a t e s f a c i l i t y va lue based on e n t i r e
sample when i t I s above 0.50« and over e s t i m a t e s f a c i l i t y
va lue based on e n t i r e sample when i t i s below 0 . 5 0 . The
e r r o r i s l e s s than ,02 when d i s c r i m i n a t i o n index I s not over
0,40# bu t may t>e as g r e a t as 0 .12 when d i s c r i m i n a t i o n index
i s a s h igh as 0 . 9 0 .
The d i s c r i m i n a t i o n i n d i c e s as computed by the formula
Dm p- - P j # where D i s t h e d i s c r i m i n a t i o n index for an i tem
and Pj and p - a re f a c i l i t y v a l u e s for ext reme top and bot tom
groups r e s p e c t i v e l y , a r e shown i n t a b l e 4 . 3 , I t can be seen
t h a t , i n g e n e r a l , most of t h e d i s c r i m i n a t i o n i n d i c e s for th*^
s e l e c t e d i t e m s a r e between 0,30 and 0 . 7 5 . Ther»-fore, th^-
chances of er irors a re r educed , Tliis method of computing D
has a s p e c i a l advantage i n e s t i m a t i n g r e l i a b l l l L y to o«
d e s c r i b e d i n the fol lowing s e c t i o n ,
4 ,2 USING ITEM ANALYSIS DATAt
The f a c i l i t y v a l u e s o r p>-value3 for I rv i iv i iun l l ofrir-,
of a t e s t a r e very use fu l f o r a t e s t c o n s t r u c t o r . Thf>
p - v a l u e s a re used i n e s t i m a t i n g r e l i a b i l i t y c o e f f i c i e n t s
fo r t h e t e s t . The d i s c r i m i n a t i o n i n d i c e s o r D-values a re
a l s o u se fu l i n t h e same c o n t e x t . Moreover t h e s e itern
s t a t i s t i c s Can be s u c c e s s f u l l y used to e s t i m a t e the s t a t i s
t i c a l c h a r a c t e r i s t i c s of the whole t e s t . The mean and
Variance of the t e s t on an independen t sample can be p r e d i c
ted from i tem s t a t i s t i c s . As a m a t t e r of f a c t , thiere are

rn
three main purposes for which item s t a t i s t i c s (p-values
and D.values) can be u t i l i z e d . These are;
i . Selecting items for f inal t e s t ,
i i . Estimating mean and variance of th*"- tent as n whioJ
i i i . Estimating r e l i a b i l i t y coe f f i c i en t of th » t e s t .
The deta i l s regarding these uses of item anal / s in
data are given in the following pages,
4.21 Item Selectioni
The se lect ion of t e s t items for the f i n a l form of
the t e s t was made on the basis of three s t a t i s t i c s described
in the ,prevlous section, namely, frequency of candid?itcs
choosing each resF>onse, f a c i l i t y value and diGcrimin'itlon
index. For f inal se lect ion , an item was required to s a t i s fy
the following conditions!
1. A four response item was selected i f each of the thro'i
distractors a t t r a c t e d at l eas t 5% of th€i ranfJidaten.
2. A spread of f a c i l i t y values from a lower l im i t of 0.25
to an upper l imit of 0,85 was considered appropr ia te .
3. Since the discrimination indices as computed in the pre?.-
study are estimates of point b iser ia l c o r r e l a t i o n s ; a
Value greater than 0,30 was considered s u i t a b l e .
An item satisfying a l l the three condi t ions given
above was se lected for inclusion in the f i n a l form ot thie
t e s t s . As shown in the table 4,1 for example, item n^mh<^i: ^'>

of the f inal t e s t s a t i s f i e s these conditions. Therefore,
this item was selected. Similar tables were made for a l l the
items for the t e s t , and the s e l ^ t i o n was made on the bas i s a
the above c r i t e r i a .
The three cr i ter ia followed in the aelf^f t.lori (,i I L' rm
for the f inal t e s t are not based on a s t a t i s t Jcnl c r>,i^.oninq.
rather* they are based on conventions followed in ».hf; tnnt
construction research. The underlying logic s a t i s f i e s t h e o r e t i
cal and s t a t i s t i c a l requirements a l so . If a d l s t r a c t o r a t t r a c t -
l e s s than 5% of the examinees* then i t i s safe to conclude th.-;t
this particular distractor i s not functioning. Therefore, e l t r .»r ,
the item should be discarded or this p a r t i c u l a r d i s t r a c t o r s 'o J-
Id be modified in the l i ght of the key and o th^r cUstr-ictorn.
Similarly, a f a c i l i t y value of l e s s than .25 indicntea th'it
th is item i s too d i f f i cu l t to contribute s i g n i f i c a n t l y to th"
pxirpose of the t e s t . In the same way, an item having a f a c i l l * /
value of 0.85 or more i s too easy and does not moV.n nny contr i-
bution in discriminating the examinees. Likewise, a D-v,-ilue of
.30 or more shows a s igni f icant degree of c o r r e l a t i o n (point
biser ia l ) between the given item and the t e s t as a whole i . e .
a fa i r ly high item v a l i d i t y . Any value l e s s than .30 wi l l in-K-
cate l i t t l e relationship between the item and the t e s t and wi: :
mean that the item measures something dif ferent from what the
total t e s t does. So, these are the arguments in favour of therj-j
three c r i t e r i a lased for items se l ec t ion .

r ( 1 1 < I
4.22 Estimating Mean and Variance of the Test as a Whole:
I t i s interesting to note that s t a t i s t i c a l characteri
s t i c s of individual t e s t items such as p-value and D-value c.:n
be used to estimate certain s t a t i s t i c s of the d i s t r i b u t i o n oS
scores for the entire t e s t to be used in fu ture on a repres'^r.-
tat ive sample of the population.
As mentioned ear l ier the t e s t i s composed of 75 items
and an individual 's score on the t e s t i s obtained by adding
his scores on individual t e s t items. Also, i t i s evident t ha t
p-valxie for an item i s nothing but the mean score on tha t
item. Since the sum of means i s the mean of a sum, i t i s obvi-
ous that the sum of p-values for al l the items i s -in ' gtim-Tf'
of t e s t score mean for any sample on which th'- te.ot. woulfi f>'
used in future. So, the estimate of the t e s t r.core rre^n jLs
given by
^ - IP i f p represents the average item d i f f i c u l t of n t e s t wi tri /
tes t items, the mean i s given by the equation
M » kp
In the present invest igat ion the sum of p-values for
75 items i s fouxxi to be 36,00 which i s an f s t lmate of the
entire t e s t score mean. The mean of p-values i s ,48. The
variance of the distr ibut ion of t e s t scores can also be
estimated from the knowledge of p-values and D-values for
individual t e s t items. The theory underlying tun rneth'> J V/OT
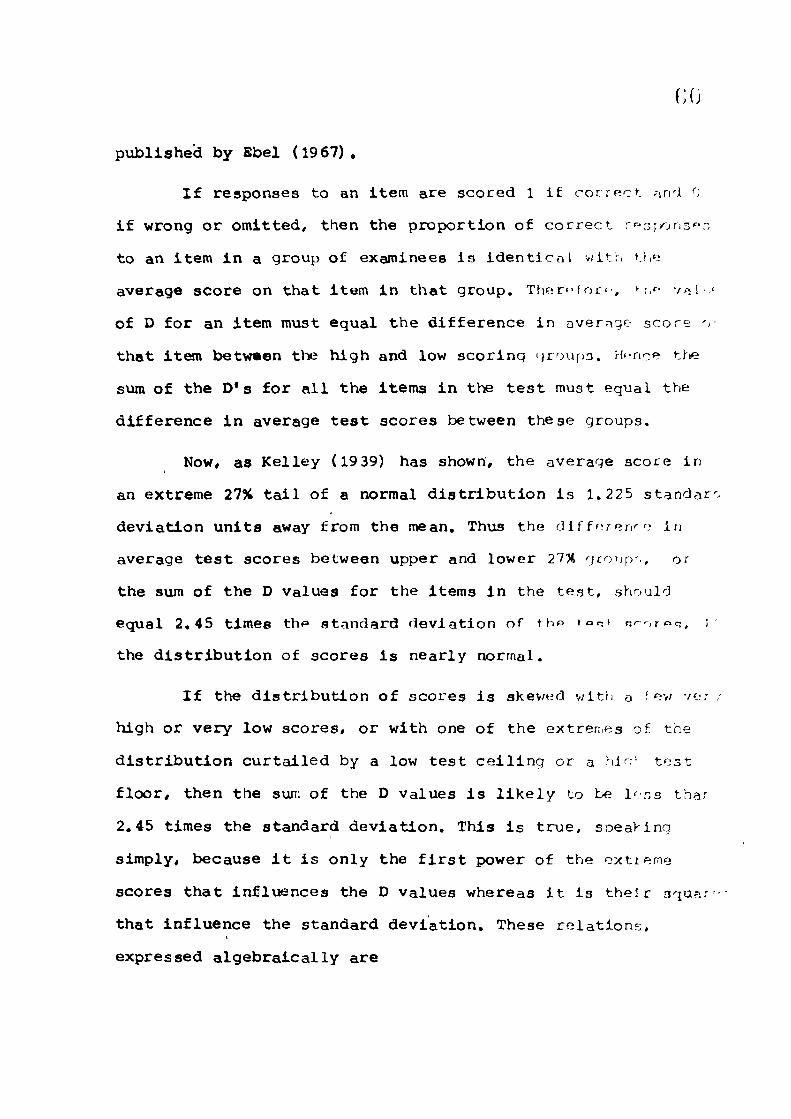
00
published by Ebel (1967) ,
I f responses to an item are scored 1 i£ c o r r e c t ;in'i 0
i f wrong or omitted, then the proportion of c o r r e c t f^-r^inns'^-"
to an item i n a group of examinees i s i d e n t i c n l v/ith trir;
average score on that item in that group. Ther"for< , u,f v^J /
of D for an item must equal the d i f f erence in aver^^ge sco re ->•
that item between the high and low scor ing groupa. H*>nce tl ie
sum of the D*s for a l l the i tems i n the t e s t must equal the
di f f erence i n average t e s t scores between these g roups .
Now, as Kel ley (19 39) has shown, the average score in
an extreme 27% t a i l of a normal d i s t r i b u t i o n i s 1.225 s t a n d a r '
dev ia t ion u n i t s away from the mean, Thxis the d l f fo ren^o in
average t e s t scores between upper and lower 21% groDp)--., or
the sum of the D values for the items i n the t e s t , should
equal 2,45 times thp standard dev ia t ion of thp ton* n^^roc;, i
the d i s t r i b u t i o n of scores i s nearly normal.
I f the d i s t r i b u t i o n of s c o r e s i s skev/ed v/it'n a f ev/ ver
high or very low scores , or with one of the extremes of the
d i s t r i b u t i o n c u r t a i l e d by a low t e s t c e i l i n g o r a hie- t e s t
f l oor , then the suni of the D values i s l i k e l y to be l e s s thar
2.45 times the standard d e v i a t i o n . This i s t r u e , soeaVing
simply, because i t i s only the f i r s t power of the extreme
scores that in f luences the D values whereas i t i s t h e i r nqusr '
that in f luence the standard d e v i a t i o n . These r e l a t i o n s ,
expressed a l g e b r a i c a l l y are

hi
£rom which one can obta in
Cr - ^ P and cr^ « ( _ ^ 2 2.45 6
ifhese r e l a t i onsh ips between the auin of D-v^iluea and
the t e s t Variance can be used to es t imate standard dpvi-ition
and variance of the t e s t . By dividing J D by 2.45, the
standard devia t ion of the t e s t can be obta ined. In the
present Inves t iga t ion t he sum of D-values for 75 items was
fovind to be 26.05 ( table 4,3) so, t e s t S.D. i s given by
(X - ^ D -= '26.05 2.45 2.45
» 10.63
This I s the es t imate of standard dev ia t ion for the
e n t i r e t e s t obtained from Item s t a t i s t i c s . Squaring both
the s ides / we obtain the var iance
6
m 678,60 „ 113,10
These estimated values of t e s t score mean and variance-
can be compared in the next chapter with the obtained values
based on the adminis t ra t ion of the t e s t on 300 examinees.

V>2
s. No.
1 .
2 .
3 .
4 .
5 .
6 .
7 .
8 .
9 .
1 0 .
1 1 .
1 2 .
1 3 .
1 4 .
1 5 .
1 6 .
1 7 .
1 8 .
1 9 .
2 0 .
2 1 .
2 2 .
2 3 .
2 4 .
2 5 .
F a c i l i t y (o)
0 . 7 9
0 . 7 8
0 . 7 5
0 . 6 9
0 . 6 9
0 . 6 8
0 . 6 7
0 . 6 4
0 . 6 3
0 . 6 0
0 . 5 8
0 . 5 5
0 . 5 3
0 . 4 7
0 . 4 4
0 . 4 4
0 . 4 3
0 . 4 1
0 . 4 1
0 . 2 8
0 . 8 2
0 . 6 9
0 . 5 6
0 . 5 5
0 . 5 4
T a b l e . 4
I t e m S t a t i s
v a l u e q » ( l - p )
0 . 2 1
0 . 2 2
0 . 2 5
0 . 3 1
0 . 3 1
0 . 3 2
0 . 3 3
0 . 3 6
0 . 3 7
0 . 4 0
0 . 4 2
0 . 4 5
0 . 4 7
0 . 5 3
0 . 5 6
0 . 5 6
0 . 5 7
0 .59
0 .59
D.72
3 .18
5 .31
) . 4 4
) . 4 5
) .46
. 3
tics
pq
0 .1659
0 . 1 7 1 6
0 . 1 8 7 5
0 . 2 1 3 9
0 . 2 1 3 9
0 . 2 1 7 6
0 . 2 1 0 1
0 .2304
0 . 2 3 3 1
0 . 2 4 0 0
0 . 2 4 3 6
0 . 2 4 7 5
0 . 2 4 9 1
0 .2491
0 .2464
0 .2464
0 . 2 4 5 1
0 .2419
0 .2419
0 . 2 0 1 6
0 . 1 4 7 6
0.ai39
0 . 2 4 6 4
0 . 2 4 7 5
0 . 2 4 8 4
D i s c r i m i n a t i o n I n d e x (D)
0 . 3 6
0 . 2 4
0 .2 2
0 . 2 2
0 . 3 7
0 . 3 3
0 . 4 3
0 .39
0 .39
0 . 2 0
0 . ? 2
0 . 7 6
0 . 3 2
0 . ? 1
0 . 3 6
0 . 3 3
0 . 4 3
0 .49
0 . 2 2
0 .39
0 . 3 3
0 .29
0 .40
0 . 2 6
0 . 4 3
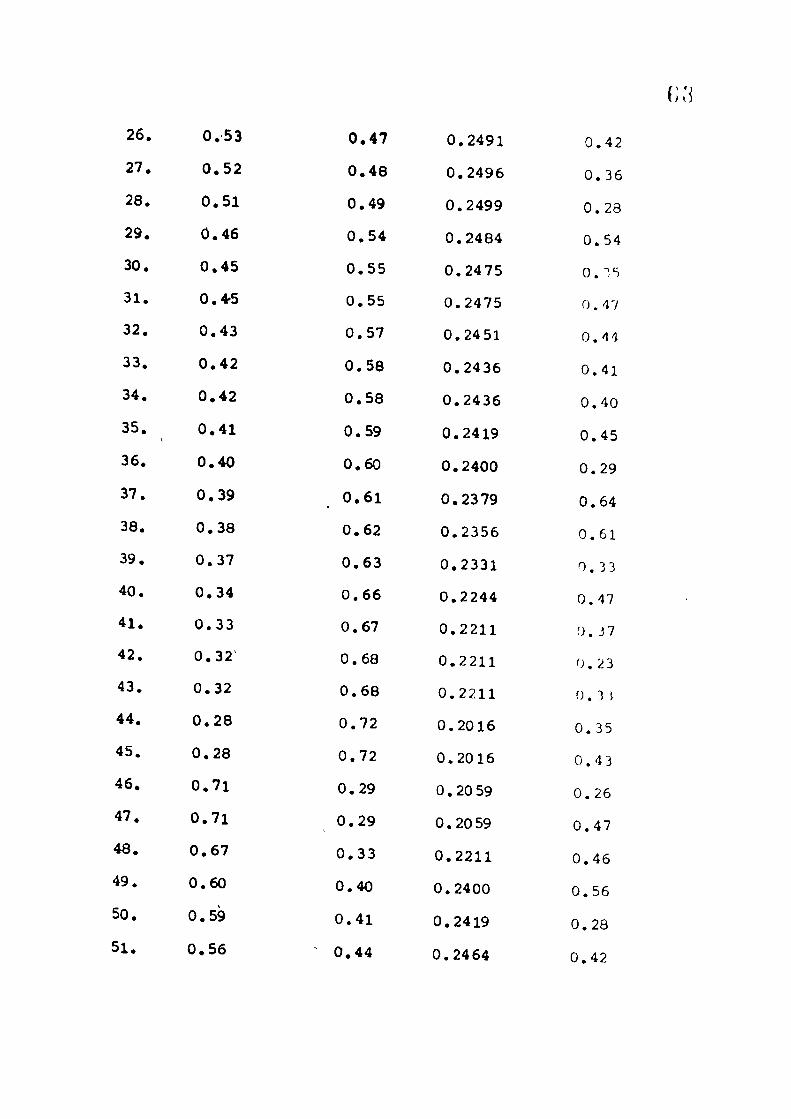
i]:i
2 6 .
2 7 .
2 8 .
2 9 .
3 0 .
3 1 .
3 2 .
3 3 .
3 4 .
3 5 .
3 6 .
3 7 .
3 8 .
3 9 .
4 0 .
4 1 .
4 2 .
4 3 .
4 4 .
4 5 .
4 6 .
4 7 .
4 8 .
4 9 .
5 0 .
5 1 .
0 . 5 3
0 . 5 2
0 . 5 1
0 . 4 6
0 . 4 5
0.4.5
0 . 4 3
0 . 4 2
0 . 4 2
0 . 4 1
0 . 4 0
0 . 3 9
0 . 3 8
0 . 3 7
0 . 3 4
0 . 3 3
0 . 3 2
0 . 3 2
0 . 2 8
0 . 2 8
0 . 7 1
0 . 7 1
0 . 6 7
0 . 6 0
0 . 5 9
0 . 5 6
0 . 4 7
0 . 4 8
0 . 4 9
0 . 5 4
0 . 5 5
0 . 5 5
0 . 5 7
0 . 5 8
0 . 5 8
0 . 5 9
0 . 6 0
0 , 6 1
0 . 6 2
0 . 6 3
0 . 6 6
0 . 6 7
0 . 6 8
0 . 6 8
0 . 7 2
0 . 7 2
0 . 2 9
0 . 2 9
0 . 3 3
0 . 4 0
0 . 4 1
' 0 , 4 4
0 . 2 4 9 1
0 . 2 4 9 6
0 .2499
0 .2484
0 . 2 4 7 5
0 . 2 4 7 5
0 .24 51
0 . 2 4 3 6
0 . 2 4 3 6
0 .2419
0 .2400
0 . 2 3 7 9
0 . 2 3 5 6
0 . 2 3 3 1
0 . 2 2 4 4
0 . 2 2 1 1
0 , 2 2 1 1
0 . 2 2 1 1
0 . 2 0 1 6
0 . 2 0 1 6
0 .20 59
0 .20 59
0 . 2 2 1 1
0 . 2 4 0 0
0 .2419
0 . 2 4 6 4
0 .42
0 . 3 6
0 . 2 8
0 . 5 4
0 . -JS
0 . 17
0 .14
0 . 4 1
0 . 4 0
0 . 4 5
0 . 2 9
0 . 6 4
0 . 6 1
0 , 3 3
0 .47
0. 3 7
0 . 2 3
0 . 3 5
0 . 3 5
0 . 4 3
0 . 2 6
0 . 4 7
0 . 4 6
0 . 5 6
0 . 2 8
0 .42

> i
5 2 .
5 3 .
54 .
55.
56 .
57 .
58 .
59 .
60 .
6 1 .
6 2 .
6 3 .
64 .
6 5 .
66 .
67 .
68 .
69 .
7 0 .
7 1 .
72 .
7 3 .
7 4 .
75 .
0 . 5 5
0 . 5 5
0 , 5 2
0 . 4 6
0 . 4 5
0 . 4 5
0 . 4 5
0 . 4 3
6 . 4 2
0 . 4 1
0 . 4 1
0 . 3 9
0 . 3 8
0 . 3 8
0 . 3 8
0 . 3 7
0 . 3 7
0 . 3 6
0 . 3 5
0 . 3 1
0 . 3 0
0 . 2 8
0 . 2 7
0 . 2 5
0 . 4 5 0 . 2 4 7 5 0 . 3 0
0 . 4 5 0 . 2 4 7 5 0 . 1 9
0 . 4 8 0 . 2 4 9 6 0 . 3 8
0 . 5 4 0 . 2 4 8 4 0 . 3 4
0 . 5 5 0 . 2 4 7 5 0 . 3 2
0 . 5 5 0 . 2 4 7 5 0 . 2 6
0 . 5 5 0 . 2 4 7 5 0 . 4 6
0 . 5 7 0 . 2 4 5 1 O.SO
0 . 5 8 0 . 2 4 3 6 0 . 3 7
0 . 5 9 0 , 2 4 1 9 0 . 2 5
0 . 5 9 0 . 2 4 1 9 0 . 2 2
0 . 6 1 0 . 2 3 7 9 0 . 2 7
0 . 6 2 0 . 2 7 36 0 . 1 0
0 . 6 2 0 . 2 7 3 6 0 . 3 0
0 . 6 2 0 . 2 7 3 6 0 . 3 8
0 . 6 3 0 . 2 3 3 1 0 . !7
0 . 6 3 0 . 2 3 3 1 O.ri
0 . 6 4 0 . 2 3 0 4 0 . ? >
0 . 6 5 0 , 2 2 7 5 0 . 3 6
0 . 6 9 0 . 2 1 3 9 0 . 3 8
0 . 7 0 0 . 2 1 0 0 0 . 2 6
0 . 7 2 0 . 2 0 1 6 0 . 2 3
0 . 7 3 0 . 1 9 7 1 0 . 2 7
0 . 7 5 0 . 1 8 7 5 0 . 2 5
V p - 3 5 . 9 6 J p q = 1 7 . 3 6 6 2 ^ D « 2 6 . 0 !

•' r
4. 2.3 Estimating Reliability Coefficient:
Rel iab i l i ty of a t e s t i s defined as the 'consis tency
with which i t yields the same results in measuring whatever
i t does measuire*. What a t e s t measures may not be wh Tt Jt l->
being used to measure i . e . i t may be inval id, but i f i t qlv^-,
consistent resul ts , i t i s re l iable (Remmers and G;v]rj, VJCI) ,
Rel iab i l i ty contains a c lass of t e s t c h a r a c t e r i s t i c s .
Members of th i s c lass arei s tab i l i ty / equivalence and in tern- j :
consistency. Different techniques are used to estimate each
of these kinds of r e l i a b i l i t y . All methods involve some way
of obtaining at least two measures of the t r a i t witn the same
instrument or with different forms of the same instruner.t ari .
determining the agreement between them. The d o n e r the aqre^--
ment between the two applications of the t e s t , th? gre^jf^-r
i t s r e l i a b i l i t y . Thp w e l l known K u d n r - R l r f i n r'^Inon f-,rfniI,T
for estimating t e s t r e l i a b i l i t y (KR-20)
r - Ji-'' k -1
1 _ Ipq ^ 2
indicates that the r e l i a b i l i t y coeff ic ient depends on three
quantit ies I k , the number of items in the t e s t ; pc|, the
sum of the item variances; and •q" the variance of the ter>' 2
scores. These three quant i t ies , k , o" and T pq are neces3':3
r i l y re lated. Larger the value of k in genera l , la rger trie

(;c
value of ^pq and ^ ; hence larger the value of KR-20. So,
reliability of a test can be improved by increasing the
number of test items.
2 If the value of T from the equation
^ 6
is substituted in the equation for KR-20, it transforrr'=5 to
6 ^pq 11
K
K-1 1-
( ID )
where q « 1-p
This formula needs three q u a n t i t i e s for computing r e l i a b i l i t y
c o e f f i c i e n t , namely, the number of items K, ^pq and ^D. AJ
these q u a n t i t i e s are a v a i l a b l e with us ( s e e t a b l e 4 . 3 ) . v/e
have
K B 75, ^pq m 17.37, J^D = 2 6 . 0 5 .
Subst i tut ing these va lues i n the above e q u a t i o n , we oh^nin
11 75
75-1
.8578
.86
1-6 X 17.37
678.60
This value of r e l i a b i l i t y c o e f f i c i e n t KR r..86 i s
f a i r l y s a t i s f a c t o r y . This KRJQ formula as modif ied by 2
substituting (X D) for cj- in the original formula gives th
lower bound of the reliability coefficient. This means that
reliability coefficient computed by other methods may be mor"
than, this value except for chance errors.

C H A P T E R - V
FINAL ADMINISTRATION AND DATA ANALYSIS

( > • ;
FINAL ADMINISTRATION AND DATA ANALYSIS
T e s t c o n s t r u c t i o n i n v o l v e s s e v e r a l s t e p s to be f o L l o w e .
i n a s y s t e m a t i c and l o g i c a l o r d e r . A f t e r p lann ing t h e t e s t ,
i t ems are c o n s t r u c t e d , t r i e d out on a r e p r e s e n t a t i v e qrimple
and i t e m a n a l y s i s i s c o n d u c t e d . The p r o c e s s o l ILem a n n l y n l T
has been e jq j la ined , i n d e t a i l * i n the p r e v i o u s c h i a p t e r . A f t e r
s e l e c t i n g a f i n a l s e t of t e s t i t e m s on t h e b a s i s of i t em -in;^!/-
s i s data* t h e f i n a l v e r s i o n o f the t e s t was a d m i n i s t e r e d t o
another l a r g e and r e p r e s e n t a t i v e sample o f t h e p o p u l a t i o n . Th i c
p r o c e s s i s normal ly c a l l e d f i n a l a d m i n i s t r a t i o n . The main
purpose of f i n a l . a d m i n i s t r a t i o n i s to compute c e r t a i n s t a t i s t i c s
c a l l e d norms. As ment ioned i n the t h i r d c h a p t e r , t h e f i n a l
sample i n the p r e s e n t s tudy c o n s i s t e d of 300 s t u d e n t s , 17 5
f emale s and 125 m a l e s . The d i s t r i b u t i o n s of s c o r e s f o r boys
and g i r l s were s t u d i e d s e p a r a t e l y and s e x d i f fc r '^nf <D w^ro
examined. The d e t a i l s of raw s c o r e d i s t r i b u t l o n n and subne^u'^T '-
a n a l y s i s o f d a t a are g i v e n i n t h e f o l l o w i n g s e c t i o n s .
5 . 1 STUDY OF SCORE DISTRIBUTIONS:
The s t a t i s t i c a l methods are u s e f u l i n r e d u c i n g a Iarg '5
bulk of data to a few convenient desc r ip t ive terms. This help- n
drawing out useful in inferences which, othei-wise v/ould not b»
poss ible . The informations are gathered by any of the several
methods of research with the aid of research tools appropriate-
to the given invest igat ion. Mc Nemar (19 62) has r i g h t l y said
the reduction of a batch of data to a few desc r ip t ive nr-a-Tur
i s the part o^ s t a t i s t i c a l analysis which should l - acl to a
v,y>
better overall comprehension of the data. In the followinq
discussion, the data related to the total sample of 300 cases
consisting of 125 boys and 175 girls of class VIII are analyz'
separately.
Besides mean, median and variances, measures of s ev/rT '
and kurtosis were also computed in each case, A simoie measur'
of skewness of a distribution can be obtained by the Eollov/in -
formula (Garrett, 1969, p. 100).
„„ 3 (mean-median) 5K K
cr where q- i s the s tandard d e v i a t i o n o f the d i s t r i b u t i o n . A l l
t h e i n d i c e s of skewness i n t h i s s tudy were computed by u s i n g
the above e q u a t i o n .
There are frequency d i s t r i b u t i o n s wh ich a r e l e s s o r
more 'peaked* than the normal c u r v e . The t e rm ' K u r t o s l n *
r e f e r s to the •peakedneaa' o r f l a t n e s s of a curv^ i . A f o r m j l o
for measur ing k u r t o s i s i s g i v e n by the e q u a t i o n ( G a r r e t t 1969
p . 10 2) ,
Ku = ^
P - P 90 * 10
where Q is interquartile range and P^^ and P are 90th and
10th percentiles respectively.
5.11 Boys* SaPiplei
The sample of boys, as mentioned earlier, consisted
of 125 cases selected from class VIII of four different
schools of Allgarh city. The test which was administered
consisted of 75 items of Biology, Physics and Chemistry

combinecl. The s c o r e s ranged from 12 to 5 8 . The mean s c o r e i s
29 and median I s 2 7 . 5 9 . The s t a n d a r d d e v i a t i o n i s 9 . 0 . The
a d j o i n i n g t a b l e No, 5 , 1 p r e s e n t s t h e s c o r e d i s t r i b u t i o n f o r
computing mean, median and s tandard d e v i a t i o n of s c o r e s f o r t)-,"-
sample o f b o y s . The v a l u e o f skewness as c o m p u t r d by th*^ ,-ifor"-
s a i d formula comes t o , 4 7 0 , which shows t h a t d i s t r i b u t i o n i s
p o s i t i v e l y skewed. A l so t h e v a l u e o f k u r t o s i s comes t o be . 2 4 1 .
Since t h i s v a l u e i s l e s s than , 2 6 3 , i t i s o b s e r v e d t h a t t h e
d i s t r i b u t i o n i s a l i t t l e l e p t o k u r t i c .
Table - 5 . 1
D i s t r i b u t i o n o f S c o r e s f o r Boys (N=i25)
I n t e r v a l . Frequency C iunu la t ive
55»59 2 1?5
50-54 3 1^3
45-49 4 1 /()
40-44 5 l i e
35-39 14 111
30-34 20 <)1
25-29 38 77
20-24 24 39
15-19 13 15
10-14 2 2
Mean=29,00 Median-27 .59 S , D . B 9 , 0 0 Skewness =0 .470 K u r t o s i s = 0 , 2 4 1

1,
;
1
1 •
V
-
1 • r - !
-1
1
•-
.
j
1
t I

r-*4
J
The distribution of scores for boys i s also shown
graphically as a frequency polygon (Fig. 5 .1 ) . The shaoe of
the frequency ploygon shows that the d i s t r i b u t i o n i r a l i t t l r
pos i t ive ly skewed, the greater concentration of sul^jocts beirr^
towards the lower end. This shows t ha t the t e s t as a v/' iole ha-.
proved to be a l i t t l e d i f f i c u l t for the sub jec t s aampled. FJo>-
ever, i t i s liVaeLy that for larger samples the d i s t r i b u t i o n Ta !
approach normality. The shape of the score distribution i s in
fact/ s imilar to the one which could be predicted froir the
distribution of d i f f icul ty values of items (Table 4.2 chapter
IV) . The values of skewness and kurtosis show tha t the curve
i s pos i t ive ly skewed and leptokurtic, that i s , i t is rnorr
peaked than the normal curve.
5.12 Girls'Sample I
The sample of g i r l s consisted of 17 5 clrin'5 v r i i q i r 1 ^
from three different schools of Aligarh, The g i r l s ' scores
ranged from 11 to 51. The mean and median of scores v/ere
29,43 and 28,46 respect ively. The standard deviat ion of
scores was found to be 0 .92,
The adjoining table No, 5,2 presents the score
distribution for computing mean, median and standard
deviation and other s t a t i s t i c s .


( I
Table -.5.2
Distribution of Scores for Girls (N-.17 5)
Interval
50-54
45-49
40-44
35-39
30-34
25-29
20-24
15-19
10-14
Freque
2
10
15
20
33
36
39
16
4
n c y Cumu] Lat: Lve Fre^(uency
vr^
173
163
148
128
95
59
20
4
Mean=:29.43 Medlan=28.46 S.Dy8.92 SkGwnesn = . 326 K u r t o s i s - .323
The d i s t r i b u t i o n of scores for y i r l o 1 B rli^o M owri
graphica l ly as a frequency polygon ( F i g . 5 . 2 ) , The nhaj-e of t-^
frequency polygon shows that the d i s t r i b u t i o n ir. rilso ^ li '*^!^
p o s i t i v e l y skewed, the grea ter concentrat ion of B\i\^y-r fr;
being towards t t e lower end. This shows, in t h i s rr,T -JIB^;,
that the t e s t as a whole has proved to be a l i t t l e d i f r i c u l t
for the subjec t s sampled. This a lso co r r e sponds to t '^ d i s t r -
bution of d i f f i c u l t y values of t e s t i tems. S inrp t o o i ' , ^ r l _
bution of d i f f i c u l t y va lues of t e s t i tems was B.I'SO p c i t i v ^ J ^
skewed the score d i s t r i b u t i o n has also fol lowed i t . In t.-ii-:
case the curve i s p l a t y k u r t i c , that i s , l e s s pf^ok'O \Y jn
the noxrmal •

12
5 . 1 3 Combined Samplei
The combined sample o f b o t h boys and g i r l s consisted
of 300 c l a s s VIII s t u d e n t s from seven d i f f e r e n t s c h o o l s of
A l i g a r h . The combined s c o r e d i s t r i b u t i o n of b o t h boys and
g i r l s ranged from 11 to 58 . The mean and median ot s c o r e s
were 2 9 . 2 5 and 28 .01 r e s p e c t i v e l y . The s tandard d e v i a ' i l o n wv.
found t o be 8 , 9 5 . The a d j o i n i n g t a b l e No. 5 . 3 p r e s e n t - ! t h e
s c o r e d i s t r i b u t i o n f o r computing mean, median, s t a n d a r d d e v i . j -
t i o n , and o t h e r s t a t i s t i c s f o r the combined s a m p l e .
Table - 5 . 3
D i s t r i b u t i o n o f Scores f o r Combined Sample (N=3U0)
I n t e r v a l Frequency C u n m l a t l v ? Fr rv, jr-n^:/
55-59 2 iOO
50-54 5 ?9M
45-49 14 /9 1
40-44 20 ?.7"
35-39 34 yV)
30-34 53 22'^
25-29 74 17?
20-24 63 9 8
15-19 29 ^'.
10-14 6 6
Mean=29.25 Median=28.01 S.D=8.95 SK = . 4 l 5 /u=.2e-
The d i s t r i b u t i o n o f s c o r e s f o r combined s a n p l e "iz -.,-.


snown g r a p n i c a l i y as a rrequency po lygon u i g . t ) . J ; . I n t h i s
c a s e •a l so t h e shape of the frequency p o l y g o n shows t i a t tr^e
d i s t r i b u t i o n i s a l i t t l e p o s i t i v e l y skewed. This sho'/;s t n a t
the t e s t a s a whole has proved to be a l i t t l e d l f i i c u l t f o r
the s u b j e c t s sampled. I t i s i n t e r e s t i n g t o n o t e t h i t > hp-
shapes o f a l l the t h r e e d i s t r i b u t i o n s a r e s i m i l a r -mo h-T/p-
f o l l o w e d the shape of the d i s t r i b u t i o n o f d i f f i c u l t y valij'--n
of t e s t i t e m s . The v a l u e o f t h e k v i r t o s i s shows t n n t t he d i - ; -
t r i b u t i o n o f s c o r e s f o r the combined sample i s a l s o I f o t o k u r t
t h a t i s , i t i s more peaked than the normal c u r v e .
5 ,14 Sex D i f f e r e n c e s »
The d i f f e r e n c e due t o s e x i s o b s e r v e d betv/t-en t .e
s c o r e s o f g i r l s and b o y s . The mean d i f f e r e n c e i s 0 . 4 3 ancj tl'
median d i f f e r e n c e i s 0 . 8 7 , A comparat ive p i c t u r e has been
p r e s e n t e d i n t a b l e 5 , 4 ,
Table - 5 . 4
Mean
Median
S.D,
Sk
Ku
Summary
Boys
2 9 , 0 0
27 ,59
9 , 0 0
0 , 4 7 0
0 . 2 4 1
S t a t i s s t i e s Showing
G i r l s
2 9 . 4 3
28 ,46
8 . 9 2
0 . 3 2 6
0 , 3 2 3
Sex D i f f e r e n c e s
Combined
2 9 . 2 5
2 8 . 0 1
0 . 9 5
0 . 4 1 5
0 . 2 50
I n o r d e r to t e s t the h y p o t h e s i s t h a t t h e r e was no
s i g n i f i c a n t d i f f e r e n c e , be tween the mean s c o r e s of rjoy; and

g i r l s t - t e s t was u s e d , !Fhe t - v a l u e was computed by u s i n g
t h e f o l l o w i n g f o r m u l a .
N^ + Nj - 2 N^ N^ /
w h e r e ,
M. and M, a r e t h^ means of boys and g i r l s ^^ ?ind 1^
a r e t h e r e s p e c t i v e s t a n d a r d d e v i a t i o n s . N^ and U^ a r e s i z e s o£
b o y s ' and g i r l s ' sampled r e s p e c t i v e l y .
The t - v a l u e was ^ound t o be 0 . 4 0 9 , wh ich vjas n o t s i g n i
f i c a n t showing t h a t t h e a v e r a g e p e r f o r m a n c e of boyn and g i r l s
was n o t d i f f e r e n t on t h ^ t e s t c o n s t r u c t e d .
5 , 2 DEVELOPMENT OF NORHS:
Since raw scores ^^ d i f fe ren t t e s t s are exproir.ed in
d i f f e r en t u n i t s , i t i s d i f f i c u l t to i n t e r p r e t nn<l rrjmprne rgv/
scores on d i f f e r en t t e s t s or on the same t e s t . For > xajnol?-,
when Ram has a score of 60 on the a r i thme t i ca l reasoning tes*-,
i t would not mean tha t Barn's score i s super ior on arlthmotic--) ]
reasoning to tha t on verPal reasoning. This s i t u a t i o n a r i s e s
because of the lack of'^ reference po in t , A commonly adopted
method i s to compare an examinee's t e s t score with the score^
of a spec i f i c group calJ^cl the normative group, on tha t t e s t .
This process i s known a^ norm referencing. When raw scores ar'
mpared with the norms a s c i e n t i f i c meaning emerges. Norms may
be defined as the avera9® performance on a p a r t i c u l a r t e s t m-i' '
by a s tandard iza t ion sartiple. By a s tandard iza t ion samrJe i s

meant a sample which i s true representa t ive of the conula t lo r .
and takes the t e s t for the purpose of providing da t a f or
comparision and subsequent i n t e r p r e t a t i o n of s c o r e s .
Commonly, four d i f f e r e n t types of norms rir* ^ •j'-,"0 In
prac t i ce - age norms, grade norms, standard score riornr; -jrij
I>ercentile (rank) norms. Age norms are most s u i t e d to those
t r a i t s or a b i l i t i e s which increase s y s t e m a t i c a l l y v/Itfi ngo
such as some physical t r a i t s l i k e height and weigt i t . The grao
norms which i n d i c a t e the grade l e v e l s at which the performance
of representa t ive groups i s average, A norm which i s based on
standard scores i s c a l l e d standard score norm. In t h i s p roces
raw scores are converted in to standard scores by a l in 'aar
transformation which does not change the shape of the d i s t r i
bution and simply s h i f t s the zero point o r the o r i j i n . The
s imples t standard scores are z - scores which can be o b t a i n e d
by a simple equation
X - M Z a —
cr whei^ z i s the transformed score
X i s the raw score
M and ^ are mean and standard d e v i a t i o n of t i '} s c o : ' '
r e s p e c t i v e l y . This transformation r e s u l t s in z - scoces which
invo lve negat ive numbers and decimal f r a c t i o n s . To avoid v
complicat ions the z - scores can be subject^^d to a f u r t n ^ r
l i n e a r transformation r e s u l t i n g in T - s c o r o s . The T-scores ar^
obtained by transforming the scores to a new mean of 50 and j
new standard dev ia t ion of 10, by the followinq '^qu^ti^^n.

T - lOz + 50
There are severa l other forros of s t a n d a r d sco re norms.AltheUQ^
standard score norms are simple to be computed y e t t\e i n v e s t i
gator preferred to use p e r c e n t i l e norms i n s t e a d of gny otyier
types of norms,
5 .21 P e r c e n t i l e Norm^»
P e r c e n t i l e norms are the most popular and corn/non typos
of norms used i n educat ional and psycho log ica l measurement. For
each raw score , a p e r c e n t i l e norm (rank) of a score i n d i c a t e s
the percentage of persons whose scores f a l l below t h a t raw
scores . For example, suppose Shyam has a score of 45 on a
verbal reasoning t e s t and i f 6096 of the pe r sons inc luded In
the sample secure below the score of 45, we say t l .a t oo rcen t i l - -
rank of the score 45 i s 60, This r e l a t i o n i s expressed as
PR45 - 60
I t i s to be noted here that 60 i s the p e r c e n t i l e rank of thF>
score 45, but 45 i s 60th p e r c e n t i l e . This r e l a t i o n i s exp re s s - ' ]
as
^ 0 - *^
5.22 Confutation of Percent i l e Rankat
Since we wanted to f ind p e r c e n t i l e r anks for o.-r h of
the raw scores in a l l the d i s t r i b u t i o n s , we needed a convenie ' - t
method. The fo l lowing method was usedi supoose , we wish to
f ind the p e r c e n t i l e rank of a score X i n t h e d i s t r i b u t i o n , we
would use the. fo l lowing formula (Singh 1986, p. 530) .
P.R - QQ 1 P + ( )<r - L ) f • N " I "

((
Table -5.5
Distribution of ROw Scores for Sample of Boys (N t= 125)
CF PR C.f
58
57
56
55
54
53
52
51
50
49
48
47
46
45
44
43
42
41
40
39
38
37
36
1
0
1
0
0
,0
0
1
2
0
2
0
2
0
0
1
2
6
125
124
124
123
123
123
123
123
122
120
120
119
118
117
116
U 5
113
113
111
111
111
110
108
99.60
99.20
98.80
98.40
98.40
98.40
98.40
98.00
96.80
96.00
95.60
94.80
94.00
93.20
92.40
91.20
90 .40
89.60
88.80
88.80
88.40
87.20
84.00
35
34
33
32
31
30
29
28
27
26
25
24
23
22
21
20
19
18
17
16
15
14
13
12
5
6
2
5
3
4
7
8
6
10
7
9
4
4
3
4
7
1
3
1
1
1
0
1
102
9 7
9 1
89
84
•81
77
70
62
56
46
39
30
26
22
19
15
8
7
4
3
2
P .R
7 9 . 6
7 ^ . . ? '
7 2 . 0 0
6 9 , 20
66.00
6 3 . 2 0
5 8 . 8 0
5 2 . 8 0
4 7 . 2 0
4 0 . 8 0
3 4 . 0 0
2 7 . 6 0
2 / . 10
19 . 20
] 6 . 4 0
1 3 . 6 0
9 . 2 0
6 . 0 0
4 . 4 0
2 . 8 0
2 . 0 0
1 .20

78 T a b l e - 5 . 6
D i s t r i b u t i o n o f Raw S c o r e s f o r Sample o f G i r l s {N-17 5)
P C . f P . R X F C . F P . R
S 6 . 14
^ .1 .00
4 6 . 4 5
4 3 . 0 0
3 8 . 4 7
3 4 . 7 7
3 0 . 4 9
2 5 . 9 3
? 1 . 0 9
1 5 . 6 7
1 ^ . 5 4
1 0 . :> 6
7 . 7 0
'>. 70
1 . 5 6
' '^.13
] . 9 9
1 . 7 1
1 .14
0 . 7. -'.
50"
49
48
47
46
45
44
43
42
41
40
39
38
37
36
35
34
33
32
31
0
1
4
2
3
0
1
4
4
5
1
6
2
4
1
7
5
3
8
10
17 5
1 7 3
173
172
1 6 8
166
163
1 6 3
162
158
154
149
148
142
140
136
135
1 2 8
123
120
112
9 9 . 1 8
9 8 . 6 1
9 8 , 3 2
9 6 . 9 0
9 5 . 1 9
9 3 . 7 6
9 2 . 9 1
9 2 . 6 2
9 1 . 2 0
8 8 . 9 2
8 6 . 3 5
8 4 . 6 4
8 2 . 6 5
8 0 . 3 7
7 8 . 6 6
7 7 . 2 3
7 4 . 9 5
7 1 . 5 3
6 9 . 2 5
6 6 . 1 2
6 0 . 9 9
30
29
28
27
26
25
24
23
22
21
20
19
18
17
16
15
14
13
12
11
7
11
5
7
9
4
11
5
12
7
4
4
5
2
2
3
1
0
2
1
10 2
9 5
84
79
72
63
59
4 8
43
31
24
20
16
11
9
7
4
3
3
1
X « Raw Score, P « Frequency, fc,fr= Cumulative Frequency,
P.R.- Percentile Rank

Table - 5 . 7
D i s t r i b u t i o n o f Rdw s c o r e s f o r combined s ample (N=300)
C . f P.R X
300
229
299
296
298
298
298
. 298
295
293
292
287
284
280
279
277
271
267
260
259
253
250
244
237
• •
58
57
56
55
54
53
52
51
50
49
48
47
46
45
44
43
42
4 1 ,
40
39
38
37
36
35
" 1
0
1
0
0
0
0
3
2
1
5
3
4
1
2
6
4
7
1
6
3
6
7
12
9 8 . 8 3
9 8 . 6 7
9 8 . 5 0
9 8 . 3 4
9 8 . 3 4
9 8 . 3 4
9 8 . 3 4
9 7 . 8 4
9 7 . 0 2
9 6 . 5 2
9 5 . 5 3
9 4 . 2 1
9 3 . 0 6
9 2 . 2 3
9 1 . 7 4
9 0 . 4 2
8 8 . 7 7
8 6 . 9 5
Q 5 . 6 3
8 4 . 4 8
8 2 . 9 9
8 1 . 5 1
7 9 . 3 6
7 6 . 2 3
34
33
32
31
30
29
28
27
26
25
24
23
22
21
20
19
18
17
16
15
14
13
12
* 11
f
11
5
13
13
11
18
13
13
19
11
20
9
16
10
8
11
6
5
3
4
2
0
3
1
C . f
225
214
209
19 6
183
172
154
141
128
109
9 8
78
09
53
43
35
24
18
13
10
6
4
4
1
P .R
7 2 . 4 3
69 . 79
0 6 . 8 2
6 2 . 53
5 8 . 5 7
5 3 . 7 9
4 8 . 6 7
4 4 . 38
3 9 . 1 0
3 4 . 1 5
2 9 . 0 4
2 4 . 2 5
2 0 . 1 '>
1 5 . 8 4
1 2 . 87
9 . 7 3
6 . 9 3
S . l l
3 . 7 9
2 . 6 4
1 . 6 5
1 . 32
0 , 8 /
0 . 1 '

80
where,
N «• Tota l ntimber o f s u b j e c t s .
F B Cumulative f r e q u e n c y of the s c o r e n e x t lov/er
than the g i v e n s c o r e .
X • Haw acoro under c o n s i d e r a t i o n .
L • Lower l i m i t of the s c o r e X.
i • C l a s s i n t e r v a l ,
f « Frequency of the g i v e n raw s c o r e .
Suppose , f o r t h e d i s t r i b u t i o n of b o y s ' s c o r e s (Tabl^,. ' ,)
we want to compute the p e r c e n t i l e rank o f t h e s c o r e . We have
PR(25) a 100 39 + ( 2 5 - 2 4 . 5 ) X 7 . l 2 l L 1
a 200. 39 + \ . 5 x 7 ] 125 l 1 J
4 3 9 + 3 . 5
T- L - j . X 42^5 „ 4 X 8 ,50
5
« 3 4 . 0 0
A l l t h e p e r c e n t i l e ranks were computed by t : . i ." , - , ' t roa.
The r e s u l t s a r e shown i n t a b l e 5 . 5 , 5 . 6 and 5 .7 foi t ." -ci/npi^
of b o y s , g i r l s and combined r e s p e c t i v e l y . By u s i n g th-.-^- t a h l
the i n d i v i d u a l raw s c p r e s can be i n t e r p r e t e d . These t a b l e s
can be used by r e s e a r c h e r s i n f u t u r e .
5. 3 ALTERNAUVE RELIABILITY COEFFICIENTSt
The r e l i a b i l i t y o f the t e s t was e s t i m a t e d i n • 'nnpt '^r J /
by u s i n g m o d i f i e d KR 20 formula . The c o e f f i c i e n t of r ' , 1 >- \\\
was found to be 0 . 8 6 which i s f a i r l y s a t i s f a c t o r y . I t v/^is

81
considered appropriate to compute r e l i a b i l i t y coe f f i c i en t s by
some alternative methods at t h i s stage. The es t imates of r e l i a
b i l i t y to be mentioned here are based on f ina l scores obtained
after admlnlstlring the text to 300 subjects .
' An estimate of interval consistency waa rnndfj t.hco jqh t,rc.
Rulon (19 39) formula which provided the r e l i a b i l i t y of the whr,i< -
t e s t on the basis of proportion of error variance in t o t a l v a r i i -
nce of the t e s t . As per reqxilrements of Rulon formula the t e s t
was divided into two equal halves by using the odd even method.
This means that an Individual's total score was broken in to t//o
components/ one based on odd numbered items and another based
on even numbered items. The difference between thie two nror^.n
i s an estimate of error of measurement. The varLinr-e ot these
errors was used as an estimate of error var iance . The formul'i
i s given by the equation
'u - 1 - ^
2
;d_
2
^ t
whereT. i s the variance of the total scores and ^ i', the
variance of difference scores based on odd and even halves .
By substituting the Values of these q u a n t i t i e s we have
r - 1 - i i i J l 11 77.39
» 0.82
Another method of estimating r e l i a b i l i t y was qiven by
Flanagan (19 37), The formula i s similar to t ha t of Rulon.

', 'J (jfi
The only difference Is that here error variance Is estimated
as the sum of component variances based on odd and even halves,
The formula is given below:
where
r i s the r e l i a b i l i t y coe f f i c i ent . 11 2
j" is the variance of total score. 2
Q- i s the variance of odd half s c o r e s .
1
Q-2 i s the variance of even half s c o r e s . Sxibstituting the values of these q u a n t i t i e s we have
r - 2 ( 1 - 21 ,73t24 ,p5 ) 11 77,39
- 0.82
Fortunate ly , a simple est imate of KR 20 formula knov/n
as KR 21 i s ava i lab le which can be e a s i l y app l i ed w t t i th^'
help of the data ava i lab le from the f i n a l cidmlni.strat ion of
the t e s t . This i s based on the assumption t h a t ma jo r i t y of
t e s t items have d i f f i c u l t y v a l u e s around . 5 0 . The formulQ
i s as g iven belowt
r = _iL. 11 n-l
1 -
where 2
<0~ i s the t o t a l t e s t score variance
n i s the number of i tems in t h e . t e s t

< • ) '
) O
M i s the mean of t e s t s c o r e s .
Subst i tut ing the va lues of these q u a n t i t i e s we have
r - 75 \ l - 29.25 (75-29.25) 11 '5^ L 75x8.95x8.95 -
- 0.79
The c o r r e l a t i o n between odd and even ha lves of the
t e s t was found to be. 0 ,691 which provided t he s o l i t h^ilf
r e l i a b i l i t y of half the t e s t . The r e l i a b i l i t y of the whole
t e s t can be coinputed by Spearman Brown formula as given below
(Guilford, 19 54)
2r
11 1+r
» 2x0.691 = 0.82
140.691
l^hese values of r e l i a b i l i t y c o e f f l c i e n L nr^^ l ^ss t'.rir.
the one es t imated by the KR 20 formula. The dif fer^inc^ rnrT/
be par t ly due to sampling errors and p a r t l y due to t^e
fac t that d i f f i c u l t va lues of items varied from .25 to . 7 5 .
However the r e s u l t s shown t h a t the f i n a l v e r s i o n of the
t e s t has a f a i r l y high r e l i a b i l i t y .

C H A P T E R - VI
FINDINGS AND IMPLICATIONS

hi
The previous f i v e chapters a re devoted to the d i scuss io r i
of the t h e o r e t i c a l background, need and r a t i o n a l e of the s t u d / ,
methodology, c o l l e c t i o n and ana lys i s of d a t a . Once th^^ da t a
have been analysed s t a t i s t i c a l l y , c e r t a i n inferencer> r^m be
drawn on the bas i s of s t a t i s t i c a l r e s u l t s . Tlie i,tn:nni ^•h-ir>t.'r.
which of course i s the l a s t one, i s devoted to enliBtriif. nt and
d i s c u s s i o n of f indings which emerged as a r e s u l t oi da te analy^.^; .
Findings of a research study are worthless u n l e s s they have
useful impl i ca t ions for the phenomenon under .study. Likewise ,
a tesearch study i>|fueducation must have c e r t a i n impl i ca t ions
for educat ional p r a c t i c e s and research. The fo l lowing s e c t i o n s
h igh l ight the f indings of the present study and t h e i r i m p l i c a t i o n s
6.1 FINDINGSt
The fol lowing f ind ings emerged from the s t udy :
1, As mentioned in t he fourth chapter, the Drel lmlnory form -< f
the t e s t c o n s i s t e d of 103 mult iple choice type J f - r r s . Ai^'r
item a n a l y s i s , 75 items could be reta ined for the f i n a l for
of the t e s t and the o ther 28 items were r e j e c t e d , /-lost of
the items i n the r e j e c t e d category were t hose bnned on
higher i n t e l l e c t u a l a b i l i t i e s , s ince t hey proved to be
d i f f i c u l t and non-discr iminat ing .
2. The f a c i l i t y va lues of s e l e c t e d items v a r i e d from 0.25 to
0 . 8 2 . However, very easy and very d i f f i c u l t i tems were
r e l a t i v e l y small in number. The average i tem f a c i l i t y valu"^
was found to be 0 . 4 8 . The d i s t r i b u t i o n of i tem f a c i l i t y
values was p o s i t i v e l y skeweti which shows t h a t the num>j r

of items with f a c i l i t y value l e s s than average was l e s s
than thosiB with f a c i l i t y value more than the average . This
provided an i n d i c a t i o n that the score d i s t r i b u t i o n would
a lso be p o s i t i v e l y skewed.
a. Generally* the items with d i scr iminat ion power over 0.30
were considered appropriate, but a few i t ems with lower
di scr iminat ion power were a l so accepted s i n c e they provided
good f a c i l i t y value and appeared to be good i tems as f a r a.-,
q u a l i t y and content was concerned. The h ighes t d i s c r i m i n a t i o n
power was 0 .64 and the lowest was 0 , 1 9 .
4, Item a n a l y s i s data were used to e s t imate or predict c e r t a i n
t e s t c h a r a c t e r i s t i c s . The t e s t score mran as p r e d i c t e d fror
item a n a l y s i s data was 36 .00 , S imi lar ly , the p r e d i c t e d va i ." j
of standard dev ia t ion was 10 .63 . These v a l u e s v/"re l a t e r or
compared with the corresponding va lues o b t a i n e d a f t e r fin-M
administrat ion of the t e s t on a d i f f e r e n t sample.
5, The t e s t , i n i t s f i n a l form proved to be h igh ly r e l i a b l e .
The c o e f f i c i e n t of r e l i a b i l i t y was obtained by using modifl^-3
form of KR io formula. The obtained value of r e l i a o i l i t y
coe f f i c i i ent was 0 .86 . This shows that 06% of tf»e t o t a l tcT'-
variance i s true variance and the remaining 14% of the
variance i s error var iance .
6, This f inding suggests t h a t standard error of measurement
as computed by the formula CT \ l - r . , i s equa l to 3.'>8 or . , '^ 11
about 4 score p o i n t s ,
7. The d i s t r i b u t i o n of" scores based on the oaunole of i;>5

h(J
boys was found to be p o s i t i v e l y skewed w i th a mean of
29,00 and standard d e v i a t i o n of 9 . 0 0 . These r e s u l t s
show that the t e s t proved to be d i f f i c u l t for boys.
This was, c l e a r from the shape of the d i s t r i b u t i o n of
f a c i l i t y Values of the s e l e c t e d i t ems .
8 . For the sample of g i r l s (N-175) a lso t h e d i s t r i b u t i o n of
scores was p o s i t i v e l y skewed showing t h a t trie t e s t was
d i f f i c u l t for them a l s o . The mean performance of g i r l s
was 29.43 with a standard dev ia t ion of 8 .92 . In t h i s
case the d i s t r i b u t i o n was found to be p l a t y k u r t i c .
9 . In the case of combined sample of boys and g i r l s (N=300)
the mean score was 29.25 with a standard d e v i a t i o n of
8 . 9 5 . The d i s t r i b u t i o n was p o s i t i v e l y skewed. This a l s o
showed that the t e s t was d i f f i c u l t for tne sample
s tudied . The kurtos i s of the d i s t r i b u t i o n shov/' 'd t h a t
the d i s t r i b u t i o n was l e p t o k u r t i c .
10. When the performance of boys and g i r l s was corroarcci, i t
was found that no s i g n i f i c a n t d i f f e r e n c e cxi-^it:; . ••• t/'^•';r.
the mean scores of boys and g i r l s . This was done uy
using t - t e s t . The t - v a l u e was found to be .i.'i09 whic j
was not s i g n i f i c a n t even at .05 l e v e l ,
11. In order to i n t e r p r e t the raw scores , p e r c e n t i l e rank
were computed. These p e r c e n t i l e ranks v/ere comouted for
boys, g i r l s and combined sample s e p a r a t e l y . The r e s u l t s
have been presented i n the tab le s 5 ,5 , 5.6 an; " .7
r e s p e c t i v e l y .

(> f
12, In order.to verify the r e l i a b i l i t y of thp t e s t , KR 21
formula was applied on the scores obtained a f te r f ina l
administration. The value of r e l i a b i l i t y coe f f i c i ' nt
so obtained was 0.79 which i s 0.07 l e s s tnan tr.e one
obtained from KR 20 formula. This small differ*^nee i s
dxie to sampling f luctuations.
13, T?he r e l i a b i l i t y of the t e s t was also estimnted by using
s p l i t half method on the f inal t e s t scores. The re l iab i
l i t y of the whole t e s t was estimated by using Spearman
Brown formula. The f inal value was 0 .82.
14, Two more a l t e r n a t i v e methods were used to v e r i f y t h e
r e l i a b i l i t y c o e f f i c i e n t s / one was Rulon formul-i er,d
a n o t h e r was Flanagan formula . Both t h e approacho5j
p r o v i d e d a r e l i a b i l i t y c o e f f i c i e n t o f 0 . 8 2 .
6 , 2 EDUCATIONAL IMPLICATIONS:
The f i n d i n g s oC the p r e s e n t s tudy l i s t r - d ^-^cym hiv^
c e r t a i n s i g n i f i c a n t i m p l i c a t i o n s f o r e d u c a t i o n a l o r a c t i c e s .
The f i n d i n g t h a t most o f t h e i t e m s r e j e c t e d a f t e r i t e m a n a l y ^ j
were t h o s e which measured h i g h e r i n t e l l e c t u a l a b i l i t i e s p u t s
a q u e s t i o n mark on b o t h c u r r i c u l u m p lann ing and t e a c h i n g
t e c h n i q u e s . The s t u d e n t s are unable t o s u c c e e d on t h e s e i t e m s
because t h e y a r e not t a u g h t t h a t way. The c u r r i c u l u m p l a n n e r s
and t e a c h e r s probably emphas i se o n l y lower l e v e l men ta l
f u n c t i o n s such as r e c a l l , r e c o g n i t i o n , memory and s i m p l e
a p p l i c a t i o n s . The t e x t b o o k s , c u r r i c u l u m and t e a c h i n g me tnods
need to be improved so t h a t h i g h e r i n t e l l e c t u a l a b i l i t i e s

(y.
such as understanding, a p p l i c a t i o n ^analys i s , synti-iesis and
evaluat ion are given due cons idera t ion . The t e a c i e r snould
fol low inquiry methods in teaching so that s t u d e n t s are
motivated to think c r i t i c a l l y and c r e a t i v e l y . For th in
purfxjse the e n t i r e system needs to be revamped.
Even on the items which were s e l e c t e d for in'- lunion
i n the f i n a l form of the t e s t , the performance of the Btudentr,
was not s a t i s f a c t o r y , Altliough the s e l e c t e d itemn w< >re based
on lower c o g n i t i v e a b i l i t i e s y e t the score d i s t r i b u t i o n was
p o s i t i v e l y skewed. This shows that the o v e r a l l l eve l of achi*^'-
vement was poor. The teaching work was not b e ing done p r o p e r l y ,
The performance l e v e l of boys and g i r l s was t h e sane shov/lng
that the e x i s t i n g curriculum and teaching method's were e q u a l l y
i n e f f e c t i v e for both boys and g i r l s .
The t e s t has given a high r e l i a b l l H y cc/ f f l ^ i ' rit. Tnr>
r e l i a b i l i t y c o e f f i c i e n t computed by various methodr. VTT/led
from 0,79 to 0 , 8 6 . The average value was al-out ^).'^'/.. Tho
standard errxjr of measurement was only 4 s co re p o i n t s . ThiT
Can help in e s t imat ing the true t e s t score of an j n a i v i .>\^\
from his obtained score. I f a raw score i s m u l t i p l i e d wy
square root of r e l i a b i l i t y c o e f f i c i e n t ( index of r e l i a b i l i t y ) ,
an est imate of true score i s obtained. In t e rms of p r o o a b i l i ^
a confidence in terva l for a true score correspond!n'j to a giv'^-
iTaw score can be computed. Suppose a p e r s o n ' s ob t a ined score
i s 45, There are 95% chances t h a t h i s true s co re w i l l l i e
between 37 and 53, that i s 45^8, S imi lar ly , t h e r e .-jre 'rpA

^:i
chances t h a t h i s t r u e s c o r e l i e s between t n e l i m i t s 4 5+i;^,
i . e . 33 and 57 , I n t h i s way a l l the o b t a i n e d s c o r e s can be
i n t e r p r e t e d .
The s t u d y a l s o p r o v i d e s the p e r c e n t i l e rnnkn for
i n d i v i d u a l s c o r e s f o r b o y s , g i r l s and f o r t h e combined
sanple s e p a r a t e l y . These p e r c e n t i l e rank t ? i b l e s can be
v e r y u s e f u l f o r f u t u r e r e s e a r c h e r s f o r i n t e r p r e t i n r j inclividu':» 1
raw s c o r e s . Suppose the t e s t i s a d m i n i s t e r e d t o a sample of
s u b j e c t by a f u t u r e r e s e a r c h e r and a p a r t i c u l a r i n d i v i d u a l
s p o r e s 4 3 . I t can be seen from the t a b l e o f p e r c e n t i l e ranks
i f h i s performance i s s a t i s f a c t o r y o r n o t . The p e r c e n t i l e
rank o f t h e s c o r e 43 i n d i c a t e s the p e r c e n t a g e of p e r s o n s s c o r i ;
below t h i s p e r s o n . Such an i n t e r p r e t a t i o n p r o v i d e s a c l e a r
p i c t u r e of h i s r e l a t i v e p o s i t i o n i n h i s own g r o u o . Th is
assumes t h a t the new sample comes from the same o o o u l a t i o n
from which the o r i g i n a l normat ive sample w i s drnv/n.
6 . 3 IMPLICATIONS FOR RESEARCH!
Every r e s e a r c h s tudy i s founded on t he f i n d i n g s of o l d
and r e l e v a n t r e s e a r c h s t u d i e s and has i n t u r n e x t r e m e l y u se f . :
i m p l i c a t i o n s f o x f u r t h e r r e s e a r c h i n t h a t a r e a . The f i n d i n g s
o f the p r e s e n t s tudy l i s t e d i n the s e c t i o n 6 . 1 a l s o have c e r t - i
i m p l i c a t i o n s f o r f u t u r e r e s e a r c h . The s t u d y p r o v i d e s v^ ry
u s e f u l d i r e c t i o n s which c a n be p r o f i t a b l y u sed by f u t u r e r e s e
a r c h e r s , some o f t h e s e d i r e c t i o n s are d i s c u s s e d i n d e t a i l i n
the f o l l o w i n g , p a s s a g e s .

!)U
As mentioned ear l ier , the norming of the t e s t was
carried out on a small sample with only 300 sub jec t s . The
norms based on such a small sample can not be much dependable.
Hence, further research can be conducted to develop the t e s t
norms on a larger sample consist ing of 2000 to 3000 s u b j e c t s .
Norms based on such a large sample wi l l more useful and
dependable, and the t e s t wi l l become suitable for a wider use.
Moreover, the present study provides only one type of norms
that i s , percentile ranks. I t i s possible and needful to
conduct further research to find age norms, grade norms
and standard score norms. This wi l l increase the appl icabi l i ty
of the t e s t on different age groups and grade l e v e l s .
I t has also been mentioned elsewhere t ha t the study
was conducted only on urban children by se lec t inq chdldren
from schools of Aligarh c i t y only. If a study i s condurted
on urban population i t s norms and other s t a t i s t i c a l rna rac -
t e r i s t i c s may be different . Another interest ing study can be
a comparison between rural and urban populations. If compara
t ive studies are conducted by taking into account pupils from
different socioeconomic status groups, the finding VJH] be
more useful and enlightening. There are a large number of
personal and familial variable that can be s tudied in r e l a t i o n
to achievement in science and the present t e s t can be used in
such studies . The t e s t can be used in large scale survey
studies conducted in order to assess achievement in science
of a large population.

Ul
Academic achievement i s a very important psychological
variable that influences several aspects of human behaviour.
Relationship between academic achievement and o ther psycholoqice:
variables such as in te l l igence , aptitudes, interes|I,q, r^ttituden
and personality factors are very useful in predlctln-j htirnan
behaviour in controlled and natural s i tuat ions . The knowledge
of such relationships can be used to ident i fy s t rengths and
weaknesses of children and to provide them educational and
vocational guidance. For instance, the degree of relationship
between achievement and inte l igence or aptitude can be used
to identify, underachivers in science. Research s tud ies can
be conducted to identifj^ such children so t ha t b e t t e r teaching-
learning s i tuat ions may be planned to help them.

B I B L I O G R A P H Y

BIBLIOGRAPHY
Bountra, R.K.
Coffman, W, E.
Construction and standardisation of
achievement tests in Physical Sciences
(Physics and Chemistry) for Hlqh School
classes in U,P., Ph.D. Edu. Aqra
Univ. 1970.
Essay examlnatlona in R.L. Thomdike,
Educational Measurement/ American Council
of Education, Washington, D.C. I97i.
Factorial Nature of numerical aptitude
and its bearing on Mathematical learning.
Unpublished Ph.D. Thesis B.H.U. 193G.
The relation of items discrimination of
test reliability, Journril of Educational
Measurement, 1967, 4, 3, 125-17M.
Education Commission (1964-66); Ministry of Educition, Govt.
of India, N. Delhi. 1966.
Dubey, V.K.
Ebel, R.L.
Flanagan, J.C,
/Fz raser and Gillan
A proposed procedure for increasing tne
efficiency of objective tests. J. Edu.
Psy. 1937, 28, 17-21.
The principles of objective testing in
mathematics, Heinemann Education Books,
London, 1972.

G a r r e t t and Woodworth, S t a t i s t i c s i n Psychology and Educa t ion ,
Vak i lS / F e f f e r and Simons Pvt . L td .
Bombay# 1969,
G la se r , R ^nd Nitko* A.J , Measurement i n l e a r n i n g and i n s t r u
c t i o n i n R,L, Thomdike, Educa t iona l
Measurement, American Council of
Educa t ion Washington D,C. 19 71 .
Gronlundij/( N,D,
Gu i l fo rd , J . P .
Gupta# J . S ,
Henrysson, S,
Husen, T, ^'
Measurement and E v a l u a t i o n i n
Educa t i on . 1985,
Psychometr ic methods, Mc Graw H i l l
P u b l i s h i n g Co,Ltd, Bombay/ 19 54.
C o n s t r u c t i o n and s t a n d a r d i s a t i o n of
the a t t a i n m e n t t e s t i n General Science
for c l a s s VIII ( i n Hindi) Ph.D. , Psy.
Agra Univ. 19 62.
G a t h e r i n g , Analysing and using d a t a
on t e s t i tems i n R.L, Thomdike (Ed)
Educa t iona l Measurement. American
Counci l on Ed\x:at ion. Washington, D.C.
1971,
I n t e r n a t i o n a l s tudy of achievement i n
mathemat ics . New YorkJ Wiley, 19 67.

Islam, M,F.
Kelley, T.L.
Construction and s t a n d a r d i s a t i o n of an
attainment t e s t i n Gen.Science fo r
s tudents of c l a s s VII of Bihar, Ph.D.
Edu.Patana Univ. , 197 5.
The s e l e c t i o n of upper and low<^r qrouon
for the v a l i d a t i o n of t e s t i t ems .
Journal of Educational Psychology, 19 39,
30, 17-24.
Lo td, F.M. and Novick,M,R, S t a t i s t i c a l t h e o r i e s of mental t e s t
s c o r e , Reading, Massi. Addison.Wesley,
19 68.
Mc Nemar, Q, Psychologica l s t a t i s t i c s , Jolm vJliey
and Sons, I n c . , New York and London, 1962,
National Po l i cy on Education - Ministry of liumnn !(e'-.M^JT' '
Development. N. De lh i . 1986.
Nunnally, J .C,
Reramers and Gage,
Rulon, P.J ,
Psychometric theory Mc.Graw H i l l s , 19 8 1 .
A p r a c t i c a l Introduct ion t o measurernent
and eva luat ion , Universal Book S t a l l ,
Dfelhi, 1967.
A s i m p l i f i e d procedure f o r detf^rming the
r e l i a b i l i t y of a t e s t by s p l i t ha lves .
Ilarv.edu.Rev.19 39, 9, 99-10 3.

Saxena« K,N.
S»C« E* R* T«
S . I . E . (Kerala) .
S ingh, A.K,
S t a l n a k e r , J.M,
Tinkelman, N . S ,
C o n s t r u c t i o n and s t a n d a r d i s a t i o n of an
a t t a i n m e n t t e s t i n G e n , S c i e n c e f o r c l a s s
VIII i n U . P . S c h o o l s ( f o r use i n Edu.
gxiidance) P h . D . , P s y . , B.H. U. , 1960.
S t a n d a r d i s a t i o n o f a s c i e n c e a t t a i n r n r r i t
t e s t f o r c l a s s V I I I i n T e l u q u , Hyderabad ,
1 9 7 1 .
C o n s t r u c t i o n and s t a n d a r d i s a t i o n o f an
ach ievement t e s t i n G e n . S c i e n c e f o r
s t a n d a r d VIII s t u d e n t s i n K e r a l a , 1 9 6 5 .
T e s t s , Measurements and Research method^
i n B e h a v i o u r a l S c i e n c e s , T a t a Mc.Graw
H i l l P u b l i s h i n g Co. L t d . , N . D e l h i . 1 9 8 6 .
The e s s a y t y p e o f examinaLlofi i n E . P .
L i n d q u i s t (Edn.) E d u c a t i o n a l measurennent;.
Washington* American C o u n c i l on E d u c a t i o n
19 5 1 . p p . 49 5 - 5 3 0 .
P lann ing the o b j e c t i v e t e s t i n R .L .
I Jhornk ide E d u c a t i o n a l measu remen t
American Counc i l on E d u c a t i o n . V/ash-
i n g t o n , D.C. 1 9 7 1 .

S . N o .
1 .
2 .
3 .
• 4 .
5 .
6 .
7 .
8 .
9 ,
1 0 .
1 1 .
1 2 .
1 3 .
1 4 .
1 5 .
1 6 .
1 7 .
1 8 .
1 9 .
2 0 .
2 1 .
2 2 .
2 3 .
2 4 .
2 5 .
Raw S c o r e
IB
34
21
41
38
39
18
29
24
26
30
22
29
32
29
36
24
22
34
12
31
12
22
27
24
APPENDIX
Raw S c o r e
S . N o .
2 6 .
2 7 .
2 8 .
2 9 .
3 0 .
3 1 .
3 2 .
3 3 .
3 4 .
3 5 .
3 6 ,
3 7 .
3 8 .
3 9 .
4 0 .
4 1 .
4 2 .
4 3 .
4 4 .
4 5 .
4 6 .
4 7 .
4 8 .
4 9 .
50
. A
M a t r i x
Raw S c o r e
33
27
20
22
39
28
27
31
41
26
20
27
30
22
28
40
23
17
20
26
21
30
35
25 .
41
S . N o .
5 1 .
5 2 .
5 3 .
5 4 .
5 5 .
5 6 .
5 7 .
5 8 .
5 9 .
6 0 .
6 1 .
6 2 .
6 3 .
6 4 .
6 5 .
6 6 .
6 7 .
6 8 .
6 9 .
7 0 .
7 1 .
7 2 .
7 3 .
7 4 .
7 5 .
Raw S c o r e
32
3]
26
23
30
16
23
34
38
16
23
21
17
37
37
28
18
30
22
29
24
15
30
14
26

S.No. Raw Score S.No. Raw Score S.No. Raw Score
i
76.
77.
78,
79.
80.
81.
82.
83.
84.
85.
86.
87.
88.
89.
90.
91.
92.
93.
94.
95.
96.
97.
98.
99.
100.
46
42
27
26
15
39
29
32
35
34
24
35
43
22
21
39'
43
26
24
19
28
24
43
18
41
101.
10 2.
103.
10 4.
105.
106.
107.
108.
109.
110.
111.
112.
113.
114.
115.
116.
117.
118.
119.
120.
121.
122.
123.
124.
125.
19
48
35
19
23
24
51
51
49
48
26
44
31
30
33
33
22
25
32
32
31
42
31
29
29
126.
127.
128.
129.
130.
131.
132.
133.
134.
135.
136.
137.
138.
139.
140.
141.
142.
143.
144.
145.
146.
147.
148.
149.
150.
24
27
31
22
41.
31
22
29
21
24
47
31
31
32
46
Ui
i9
?C
32
26
18
27
43
15
29

S.No. Raw Score S.No. Raw Score S.No. Raw Score
151.
152.
153.
154.
155.
156.
157.
158.
159.
160.
161.
162.
163.
164.
165.
166.
167.
168.
169.
170.
171.
172.
173.
174.
175.
42
42
37
24
34
37
35
25
25
28
39
35
, 48
48
47
46
22
29
21
32
11
18
22
26
20
176.
177.
178,
179.
180.
181.
182.
183.
184.
185.
186.
187.
188.
189.
190.
191.
19 2.
193.
194.
195.
196.
197.
198.
199.
200.
19
20
23
35
19
19
30
20
29
23
16
18
17
25
29
27
21
28
32
32
24
28
20
27
25
201.
202.
20 3.
204.
205.
20 6.
207.
208.
209.
210.
211.
212.
213.
214.
2 1 '•..
216.
217.
218.
219.
220.
221.
222.
223.
224.
225.
28
41
24
2<^,
25
25
26
28
34
44
50
51
43
37
'!'/
26
36
3 6
36
36
22
22
46
2 3
31

S.No.
226 .
227.
228.
329 .
230 .
2 3 1 .
2 3 2 .
233 .
234 .
235 .
236.
237 .
238 .
239 .
240 .
241 .
242 .
2 4 3 .
244 .
245 .
246;
247.
248 .
249 .
250.
Raw Score
14
12
56
25
29
29
33
26
28
26
24 •
19
34
34
34
25
47
19
24
24
26
45
19
26
28
S.No.
2 5 1 .
2 5 2 .
2 5 3 .
254 .
255 .
256 .
257 .
258 .
259 .
260 .
2 6 1 .
2 6 2 .
2 6 3 .
264 .
265 .
266 .
267 .
268 .
2 6 9 .
270 .
2 7 1 .
2 7 2 .
2 7 3 .
2 7 4 .
275 .
Raw Score
19
24
27
22
15
21
21
27
25
34
23
2 8
32
33
24
29
22
30
27
31
32
30
35
41
17
S.No.
276 .
277 .
2 7 8 .
? 7 9 .
280 .
2 8 1 .
282 .
2 8 3 .
284 .
285 .
286 .
287 .
2 8 8 .
289 .
290 .
2 9 1 .
29 2 .
29 3 .
294 .
295 .
296 .
29 7.
298 .
299 .
300.
Raw Score
43
26
58
r .
34
29
28
30
26
38
35
26
36
24
'.0
?9
12
4 8
31
20
35
36
17
24
27
3'7^^i'=fl«^ (ACHIEVINIENT TEST)
fsrin^ (Science)
m^ ^STT
f iTT iTT ;
^ •
f^^-H^m
1989
3 — f ^ T-CtspjT ?r iT arrqlr 'f?$rT^ ^ ^qsrfej' ^ T ITT 'H ^TT^T m ^ | sft [tifcraT i f ts ^?f % PrfiTTf
4 -^^ 'V ^ ^ ^'Fgffr^ ^W\T % t 3T«Tfc]( ^c%^ ^ ^ . % =?R ^3TTT ^ H W : 3r,^,^,?, t ^ ^ % %ST5r 1 ^
^W ^ ^ ^ fe'Tt SSq- Jr "Tft ^T Srtfw^ ^ T ^ f ^>2ft ^TcfV I <!> ^ ^ T ^TT—
X (3T) ^?[^ S:TTT | S R n^ TT 'V ^ mx w ^TT^T > STTCTT | I
(^) ^ ^ % ?TTT STT 1% qr^n- % ^TT ^ ^TT^7 ^JT f> tJTTrTT | I
(^) ^i3% fTTT fJT^ ir% <TT?fV % ^ R % ^TRT srfsr^ f t SfT^T | I
(?) q ^ ^ % ^ ITH Tf?TT I I
=^T^ 51^ > f ^ ^ f^^'V S5ir ^ T ^ ^T 3Ttf9Rr ^ q % ^ ^ ^TT^ I ?ft ^?T^ ^TT ^ ? ^ ?RT
^ET r 1% TTJfy % *rTT % STTRT ^ TcTT | . ^^rf^ir ; jqzf^ ^^T^TT i f f?!^ ^T^ =^R ^J^T^ Wf^: 3r, ^, ^, ? ^ ^ jtTT *'3r" ^ ^ 113rrr: "ar" qt: ^T?r ( x ) ^ r T^m^ ^^wt mi 11

( 2 )
6.
(3r) 5^c^ ^^ ^ ^ 1 1 (ar) ^ c ^ i ^ ^ ^?r ^ > ^ 1 1
(ar) 332 ^. ift^T / fer itcft 11
(^) 332 ift^T / fiH7 ^ ^ t 11 (^) 332 jft^T / f%?¥ 5>eft 11
(?) 332 ^. TftiT / ^ r ^cft 11
"t eft ^ ?5!T ^—
(ar) 6R^T|^I
(?r) sr nrpT spt T % TTT^ ^ f%^ rTrn 11
5. ^ ^ ? ? ^ % 3r«T3ff ^ar^zrftTcf » T % ^
(ar) gjCTft ^5rf s p ^ 1 1
(? ) ^^frT^ 3wrf sp^^ I I
(?T) Tmn?%^ ^sff ^ 1 1
(?) art^fV:^ gssrf ^ ^ 1 1
MH ? ^ qrpft ^ T«r sr^'fV T ^ — (ar) ^3^r^ ^^T?? 7T?ft % ^ T ^ % ?TT?T
(ff) ^3^^T arr nnT Ti^t % arr?^? ^ a r f t ^ l I
(?) ^ «FT sTFTcT? qrsft % an?^^ % srTT?T| I
7. gf% ?Tvr 55?!^ f?T *r g?TT ^rs^ | ^^ifk: (ar) fgn ^«TT sr%?r^ 1 1 (?) ^ ^^ trft ' t^ ^ STT % STTcfV t I (?T) ^3^^ f t ' t^ 5?T ?r f?^> 5>rfV t I (?) ^ 3 ^ ^ft »r?r 5?T ^ TTTt 5 > ^ 1 1
8. n_^ g i^cf t | f »ft5fl" %?ft ^«rT ^>ft ?r ?^T^T ^3^ iT%iTT? FT ^cft | eft ^T^
(ar) ^>nf 1 1 (?) g;5it 1 1 (?T) ?5r 1 1 (?) gjKJTT 1 1
9. ^jfVff ^»nq- ?FV 3r? «rT ^ ^ : ^ ? ^
(ar) iTfcTsr 3;3ff ^ ^ 1 1 (?) f «TffT ^^ f ^f^ I I (?T) art?TfT^ 3551? ^% f I (?) ? ^ ^% 1 1
10. fe^ ?t5r^ i m 5r% #%?^ f% nir
(ar) arT?TJT 11 (? ) anffrT ^ ^ 1 1 (V) ?t5r? Tr% ^ 1 1 (?) <TTT? 5T ^ I I

( 3 )
(5r) ^ f l ^ «PR TTsft ^ »T aftr 3«r ?»
12. iT^ ^ f t -(ar) 42 % ^TRT ftcft 11 (^) 0.24 R % «i<N< 5?fV 11 (?r) 4 . 2 ^ J % ^ R T 5 t ^ | i (?[) 24 SR % ^TRT cfV 11
13. T^^ ^ ^ "nft cBwfhr 53if—
(?) «r% urn: *ir> ??r?ft 11
14. ^ ^ srw ^% ^ srfjf^ ^>— (3r) fl^i^nr ^ ^ f i
15. 3^^% % W^ TT ft ^ ?n"«T ft«R T^m I, ?^ ?rTT ^ q i ^ ^ (sr) f^SRtfT ^ I I
(?T) f | jn^ i p ^ 11
(ar) 3;5rf <TT?rrTW ^ f •
(iff) ;s^f ^qT?;T ^ ^ 11
17. '»ft5t f t i ^ «^^T g ^ qr wtR ^
(ar) ? ^ aiftRT 3?siTT 5nT?ft 11 (5r) ? ^ f^T arfev 5nT?ft 11 (?T) ?»T^ spTfT arfef? 'S^ STTrn I I (?) ^ STTWR Wtsr ^ T I
18 3^f ^ sff m'TT 3(t (T ?rm 3W ^ ?rnr
(sr) 1 sf r jpf^ 11
(«r) 1 '^(ST'F^ t I (?r) 1 '^? i iT^ ^?i^ 11 (?) 1 jp^ftft ^ 11
19. TrT«r3^ ?rt»r ^ 3rTf%—-(ar) 20,000 ?t5nT s»% ^^i;?^ ?r arfH F
(5r) 20?t5R^%4f%?«^^nT^^|i (?r) 20,000 ?t5R Trf?T ^%?y fftft 11 <?) 20,000 d5R ?rfe ^fiiP^ % w^
20. Jri srsT ^^ FJT i r?r?r % s m ^
(ar) 3^5 ^ srT5 5 ^R I (^) ^ TT ?T5 if «TTT+W^ ^ JVlf
it ^TT I (^) ^ ^ ^ ^ R If m T — ? ^ in" sTST Jf
tTTT I (?) W?5 ?«l *f ^ T I
21 f ?T fsT PR ^ f5p^ fM?^^ ^<r Tt f?t fiT T?!*! ^5RT ^''T ft' m%j ^mit— (ar) ^ ^ f^^^^ ^ 11 (^) ^ f^^PR ^ 11 (?r) 3 f ? f ^ ^5nR ^ ^ 11 (?) f?^R^ fif^ I I

( 4 )
(sr) ^ j
(3T) IT STT tf 5r5TrfV t I
24. iT^%?fTq- qT ^ ? f t m^ ?3!T ^ J r
(3f) frfejTT (^) qrTT
(?r) q^JTf fjT r
(?) ^^TTcT
25. ^wf^rfecT t ^ ^ ?rr <T?T'T f^^rart^ft
t -(aj) JTPT^ wdT
{^) ^>TT
( ) I' ^ (?) ^ ?Rrft
26. q?T5Twp% (3T) TT TTWarf ^ fjT^I^T ^ r ftcTT | I
(^) ^ ^ ^ f % fm^-^ ^ 1 ^>^ 11 (?r) iTts>ff % fii^r^T ? T |trn 11 (?) amaff % fr^RTT sr^ ftcfT 11
27. qifft ^ =?tfft >5r% TT ^> ?r 5r q?!'^
. ^ ) r«!iHm«t. 11 (^) r??TJrfi 11 ( ) t ^ fi^m^ 11 (?) f?%T 11
28. Tf^T ?t—
(ar) cTRT F^T^r^ 1 1 (?) fT^^f^pnr fTcTrTT 11 (^) ?ftm f^^TT I I (?) ^\T f i r ^^ 11
29. cTt% % 3;«TT 1 ^ t ^ ^ STT ^nr STT n I f ^
(ar) fir'ssF'PT ^^ t I
(?) sf^ftir f??T??r ^f^ 11 (?T) tmr.^ ^ 11 (?) ?T^^ ^5% 11
30. TT^ T^wm f^TRfeferT ^ fniff ^ ??rr
(ar) ^ ^ f T ^ 4-5rts>T (?) ?#^?T+^?T^ (?r) ?#^fT?T+5ft^^+?q;^?r (?) sftst^+ri[fTJf
31. f?fcT =?T5r1f mrr 5r?Tf ^rr^ ^ -
(ar) % f?Tf ¥ STTrft I J (?) 3- T T«T ^^ ^ SfT T I I (g-) ; j^^r cTTq" ? ? srrcTT 1 1
32. TRt t =?t?t ^\^ "TT ^ t ?RtT 'T?T'T T*^
(sr) r?^R^ ^ 1 ^ 11 (?) f?5rT?^ f^ 11 (?T) f ? ^ ^^^ t I (?) ffr«nrr ^f^ f i
33. ^ R % f e c f ^ ?r SFVT ?fV STT 5TR 3r??TT
ir <TT? ^ ^ t— (ar) cTf?T (?) q fjTf RTJT (^) ^t^T (?) ^"t^

( 5 )
34. m^ arfe^cTT 3rTf?rrf¥, ^(^^%^ m
m^ ff^ 1 ^ TTI Tcft I %^—
(3T) ScffKE: ^ t I
(^) anr^ ^^^ 11
(?) fJT^^ir ^ ^ 1 1
35. tr^ ^ T ^ ^^V^ 2 fe. ^ . TT T cTTT
(ar) ^T?Twa"^?n ^ % 11
(^) ci^?n ^ 11
(?r) ^ ? ^ ^ 11
36. Pri^Tf^fe^ ^ % ^ ^ OT^ ?T% T
(ST) CTRT
(W) 5ft|T
(^) ^TT (?) ITe fiTPnTJT
37. TRTf%fe?r t % ^'t^ ?rT T?T4 fsrar^r^ | -
(ar) ^f{V
(^) TT^t
(^) ^ t ^ (?) 5T5pfr ^T fTT?T
38. ^'Z ^T% ^ 5ft| ^ ^T ?rn% ?r T^RT ^T
(^) ^2: ?Tcr?: sfft r^^^rf? crr 11 (^) ^rz ^r t»T 3fir ?r^ wi^ grr i (^) ^^^ p r 3ftT sng ^ ^ w w
(?) ^ ^ 1 ^ sftT m^ ^ ?rTtr# w^r
39. tT fjT rznr «fn- js^nrrfr snr 2 7 | 3ftT
(3r) 12^>ftr (w) 27i>n> (?T) 13 f t ^ t l (?) 14 ^ t I
40. ?rt|^> ^ cT p r J f %^\ ^>f% TT
(ST) ^cff TT f5r SfTT STTrft | I
(5f) ^ ^ ^ ^ ^ i TT STTWTI^ ^ cT sr^
5TTcft I I
(^) 'sr'T^ f?T ^ ^ ^T?TV I 1
(?) ^^^ ^ f TT ^^1^ STJT SfTcTT | I
41 . f^J^f^rfilcT Jf ?r ^ ? f t ^ 5 fiT^T^Tl
^ ^ iffsnp iTSTf ?r ?5t5T STT' ^"t^ | — (sr) cr^ffirf^nrir (?) JT^ffRT
(?) ^?T 42. f^=?T^RrJr f^?T STRICT 5r?Tfft^
(ST) f#^5R *r%»TTT i t 3nt 11 (sr) arJT rfcrTTT f t STT 11 (?T) 5ft&5T »1%»TT?T f t STT | I
(?) 'JT^R ^TFCTTPT f t STT | I
43. f^^f^fecT if ^ ^ ^t sTT T5r% ^fkm
^T^W( ^ STT^tfcr §t STTcfr | —
(3T) crt T (?) fjff^J^ (^) =?t?t (?) ^tf^tnr
44. ^T^f^%?T t ^ ^ ?ft m^ tjcins? srrg
(sr) rrfinTTT (?) f^r^ (^) c -fj JT
(?) ^f^?iT

( 6 )
45. srT5 ^ sT^feff ^ | T ^T% % firq; f ^
Tsf^ 'RT'^ 3T5r% I f5i%—
(sr) sng irw f^ 1 1
(ff) SfZI^ ^f^ I I
46. f^TRf^jfisfu ^% f^B ^ ^ ^ j j - ^ f f tfrfft
gr^r ^crr | — (sr) tf «T T5fr
(?) f%^^^
47. 5r^ juqf % qn^FT f;?Tt i\ii % f ^THT
(3T) ?^qTT»m ^ ^ I I
(?T) ^ I T TTT^'JT ^ ^ 1 1
(?) "TTTTT TiT ^ | I
48. f^T^r^ % T STTcT ^^—
(3T) ^Tir?5r % ^ ^ T 1 1
(^) 5%^T ^cTT I I (?T) ^^fk^i ^ ^ cTT 1 1 (?) 3r^9lJT ^ ^cTT I I
49. ^?:^>r?r^r % 3rf ^ T T ^ ^ ^>—
(ar) TTT piT f^ 11
(^) 'TTq'?:! ! ^ 1 ^ 11 (?r) fk^i f t ^ f^ 11 (?) fJTT?^ f^ t I
50. f FcTfecT ^ ^ ^ % q ^ ^fir^ sr^a^
gTTT iTTir ^T^ | -(3r) ^
(^) =T?5T (^) ? T (?) ^T^f
51. ^?TT 'T^5f t T?r?R ^ ^T% ^ I rT'TT
T^ I ^ ^mi ^— (3r) ^ ^ ^m 11 (^) 5S?ft?TT «W cT t I (?r) ^T?r <?J5r ^^^ 11
(?) an^mt ^m f% 11
52. ^ZT. % " r =sr«T% ^«TT %^ f%^T^ TT ^ ^ T
(3T) ^^cst^r TJ r ^ 11 (^) T'FT T;^ SF^^ 11 {^) ^ ^^ 11 (?) 3TT rat 1)^ ^ 1 ^ t I
53. sfr ^ =sm^ cT«n ^ t |>^ | ^RJT
(3T) spts §TTT >?TT I I
(?) ^J% WTTJ ^^T I I
(^) frf ^ ^>^ t I (?) 5r^ g:RT ITcfT I I
54. f^r?r?^^^5fjrcTT | —
(3r) JT ff % ^rT^r (? ) ^TWaff ^ JT?? ^
(^) | g if TTfft fJT T ^ ^
(?) 'FP'?t ^t IT?? ^
55. ? | c r ^ <T>sff%?^5flf ^ =?>7 «TT r ff %
(3T) qr ft gTTT
( ? ) iT^^f gTTT
('ff) 5rT?T?<f S:TTT
(?) f?T STT
56. 3r?TTf ?T ?t3fV ^ f ^ |Jf—
(3T) 3T^TirfiT?rcr| I
(?) ^ ^ ^ fiWcft I I (€) 'TJffNT % %q 5r=Fft f i T ^ I I (?) «?J5T f<T^ I i

( 7 )
57. ^t^r ^ t % ^ igfff ^— (3T) 3f^?nT ^ ^cTT I I
(^) q T T T ^ ^ ^ ^ ^ 11
58. ^ ^ m ^ 5TT«T ^ ?^Tf ^ -(3T) "fir. *ft. ^ ^ 11 (^) iTT Ft T ^ I I (^) ^. Jft. ^ ^ t I
59. «T^^"f ^T ^M ^jf—
(ar) jcq" ^f^^^ ^ T ^ 11
60. ^•\^ ^'%" f%?^ "iik " p^ ^«rT ^F^
(sr) ^T^ TTTTT ( ^ ) 5r?T q-TTTnn-
61. ^ R : 5 "Tlf Jf'T^^q-f ^t^ST?^ «TT q g ^
(ar) 3T T9rT ^5^ 11 (?) TTT»T "W ^ ^ I I
(?) ^f%^T 5F^ I I
62. gq 5 ^ % cR I sfi — (3») t r ^ J f ^ ^ f l (?) ^Pcarff ^nr ^ 1 ^ 11 {^) ^T^ T:^ ^ ^ I I (?) STT^^t 'R r I I
63. ift% ^ TT fft% cPTT ^ T^ ^ ^"^?
(sr) 5ft?TW ^ 1 ^ 11 (?) ?r?T5r >^ 11 (?T) qj^rrf ^ ^ 11 (?) f^z ^^ 11
64. f?nR%fe^ ^ ^ fsf^rnt 5 ^ '^^'^— (ar) 5rM (?) ?n:e1f (?r) ^ ^ f t (?) Tqt T
65. ^ t % ^ % =?tc?t m ^>— (ar) airm? ^>^ 11 (?) TTT^RTW ^>^ 11
(^) ?f%^^ ^ ^ 11 ( ? ) ^TTRTT 5 P ^ 1 1
66. =sf f % q \ t f%^ ?^ ^ aTT% t — (ar) a r i f ^ g f t (?) apTTf cT ?5ft (^) ?t5rniT (?) t r f ^ ^ W f
67.
68.
PF^ ?'V TfV ^ Jr % Trf TT ^ff-^ft f%FfRtq?5rTcft|-(ar) ?3 ?TTT (?) X^Z ?TTT (H ) ^»T^ SHT
(?) ^ TTH: fRT
'%" f^x^ % qVt f?^T ?t5r % a|f PTCT |<T
3r"T?ft ??r f f e +<ci | , f ^ sr^TT % ^r?? ^ > -(ar) 5 qV? ^^^ ^ ^ 11 (?) t^^f^nft 3r^? ^ 1 % 4' 1 (?r) # ' fw 3T?? fT^^ f 1 (?) ^Tf?^ snrq- ^ 1 % f 1

( 8 )
69. pT' f rftr^r ^ ^ f ^ ^ q i ^ ^ ^ ^ T ^ S T
(sr) ?f?TTT
70. 5EiftiTT?T^—
(3r) ^5Tf^ arsTsrq- ^^P arrrrr 1 1 (^) ?t5rt¥ 5^T |3TT T lr itrTT I I
71. f r T q ^ t ^ ? ^ cr«rT 9r?r?T ? > f % ^
(?T) 5 J > ^ fi^^ " I
72. ^f? tr^ ?rT "t ^T "fhrr qr^Trm ^TTT ^K^^ i}^ I ^> JH ?rir "Tt % 'pjT— (3T) TTTcfT # cTT f f^ »
(^) men f^^T ^ cTT f t I
(^) PTTT ^t ^^^ ffiri
73. ^ i T ^
(sr) sn^mt 'm 1 1
(w) ^^ 1 1
(H) ^ ^ Ti r 1 1
(?) ^r?:3rff ?r^ 11
74. ^ ? t % q ^ jTTT% % f riT fTT ^TT snf^i
VT^ t'—
(ar) 3r¥
(^) TTTT
(?T) ^5r
(?) cFTT
75. «T7:5ft?t sfkT'T arcRT f N ^ —
(3T) f^ft^tfw ^ IT?? ^ ^ T ^ f t
(^) fT? |R T'tNf ITT 3rT5T?ff ^ ?T«^
(?) %f?T 5f?t H|T^?rT ^ ^ T # f' I

(v)
APPENDIX - C
Q .No . Key
1 . B
2 . C
3 . B
4 . A
5 . D
6 . B
7 . C
8 . B
9 . B
1 0 . B
1 1 . A
1 2 . C
1 3 . A
1 4 . C
1 5 . A
1 6 . A
1 7 . D
1 8 . D
1 9 . A
2 0 . C
2 1 . A
2 2 . A
2 3 . D
2 4 . B
2 5 . D
SCORING KEY"
Q . N o .
2 6 .
2 7 .
2 8 .
2 9 .
3 0 .
3 1 .
3 2 .
3 3 .
. 3 4 .
3 5 .
3 6 .
3 7 .
3 0 .
3 9 .
4 0 .
4 1 .
4 2 .
4 3 .
4 4 .
4 5 .
4 6 .
4 7 .
4 8 .
4 9 .
5 0 .
Key
D
D
C
C
C
C
A
D
B
B
C
B
C
D
B
B
A
D
C
D
C
D
D
D
C
Q . N o .
5 1 .
b?..
5 3 .
5 4 .
5 5 .
5 6 .
5 7 .
5 8 .
5 9 .
6 0 .
6 1 .
6 2 .
6 J.
6 4 .
6 5 .
6 6 .
6 7 .
6 8 .
6 9 .
7 0 .
7 1 .
7 2 .
7 3 .
7 4 .
7 5 .
K e y
r;
f
A
i-!
D
n
A
B
D
/ •
r"
'>
f •
7}
f ^
. 1
>i
D
B
;.
fa
D
A
D
n