development of an intrusive array probe sensor for ... 4a to 7a/4a2 coombes james.pdf · probe...
TRANSCRIPT

Development of an Intrusive Array Probe Sensor for Monitoring Particle Size, Velocity and Concentration in a
Coal/Biomass Multi-phase Flow By
James Coombes Under supervision of:
Professor Yong Yan Of

Contents • Introduction to the array probe sensor concept
• Motivation of research
• State of current research
• Operating principal of electrostatic sensors
• Current design of the array probe sensor
• Testing and results
Testing facilities at the University of Kent
Experimental results
• Conclusion
• Future plans

Motivation of Research • Being able to online monitor the pulverized fuel in real time for the
whole cross section of the pipe before it enters the furnace would allow more effective control systems to be developed to improve efficiency of the burning process consequently reducing emissions and fuel consumption
• The ability to practically measure the complex parameters inside a multiphase flow for validation of CFD (Computational Fluid Dynamic) models

State of Current Research
Particle Velocity
Particle Concentration
Particle Size Distribution
Electrostatic ● ● ●
Capacitive ● ●
Digital Imaging ● ● ●
Piezoelectric ● ●
Radiometric ● ●
Ultrasonic ●

Array Probe Sensor Concept

Array Probe Sensing Area
Advantages: • Sensing area covers cross section of pipe • Simple to install on existing systems • Able to measure particle velocity,
concentration and particle size
Disadvantages: • Intrusive

Particle Velocity Using Electrostatic Sensors
Yan et al. (1995) Meas. Sci. Tech.
𝑉𝑒𝑙𝑜𝑐𝑖𝑡𝑦 =𝐷𝑖𝑠𝑡𝑎𝑛𝑐𝑒
𝑇𝑖𝑚𝑒

Current Sensor Design Electrostatic Sensor Array
Mounting Spool • 2” Pipe Bore compatible
with both test rigs in the University of Kent
• Either vertical or horizontal orientation for sensor

Electrostatic Sensor Array
Current Sensor Design
Mounting Spool • 2” Pipe Bore compatible
with both test rigs in the University of Kent
• Either vertical or horizontal orientation for sensor
Electrostatic Sensor Array
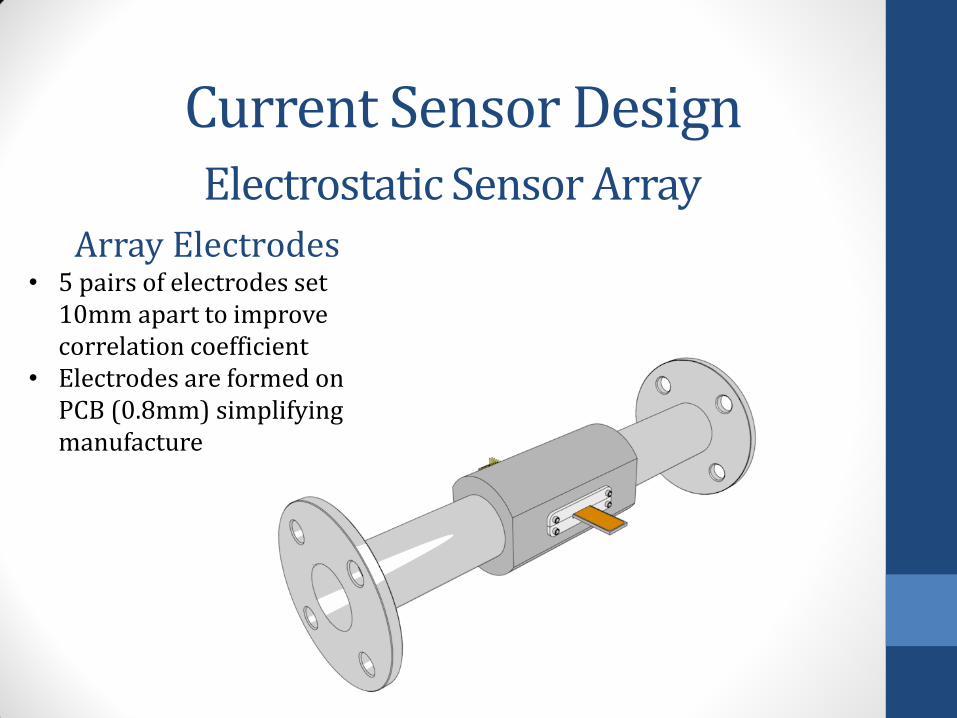
Current Sensor Design
Array Electrodes • 5 pairs of electrodes set
10mm apart to improve correlation coefficient
• Electrodes are formed on PCB (0.8mm) simplifying manufacture

Current Sensor Design
Array Sensor Housing • Earthed housing to reduce
noise in pre-amp • Small cross sectional area
only 2.5mm thick • 45 degree knife edge on the
leading edge to deflect impacting particles away from sensing electrodes
• Eventually will be ceramic coated to improve durability
Electrostatic Sensor Array
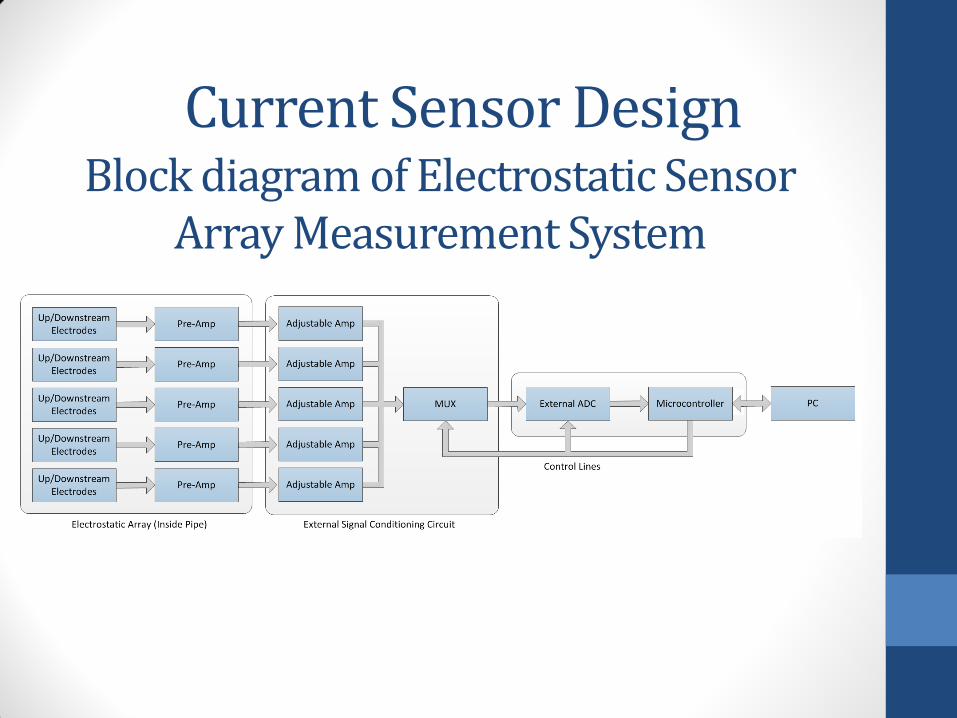
Current Sensor Design Block diagram of Electrostatic Sensor
Array Measurement System

Testing Positive Pressure Pneumatic Bulk Solid Conveyor
Test Rig
Currently being modified for use with pulverised coal
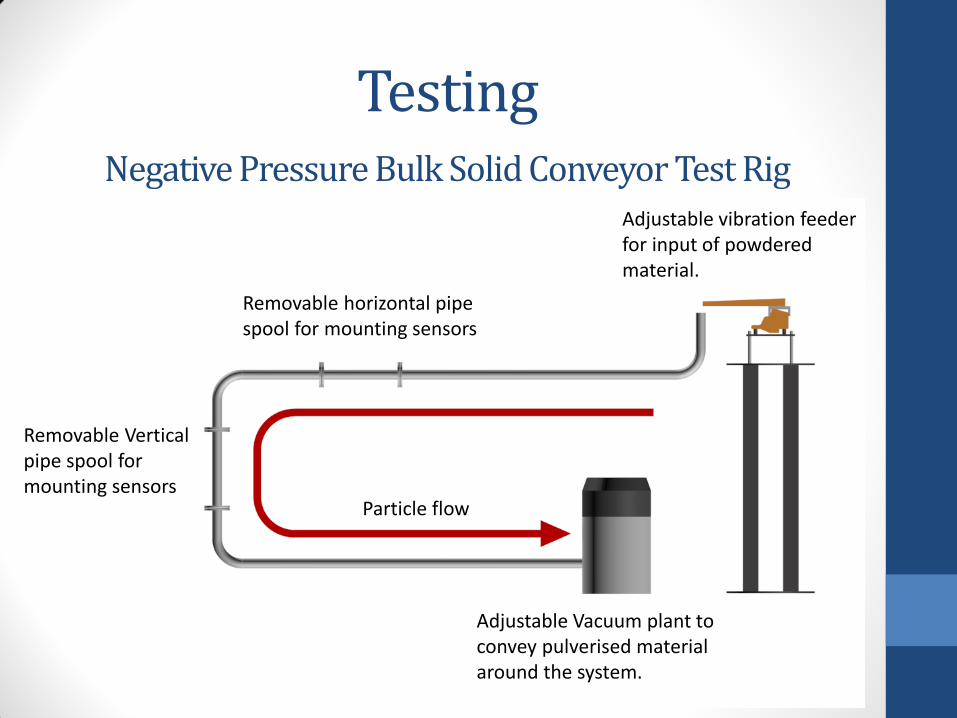
Adjustable Vacuum plant to convey pulverised material around the system.
Adjustable vibration feeder for input of powdered material.
Removable horizontal pipe spool for mounting sensors
Removable Vertical pipe spool for mounting sensors
Testing Negative Pressure Bulk Solid Conveyor Test Rig
Particle flow
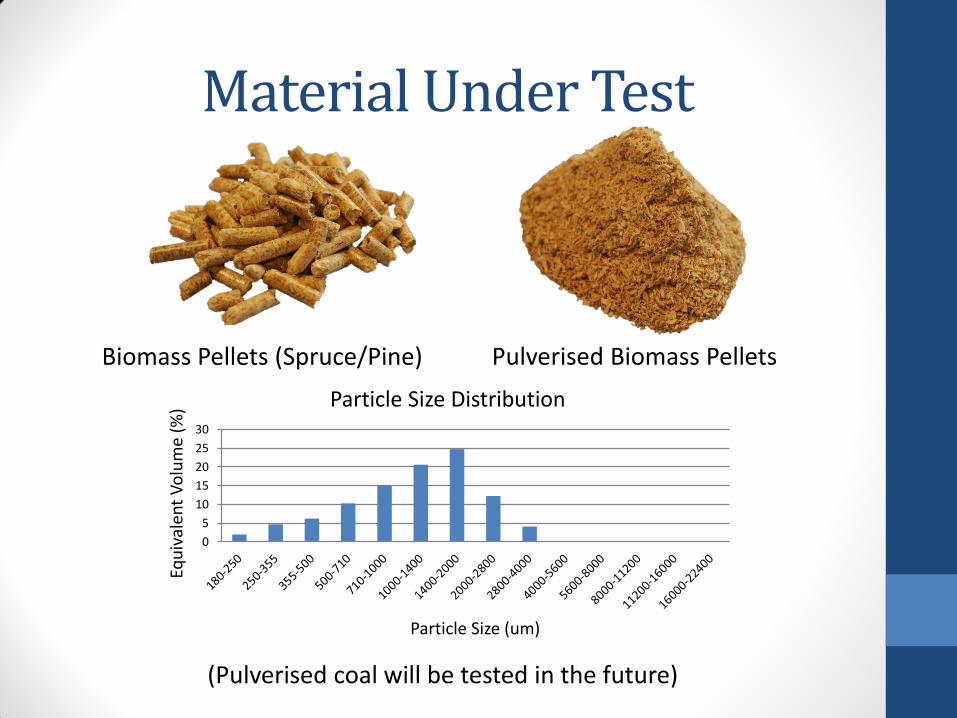
Material Under Test
(Pulverised coal will be tested in the future)
Pulverised Biomass Pellets
0
5
10
15
20
25
30
Equ
ival
ent
Vo
lum
e (%
)
Particle Size (um)
Particle Size Distribution
Biomass Pellets (Spruce/Pine)

Typical Electrode Output
-1.5
-1
-0.5
0
0.5
1
1.5
0 1 2 3 4 5 6 7
Ou
tpu
t Si
gnal
(V
)
Time (ms)
Electrode Output Signals
Upstream
Downstream
-0.8
-0.6
-0.4
-0.2
0
0.2
0.4
0.6
0.8
1
0 1 1 2 2 3 3
Co
rrel
atio
n F
un
ctio
n
Time (ms)
Cross Correlation

Results - Horizontal Pipe
0
5
10
15
20
25
30
35
40
45
50
10 15 20 25
Pip
e C
ross
Sec
tio
n (
mm
)
Velocity (m/sec)
Velocity Profile 0°
50% Power
55% Power
60% Power
65% Power
70% Power
0
5
10
15
20
25
30
35
40
45
50
0 2 4 6 8 10
Pip
e C
ross
Sec
tio
n (
mm
)
RMS Charge Level (%)
RMS Profile 0°
50% Power
55% Power
60% Power
65% Power
70% Power
Material Under Test Pulverised biomass fuel
pellets (Spruce/Pine)

Material Under Test Pulverised biomass fuel
pellets (Spruce/Pine)
0
5
10
15
20
25
30
35
40
45
50
0 0.1 0.2 0.3 0.4 0.5 0.6 0.7 0.8 0.9 1
Pip
e C
ross
Sec
tio
n (
mm
)
Correlation Coefficient
Correlation Coefficient Profile 0°
50% Power
55% Power
60% Power
65% Power
70% Power
0
5
10
15
20
25
30
35
40
45
50
0 20 40 60 80 100
Pip
e C
ross
Sec
tio
n (
mm
)
Standard Deviation of Correlation Coefficient (%)
Standard Deviation Profile 0°
50% Power
55% Power
60% Power
65% Power
70% Power
Results - Horizontal Pipe

Results - Horizontal Pipe
0
5
10
15
20
25
30
35
40
45
50
10 15 20 25
Pip
e C
ross
Sec
tio
n (
mm
)
Velocity (m/sec)
Velocity Profile 90°
50% Power
55% Power
60% Power
65% Power
70% Power
0
5
10
15
20
25
30
35
40
45
50
0 5 10 15 20
Pip
e C
ross
Sec
tio
n (
mm
)
RMS Charge Level (%)
RMS Profile 90°
50% Power
55% Power
60% Power
65% Power
70% Power
Material Under Test Pulverised biomass fuel
pellets (Spruce/Pine)

Results - Horizontal Pipe
Material Under Test Pulverised biomass fuel
pellets (Spruce/Pine)
0
5
10
15
20
25
30
35
40
45
50
0 0.1 0.2 0.3 0.4 0.5 0.6 0.7 0.8 0.9 1
Pip
e C
ross
Sec
tio
n (
mm
)
Correlation Coefficient
Correlation Coefficient Profile 90°
50% Power
55% Power
60% Power
65% Power
70% Power
0
5
10
15
20
25
30
35
40
45
50
0 20 40 60 80 100
Pip
e C
ross
Sec
tio
n (
mm
)
Standard Deviation of Correlation Coefficient (%)
Standard Deviation Profile 90°
50% Power
55% Power
60% Power
65% Power
70% Power

Results - Vertical Pipe
Material Under Test Pulverised biomass fuel
pellets (Spruce/Pine)
0
5
10
15
20
25
30
35
40
45
50
10 15 20 25
Pip
e C
ross
Sec
tio
n (
mm
)
Velocity (m/sec)
Velocity Profile 0°
50% Power
55% Power
60% Power
65% Power
70% Power
0
5
10
15
20
25
30
35
40
45
50
0 5 10 15 20 25
Pip
e C
ross
Sec
tio
n (
mm
)
RMS Charge Level (%)
RMS Profile 0°
50% Power
55% Power
60% Power
65% Power
70% Power

Material Under Test Pulverised biomass fuel
pellets (Spruce/Pine)
Results - Horizontal Pipe
0
5
10
15
20
25
30
35
40
45
50
0 0.1 0.2 0.3 0.4 0.5 0.6 0.7 0.8 0.9 1
Pip
e C
ross
Sec
tio
n (
mm
)
Correlation Coefficient
Correlation Coefficient Profile 0°
50% Power
55% Power
60% Power
65% Power
70% Power
0.00
5.00
10.00
15.00
20.00
25.00
30.00
35.00
40.00
45.00
50.00
0 20 40 60 80 100
Pip
e C
ross
Sec
tio
n (
mm
)
Standard Deviation of Correlation Coefficient (%)
Standard Deviation Profile 0°
50% Power
55% Power
60% Power
65% Power
70% Power

Results - Vertical Pipe
Material Under Test Pulverised biomass fuel
pellets (Spruce/Pine)
0
5
10
15
20
25
30
35
40
45
50
10 15 20 25
Pip
e C
ross
Sec
tio
n (
mm
)
Velocity (m/sec)
Velocity Profile 90°
50% Power
55% Power
60% Power
65% Power
70% Power
0
5
10
15
20
25
30
35
40
45
50
0 5 10 15 20 25
Pip
e C
ross
Sce
tio
n (
mm
)
RMS Charge Level (%)
RMS Profile 90°
50% Power
55% Power
60% Power
65% Power
70% Power

Results - Horizontal Pipe
Material Under Test Pulverised biomass fuel
pellets (Spruce/Pine)
0
5
10
15
20
25
30
35
40
45
50
0 0.1 0.2 0.3 0.4 0.5 0.6 0.7 0.8 0.9 1
Pip
e C
ross
Sec
tio
n (
mm
)
Correlation Coefficient
Correlation Coefficient Profile 90°
50% Power
55% Power
60% Power
65% Power
70% Power
0
5
10
15
20
25
30
35
40
45
50
0 20 40 60 80 100
Pip
e C
ross
Sec
tio
n (
mm
)
Standard Deviation of Correlation Coefficient (%)
Standard Deviation Profile 90°
50% Power
55% Power
60% Power
65% Power
70% Power

Conclusion • Experimental data collected from tests carried out on the horizontal
pipe clearly show that the electrostatic cross sectional array sensor is capable of measuring the velocity profile and particle concentration profile on a developed air/solid flow.
• Data collected on the vertical pipe does not show a developed velocity profile due to the proximity of the sensor to the pipe bend. However the particle concentration profile shows that the particle concentration is highest along the pipe wall due to the centrifugal forces of the particles traveling in the pipe bend.
• Correlation coefficient values stay constant for the cross section of the pipe on both horizontal and vertical with exception to 0° horizontal where the quality of the coefficient improves in the centre of the pipe and more turbulence closer to the pipe wall caused by gravity.

Future Plans • Incorporate piezoelectric impact sensors onto the sensor array
and investigate coating the sensor in a ceramic material to improve durability
• Conduct experiments using coal and coal/biomass mixtures.
• Construct an array sensor for a larger pipe diameter for testing on an industrial system (coal fired power station)

Thank you for your time.
Do you have any question?