development of an interactive capability to trade off new - icas is
TRANSCRIPT

27TH INTERNATIONAL CONGRESS OF THE AERONAUTICAL SCIENCES
1
Abstract
Over the past 50 years, the growth of commercial aviation has been closely tied to significant global economic expansion. While the benefit of aviation to the global and national economy has been considerable, there is growing concern as to the environmental impact of aviation. National and international regulatory bodies seek to better understand the relationship between aviation noise and emissions and how proposed regulatory actions and policy decisions affect aviation environmental impacts. This paper discusses a capability that is being developed to rapidly quantify the interdependencies among aviation-related noise and emissions in a rapid fashion. To enable rapid decision making for aviation environmental impacts, two key elements are needed: simplification of the current fleet to a generic representation and a means to evolve that fleet to future time frames. The development of these two elements will enable the ability to rapidly trade-off future aviation scenarios to better inform policy decision making.
1 Introduction
Commercial aviation has become an integral part of modern society and enables unprecedented global connectivity by increasing rapid business, cultural, and personal connectivity. Despite the dip in passenger traffic after September 11, 2001 and the recent economic crisis, the growth of commercial aviation is expected to continue. Both Airbus and Boeing predict that passenger traffic alone
will maintain a global average growth rate of around 4.8% per year (based on revenue passenger kilometer) over the next 20 years [1,2], whereas the Federal Aviation Administration (FAA) Terminal Area Forecast predicts an average operations growth rate of 1.4% between 2010-2030 [3]. With continued growth expected, the negative consequences of commercial aviation are undergoing examination and mitigation through regulation by governing bodies, including the Committee on Aviation Environmental Protection (CAEP) internationally, and the Environmental Protection Agency (EPA) and FAA domestically. From a policy maker perspective, understanding the implications of a growing aviation demand on the environment is critical to establishing proper policy. In addition, as the commercial fleet evolves through changes in operations, fleet mix, and technology implementation, a method to rapidly evaluate fleet environmental metrics is needed to enable decision makers to quickly weigh multiple policy options.
This paper discusses a capability being developed by Federal Aviation Administration under the Partnership for AiR Transportation Noise and Emissions Reduction (PARTNER) Center of Excellence that addresses how the thousands of actual aircraft in the fleet and the millions of operations they perform annually can be simplified to rapidly inform policy makers under future aviation growth and technological scenarios.
DEVELOPMENT OF AN INTERACTIVE CAPABILITY TO TRADE OFF NEW TECHNOLOGIES AND FUTURE
AIRCRAFT TO REDUCE AVIATION ENVIRONMENTAL IMPACTS
Michelle Kirby, Keith Becker, Steve Isley, Graham Burdette, Dimitri Mavris
Aerospace System Design Laboratory (ASDL) School of Aerospace Engineering, Georgia Institute of Technology
270 Ferst Drive Atlanta GA 30332, USA

KIRBY, BECKER, ISLEY, BURDETTE, MAVRIS
2
2 Background
To inform future aviation policy scenarios an analysis capability is needed. The Federal Aviation Administration's Office of Environment and Energy (FAA/AEE) is developing a comprehensive suite of software tools that will allow for the thorough assessment of the environmental effects of aviation [4]. Transport Canada and the National Aeronautics and Space Administration are collaborating with the FAA in those elements of the development effort undertaken by the PARTNER Center of Excellence. The main goal of the effort is to develop a new capability to assess the interdependencies between aviation-related noise, fuel burn, and emissions effects, and to provide comprehensive cost and benefit analyses of aviation environmental policy options in an open, transparent, traceable, and flexible manner. The FAA/NASA/TC tool suite is illustrated in Fig. 1. The two analysis tools of interest for this current research are the Environmental Design Space (EDS) and the Aviation Environmental Design Tool (AEDT). Policy and Scenarios
Economic Response Tool for Aviation
Environmental Impact Valuation
for Aviation
Aviation Environmental
Design Tool
Environmental Design Space
What are the airline supply & consumer demand effects?
What are the vehicle design characteristics?
What are the noise, emissions
and fuel burn characteristics?
What are the physical & socio-
economic environmental
impacts?
Aviation Environmental Portfolio Management ToolWhat are the monetized benefits of decision alternatives?
Policy and Scenarios
Economic Response Tool for Aviation
Environmental Impact Valuation
for Aviation
Aviation Environmental
Design Tool
Environmental Design Space
What are the airline supply & consumer demand effects?
What are the vehicle design characteristics?
What are the noise, emissions
and fuel burn characteristics?
What are the physical & socio-
economic environmental
impacts?
Aviation Environmental Portfolio Management ToolWhat are the monetized benefits of decision alternatives?
Fig. 1. FAA Tool Suite
EDS [5] provides the capability to estimate
source noise, exhaust emissions, performance, and economic parameters for potential future aircraft designs under different policy and technological scenarios. This capability will allow for assessments of interdependencies at the aircraft level. While the primary focus of EDS is future aircraft designs (which includes technology modifications to existing aircraft), the tool is capable of analyzing existing aircraft designs (current technology levels) under different scenarios. Capturing high-level technology trends provides a capability for
assessment of benefits and impacts for multiple policy scenarios.
AEDT [6] consists of the “integration and harmonization of existing analysis tools, including the Integrated Noise Model (INM — local noise analysis), the Emissions and Dispersion Modeling System (EDMS — local emissions analysis), the Noise Integrated Routing System (NIRS) [7], the Model for Assessing Global Exposure form Noise of Transport Airplanes (MAGENTA — global noise analysis) and the System for assessing Aviation's Global Emissions (SAGE — global emissions analysis)” [8,9]. AEDT models an aircraft performance based on coefficients based on the Society of Automotive Engineers (SAE) Aerospace Information Report (AIR) 1845 [10] and EUROCONTROL’s Base Aircraft Data (BADA) [11]. For one representative aircraft, more than 2000 coefficients are required to define the performance, emissions, and noise characteristics in the terminal area and enroute. As such, AEDT integrates existing noise and emissions models so interdependencies between aviation-related noise and emissions impacts can be assessed at the fleet level.
Both EDS and AEDT are sophisticated models that, when connected, allow for the quantification of advances in aircraft technology and fleet level operations on noise, emissions, and fuel burn, but not in a real time. For a single policy scenario analysis, the set up and run time for both models can take on the order of months to execute. This paper focuses on the creation of surrogate representations of both models such that numerous policy scenarios can be evaluated rapidly to better inform future aviation environmental policy.
3 Approach
The development of a rapid aviation environmental analysis tool requires the development of two key elements:
• Surrogate representation of the current fleet
• Simplification of the fleet operations; both current and future
The approach for each of the elements will be discussed herein.

3
DEVELOPMENT OF AN INTERACTIVE CAPABILITY TO TRADE OFF NEW TECHNOLOGIES AND AIRCRAFT TO REDUCE AVIATION ENVIRONMENTAL IMPACTS
3.1 Surrogate (Generic) Fleet Development
The fundamental idea of a surrogate fleet was conceived from the observation that a great deal of similarity exists among certain classes of aircraft. For instance, despite differences in engineering details, the Airbus A320 and Boeing B737 aircraft families possess similarities in terms of design attributes, operational capabilities, and environmental impacts. Taking advantage of such similarities, the entire current commercial fleet may be characterized into classes of aircraft based on their capabilities. A generic EDS vehicle model would then be developed to represent all of the aircraft within each capability class. Thus, the performance of the entire commercial fleet may be quickly represented by this smaller subset of generic vehicles constituting a surrogate fleet. The surrogate fleet could then be used for rapid technology assessments of how the fleet might evolve in the future.
Three test approaches for developing a surrogate fleet were established: the parametric correction factor approach, the average replacement approach, and the outstanding representative approach. The first three steps for surrogate fleet generation are the same for each of these three methods: characterizing the commercial fleet, generating reference fleet data, and development of reference aircraft models.
Characterization of the fleet involves identifying the aircraft desired to be captured by the surrogate fleet, collecting relevant aircraft performance data, and segmenting the fleet into classes based on capability. Additionally, the current fleet must be identified as in-production or out-of-production, because currently out-of-production aircraft are unlikely to be competitive in a future market and their contribution to the fleet continuously dwindles as they retired. In contrast, aircraft that are currently in-production are likely to stay in the market until new platforms intended for replacement are introduced. Identification of aircraft in this sector is of interest because future vehicle technologies will be applied to the in-production aircraft, impacting the performance of the entire fleet.
Generating reference fleet data is the next step and is used to provide performance targets for the surrogate fleet to match. In the context of this study, with AEDT being used as the fleet analysis tool, this involved collecting the set of AEDT definitions for each aircraft in each capability class. Once the information was collected, AEDT was executed for each aircraft over a range of flight distances and altitudes representing the distribution of actual commercial flights logged during a representative set of worldwide operations from 2006. The resulting fleet level outputs are compiled to provide targets for the surrogate fleet approaches. The metrics that are of interest for the scope of this study are terminal area fuel burn, terminal area NOx emissions, total mission fuel burn, and total mission NOx emissions. AEDT is capable of generating all of these results.
The third step is to develop a physics-based reference aircraft for each of the aforementioned capability classes. These models are then used in the surrogate fleet approaches described in the next three subsections. In order to capture the physical interdependencies at the aircraft-level, EDS is used as the engine and aircraft modeling tool. Calibrating each EDS model to the public domain data that is available for any particular aircraft is a resource intensive process, but the team has created EDS models for aircraft in different seat classes, including the Bombardier CRJ900, the Boeing 737-800, Boeing 767-300ER, and Boeing 777-200ER, some of which have been reviewed by an independent review group, which consisted of manufacturers and research entities world-wide. The EDS models are capable of generating a set of AEDT input files to subsequently run through AEDT for fleet level metrics.
Parametric Correction Factor Approach The development of parametric correction factors focuses on the four fleet metrics of interest. An overview of parametric correction factor generation is depicted in Fig. 2. Beginning in the EDS modeling space on the left, the reference vehicle in each capability class is run to generate AEDT coefficients and run through AEDT with the same distribution of

KIRBY, BECKER, ISLEY, BURDETTE, MAVRIS
4
flights that were used to run the vehicles from the AEDT database, depicted notionally by the red circles in the AEDT coefficient space. Once AEDT results were generated, correction factors for each fleet metric of interest, represented by the arrows in the AEDT response space on the right, can be calculated for each AEDT vehicle as a function of the flight distances that were actually flown. The correction factors allow the EDS reference vehicle to be used as a surrogate for the AEDT representation. Thus, one vehicle with correction factors can be used to represent all aircraft within that capability class.
EDSModeling
AEDTCoefficients
Reference Vehicle
AEDTResponses
AEDT Vehicle Models
Fig. 2. Parametric Correction Approach
The method to calculate the correction factors is depicted in Fig. 3. A response of interest generated for the EDS vehicle, YGV,i, can be parametrically corrected by the flight distance by adding the terms a2Ri
2 + a1Ri + a0 to form the corrected EDS vehicle response, Y’GV,i. The parametric correction factor for a particular response Y is:
0i12i2Y aRaRa ++=Δ
The coefficients a2, a1, and a0 are then solved for to minimize the sum of squares error between the corrected EDS responses and the AEDT vehicle responses corresponding to each engine and airframe combination over the entire range of flight distances.
Once the parametric correction factors have been developed for each capability class for the baseline set of operations, the sensitivity to variations in aircraft and operations mix must be assessed to determine robustness under different future fleet scenarios. This assessment is pursued through variation of the fleet operations mix and determination of how the
resulting aggregate fleet results for fuel burn and NOx vary in comparison to the AEDT reference fleet when calculated through application of the correction factors. The operational data for the aircraft in the fleet of interest from six weeks of actual 2006 operations was used as the baseline. In order to quickly generate different operational distributions for parametric correction factor evaluation, sample distributions were created using sums of three beta distributions. These beta distributions were used to perturb the number of flights for each flight distance and aircraft/engine combination to ±20% of their baseline values. The reason for using composite distributions is that they are able to generate more complex and more realistic operational scenarios, e.g. for flight distributions that may be bimodal.
iAEDT,Y
Res
pons
e
Flight Distance
EDS Generic Vehicle Model
AEDT Vehicle Model (for a particular airframe/engine combination)
0i12i2iGV,iGV, aRaRaYY +++=′
RiGV,Y
Corrected EDS Generic Vehicle Model
iR1R nR
Fig. 3. Calculating parametric correction
factors
Using the composite beta distribution approach, thousands of potential operations mixes can be rapidly generated, along with different combinations of aircraft mixes by varying aircraft weighting within the fleet of interest. Fleet performance using the parametric correction factors is then calculated and evaluated to determine the suitability of this method for future fleet scenarios. When complete, the parametric correction factor approach reduces the entire fleet to a surrogate fleet consisting of a set of reference aircraft plus a database of correction factors for each aircraft.
Average Vehicle Replacement Approach The second approach presented in this work is the average vehicle replacement approach. This approach creates a single EDS vehicle model for each capability class that, when flown through the same operations mix as the aircraft of the capability class, will result in the same

5
DEVELOPMENT OF AN INTERACTIVE CAPABILITY TO TRADE OFF NEW TECHNOLOGIES AND AIRCRAFT TO REDUCE AVIATION ENVIRONMENTAL IMPACTS
aggregate results. A notional illustration of this approach is provided in Fig. 4. Beginning in the EDS modeling space on the left, a Design of Experiments (DoE) is executed around the baseline vehicle varying engine cycle and airframe geometry parameters within the bounds of the aircraft within the fleet of interest. Moving to the right in the figure, each case run in the DoE would represent a potential average vehicle replacement model, and EDS would generate AEDT coefficients for each one of them, allowing them to be run through AEDT to generate their AEDT responses for fuel burn and NOx. Once the AEDT responses have been generated as depicted in the AEDT response space on the right, the operations mix of the fleet of interest may be applied to each aircraft, and the single aircraft that best represents the aggregate fleet may be filtered out.
EDSModeling
AEDTCoefficients
AEDTResponses
Run DOE
Run AEDT
Target
Fig. 4. Average Vehicle Replacement
As part of this approach, the target for the average replacement vehicle, representing the aggregate results of the fleet of interest, was calculated using the AEDT results along with a given operations mix. The calculation used to generate aggregate fleet metrics is provided below. As previously described, AEDT generates fleet metrics for missions of varying flight distances. Each vehicle result for each of these missions, Yn,i,j, is multiplied by the number of flights for that particular mission’s flight distance for the vehicle from the representative set of 2006 operations, NFD,n,i. This product was calculated for each mission and then summed over the total number of flight distance for the aircraft and all the aircraft in the fleet of interest.
∑ ∑= =
⎟⎠
⎞⎜⎝
⎛=
NumAC
1n
NumFD
1i,,,leetAggregateFY ininFD YN
Because the distribution of flights is a part of the target generation for the average replacement vehicle, as the aircraft and operations mixes change, the target shifts. The accuracy of the average vehicle’s ability to capture such changes may be tested using the AEDT models of the fleet of interest. Similar to what was proposed for the parametric correction factor approach, the operations mix of the fleet of interest will be represented by parameterized composite beta distributions. Each distribution was applied to the AEDT models of the fleet of interest, and aggregate fleet results were compared to the average vehicle flying the same distribution of flight distance.
Outstanding Representative Approach The goal of the outstanding representative approach, as its name suggests, is to evaluate the use of one single already existing EDS vehicle in capturing the performance of an entire capability class. In a similar manner as with the average vehicle approach, targets for the fleet metrics would be calculated for the fleet of interest. An overview of this method is depicted in Fig. 5. Moving from left to right in the figure, the best-in-class vehicle would be run through EDS to generate AEDT coefficients, AEDT results would be generated, and comparisons would be made to the target of interest. Comparing Fig. 5 with Fig. 2 and Fig. 4, it is easy to see that this approach is the simplest of the three; however it is also most likely the least accurate approach.
EDSModeling
AEDTCoefficients
AEDTResponses
Run EDS
Run AEDT
Target
Fig. 5. Outstanding Representative Approach

KIRBY, BECKER, ISLEY, BURDETTE, MAVRIS
6
3.2 Surrogate (Generic) Operations Development
The next element needed to create a rapid aviation environmental tradeoff capability is a simplified approach to model the current and future fleet operations. As part of the development of this capability, a literature review was conducted on other approaches. Numerous studies have been undertaken to estimate the future growth of the aviation sector and to calculate the resulting emissions under various conditions. These studies vary in many aspects: in time scale – from a few decades to over a century; in economic detail – from relatively fixed forecasts to partial equilibrium models; in geographic aggregation – from very large groupings to individual countries; and in technical detail – from simple fuel burn approximations to more in-depth physics-based aircraft representations.
Vedantham and Oppenheimer describe a long-term dynamical systems model with logistic growth of aviation out to 2100 [12]. They paid particular attention to emerging markets in developing countries and determined that a considerable amount of excess demand exists in those areas which may not be captured by shorter time horizon modeling efforts. They advocate effective technology transfer to these areas to help offset the growth in aviation emissions that comes with economic expansion.
Hidalgo, Ciscar, and Soria presented the IPTS Air Transport Model [13], which is based on the IPTS Poles partial equilibrium energy sector model [14]. This model is designed to forecast out to 2050 and uses 78 macro-economic regional markets to predict the energy use and emissions of global aviation. Capacity and cost constraints are incorporated into the growth model. Aircraft are aggregated into ten groups. The main purpose of the model was to investigate the possible inclusion of aviation into the European cap and trade emission system. They concluded that if left out of the emission trading scheme, increases in aviation emissions could neutralize a significant share of the reductions assigned to the EU by the Kyoto Protocol and that emissions trading is the most cost effective measure to reduce emissions.
The Aviation Integrated Modelling Project (AIM) is outlined in [15] and is composed of modules which deal with aircraft emissions and performance estimation, demand modeling, local air quality, global environmental impact, and airport activity, among others. The tool is designed to give maximum flexibility to potential policy analyst and operates at local through global levels with variable fidelity.
Olsthoorn developed a statistical time series relationship between bunker jet fuel, world crude oil prices, and global gross domestic product (GDP) for the years 1966 to 1995. This relationship is then used to estimate emissions out to the year 2050 [16]. The results pertain to international aviation only and do not take into account technological improvements or any structural changes in the aviation market.
The approach taken in this research is simple economic forecasting, minimal geographic aggregation, and physics-based aircraft modeling. It is based on a tool accepted for use by CAEP called the Fleet and Operations Module (FOM) [17]. The approach taken herein makes several simplifications to the original FOM which drastically reduce the execution time; where this approach excels in comparison to most of these tools is in its very fine aggregation and ability to incorporate technology infused aircraft from the generic fleet discussed earlier. In fact, the FOM results are what will be used as ‘gold standard’ data for the verification of the approach. Thus, a discussion of the FOM’s methodology and limitations is important.
The FOM incorporates three major aspects: aircraft retirements, aircraft replacement functions, and operations growth. The FOM is used in conjunction with the Forecasting and Economic Analysis Support Group (FESG) forecast to predict the future path of operations by route ID, stage length, and aircraft seating size. In essence, growth rates for the different route groups are processed through a frequency capacity model which shifts operations to larger aircraft as capacity constraints are approached. The frequency/capacity algorithm is stage length dependent and thus one final output of the FESG forecasting process is a forecast by route group, stage length, and seat class.

7
DEVELOPMENT OF AN INTERACTIVE CAPABILITY TO TRADE OFF NEW TECHNOLOGIES AND AIRCRAFT TO REDUCE AVIATION ENVIRONMENTAL IMPACTS
The FOM assigns operations to either a ‘used’ fleet or a ‘new’ fleet. The ‘new’ fleet is provided in a format to easily allow subsequent modeling tools to assign actual aircraft to origin-destination (OD) pairs as needed. This is typically done with a replacement schedule – and while the schedule is technically not part of the FOM process, any subsequent emissions analysis must include this step.
The process for implementing the simplified FOM is depicted in Fig. 6. A datum set of operations constitute the bulk of the user inputs. Retirement schedules are utilized to determine the attrition rate of the different aircraft in the fleet. The FESG forecast is then used to predict the future demand by route group, stage length, and seat classes. This demand, along with the retired operations, constitutes the number of new operations needed for every OD pair and seat class. The seat class demand is converted into actual aircraft types via user defined replacement schedules. This information is combined with the retirement data to update the base set of operations to the desired forecast year. This new set of operations is then used as the base set for the next forecast period. New replacement schedules can be specified for every forecast period.
The first step in the FOM process calculates the number of operations that should have retired during the prior forecast period. The FOM makes an assumption of uniform utilization which allows survival curves (meant for aircraft) to be used for operations. The FOM does not keep track of how many aircraft are in service; only how many operations are performed. One current limitation of the FOM is that it does not retire any aircraft added to the fleet by the forecast. This can have significant implications as will be discussed later. Once operations are retired and new growth is estimated using the forecast, a replacement schedule determines how new operations are distributed to aircraft. The replacement schedule allocates operations to specific aircraft based on the forecast year, aircraft size, and OD pair.
Retire Aircraft
Compute New Operations for every OD Pair and Seat Class
Assign Actual ACFamilies to each OD Pair
Update Operations
Use Updated Fleet for the Next
Forecast
Remove Retired A/C
Base Operations
Start w/Datum Year
Operations
Retire Aircraft
Compute New Operations for every OD Pair and Seat Class
Assign Actual ACFamilies to each OD Pair
Update Operations
Use Updated Fleet for the Next
Forecast
Remove Retired A/C
Base Operations
Start w/Datum Year
Operations
Fig. 6. Simplified overview of the FOM
A pictorial representation of the FOM process for a single OD pair is depicted in Fig. 7. This process is repeated tens of thousands of times for every forecast period and growth is modeled from 2016 to 2026. The orange boxes represent the operations left from the datum year 2006. The example assumes that the FOM was already used once to go from 2006 to 2016 – the resulting forecasted operations are the blue boxes. The diagram illustrates an imaginary OD pair which has 5 aircraft within the given seat class (the actual seat class number is irrelevant; the process is the same for all of them).
The first step in the FOM is to determine the number of operations retiring. In the FOM, only the original fleet (from 2006) is subject to retirement. This step results in splitting the orange box and creating the red, retiring boxes. Growth is then applied and each box is grown by the same percentage. The new operations and the retiring operations are then all combined into a ‘replacement pool.’ The pool is summed and a replacement schedule is used to determine which aircraft receive the new operations (the purple boxes). In this case, the replacement schedule specifies some operations to go to aircraft 2 and a larger percentage to aircraft 5. Notice that aircraft 5 had no operations in the base year (2016). This could model the introduction a new aircraft type in the year 2026. In the final step, the prior forecasted operations (blue) and the new forecasted operations (purple) are combined and the new set of operations can then be used to forecast the next period. This approach will be implemented and compared to the original FOM results.

KIRBY, BECKER, ISLEY, BURDETTE, MAVRIS
8
AC1
AC2
AC3
AC4
AC5
Retiring OperationsOriginal Fleet OperationsPrior Forecasted OperationsNew Forecasted Operations
(no operations in base year)
Base Year Operations
Retirements Calculated
Growth Applied
Replacements Determined
New Operation Set Created
Unique ACCODE, ENG_CODE, and ENG_MOD
Replacement Pool
2016 2026
Fig. 7. FOM process for a single OD pair
4 Implementation
As mentioned above, the rapid aviation environmental tradeoff capability requires the development of two key elements: 1) Surrogate representation of the current fleet, and 2) simplification of the fleet operations; both current and future. The implementation and accuracy of each element will be discussed.
4.1 Surrogate (Generic) Fleet Results
The application of the three approaches to developing a generic fleet to a regional jet, single-aisle, and large twin-aisle classes is presented here. The lists of in-production airframes considered to be in the regional jet, single-aisle and large twin-aisle class for this study, composing the fleet of interest, were represented by Embraer, Bombardier, Airbus, and Boeing aircraft. This list was compiled by combining aircraft data from the AEDT Fleet database with production status based on manufacturer’s websites. The AEDT input files for each vehicle in the fleet of interest was collected and flown through a representative set of operations for 2006 to generate aggregate fleet targets for the four metrics of interest.
The results for each approach applied to a baseline set of operations are described herein. As described above, the parametric correction factor approach was applied to all of the vehicles for each of the three aircraft classes, using the EDS CRJ900 with CF34 engines, EDS 737-800 with CFM56-7B27 engines, and EDS
777-200ER with GE90-94B engines as the baseline vehicle vehicles for the regional jet, single-aisle, and large twin-aisle classes, respectively. The results for the parametric correction factor approach are presented in green in Fig. 8 for the large twin-aisle class, which was representative of all the classes. They are all well within 1%, demonstrating that the parametric correction factor approach was able to very accurately capture the results of the entire fleet of interest in AEDT for the baseline set of operations.
To execute the average replacement approach, a space-filling Latin Hypercube design of experiments (DoE) was selected to thoroughly cover the design space and executed. After filtering the results, a point very close to zero error from the targets for both of the fuel burn metrics may be selected. In order to hit the targets for the NOx metrics, a separate 1000 case space-filling DoE was run using the best fuel burn case from the 10,000 case DoE to vary its NOx correlation based on the bounds defined by the fleet of interest. The results for all the fleet metrics in relation to the targets for the AEDT fleet of interest are depicted in Fig. 8 for the large twin aisle configuration. Again, this result was representative of all the generic aircraft, specifically regional jet, single aisle and small twin aisle configurations. All of the errors are within ±1% for the parametric and average replacement approaches. As expected, the outstanding representative approach had much higher errors than the other two approaches, off of the scale of the chart for three of the metrics.
0.41%
-0.05%0.01%
-0.12%-0.18%
-0.91%
0.08%
0.66%
-5.43%-6.58%
46.6%1.66%
-2.00%
-1.00%
0.00%
1.00%
2.00%
Total FB Total NOx FB below3000ft
NOx below3000ft
Diff
eren
ce R
elat
ive
to
AE
DT
Fle
et
Parametric Correction FactorAverage ReplacementOutstanding Representative
Fig. 8. Generic Fleet results
9
DEVELOPMENT OF AN INTERACTIVE CAPABILITY TO TRADE OFF NEW TECHNOLOGIES AND AIRCRAFT TO REDUCE AVIATION ENVIRONMENTAL IMPACTS
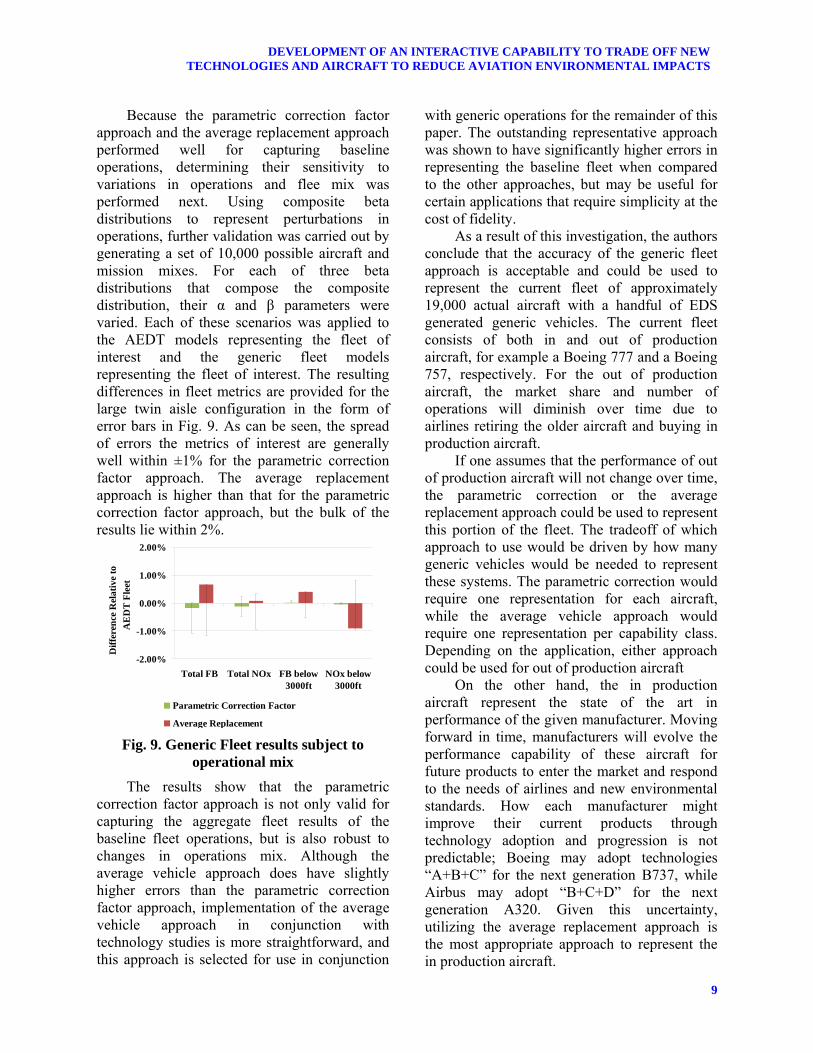
Because the parametric correction factor approach and the average replacement approach performed well for capturing baseline operations, determining their sensitivity to variations in operations and flee mix was performed next. Using composite beta distributions to represent perturbations in operations, further validation was carried out by generating a set of 10,000 possible aircraft and mission mixes. For each of three beta distributions that compose the composite distribution, their α and β parameters were varied. Each of these scenarios was applied to the AEDT models representing the fleet of interest and the generic fleet models representing the fleet of interest. The resulting differences in fleet metrics are provided for the large twin aisle configuration in the form of error bars in Fig. 9. As can be seen, the spread of errors the metrics of interest are generally well within ±1% for the parametric correction factor approach. The average replacement approach is higher than that for the parametric correction factor approach, but the bulk of the results lie within 2%.
-2.00%
-1.00%
0.00%
1.00%
2.00%
Total FB Total NOx FB below3000ft
NOx below3000ft
Diff
eren
ce R
elat
ive
to
AE
DT
Fle
et
Parametric Correction Factor
Average Replacement Fig. 9. Generic Fleet results subject to
operational mix
The results show that the parametric correction factor approach is not only valid for capturing the aggregate fleet results of the baseline fleet operations, but is also robust to changes in operations mix. Although the average vehicle approach does have slightly higher errors than the parametric correction factor approach, implementation of the average vehicle approach in conjunction with technology studies is more straightforward, and this approach is selected for use in conjunction
with generic operations for the remainder of this paper. The outstanding representative approach was shown to have significantly higher errors in representing the baseline fleet when compared to the other approaches, but may be useful for certain applications that require simplicity at the cost of fidelity.
As a result of this investigation, the authors conclude that the accuracy of the generic fleet approach is acceptable and could be used to represent the current fleet of approximately 19,000 actual aircraft with a handful of EDS generated generic vehicles. The current fleet consists of both in and out of production aircraft, for example a Boeing 777 and a Boeing 757, respectively. For the out of production aircraft, the market share and number of operations will diminish over time due to airlines retiring the older aircraft and buying in production aircraft.
If one assumes that the performance of out of production aircraft will not change over time, the parametric correction or the average replacement approach could be used to represent this portion of the fleet. The tradeoff of which approach to use would be driven by how many generic vehicles would be needed to represent these systems. The parametric correction would require one representation for each aircraft, while the average vehicle approach would require one representation per capability class. Depending on the application, either approach could be used for out of production aircraft
On the other hand, the in production aircraft represent the state of the art in performance of the given manufacturer. Moving forward in time, manufacturers will evolve the performance capability of these aircraft for future products to enter the market and respond to the needs of airlines and new environmental standards. How each manufacturer might improve their current products through technology adoption and progression is not predictable; Boeing may adopt technologies “A+B+C” for the next generation B737, while Airbus may adopt “B+C+D” for the next generation A320. Given this uncertainty, utilizing the average replacement approach is the most appropriate approach to represent the in production aircraft.

KIRBY, BECKER, ISLEY, BURDETTE, MAVRIS
10
Thus, even if no new aircraft were introduced in the future, the EDS generic vehicles represented with the average vehicle approach could still be used to assess a fixed technology fleet in future years. However, this is not a realistic future since manufacturers do evolve their products and introduce new and improved systems over time. Typical aviation policy analyses use a fixed technology fleet a basis to compare different future scenarios, which may in fact include technological advancements beyond the current state of the art. As such, using the average vehicle approach with the ability to infuse technological advances on those vehicles becomes a powerful enabler for rapid assessment of different future aviation scenarios.
4.2 Surrogate (Generic) Operations Results
Based on the success of the generic fleet representation, the next obvious element needed to rapidly inform future aviation policy decisions is a means to evolve the current fleet to a future state; for a fixed technology fleet and a technology advanced fleet. To accomplish this means, the authors wish to develop an approach to simplify the FOM.
The development of a simplified approach to implementing the FOM takes advantage of several simplifications to reduce the computation time. Two approaches were considered and include “binning” the actual aircraft to families and reduction of specific OD pairs. First, the number of specific aircraft types was reduced by aggregating the aircraft to bins. Aircraft bins refer to the level of granularity of aircraft information contained in the model. For example, instead of each derivative of B737s that are in production, they could all be grouped into a B737 “class”. This was done for all in and out of production aircraft such that the more than 200 specific aircraft types were reduced to approximately 80 aircraft families.
Next, to reduce the number of OD pairs under considerations, a sample set of operations was used in lieu of an entire year’s operations. OD pairs were also aggregated so that departure and arrival airports are treated the same (i.e.,
LAX to JFK is the same as JFK to LAX). This halves the number of OD pairs.
In addition, the number of aircraft bins was reduced by creating “Aircraft Families” (ACFamilies) such that new retirement curves using a base year operations weighted average of the original retirement curves for the constituent members could be established. In the FOM, the percentage of retiring operations (for every aircraft bin) for every forecast period is pre-computed. In the simplified approach used herein, a representative survival rate curve was used to generate these values. The equation below was used to compute the number of retiring operations.
Si and Si-1 are the survival rates for forecast
period ‘i’ and ‘i-1’ respectively. Dividing the remaining original fleet by the prior period’s survival rate provides the size of the original fleet at time zero. Multiplying this by the survival rate delta between the current forecast period and the prior period produces the number of newly retired operations. This calculation was performed for every OD pair and ACFamily in the forecast. The final simplification was to run the forecast with a time step of ten years. The FOM also has this capability, but the validation data provided was run with single year resolution.
The simplified implementation was tested using the same inputs as the original FOM and produced the same output. The simplifications discussed previously were then made and the results re-run and compared to the FOM output. Due the aggregation of aircraft into larger families, the most accurate results should pertain to the highest levels of aggregation, with the error increasing as more granularity is exposed. This should be expected as the retirement curves and fuel burn relationships were weighted towards the original datum set of operations. Thus, an individual aircraft / OD pair might have very large fuel burn and operation count errors as it may not have contributed much to the aircraft family weighted averages.

11
DEVELOPMENT OF AN INTERACTIVE CAPABILITY TO TRADE OFF NEW TECHNOLOGIES AND AIRCRAFT TO REDUCE AVIATION ENVIRONMENTAL IMPACTS
Two evaluation criteria were used to determine the appropriateness of this approach: execution time and accuracy. Assuming that the FOM results were the “gold standard”, an initial comparison of the fuel burn accuracy and execution time for aggregating the fleet to ACFamilies and the time step of the forecast yielded promising results. The first comparison was for a time step of one year for the ACFamilies. The global fuel burn results had a total error in fuel burn of 0.03% with an execution time of 30 minutes, compared to hours. Since a rapid tradeoff capability was desired at the outset of this research, the next evaluation was focused towards reducing execution time, which was necessitated an increase in time step of the forecast from one to ten years. The global fuel burn error associated with this evaluation was 0.14% in an execution time of approximately three minutes. Within the context of global fuel burn estimates, this simplified approach to implementing the FOM has an exceptional level of accuracy.
The next obvious question of the applicability of this approach would be to determine whether or not the accuracy at the global level is consistent at the route group level. The comparison of the operations and fuel burn totals by route group is depicted in Fig. 10. The largest error increased to 0.95% for fuel burn within the North American route group. This result is well within the acceptable level of accuracy desired.
Fig. 10. 2036 fuel burn and operations
percent error by route group
5 Conclusions
This paper has provided an overview of a research effort being conducted to allow for the tradeoff of advances in aircraft technology along with fleet forecasts to enable a rapid capability to assess aviation environmental consequences. Two key elements were posed that are enablers to achieve this capability, specifically a generic fleet representation of the thousands of actual aircraft and a surrogate representation of the fleet operations, both current and future. Approaches for each element were described and executed and show that the realization of a simplified approach to modeling the current and future fleet is possible with an acceptable level of accuracy. Approaches to test the two key elements were presented and resulted in acceptable levels of accuracy. Further research will be conducted on both elements to ensure robustness for multiple applications. However, initial results are extremely promising to enable the further development of a rapid tool to inform aviation environmental policy decisions moving forward.
6 Acknowledgements
This work was funded by the FAA under PARTNER (a FAA/NASA-TC sponsored Center of Excellence) under Grant Nos: 05-C-NE-GIT, Amendment Nos. 001, 003 and 007, 03-C-NE-MIT, Amendment Nos. 011, 015, 018, 022, 025, and 034, 07-C-NE-GIT, Amendment No. 001, 006, 008, and 013, and 06-C-NE-MIT, Amendment No. 004. EDS project is managed by Joseph DiPardo in the FAA/AEE. Any opinions, findings, and conclusions or recommendations expressed in this material are those of the author(s) and do not necessarily reflect the views of the FAA, NASA or Transport Canada.
7 Contact Author Email Address
For further information about the topics presented herein, the reader is directed to the email below:

KIRBY, BECKER, ISLEY, BURDETTE, MAVRIS
12
References
[1] Airbus, “Current Market Outlook 2009-2028,”
http://www.airbus.com/en/corporate/gmf2009, accessed 5 May 2010.
[2] Boeing, “Current Market Outlook 2009-2028,” http://www.boeing.com/commercial/cmo/index.html, accessed 5 May 2010.
[3] Federal Aviation Administration, “Terminal Area Forecast Summary, Fiscal Year 2009-2030,” 2009.
[4] Federal Aviation Administration, “Aviation Environmental Tools Suite,” http://www.faa.gov/about/office_org/headquarters_offices/aep/models/, accessed 25 June 2010.
[5] Kirby, M.R., Mavris, D.N., “The Environmental Design Space,” ICAS 2008-4.7.3, 2008.
[6] Federal Aviation Administration, Aviation Environmental Design Tool (AEDT),” http://www.faa.gov/about/office_org/headquarters_offices/aep/models/aedt/, accessed 25 June 2010.
[7] Metron Aviation, “Noise Integrated Routing System/NIRS Screening Tool,”, http:// www.metronaviation.com/solutions/environmental-tools /nirsnst.html, accessed May 2010.
[8] Federal Aviation Administration, “Environmental Tool Suite Frequently Asked Questions,” http://www.faa.gov/about/office_org/headquarters_offices/aep/models/toolsfaq/ [28 December 2008].
[9] Roof, C., et. al., “Aviation Environmental Design Tool (AEDT) System Architecture,” Doc #AEDT-AD-01, January 29, 2007.
[10] SAE Committee A-21, Aircraft Noise, “Procedure for the Calculation of Noise in the Vicinity of Airports”, Aerospace Information Report No. 1845, Warrendale, PA: Society of Automotive Engineers, Inc., March 1986.
[11] “User Manual for the Base of Aircraft Data (BADA). Revision 3.6”, European Organisation for the Safety of Air Navigation, September 2004.
[12] Vedanthan, A., Oppenheimer, M., "Long-term scenarios for aviation: demand and emissions of CO2 and NOx," Energy Policy, vol. 26, no. 8, pp. 625-641, November 1998.
[13] Hidalgo, I., Ciscar, J., and Soria, A., "A Dynamic, Technology-based Air Transportation Model: Description and Some Applications," Institute for Prospective Technology Studies, EUR 22617 EN, 2006.
[14] European Union, IPTS Energy, Transport and Climate Change Group, “The POLES model”, http://energy.jrc.ec.europa.eu/Pages/Activities.htm, accessed March 2010.
[15] Reynolds, T.G., Barrett, S., Dray, L.M., Evans, A. D., and Kohler, M. O., "Modelling Environmental & Economic Impacts of Aviation: Introducing the Aviation Integrated Modelling Project", AIAA-2007-7751.
[16] Olsthoorn, X., "Carbon dioxide emissions from
international aviation: 1950-2050," Journal of Air Traffic Management, vol. 7, pp. 87-93, 2001.
[17] Grandi, F. “Review of the Fleet and Operations Module (FOM) Assumptions and Limitations,” CAEP/8-MODTF-3_WP1, October 2007.
Copyright Statement The authors confirm that they, and/or their company or organization, hold copyright on all of the original material included in this paper. The authors also confirm that they have obtained permission, from the copyright holder of any third party material included in this paper, to publish it as part of their paper. The authors confirm that they give permission, or have obtained permission from the copyright holder of this paper, for the publication and distribution of this paper as part of the ICAS2010 proceedings or as individual off-prints from the proceedings.