development of an automated monitoring system for ovoc …€¦ · development of an automated...
TRANSCRIPT

Development of an automated monitoring system for OVOC and nitrile compounds in ambient air
J. Roukos, H. Plaisance & N. Locoge Département Chimie et Environnement, Ecole des Mines de Douai, France
Abstract
Few studies have been conducted on Oxygenated Volatile Organic Compounds (OVOC) because of problems encountered during the sampling/analyzing steps induced by water in sampled air. Consequently, there is a lack of knowledge of their spatial and temporal trends and their origins in ambient air. In this study, an analyzer consisted of a thermal desorber (TD) interfaced with a gas chromatography (GC) and a flame ionization detector (FID) has been developed for online measurements of 18 OVOC in ambient air including 4 alcohols, 6 aldehydes, 3 ketones, 3 ethers, 2 esters and 4 nitriles. The main difficulty was to overcome the humidity effect without loss of compounds. Water amount in the sampled air was reduced by the trap composition (two hydrophobic graphitized carbons: Carbopack B/Carbopack X), the trap temperature (held at 12.5°C), by diluting (50:50) the sample before the preconcentration step and a trap purge. Humidity management allowed the use of a polar Lowox column in order to separate the polar compounds from the hydrocarbon/aromatic matrix. The breakthrough volume was found to 405 ml for ethanol by analysing a standard mixture at a relative humidity of 80%. Detection limits ranging from 10 ppt for ETBE to 90 ppt for ethanol were obtained for 18 compounds. Good repeatabilities were obtained at two levels of concentration (Relative Standard Deviation <5%). The calibration (ranging from 0.5 to 10 ppb) was set up at three different levels of relative humidity to test the humidity effect on the response coefficients. Results showed that the response coefficients of all compounds were less affected except for those of ethanol and acetonitrile (decrease respectively of 30% and 20%). Keywords: OVOC & nitrile analysis, online measurement, analytical validation.
Air Pollution XVII 215
www.witpress.com, ISSN 1743-3541 (on-line)
© 2009 WIT PressWIT Transactions on Ecology and the Environment, Vol 123,
doi:10.2495/AIR090201

1 Introduction
OVOC play an important role in tropospheric chemistry especially in ozone, photooxidant and secondary organic aerosol formation [1]. OVOCs originate from both direct emissions by biogenic and anthropogenic sources, and secondary production from the oxidation of hydrocarbons [1, 2]. Few studies [4–8] have been dedicated to the measurement of OVOC in ambient air due to analytical problems. Consequently, there is a lack of knowledge of OVOC spatial and temporal trends and their origins in ambient air. These problems are mostly caused by water interferences. The studies have reported two distinct ways to overcome the humidity effect: methods that eliminate water from sample and methods that reduce relative humidity in the trap. The use of Nafion membrane dryer, cryogenic water trap or crystalline salt can eliminate water from the sample but lead to losses of OVOC. The warm trap method [9], dilution of sampled air by dry purified air [10] and the reduction of the sampled air volume [11] reduce the humidity from sampled air without OVOC losses. The online measurement is adapted to study the evolution of OVOC concentration in ambient air thus providing clues on their origins. The most common method for the online measurements is sampling and preconcentration of compounds on solid adsorbents followed by a thermal desorption (TD) and gas chromatographic (GC) analysis. Two different approaches can be used for the separation and the detection of OVOC: (i) a non polar column [3, 4, 6, 7] coupled to mass spectrometry (MS) in order to resolve the co-elution problems (ii) a sufficient separation or a polar column [12] coupled to a non-specific detector, flame ionization detector (FID). The use of MS for field campaign is delicate and need attention for calibration thus we have chosen to use a polar column enabling to isolate the polar compounds from the dominant aliphatic/aromatic matrix coupled to FID [13]. This paper presents the analytical development of a method based on TD-GC-FID suitable for routine, near real time quantitative determination of 18 OVOC in ambient air including 4 alcohols, 6 aldehydes, 3 ketones, 2 ethers, 3 esters and 4 selected nitriles (Table 1). This
Table 1: List of the target compounds and their peak number on chromatograms (MVK: Methyl Vinyl Ketone, ETBE: Ethyl Tert-Butyl Ether).
Familly compound Peak number Familly compound Peak numberEthanol 14 Acetone 11
Isopropanol 15 MVK 12Butanol 19 2-Butanone 13
Isobutanol 17 ETBE 5Acetaldehyde 4 Furan 1
Propanal 6 2-methyl furan 2Butanal 10 Ethyl acetate 12
Benzaldehyde 20 Butyl acetate 18Acrolein 7 Acetonitrile 9
Methacrolein 8 Pentanenitrile 16Heptanenitrile 21Octanenitrile 22
Esters
NitrilesTolueneAromatic compound 3
Alcohols
Aldehydes
Ketones
Ethers
216 Air Pollution XVII
www.witpress.com, ISSN 1743-3541 (on-line)
© 2009 WIT PressWIT Transactions on Ecology and the Environment, Vol 123,

paper focuses on the optimization of the preconcentration and the analytical steps and also on the analytical performances.
2 Material description
2.1 Standard gas generation devices
Tests have been conducted using a standard mixture including the target compounds (Table 1), toluene and methanol in nitrogen (at 3 ppm) contained in a compressed gas cylinder which was prepared by PRAXAIR. A second mean was used to produce continuously various standard gaseous atmospheres from a mixture of pure liquid compounds which is vaporized and diluted by a multistage dynamic dilution. The mixture included the oxygenated compounds and was prepared gravimetrically. Toluene was added to the mixture in order to compare his generated concentration to the one in a compressed gas standard certified by the National Measurement Institute LNE (Laboratoire National d’Essais). A continuous gas generation was ensured by a liquid µ-flow meter (Bronkhorst High-Tech) which injects a known amount of the pressurized liquid mixture into a vaporization chamber. Successive dilutions with purified air were applied. This air is dried and chemically filtered in air purifier (AZ 2020 manufactured by Claind). All flows were controlled by a Mass Flow Controllers (MKS) and measured with a gas flow meter (DryCal DC-Lite) certified by LNE. At the last stage of dilution two controlled airflows reach a 5 L chamber the first is dry and the second comes from a humidifier filled with demineralised water to control the relative humidity of air. The temperature, relative humidity in the chamber are continuously monitored and recorded by means of multifunction probes (Data-logger Testo term 400 and temperature, humidity, wind velocity sensor 0635.1540). The system is able to generate from mg m-3 to ng m-3.
2.2 Analytical instrumentation
Continuous air sampling was performed by Air server-Unity I from Markes International. Air samples are collected with a 15 mL min-1 flow on a one-stage trap that can be cooled by a Peltier system suitable for field campaign. Samples are then thermally desorbed and analyzed by GC-FID. For separation, a polar CP-LOWOX column (30 m × 0.53 mm × 10 µm) was specially designed by Varian for our application. The extended length of this column enabled us to have a very selective separation. The choice of the trap composition is closely related to the choice of the separation column. Preliminary tests on different adsorbents have shown that the use of a hydrophobic adsorbent is necessary to minimize the water interferences on the analysis with a polar column. Carbopack X, a hydrophobic adsorbent with high specific surface, has been chosen in the trap composition because of its low capacity to trap water [14]. In order to protect this adsorbent from the irreversible adsorption of heavy compounds, a small amount of Carbopack B has been added to the trap composition. The optimized composition of the trap was 5:75 mg Carbopack B: Carbopack X.
Air Pollution XVII 217
www.witpress.com, ISSN 1743-3541 (on-line)
© 2009 WIT PressWIT Transactions on Ecology and the Environment, Vol 123,

3 Optimization of analytical and preconcentration stage
3.1 Optimization of the chromatographic separation
The optimization was performed by analyzing the target compounds and 34 hydrocarbons ranging from 2 to 13 carbon atoms at 10 ppb (dry air) in order to demonstrate the good separation. The oven temperature was programmed from 45°C to 150°C at a rate of 5°C min-1 and held for 2 min, then ramped to 250°C at a rate of 3°C min-1 and maintained at 250°C for 10 minutes. The analysis lasts for 66 minutes. Figure 1-I shows the separation on the LOWOX column. The hydrocarbons are eluted in the first minutes of the chromatogram, while the polar compounds are eluted after undecane (after the 19th minute). One perfect co-elution persists between ethyl acetate and methyl vinyl ketone (Figure 1(II)).
Figure 1: Chromatographic separation of 34 hydrocarbons and the target compounds (I) and a zoom for identification (II). Peak numbers are in table 1. A: benzene, B: decane, C: ethylbenzene, D: xylenes, E: undecane, F: dodecane, G: trimethylbenzene, H: tridecane.
3.2 Optimization of the preconcentration step
3.2.1 Water management Due to the polar nature of the column, a sharp peak related to the presence of water in the sample appears on the chromatogram and co-elute with propanal and acrolein. These two compounds cannot be quantified with this method. The intensity of this peak is proportional to the amount of water in the sample and lead to a shift in retention time for the compounds eluted close to it. In fact, the content of retained water is affected both by the trap temperature and the initial water vapor concentration in the sampled gas [14]. The aim of this study was to use a one preconcentration stage and to reduce humidity in sample in order to
І ІI
218 Air Pollution XVII
www.witpress.com, ISSN 1743-3541 (on-line)
© 2009 WIT PressWIT Transactions on Ecology and the Environment, Vol 123,

limit the effect of the peak related to the presence of water vapor. The trap temperature optimization, the sample humidity management by dilution (50:50) and the trap purge before the sample analysis are used in order to reduce humidity and are discussed in the following. 3.2.1.1 Warm trap method The temperature of the trap was held above 0°C in order to prevent the ice plug formation and to reduce water condensation in the trap. Several preliminary tests have been conducted by varying the trap temperature from 10 to 30°C and sampling a standard mixture at 3 ppb concentration for all compounds and 50% relative humidity. At 20 and 30°C, the efficiency of trapping has been dramatically reduced especially for the most volatile compound: ethanol. At 10°C, a difficulty for the compounds identification has been encountered (Figure 2-C) and the peak related to water vapor has decreased by 10 minutes and has modified the elution of compounds close to it especially acetaldehyde and ETBE. This result can be explained by the increase of the adsorbed water amount on the trap at 10°C that affects the analysis on the polar column. In contrast a good chromatographic separation was obtained when the trap temperature was at 12.5°C with dry or humid air (Figure 2-A, B). The trap temperature was then optimized at 12.5°C which was a good compromise between an efficient adsorption on the trap and good separation on the polar column.
Figure 2: Trap temperature optimization, Ttrap=12.5°C 0% HR, (top) Ttrap=12.5°C, 50% HR (middle), Ttrap=10°C, 50% HR (bottom).
Air Pollution XVII 219
www.witpress.com, ISSN 1743-3541 (on-line)
© 2009 WIT PressWIT Transactions on Ecology and the Environment, Vol 123,

3.2.1.2 Dilution of sampled air by dry purified air The sampled air was diluted with a dry purified air with a ratio of 50:50 in the sampling stream before preconcentration step to guarantee a relative humidity of less than 50% of the sample. The volume of dry air was optimized in order to cover all the meteorological conditions encountered in ambient air. Reducing the relative humidity at the trap enables a good separation and limits retention time shifts on a polar column. Figure 3 shows chromatograms obtained for the target compounds at 3 ppb with RH=0%, 90% with and without dilution at ambient temperature. The two analyses at 0% and 90% RH with dilution show similar chromatograms contrary to the analysis where no dilution with dry air has been applied.
Figure 3: Chromatograms of three analyses of the 22 target compounds at 3 ppb and a trap temperature of 12.5°C dry air (top), 90% RH with dilution (middle), 90% RH without dilution (bottom).
3.2.1.3 Dry purge Dry purging of the trap prior to analysis is accomplished by flowing helium through the trap in the sampling flow direction. The trap purge
6
220 Air Pollution XVII
www.witpress.com, ISSN 1743-3541 (on-line)
© 2009 WIT PressWIT Transactions on Ecology and the Environment, Vol 123,

permits to eliminate the residual water adsorbed on the trap. The trap purge time was optimized, at the same flow (10 ml min-1), in order not to lose the most volatile compound (ethanol). Preliminary tests have permitted to set the trap purge time on 4 minutes with loss limited to 5% for ethanol.
3.3 Breakthrough volume
The determination of the breakthrough volume enables a quantitative analysis. The lightest compound is the first to breakthrough from the trap and the sampling volume will be chosen according to it. In order to determine the breakthrough volume, peak areas versus sampling volume were plotted. The breakthrough volume corresponds to the end of the linear part of the plotted curve. This test was carried out in the trap conditions defined previously (dilution (50:50), Ttrap=12.5°C and trap purge with 40 mL of helium) at 4.5 ppb and a relative humidity of 80%. Figure 4 displays the plots for the four lightest compounds (ethanol, acetonitrile, acetone and acetaldehyde). Ethanol and acetonitrile show a breakthrough volume at 405 ml and the rest of the compounds had linear response for more than 700 ml.
Figure 4: Breakthrough volume of ethanol and acetonitrile at 405 ml and linear plot for acetone and acetaldehyde.
3.4 Temperature of desorption
The optimal desorption temperature should insure a complete desorption for heavy compounds and should not lead to losses of the thermal instable compounds. In order to optimize this temperature, the responses for all of the compounds were tested by varying the desorption temperature. The standard mixture was diluted to 3 ppb level with a relative humidity of 80%. Six analyses were established for each of the five desorption temperatures (200, 250, 280, 300, 350°C). The average and the standard deviation of the six analyses for each compound are calculated. Only the results of 7 compounds are shown on figure 5. For some compounds like furan and toluene, the desorption temperature
Air Pollution XVII 221
www.witpress.com, ISSN 1743-3541 (on-line)
© 2009 WIT PressWIT Transactions on Ecology and the Environment, Vol 123,

has no influence on peak area. Nevertheless, for ethanol and acetone, peak areas decrease of 10 and 9% respectively between 280 and 350°C. These two light compounds are sensitive to high temperature. The peak areas of the heaviest compounds (benzaldehyde and heptanenitrile) showed a decrease of 8% between 280°C and 200°C probably due to an incomplete desorption. A temperature of 280°C seems to be the best compromise for the measurement of these compounds.
0
10
20
30
40
50
60
Furan Toluene Acetone Ethanol Butyl acetate Benzaldehyde Heptanenitrile
Area
(u.a
)
200°C250°C280°C300°C350°C -8%
-10%
-9%
-8%
Figure 5: Average and standard deviation of six analyses to demonstrate the influence of the desorption temperature on 7 compounds.
4 Analytical performances
4.1 Calibration
The calibration step is crucial for the analysis of oxygenated and nitrile compounds. The response coefficient k for a compound connects between the area of the compound to the concentration and is determined by the following equation: k=A/C where A is the area for a compound and C is the analyzed concentration. The use of a FID permits to calculate the response coefficient of a compound from the one of a reference compound. Moreover, the response of the FID is connected to the Effective Carbon Number (ECN) in a molecule [15]. The effective carbon number depends on the number of carbons and the chemical function in which the carbons are involved. The theoretical coefficient Kti for each compound is calculated by using this concept as follow: Kti=(kr/nr)×ni where nr and ni are respectively the effective carbon number for the reference compound and the i compound. The laboratory holds a reference toluene standard certified by LNE at ppb concentration (Cr). This standard is analyzed 7 times and the mean value of toluene peak areas (Ar) is determined and thus its kr. In this section, two calibration methods have been compared from the analysis of a standard gas mixture and a dynamic generation system to the ECN in order to determine the most reliable method. In table 2 are gathered the ECN and the responses coefficient for both of the calibration methods. The response
222 Air Pollution XVII
www.witpress.com, ISSN 1743-3541 (on-line)
© 2009 WIT PressWIT Transactions on Ecology and the Environment, Vol 123,
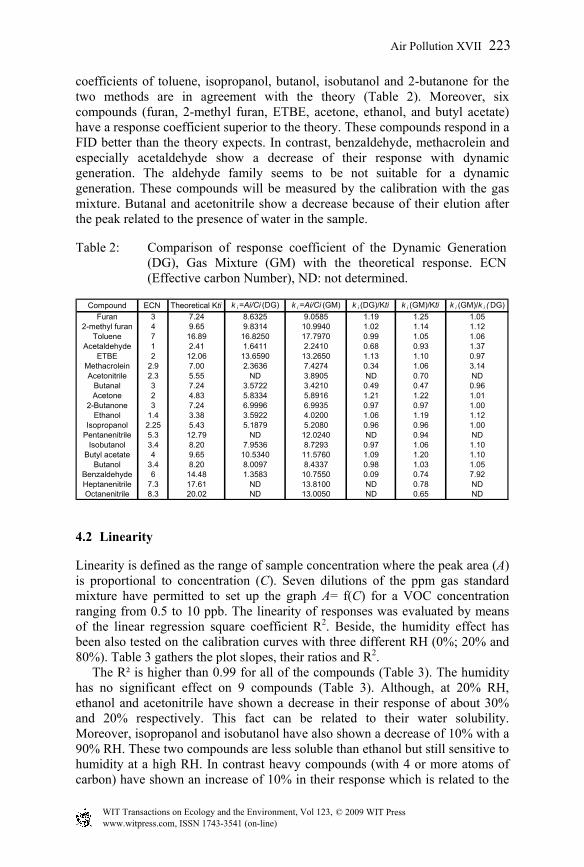
coefficients of toluene, isopropanol, butanol, isobutanol and 2-butanone for the two methods are in agreement with the theory (Table 2). Moreover, six compounds (furan, 2-methyl furan, ETBE, acetone, ethanol, and butyl acetate) have a response coefficient superior to the theory. These compounds respond in a FID better than the theory expects. In contrast, benzaldehyde, methacrolein and especially acetaldehyde show a decrease of their response with dynamic generation. The aldehyde family seems to be not suitable for a dynamic generation. These compounds will be measured by the calibration with the gas mixture. Butanal and acetonitrile show a decrease because of their elution after the peak related to the presence of water in the sample.
Table 2: Comparison of response coefficient of the Dynamic Generation (DG), Gas Mixture (GM) with the theoretical response. ECN (Effective carbon Number), ND: not determined.
Compound ECN Theoretical Kti k i =Ai/Ci (DG) k i =Ai/Ci (GM) k i (DG)/Kti k i (GM)/Kti k i (GM)/k i (DG)Furan 3 7.24 8.6325 9.0585 1.19 1.25 1.05
2-methyl furan 4 9.65 9.8314 10.9940 1.02 1.14 1.12Toluene 7 16.89 16.8250 17.7970 0.99 1.05 1.06
Acetaldehyde 1 2.41 1.6411 2.2410 0.68 0.93 1.37ETBE 2 12.06 13.6590 13.2650 1.13 1.10 0.97
Methacrolein 2.9 7.00 2.3636 7.4274 0.34 1.06 3.14Acetonitrile 2.3 5.55 ND 3.8905 ND 0.70 ND
Butanal 3 7.24 3.5722 3.4210 0.49 0.47 0.96Acetone 2 4.83 5.8334 5.8916 1.21 1.22 1.01
2-Butanone 3 7.24 6.9996 6.9935 0.97 0.97 1.00Ethanol 1.4 3.38 3.5922 4.0200 1.06 1.19 1.12
Isopropanol 2.25 5.43 5.1879 5.2080 0.96 0.96 1.00Pentanenitrile 5.3 12.79 ND 12.0240 ND 0.94 ND
Isobutanol 3.4 8.20 7.9536 8.7293 0.97 1.06 1.10Butyl acetate 4 9.65 10.5340 11.5760 1.09 1.20 1.10
Butanol 3.4 8.20 8.0097 8.4337 0.98 1.03 1.05Benzaldehyde 6 14.48 1.3583 10.7550 0.09 0.74 7.92Heptanenitrile 7.3 17.61 ND 13.8100 ND 0.78 NDOctanenitrile 8.3 20.02 ND 13.0050 ND 0.65 ND
4.2 Linearity
Linearity is defined as the range of sample concentration where the peak area (A) is proportional to concentration (C). Seven dilutions of the ppm gas standard mixture have permitted to set up the graph A= f(C) for a VOC concentration ranging from 0.5 to 10 ppb. The linearity of responses was evaluated by means of the linear regression square coefficient R2. Beside, the humidity effect has been also tested on the calibration curves with three different RH (0%; 20% and 80%). Table 3 gathers the plot slopes, their ratios and R2. The R² is higher than 0.99 for all of the compounds (Table 3). The humidity has no significant effect on 9 compounds (Table 3). Although, at 20% RH, ethanol and acetonitrile have shown a decrease in their response of about 30% and 20% respectively. This fact can be related to their water solubility. Moreover, isopropanol and isobutanol have also shown a decrease of 10% with a 90% RH. These two compounds are less soluble than ethanol but still sensitive to humidity at a high RH. In contrast heavy compounds (with 4 or more atoms of carbon) have shown an increase of 10% in their response which is related to the
Air Pollution XVII 223
www.witpress.com, ISSN 1743-3541 (on-line)
© 2009 WIT PressWIT Transactions on Ecology and the Environment, Vol 123,

solubilisation of the adsorbed compound on the path of the sample leading to an increase of their concentration. The calibration should than be realised with humid air for a reliable quantification and in order to be in agreement with ambient air.
Table 3: Calibration slope equation, their ratios and square coefficient for the target compounds at 3 RH levels.
slope slope R2 slope R2 slope R2 20/0% RH 80/0% RH
Furan 9.06 0.9996 9.23 0.9999 9.13 0.9997 1.0 1.02-methyl furan 11.00 0.9998 11.18 0.9996 11.01 0.9998 1.0 1.0
Toluene 17.80 0.9984 17.66 0.9961 17.74 0.9989 1.0 1.0Acetaldehyde 2.25 0.9935 2.56 0.9992 2.77 0.9975 1.1 1.2
ETBE 13.27 0.9992 13.26 0.9996 13.19 0.9996 1.0 1.0Methacrolein 3.68 0.9975 3.67 0.9969 3.77 0.9991 1.0 1.0Acetonitrile 3.90 0.9998 3.30 0.9997 3.13 0.9976 0.8 0.8
Butanal 3.43 0.9969 3.61 0.9971 3.63 0.9959 1.1 1.1Acetone 5.90 0.9988 6.01 0.9967 5.64 0.9986 1.0 1.0
Ethyl acetate+MVK 5.96 0.9998 6.15 0.9996 5.88 0.9998 1.0 1.02-Butanone 7.00 0.9998 7.36 0.9995 6.86 0.9974 1.1 1.0
Ethanol 4.02 0.9995 2.81 0.9994 2.63 0.9970 0.7 0.7Isopropanol 5.21 0.9983 5.18 0.9992 4.85 0.9991 1.0 0.9
Pentanenitrile 12.03 0.9992 12.39 0.9997 12.06 0.9998 1.0 1.0Isobutanol 8.73 0.9979 8.45 0.9998 7.91 0.9991 1.0 0.9
Butyl acetate 11.58 0.9980 12.19 0.9995 11.64 0.9992 1.1 1.0Butanol 8.44 0.9983 8.86 0.9998 8.35 0.9995 1.1 1.0
Benzaldehyde 10.76 0.9970 12.22 0.9995 11.71 0.9992 1.1 1.1Heptanenitrile 13.81 0.9981 14.37 0.9985 13.58 0.9996 1.1 1.0Octanenitrile 13.01 0.9985 15.03 0.9964 13.69 0.9989 1.2 1.1
0% RH 20%RH 80%RH Slope Ratio
4.3 Repeatability
In order to evaluate this parameter, two standard mixtures of the target compounds (at 0.5 and 5 ppb and 80% RH) have been successively analysed seven times. The Relative Standard Deviation (RSD) of each compound peak area for the two concentration levels was evaluated. The RSD results for the target compounds for the two levels of concentration are gathered in table 4. For the two levels, RSD were lower than 5% for all the compounds.
4.4 Detection limit
The detection limit (DL) was evaluated by signal to noise ratio of 3. Table 4 gathers the detection limits obtained for each compound. For 19 compounds, the detection limits were acceptable and vary between 0.01 ppb for ETBE to 0.09 ppb for ethanol. Methacrolein, acetonitrile and butanal have higher detection limits varying between 0.2 and 0.6 ppb. These compounds are eluted after the peak related to the presence of water in the sample affecting their quantification. These detection limits for the 19 compounds are similar to those obtained by other studies [4, 8] and are reasonable for quantification of the compound in ambient air.
224 Air Pollution XVII
www.witpress.com, ISSN 1743-3541 (on-line)
© 2009 WIT PressWIT Transactions on Ecology and the Environment, Vol 123,

Table 4: deviation (RSD) for the target compounds.
Compound DL (ppb) RSD (0.5 ppb) RSD (5 ppb) Compound DL (ppb) RSD (0.5 ppb) RSD (5 ppb)
Ethanol 0.09 4.0 4.9 2-Butanone 0.07 4.1 2.4Isopropanol 0.06 3.7 2.2 ETBE 0.01 0.5 1.1
Butanol 0.04 3.8 4.2 Furan 0.02 1.6 0.8Isobutanol 0.04 1.8 0.9 2-methyl furan 0.02 1.4 0.8
Acetaldehyde 0.04 2.6 4.6 Ethyl acetate 0.07 2.3 1.3Propanal 0.07 * * Butyl acetate 0.02 3.5 1.7Butanal 0.44 4.7 3.4 Acetonitrile 0.29 3.7 4.9
Benzaldehyde 0.02 2.6 3.4 Pentanenitrile 0.06 2.7 3.6Methacrolein 0.64 2.9 4.5 Heptanenitrile 0.06 3.6 3.7
Acetone 0.044.0 1.2 Octanenitrile 0.05
3.6 3.5MVK 0.07 2.3 1.3 Toluene 0.04 2.2 2.5
*Not determined.
5 Conclusion
The development of an automated method based on thermal desorption coupled to a GC-FID for the online measurement of OVOC and nitrile compound was successfully achieved. This method required a combination of three methods of reducing water amount from sampled air: warm trap temperature held at 12.5°C, diluting (50:50) of the sample before the preconcentration step and a trap purge. The advantage of this method is the analysis of the integrality of the sample without any losses of compound by a drying device and the limitation of shifts of retention time for compounds on the polar column. The analytical performances (DL and repeatability) were satisfied. Calibration should be realized by analyzing humidified standards. This method is ready for a routine continuous monitoring in the field work.
References
[1] Atkinson, R. & Arey, J., Atmospheric degradation of Volatile Organic Compounds. Chemical Reviews, 103(12), pp. 4605–4638, 2003.
[2] Ciccioli, P., Cecinato, A., Brancaleoni, E., Brachetti, A. & Frattoni M. Polar volatile organic compounds (VOC) of natural origin as precursors of ozone. Environmental Monitoring and Assessment, 31, pp. 211–217, 1994.
[3] Riemer, D., Pos, W., Milne, P., Farmer, C., Zika, R., Apel, E., Olszyna, K., Kliendienst, T., Lonneman, W., Bertman, S., Shepson, P. & Starn, T., Observations of nonmethane hydrocarbons and oxygenated volatile organic compounds at a rural site in the southeastern United states. Journal of Geophysical Research, 103(D21), pp. 28111–28128, 1998.
[4] Apel, E.C., Hills, A.J., Lueb, R., Zindel, S., Eisele, S. & Riemer, D.D., A fast-GC/MS system to measure C2 to C4 carbonyls and methanol aboard aircraft. Journal of Geophysical Research, 108(D20), pp. 8794, 2003.
Air Pollution XVII 225
www.witpress.com, ISSN 1743-3541 (on-line)
© 2009 WIT PressWIT Transactions on Ecology and the Environment, Vol 123,
Henry’s constant, detection limits (DL) and the relative standard

[5] Singh, H.B., Salas, L.J., Chatfield, R.B., Czech, E., Fried, A., Walega, J., Evans, M.J., Field, B.D., Jacob, D.J., Blake, D., Heikes, B., Talbot, R., Sachse, G., Crawford, J.H., Avery, M.A., Sandholm, S. & Fuelberg, H., Analysis of the atmospheric distribution, sources, and sinks of oxygenated volatile organic chemicals based on measurements over the Pacific during TRACE-P. Journal of Geophysical Research, 109(D15S07), doi:10.1029/2003JD003883, 2004.
[6] Legreid, G., Balzani Lööv, J., Staehelin, J., Hueglin, C., Hill, M., Buchmann, B., Prevot, S.H.A. & Reimann, S., Oxygenated volatile organic compounds (OVOCs) at an urban background site in Zürich (Europe): Seasonal variation and source allocation. Atmospheric Environment, 41, pp. 8409–8423, 2007.
[7] Monod, A., Bonnefoy, N., Kaluzny, P., Denis, I., Fostern, P. & Carlier, P., Methods for sampling and analysis of tropospheric ethanol in gaseous and aqueous phases. Chemosphere, 52, pp. 1307–1319, 2003.
[8] Hopkins, J.R., Boddy, R.K., Hamilton, J.F., Lee, J.D., Lewis, A.C., Purvis, R.M. & Watson N.J., An observational case study of ozone and precursors inflow to South East England during an anticyclone. Journal of Environmental Monitoring, 8, pp. 1195–1202, 2006.
[9] Gawryś, M., Fastyn, P., Gawlowski, J., Gierczak, T. & Niedzielski, J., Prevention of water vapour adsorption by carbon molecular sieves in sampling humid gases. Journal of Chromatography, 933, pp. 107–116, 2001.
[10] Karbiwnyk, C.M., Mills, C.S., Helmig, D., Birks, J.W., Journal of Chromatography. A 958 (2002) 219.
[11] Chang, C.C., Lo, S.J., Lo, J.G., Wang, J.L., Analysis of methyl tert-butyl ether in the atmosphere and implications as an exclusive indicator of automobile exhaust. Atmospheric Environment, 37, pp. 4747–4755, 2003.
[12] Hopkins, J.R., Lewis, C.A. & Read, A. K., A two-column method for long-term monitoring of non-methane hydrocarbons (NMHCs) and oxygenated volatile organic compounds (o-VOCs). Journal of Environmental Monitoring, 5, pp. 8–13, 2003.
[13] Dettmer, K., Felix, U., Engewald, W. & Mohnke, M., Application of a unique selective PLOT Capillary Column for the Analysis of Oxygenated Compounds in Ambient air. Chromatographia Supplement, 51, pp. S-221–S-227, 2000.
[14] Dettmer, K. & Engewald, W., Adsorbent materials commonly used in air analysis for adsorptive enrichment and thermal desorption of volatile organic compounds. Analytical and Bioanalytical Chemistry, 373, pp. 490-500, 2002.
[15] Tranchant, J., Gardais, J.F., Gorin, P., Prévôt, A., Serpinet. J., & Untz, J., Manuel pratique de chromatographie en phase gazeuse, Masson, edition 3, pp. 504, 1982.
226 Air Pollution XVII
www.witpress.com, ISSN 1743-3541 (on-line)
© 2009 WIT PressWIT Transactions on Ecology and the Environment, Vol 123,