development of an automated anesthesia system for the ... · development of an automated anesthesia...
TRANSCRIPT

Development of an Automated Anesthesia System for the Stabilization of Physiological
Parameters in Rodents
A Thesis
Submitted to the Faculty
of the
WORCESTER POLYTECHNIC INSTITUTE
in partial fulfillment of the requirements for the
Degree of Master of Science
by
______ __________________ Kevin M. Hawkins
Date: April 24, 2003
Approved:
Professor Ross D. Shonat, Ph.D., Major Advisor Professor Yitzhak Mendelson, Ph.D., Committee Member Professor Fred J. Looft, Ph.D., Committee Member

ii
ACKNOWLEDGEMENTS
Funding for this project was provided by a biomedical engineering grant from the
Whitaker Foundation, Rosslyn VA.
I would like to extend my gratitude to my wife Lisa and the rest of my family and friends
for their support, and to:
Professor Mendelson and Professor Looft, for their technical input and
constructive criticism.
Ross D, Shonat, for his guidance, support and confidence in me throughout this
experience.

iii
ABSTRACT
The testing of any physiological diagnostic system in-vivo depends critically on the stability
of the anesthetized animal used. That is, if the systemic physiological parameters are not
tightly controlled, it is exceedingly difficult to assess the precision and accuracy of the
system or interpret the consequence of disease. In order to ensure that all measurements
taken using the experimental system are not affected by fluctuations in physiological state,
the animal must be maintained in a tightly controlled physiologic range. The main goal of
this project was to develop a robust monitoring and control system capable of maintaining the
physiological parameters of the anesthetized animal in a predetermined range, using the
instrumentation already present in the laboratory, and based on the LabVIEWR software
interface. A single user interface was developed that allowed for monitoring and control of
key physiological parameters including body temperature (BT), mean arterial blood pressure
(MAP) and end tidal CO2 (ETCO2). Embedded within this interface was a fuzzy logic based
control system designed to mimic the decision making of an anesthetist. The system was
tested by manipulating the blood pressure of a group of anesthetized animal subjects using
bolus injections of epinephrine and continuous infusions of phenylephrine (a vasoconstrictor)
and sodium nitroprusside (a vasodilator). This testing showed that the system was able to
significantly reduce the deviation from the set pressure (as measured by the root mean square
value) while under control in the hypotension condition (p < 0.10). Though both the short-
term and hypertension testing showed no significant improvement, the control system did
successfully manipulate the anesthetic percentage in response to changes in MAP. Though
currently limited by the control variables being used, this system is an important first step
towards a fully automated monitoring and control system and can be used as the basis for
further research.

iv
TABLE OF CONTENTS
ACKNOWLEDGEMENTS ..................................................................................... ii ABSTRACT.......................................................................................................... iii TABLE OF CONTENTS....................................................................................... iv TABLE OF FIGURES........................................................................................... vi TABLE OF TABLES............................................................................................. ix 1. INTRODUCTION ...........................................................................................1 2. BACKGROUND .............................................................................................4
2.1. Anesthetic Agents...................................................................................4 2.2. Physiological Monitoring.........................................................................6 2.3. Physiologic Control .................................................................................7
3. DESIGN.......................................................................................................10 3.1. LabVIEWR Interface..............................................................................10 3.2. Monitoring/Communication System ......................................................11
3.2.1. Body Temperature Monitoring .......................................................11 3.2.2. Analog Waveform Monitoring ........................................................11
3.3. Instrument Control System ...................................................................14 3.3.1. Anesthetic Control .........................................................................14 3.3.2. Ventilator Control...........................................................................19 3.3.3. Body Temperature Control ............................................................21
3.4. Fuzzy Logic Control Systems ...............................................................23 3.4.1. Blood Pressure..............................................................................25 3.4.2. End Tidal CO2 Control ...................................................................30
3.5. Data Transfer System...........................................................................35 3.6. User Interface .......................................................................................38
3.6.1. Interface Hierarchy ........................................................................41 4. METHODS...................................................................................................42
4.1. In-Vitro Testing .....................................................................................42 4.2. In-Vivo Experiments .............................................................................42
4.2.1. Short-term Perturbation .................................................................45 4.2.2. Long-term Perturbation..................................................................46
5. RESULTS ....................................................................................................48 5.1. Body Temperature Results ...................................................................48 5.2. Short term Perturbation Results ...........................................................49 5.3. Long-term Perturbation results .............................................................54 5.4. CO2 controller Results ..........................................................................62 5.5. Steady state observations ....................................................................63
6. DISCUSSION ..............................................................................................66 6.1. Significance of results...........................................................................66 6.2. Future Work..........................................................................................67 6.3. Conclusions ..........................................................................................69
7. REFERENCES ............................................................................................71

v
Appendix A: Epinephrine Injection Data Plots....................................................75 Appendix B: Neo-Synephrine Infusion Data plots ..............................................78 Appendix C: Sodium Nitroprusside Infusion Data Plots .....................................82 Appendix D: ETCO2 Data Plots..........................................................................88

vi
TABLE OF FIGURES
Figure 2.1-1: Anesthesia vaporizer and flow control hardware (Boutillette et al 2000). .........................................................................................................5
Figure 2.3-1: Block diagram of a traditional control scheme (Rao et al 2000)......8 Figure 3.2-1: Body temperature VI block diagram (a) and front panel display(b).
Dashed boxes show different sections of the block diagram: voltage measurement (1), temperature conversion voltage to oK (2), and temperature conversion oK to oC. .............................................................11
Figure 3.2-2: Waveform processing section (a) consisting of a waveform acquisition VI (box (1)), airway pressure rate (box (2)), airway Min/Max (box (3)), airway pressure and %CO2 waveform display (box (4)), %CO2 Min/Max (box (5)), %CO2 rate (box (6)), blood pressure rate (box (7)), blood pressure two point calibration and scaling for Min/Max and waveform display (box (8)). Blood pressure VI front panel (b), and block diagram (c). ..............................................................................................13
Figure 3.3-1: Anesthetic Concentration / Flow Control VI block diagram (a), showing the Anesthetic Calculator (box1) and the Basic Gas Mixer (box 2) VI, and front panel (b). .............................................................................15
Figure 3.3-2: Anesthetic Flow rate Calculator VI block diagram (a) and front panel (b). (Based on work done by Dr. Ross Shonat). .............................17
Figure 3.3-3: Basic Gas Flowmeter VI block diagram (a) and front panel (b). (Based on work done by Dr. Ross Shonat). .............................................18
Figure 3.3-4: The Ventilator Control VI block diagram (a) and front panel display (b). (Based on work done by Amanda Kight)............................................19
Figure 3.3-5: Inspira Control VI Block diagram (a) and front panel (b)...............20 Figure 3.3-6: The water bath control VI block diagram (a) and front panel display
(b).............................................................................................................22 Figure 3.3-7: Duty cycle VI block diagram (a) and front panel (b) .......................23 Figure 3.4-1: Preliminary membership functions for blood pressure control
system......................................................................................................26 Figure 3.4-2: Blood Pressure Control VI block diagram (a) showing the
fuzzification, inference, defuzzification operations and the safety limits (boxes 1, 2 , 3 and 4 respectively) and front panel display (b). ................29
Figure 3.4-3: Mean Arterial Pressure VI block diagram (a) and front panel (b)..29 Figure 3.4-4: Plots of (A) increased ventilation with increased pCO2 levels, due
to (B) increased RR and (C) increased TV (Letsky 1992) . ......................31 Figure 3.4-5: Fuzzification membership functions for the E input rule base.......32 Figure 3.4-6: Graph showing the change in ventilation due to changes in oxygen
concentration (Letsky 1992) .....................................................................34 Figure 3.4-7: ETCO2 Control VI block diagram (a) showing the fuzzification,
inference and defuzzification operations (boxes 1, 2 and 3 respectively) and (b) front panel display........................................................................35
Figure 3.5-1: the Write to File VI block diagram (a) and front panel display (b). 37

vii
Figure 3.5-2: An example of the data collected using the write to file VI and analyzed using Excel, note the vertical lines indicating a marked event (in this case images being taken)..................................................................38
Figure 3.6-1: User interface VI block is made up of the previously discussed VIs.................................................................................................................39
Figure 3.6-2: Interfacev2 VI block diagram (a) and front panel interface (b) ......40 Figure 3.6-3: Block diagram showing the hierarchy of the sub-VIs used to make
the interface VI. ........................................................................................41 Figure 4.2-1: Digital images of a rat (a) in an induction chamber (b) with the
anesthesia mask over its snout and (c) with the tracheal cannula inserted and connected to the ventilator inhalation and exhalation tubing. ............45
Figure 5.1-1: Test data for control of water temperature in a rat substitute (With a set point of 37 degrees Celsius)...............................................................48
Figure 5.1-2:A sample of the data collected during a preliminary animal procedure (set point Temperature of 38 degrees Celsius). .................49
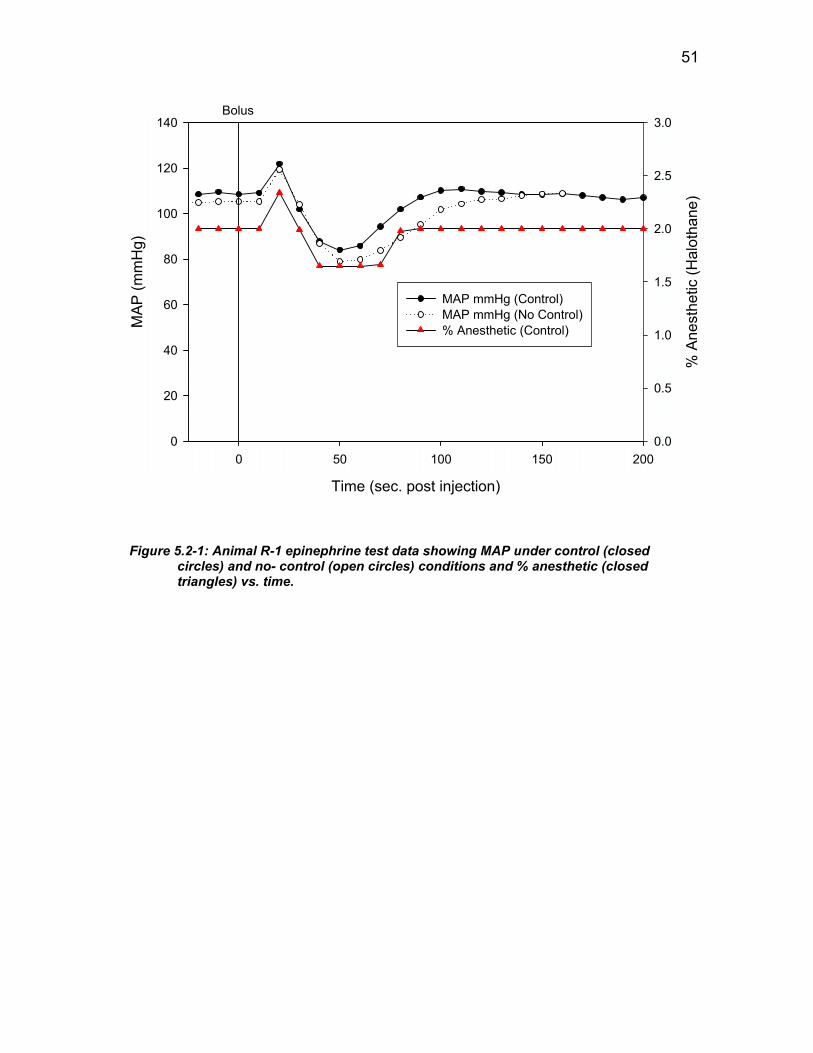
Figure 5.2-1: Animal R-1 epinephrine test data showing MAP under control (closed circles) and no- control (open circles) conditions and % anesthetic (closed triangles) vs. time.........................................................................51
Figure 5.2-2 Animal R-1 epinephrine test data showing % MAP deviation under control (closed circles) and no- control (open circles) conditions and % anesthetic (closed triangles) vs. time. ......................................................52
Figure 5.3-1: Animal LTP-6 Neo-Synephrine infusion test data showing MAP under control (closed circles) and no- control (open circles) conditions and % anesthetic (closed triangles) vs. time. ..................................................57
Figure 5.3-2: Animal LTP-6 Neo-Synephrine infusion test data showing % MAP deviation under control (closed circles) and no- control (open circles) conditions and % anesthetic (closed triangles) vs. time. ..........................57
Figure 5.3-3: Animal LTP-6 sodium nitroprusside infusion test data showing MAP under control (closed circles) and no- control (open circles) conditions and % anesthetic (closed triangles) vs. time. ..................................................58
Figure 5.3-4: Animal LTP-6 sodium nitroprusside infusion test data showing % MAP deviation under control (closed circles) and no- control (open circles) conditions and % anesthetic (closed triangles) vs. time. ..........................59
Figure 5.3-5: Neo-synephrine testing mean and standard deviation vs. tome for control (closed circles, negative error bars) and no-control (open circles, positive error bars). ..................................................................................61
Figure 5.3-6: Sodium nitroprusside testing mean and standard deviation vs. tome for control (closed circles, negative error bars) and no-control (open circles, positive error bars). ......................................................................61
Figure 5.4-1: Representative plot of % CO2 (closed circle) tidal volume (closed triangle) and respiratory rate (Closed square) vs. time for animal LTP-3. 62
Figure 5.4-2: Representative plot of % CO2 deviation (closed circle) change in TV set point (closed triangle) and change in RR set point (Closed square) vs. time for animal LTP-3. ........................................................................63
Figure 5.5-1: Animal LTP-5 steady state test data showing MAP under control (closed circles) and % anesthetic (closed triangles) vs. time. ..................64

viii
Figure 5.5-2: Animal LTP-5 steady state test data showing % MAP deviation under control (closed circles) and % anesthetic (closed triangles) vs. time..................................................................................................................64
Figure 5.5-3: Animal LTP-5 steady state data showing % CO2 (closed circle) tidal volume (closed triangle) and respiratory rate (Closed square) vs. time. ..65
Figure 5.5-4: Animal LTP-5 steady state data showing % CO2 deviation (closed circle)% change in tidal volume (closed triangle) and % change in respiratory rate (Closed square) vs. time. ................................................65

ix
TABLE OF TABLES
Table 3.3-1: Summary of temperature difference ranges and the corresponding duty cycles ...............................................................................................21
Table 3.4-1: Pros and Cons of the traditional and fuzzy logic approach to anesthesia control. ...................................................................................25
Table 3.4-2: Pressure controller rule base definition summary. .........................27 Table 3.4-3: ETCO2 controller rule base definition summary. ............................33 Table 3.4-4: Correction value scaling factors for various pO2 ranges................34 Table 5.2-1 Representative data set for animal R-1 showing formatted data for an
epinephrine injection test under no- control conditions. ...........................53 Table 5.2-2: Summary of calculated RMS values and Paired t-test results .......54 Table 5.3-1: Representative data set for animal LTP-3 showing formatted data for
an Sodium Nitroprusside infusion test under control conditions. ..............56 Table 5.3-2: Summary of calculated RMS values and Paired t-test results for the
Neo-Synephrine infusion experiments. ....................................................59 Table 5.3-3: Summary of calculated RMS values and Paired t-test ....................60

1
1. INTRODUCTION
The presence of low O2 levels in the vasculature and tissues of the retina, termed
retinal hypoxia, has been linked to the development of many eye diseases including
diabetic retinopathy and glaucoma. It is recognized that imaging technologies to identify
and monitor oxygen levels in the retina would substantially advance our understanding
and treatment of these devastating diseases and the laboratory is currently developing a
non-invasive diagnostic imaging technique, based on phosphorescence lifetime imaging
(PLI), to produce two-dimensional maps of pO2 in the rodent retina. This technique is
undergoing in-vivo testing, using rats and mice, and has shown promising results.
The testing of this technology in-vivo depends critically on the stability of the
anesthetized animal. That is, if the systemic physiological parameters are not tightly
controlled, it is exceedingly difficult to assess the precision and accuracy of the PLI
system or interpret the consequence of disease. Any variation in physiological parameters
such as Blood Pressure (BP), Body Temperature (BT) and Pulmonary Function (pO2 and
pCO2 levels) can be a potential source of variation in the data being gathered using PLI.
In order to ensure that all measurements taken using PLI are not affected by fluctuations
in the systemic physiological state, each animal must be maintained within a tightly
controlled physiologic range. The main goal of this project was to develop a robust
monitoring and control system capable of maintaining the physiological parameters of an
anesthetized animal in a predetermined range, using the instrumentation already present
in the laboratory, and based on the LabVIEWTM software interface. The specific aims
were to:

2
Develop a computer-controlled monitoring system (based on LabVIEWTM)
capable of “real time” data acquisition and display of BT, end tidal CO2 (ETCO2),
ventilator pressure and BP.
Develop a communications capability allowing for the control of laboratory
instrumentation, such as the ventilator, heating bath and gas flow meters.
Develop a computer-based control system (using LabVIEWTM) for maintaining
BT, ETCO2, and BP. Fuzzy logic control theory was employed to mimic the
complex decision processes that a trained anesthesiologist might make.
Design a user interface that incorporates the above subsystems and an event
marker and file transfer system.
By developing a system that can maintain the physiologic state of the animal within
narrow limits, better characterization of the PLI system in the laboratory is possible. At
the same time, the system can free the experimentalist to concentrate on the acquisition of
retinal oxygen data using the PLI system.
In order to achieve the above goals a design had to be developed that allowed for
the most elegant solution possible. A fuzzy logic control strategy was developed to
mimic the decision making of an anesthetist allowing for the automated maintenance of
ETCO2 and BP. The monitoring, control and file transfer systems were developed in
LabVIEWTM and combined to create a single user interface. This interface was tested on
a total of ten rats in both short and log-term perturbation experiments using bolus and
maintained drug infusions to mimic various systemic physiological conditions. This
testing revealed that the system had limited abilities to control short-term perturbations

3
but was able to significantly reduce the deviation of the mean arterial blood pressure
(MAP) from the control set point in simulated hypotension experiments.

4
2. BACKGROUND
Before developing a monitoring/control system, it is important to first understand
anesthesia and its control. The following sections provide some background in
anesthesia, physiological monitoring and physiological control systems that have been
used to date.
2.1. Anesthetic Agents
General anesthetics can be separated into two major categories, injectable anesthetics
and inhalant anesthetics. Injectable anesthetics can be further divided into sub-categories
based on the route of administration, including Intra-peritoneal (IP), Intra-Muscular (IM),
Sub-Cutaneous (SC), Intra-Cardiac (IC) and Intra-Venous (IV). In past experiments in
the laboratory, an injectable anesthetic, Avertin, was administered IP to achieve the
desired anesthetic depth. Though safe for the test subject and easy for the researcher to
administer, bolus injection made it impossible to control the physiology of the animal
through anesthetic manipulation during the procedure. Since the control of the animal’s
physiology is one of the main goals of this project, a new anesthetic agent had to be
chosen for future experimentation. IV anesthetics, such as Propofol, afford the researcher
the ability to control the depth of anesthesia throughout the procedure by manipulating
the rate of infusion, but this approach requires the use of syringe pumps, which are not
always available in the laboratory. Other injectable agents can also be used once the
animal is under anesthesia to manipulate its physiological parameters. Some examples of
these chemical agents are vasodilators, such as sodium nitroprusside, which cause a
drastic drop in systemic BPand vasoconstrictors, such as phenylephrine, which cause a
drastic rise in systemic BP.

5
Inhalant anesthetics, on the other hand, allow for a controlled depth of anesthesia
due to the fairly rapid physiological response time to changes in concentration. Some
common inhalant anesthetics include Halothane, Isoflurane, and Enflurane. For this
project, Halothane was chosen as the anesthetic based on its rapid uptake, pleasant
induction and availability (Short 1987). In order to deliver a precise concentration of
anesthetic, a copper kettle vaporizer constructed by a previous undergraduate project
group was used (figure 2.1-1). The copper kettle vaporizer produces O2 saturated with
the anesthetic agent, which is then mixed with humidified N2 and O2 and delivered to the
test animal (Boutillette et al 2000). The overall inhalant anesthesia and gas flow system
is shown in figure 2.1-1.
Copper Kettle Vaporizer
Gas Flow meters
Figure 2.1-1: Anesthesia vaporizer and flow control hardware (Boutillette et al 2000).

6
2.2. Physiological Monitoring
While under anesthesia, it is important to closely monitor the animal subject to
ensure anesthetic depth is maintained at a point that ensures that it will not experience
any discomfort throughout the procedure. The parameters that are traditionally
monitored and analyzed to assess current physiological state and anesthetic depth include
BT, BP, Electro-cardiogram (ECG), pulmonary function (CO2 and O2) and blood gas
values. Due to the small size of the animals being used for this research (rats and mice)
special considerations of the animal’s parameters to be accurately collected and analyzed
is required (Short 1987).
One of the parameters that requires special considerations due to the small size of
the animals is the ETCO2. The instrument used to sample CO2 concentration is called a
capnometer. Traditional capnometers require a sample size that is quite large in
comparison to the dead space of the animal’s lungs. This produces a situation in which
serious damage or death can occur due to suffocation during sampling. To ensure that
there is no danger to the animal, a micro-capnometer must be used. The micro-
capnometer chosen for this research was the Columbus Instruments Micro-Capnometer,
which is able to take wet samples of either 20 cc or 5 cc. These smaller sample volumes
allow for the sampling of CO2 without risk of injury to the animal.
Blood pressure is another parameter that is important to monitor throughout the
procedure. The BP of the animal is an important indicator of anesthetic depth and can be
an indicator of distress. To measure BP for this study, an arterial catheter is placed in a
femoral artery and pressure readings are taken using the Biopac RX104A pressure
transducer connected to the National Instruments SCXI module. The National

7
Instruments SCXI module allows for the measurement of voltage and, using a two-point
calibration factor, allows for the direct measurement of BP. Heart rate is another
important parameter to measure, which can be extracted from the BP waveform data.
Though ECGs are often an important parameter to monitor, the small size of the
animal can make it difficult to obtain a useful waveform. In addition, the intervals of the
ECG can be difficult to measure consistently in small animals due to the high heart rate
and variation from animal to animal.
Blood gas measurements are very indicative of the physiological state of the
animal, providing such information as pO2, pH and pCO2. The issue with the
measurement of blood gases is that the sampling of blood can quickly reduce the test
subject’s blood volume and there is currently no way to automate the sampling process
and data transfer with the equipment currently available in the laboratory. Instead,
manual samples can be taken and entered into the user interface, allowing these valuable
parameters to be taken into consideration, during anesthetic control.
2.3. Physiologic Control
The automated control of anesthesia has received quite a bit of attention in the last
few years. The two major areas of control theory that have received this attention are
traditional, mathematical model based, controls (Hang et al 1999, Dalkara et al 1995,
Prie et al 1997, Rao et al 2000) and fuzzy logic control theory (Apshari et al 1994,
Becker et al 1997, Dojat 1997, Graaf et al 1997, Held et al 2000, Linkens 1999, Lowe et
al 1999, Meier et al 1992Shing et al 1999). The model based control theory uses
mathematical models of the test subject’s physiology and the theoretical reaction of

8
stimulus, such as anesthetic concentration, to produce estimates of the physiologic
reactions. Based on these estimates, control algorithms are developed and used in a
feedback (most often negative) system. The traditional control system is able to rake
inputs from the entire system and produce multiple outputs for control. A block diagram
representing such a control system that takes advantage of feedback to increase stability
is seen in figure 2.3-1 (Rao et al 2000).
Figure 2.3-1: Block diagram of a traditional control scheme (Rao et al 2000).
The past work done in the area of anesthetic control using traditional control
theory is somewhat limited due to the complexity of the models. A majority of the past
research relies on the use of electroencephalogram (EEG) or electrocardiogram (ECG)
waveforms as the primary parameter for the detection of anesthetic depth (Seiber et al
2000) (Morteir and Stuys 2001). Though this is a valid and highly accurate method for
human patients, the measurement of EEG and ECG data can be problematic in small
animals such as mice and rats, and the equipment needed to acquire these waveforms is
currently unavailable in the laboratory.
In contrast, fuzzy logic control attempts to use fuzzy set theory to model the
decisions of an anesthetist, given inputs of physiologic states. Fuzzy set theory allows for

9
the computation of partial membership, or partial truth, for a set of membership functions
and provides a crisp output based on a corresponding rule set. The rule sets used in fuzzy
logic controls are based on the previous knowledge of a specialist, or a number of
specialists, and can take single or multiple inputs into account to make the decision. The
process of producing a crisp output using fuzzy logic consists of three major steps:
fuzzification, inference and defuzzification. Fuzzification consists of the calculation of
membership, based on the membership functions, for the input values. Inference takes
the results of the fuzzification process and produces a fuzzy output based on the rule set.
Defuzzification produces a crisp output based on the inference process results (Qingyang
Hu and Petr 2000).
In recent years an increasing number of studies have focused on the use of fuzzy
logic controls to control BP and anesthetic depth (Apshari et al 1994, Becker et al 1997,
Dojat 1997, Graaf et al 1997, Held et al 2000, Linkens 1999, Lowe et al 1999, Meier et
al 1992, Shing et al 1999). The control outputs for these systems have been both inhalant
and injectable anesthetics and have focused primarily on BP for the input parameter
(Meier et al 1997, de Graaf et al 1997, Shieh et al 1999).

10
3. DESIGN
The use of the LabVIEWTM interface is integral to the successful development of the
communication and control systems that are required to successfully implement the
objectives set forth for this project. This section outlines the design process that was
followed in order to develop the various components of the monitoring, instrument
control, fuzzy logic control and data transfer systems as well as the final user interface.
3.1. LabVIEWR Interface
The LabVIEWTM platform was used for all components of this project, including
monitoring, instrument control and fuzzy logic control. LabVIEWR is a program that
allows for the development of “Virtual Instruments” (VI) capable of sending information
to and receiving information form devices using embedded virtual channels that can be
setup for each input and output function, incorporating conversion factors and handling
the transfer of data. This platform also has substantial mathematical capabilities. The
LabVIEWTM platform was ideal for this project because it allowed existing VIs to be
used as sub-sets, sub-VIs, in larger more complex VIs. This allowed for the creation of
small specialized VIs capable of monitoring a single parameter or controlling a single
instrument and which could be used as building blocks for a highly complex single VI
capable of monitoring, display, data acquisition, instrument control and fuzzy logic
control. The VIs developed for this project are described in the following sections.

11
3.2. Monitoring/Communication System
3.2.1. Body Temperature Monitoring
The Body Temp VI is able to obtain and display the animal’s rectal body
temperature (figure 3.2-1). The hardware measures the voltage drop across a thermistor
based temperature probe excited with 0.15 mA of current. The measured voltage is
converted to a temperature in degrees Kelvin using constants provided by the
manufacturer, and is ultimately converted to degrees Celsius using a standard conversion
factor (figure 3.3-1(a)). The resulting front panel display for the VI displays the
measured voltage, numeric measurement of temperature and a graphical representation of
temperature (figure 3.2-1 (b))
(a)
Figure 3.2-1: Body temperature VI bboxes show different sectiontemperature conversion volt
3.2.2. Analog Wavefo
The acquisition of %CO2, air
modified waveform acquisition VI s
This VI uses “Virtual Channels” (VC
(1)
locs
ag
rm
wa
up
s)
(3)
(2)(b)
k diagram (a) and front panel display(b). Dashed of the block diagram: voltage measurement (1), e to oK (2), and temperature conversion oK to oC.
Monitoring
y pressure and BP waveform data is done using a
plied by LabVIEWR (figure 3.2-2 (a) box (1)).
to obtaine scaled waveform data for the above
12
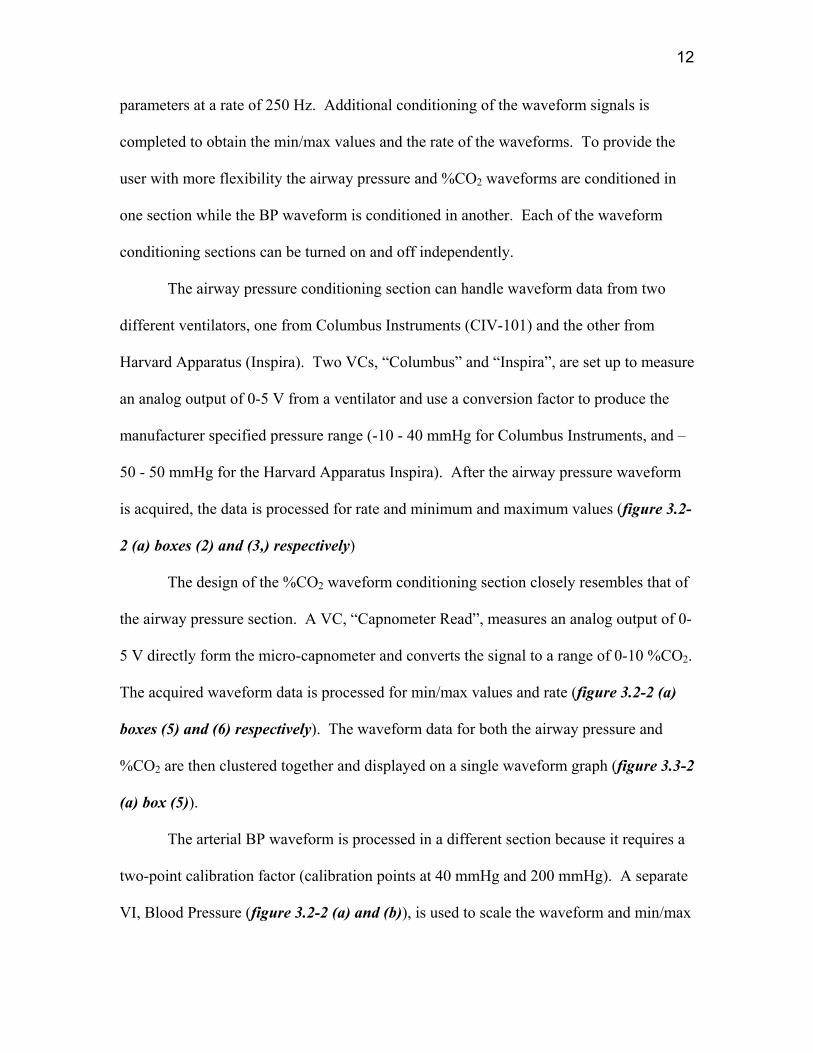
parameters at a rate of 250 Hz. Additional conditioning of the waveform signals is
completed to obtain the min/max values and the rate of the waveforms. To provide the
user with more flexibility the airway pressure and %CO2 waveforms are conditioned in
one section while the BP waveform is conditioned in another. Each of the waveform
conditioning sections can be turned on and off independently.
The airway pressure conditioning section can handle waveform data from two
different ventilators, one from Columbus Instruments (CIV-101) and the other from
Harvard Apparatus (Inspira). Two VCs, “Columbus” and “Inspira”, are set up to measure
an analog output of 0-5 V from a ventilator and use a conversion factor to produce the
manufacturer specified pressure range (-10 - 40 mmHg for Columbus Instruments, and –
50 - 50 mmHg for the Harvard Apparatus Inspira). After the airway pressure waveform
is acquired, the data is processed for rate and minimum and maximum values (figure 3.2-
2 (a) boxes (2) and (3,) respectively)
The design of the %CO2 waveform conditioning section closely resembles that of
the airway pressure section. A VC, “Capnometer Read”, measures an analog output of 0-
5 V directly form the micro-capnometer and converts the signal to a range of 0-10 %CO2.
The acquired waveform data is processed for min/max values and rate (figure 3.2-2 (a)
boxes (5) and (6) respectively). The waveform data for both the airway pressure and
%CO2 are then clustered together and displayed on a single waveform graph (figure 3.3-2
(a) box (5)).
The arterial BP waveform is processed in a different section because it requires a
two-point calibration factor (calibration points at 40 mmHg and 200 mmHg). A separate
VI, Blood Pressure (figure 3.2-2 (a) and (b)), is used to scale the waveform and min/max

13
values to the correct level once the user entered the 40 mmHg and 200 mmHg calibration
points (figure 3.2-2 (a) box (8)). The waveform is also processed to obtain the rate of the
signal in beats per minute (BPM) (figure 3.2-2 (a) box (9))
(a)
(b
Fi
(1)
)
gure 3.2-2: Waveform processing se(box (1)), airway pressure rate (and %CO2 waveform display (bo(6)), blood pressure rate (box (7scaling for Min/Max and wavefo(b), and block diagram (c).
(2)
(3)
(4)
(5)
cb
(6)
(c)
tion (a) consisting ox (2)), airway Minx (4)), %CO2 Min/M
)), blood pressure trm display (box (8))
(7)
of a waveform acqu/Max (box (3)), airwaax (box (5)), %CO2
wo point calibration. Blood pressure V
(8)
i
r I
(9)
sition VI y pressure ate (box and front panel

14
3.3. Instrument Control System
3.3.1. Anesthetic Control
The Anesthetic Concentration/Flow Control VI is able to monitor the gas flow
valves and calculate the correct flow rates to obtain the requested anesthetic percentages
(figure 3.3-1). This VI takes advantage of two major sub-VIs, Anesthetic Calculator and
Basic Gas Mixer (figure 3.3-3 (a) box (1) and (2) respectively), to perform the majority
of the calculations and act primarily as the input point for the user.

15
(1)
(2)
(a)
(b)
Figure 3.3-1: Anesthetic Concentration / Flow Control VI block diagram (a), showing the Anesthetic Calculator (box1) and the Basic Gas Mixer (box 2) VI, and front panel (b).

16
The Anesthetic Flow Rate Calculator VI (figure 3.3-2) is designed to take the user
input values sent to it by the Anesthetic Concentration/Flow Control VI and
environmental conditions, including barometric pressure and the internal temperature of
the copper kettle vaporizer, to calculate the correct flow rates for the nitrogen (N2, flow
rate 0 –500 ml/min), oxygen A (O2A, flow rate 0 –100 ml/min), oxygen B (O2B, flow
rate 0 –100 ml/min), vaporizer (VO2, flow rate 0 –50 ml/min) and carbon dioxide (CO2,
flow rate 0 –50 ml/min) flow meters and send them to the “Basic Gas Mixer” VI. The VI
is also designed to evaluate the input and environmental parameters so that new flow
values are only sent on to the next section if a change has taken place, saving processing
time.
The Basic Gas Mixer VI communicates with each individual flow meter used in
the laboratory (figure 3.3-3 (a) and (b)). A read VC and write VC for each of the flow
meters (N2, O2A, O2B, VO2 and CO2) are used to allow the VI to set the desired rate
and read the actual rate. If the actual does not match the set values an error message is
generated and displayed on the user interface.

17
(a)
(b) Figure 3.3-2: Anesthetic Flow rate Calculator VI block diagram (a) and
front panel (b). (Based on work done by Dr. Ross Shonat).

18
(a)
(b) Figure 3.3-3: Basic Gas Flowmeter VI block diagram (a) and
front panel (b). (Based on work done by Dr. Ross Shonat).

19
3.3.2. Ventilator Control
The Ventilator Control VI (Figure 3.3-4), designed primarily by a previous
researcher Amanda Kight, had slight changes made to the input/output structure to allow
for the integration of the VI with the new interface. This VI provides the user with
control of such ventilator parameters as respiratory rate, tidal volume and I/E ratio as well
as starting and stopping the ventilator.
(a)
(b)
Figure 3.3-4: The Ventilator Control VI block diagram (a) and front panel display (b). (Based on work done by Amanda Kight).

20
(a)
(b ) Figure 3.3-5: Inspira Control VI Block diagram (a)
and front panel (b).
21
The Inspira Control VI is able to control the Harvard Apparatus Inspira ventilator
(figure 3.3-5). A list of ASCII commands are provided by the manufacturer and used as
the basis of the control VI. The VI is designed to identify a change in the user settings
and in response send the corresponding ASCII code to the ventilator via an RS/232
connection.
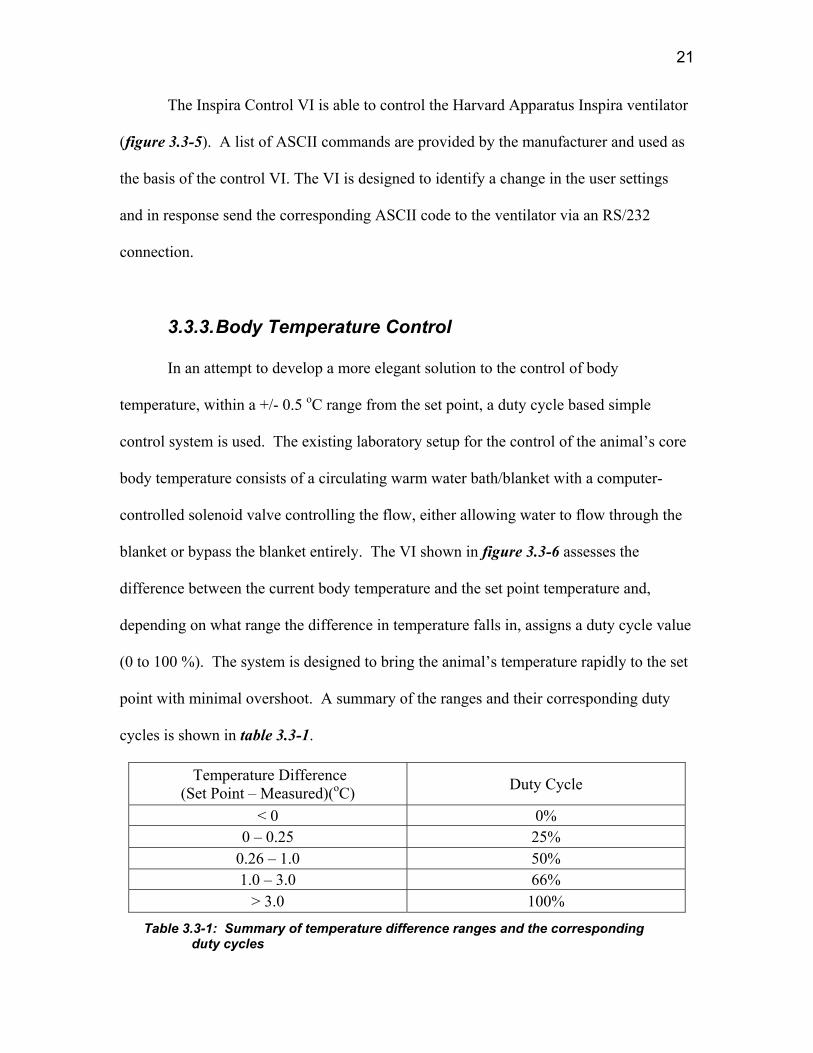
3.3.3. Body Temperature Control
In an attempt to develop a more elegant solution to the control of body
temperature, within a +/- 0.5 oC range from the set point, a duty cycle based simple
control system is used. The existing laboratory setup for the control of the animal’s core
body temperature consists of a circulating warm water bath/blanket with a computer-
controlled solenoid valve controlling the flow, either allowing water to flow through the
blanket or bypass the blanket entirely. The VI shown in figure 3.3-6 assesses the
difference between the current body temperature and the set point temperature and,
depending on what range the difference in temperature falls in, assigns a duty cycle value
(0 to 100 %). The system is designed to bring the animal’s temperature rapidly to the set
point with minimal overshoot. A summary of the ranges and their corresponding duty
cycles is shown in table 3.3-1.
Temperature Difference (Set Point – Measured)(oC) Duty Cycle
< 0 0% 0 – 0.25 25%
0.26 – 1.0 50% 1.0 – 3.0 66%
> 3.0 100%
Table 3.3-1: Summary of temperature difference ranges and the corresponding duty cycles

22
(a)
(b) Figure 3.3-6: The water bath control VI block diagram
(a) and front panel display (b).
The Duty Cycle VI provides the entire system with a series of Boolean controls
that control the activity and acts as a time interval control (figure 3.3-7). The VI takes
advantage of the iteration count in combination with a set delay function to create a
repeatable time interval count. A user input is incorporated into the VI to allow for
adjustment of the time intervals for greater flexibility and increased functionality.

23
(a) (b) Figure 3.3-7: Duty cycle VI block diagram (a) and front panel (b)
3.4. Fuzzy Logic Control Systems
As discussed in the background section, both traditional and fuzzy logic controls
have advantages and disadvantages that must be considered carefully. The advantage of
the traditional control approach is that it is a time tested and proven method of producing
an accurate and stable control system that is robust to outside stimuli. The major
disadvantage of traditional control systems is their dependence on the accuracy and
stability of the mathematical model they are based upon. For the control of anesthesia,
the test subject’s physiological response to the anesthetic or ventilation settings is
modeled to predict the affects of changes to these parameters. To achieve a more
accurate and robust control system, a multitude of parameters must be taken into account.
The need for multiple inputs to improve accuracy makes the system susceptible to being
adversely affected if one of the input parameters is lost or is not being monitored. This
reduces user flexibility.

24
Fuzzy logic, on the other hand, models the decision making of an expert. For the
control of anesthesia the modeling of the anesthetist rather than the test subject’s
physiology has many advantages. Some of the noted advantages to modeling the
decisions of the anesthetist rather than the test subject’s physiology are:
• “Human physiology is complex, and more difficult to model than the decision
making process of the anesthetist,
• The variation between and within patients is much larger than the variation in
decisions between and within anesthetists,
• A patient model cannot directly tell us what information is relevant to the
anesthetist, whereas an anesthetist model can.” (De Graaf et al 1997)
Another advantage of fuzzy logic control is the ability to subdivide the control
systems to produce a system in which the individual parameters are independent of each
other. This subsystem approach allows for the development of a complex control system
that is made up of fairly simple parts and has the ability to continue to function if there is
an error in one of the parameter control systems. The most notable disadvantage to the
use of fuzzy logic controls is that the system is only as accurate as the knowledge base it
is developed from. Table 3.4-1 provides an overview of the pros and cons for both
control approaches.
To achieve a more flexible, accurate and easily implemented control system, the
fuzzy logic approach was used for the BP and CO2 control sub-systems in this
application. The use of fuzzy logic control, rather than traditional control, was based on
the pros and cons of the two approaches outlined in table 3.4-1 and the success of the
work done previously using this strategy (Apshari et al 1994, Becker et al 1997, Dojat

25
1997, Graaf et al 1997, Held et al 2000, Linkens 1999, Lowe et al 1999, Meier et al
1992, Shing et al 1999).
TRADITIONAL CONTROL FUZZY LOGIC CONTROL
PROS
• Time tested and proven • Accurate/Stable • Can compensate for
outside stimuli
• Models Anesthetist decision making
• Gives direct output • Easily implemented • Shown to be affective for
anesthesia control in past research (animals/humans)
• Can be subdivided into independent parameter control
CONS
• Accuracy and stability is dependent on model accuracy
• Reduced user flexibility to monitor parameters independently
• Model of physiology is highly complex
• Implementation can be difficult
• Fairly new approach • Only as accurate as the
knowledge base used
Table 3.4-1: Pros and Cons of the traditional and fuzzy logic approach to anesthesia control.
3.4.1. Blood Pressure
As discussed previously, there are three major sections to a fuzzy logic BP control
system, the fuzzification, inference and defuzzification sections. The fuzzification
process is achieved primarily by developing a set of membership functions. The
fuzzification membership functions developed for this project are based primarily on a
fuzzy logic system developed in earlier work for the control of human anesthetic depth
(Meier 1992). The equation that defines the membership functions used in this research
was as follows:

26
N = exp (-K (Z – L))
N = Membership value
K = Width of the bell
Z = Input value
L =Shifting with reference to zero
Due to the differences in the anesthetic being used here, halothane instead of
isofluorane, and the physiological differences between humans and rodents, the
membership functions and rule base were altered during preliminary testing to ensure
accurate output values, resulting in the rule base shown in table 3.4-2 (Meier et al 1992).
These alterations consisted of an increase in the offset from zero for the NB, NS, PS and
PB rules for preliminary testing and the addition of a correction in the output rule base to
allow for user specified reaction intensity (i.e. a lower correction value translates to a less
intense reaction). These changes made to the variables are based on observations made
in the laboratory.
Error Integral Membership Functions
0.00
0.20
0.40
0.60
0.80
1.00
1.20
-500 -400 -300 -200 -100 0 100 200 300 400 500
In pu t V a lu e
NBNSZPSPB
Figure 3.4-1: Preliminary membership functions for blood pressure
control system.

27
Two input values are used for the BP control system, error (E), defined as the
difference between the actual mean arterial blood pressure (MAP) value and set MAP
value, and the integral of the error (IE), defined as the integral of the error value over 10
time intervals. The IE value is present in the system to compensate for any transients in
the E value, ultimately producing a more stable robust system. The two input values are
fit to two separate sets of membership functions based on the above equation (figure 3.4 -
1) and the location of the input value on each of the membership curves is noted to assign
a membership value for each input rule.
INPUT OUTPUT
Rule E (Measured - Set)
IE (Integral Error) Rule Output
NB -40 -400 Z Set – (2 * correction Value)
NS -20 -200 BS Set – correction Value
Z 0 0 S Set
PS 20 200 AS Set + Correction Value
PB 40 400 VS Set + (2 * Correction Value)
Table 3.4-2: Pressure controller rule base definition summary.
Once values are assigned to the two sets of input rules, for E and IE inputs, the
inference process is used to obtain a single set of output rule values. This is achieved
using a standard set of fuzzy logic inference operations, shown below, where Z, BS, S,
AS and VS are the output rules (see table 3.4-2).

28
Z= MAX (NBE, NBIE)
BS = MAX [NSE, MIN (ZE, NSIE)]
S = MIN (ZE, ZIE)
AS = MAX [PSE, MIN (ZE, PSIE)]
VS = MAX (PBE, PBIE)
Where E and IE denote which input value the rule pertains to.
After the inference process is completed and values are assigned to each of the
output rules, a crisp value for the anesthetic level using the defuzzification process is
produced. A standard defuzzification operation is shown below,
Crisp Output Value = [(Z*(A-2C)) + (BS*(A-C)) + (Z*A) + (AS*(A+C)) + (VS*(A+2C))] Z + BS + S + AS + VS
where A = anesthetic set point, and C = user defined correction value which must be
determined by an experienced anesthetist.
The Blood Pressure Control VI shown in figure 3.4-2 is based on the above
calculations. The fuzzification process is achieved using a formula node that represents
the membership functions and outputs a membership value for each of the input rules
(figure 3.4-2 box (1)). The inference process is achieved using a series of Min/Max VI
sequenced to duplicate the fuzzy logic inference operation stated previously. (figure 3.4-
2 box (2)). The defuzzification process is completed using another formula node which
takes in the output rule values obtained from the inference process and outputs a single
crisp value (figure 3.4-2 box (3)). Safety limits are present in the VI to ensure that the
system does not adjust the anesthetic level outside the limits that are defined by the user
(figure 3.4-2 box (4)). The correction values, pressure set point, anesthetic set point
upper and lower limit values are left as input values to provide flexibility to the user. The

29
actual MAP value is calculated using the Mean Arterial Pressure VI, which is designed to
use the maximum (systolic) pressure and minimum (diastolic) pressure values obtained
from the waveform processing section (figure 3.4-3).
(a)
Figu
(1)
re 3.4-2: Blood Pressure Contro
inference, defuzzification operespectively) and front panel
Figure 3.4-3: Mean Arterial Pr
(2)
l VI block diagram (a) showingrations and the safety limits (
display (b).
(a)
essure VI block diagram (a) an
(3)
(b) the fuzzifica
boxes 1, 2 , 3
(b
d front panel
(4)
tion, and 4
)
(b)

30
3.4.2. End Tidal CO2 Control
As with the pressure control system, the CO2 control system is comprised
primarily of the three major processing steps of fuzzification, inference, and
defuzzification. But, unlike the pressure control system, the CO2 control system
presented a unique challenge because of a lack of previous work done on controlling CO2
levels in anesthetized rodents. Because of this, the membership function sets required for
the fuzzification process were based primarily on observations performed in the
laboratory. These observations and available physiological data for both humans and
animals indicated that the relationship between the change in respiratory rate/tidal
volume and change in ETCO2 was linear (figure 3.4.4). Therefore, the mathematical
relationship that produces the desired linear membership functions (figure 3.4-5) is
shown below:
N = MAX (0,(1-ABS(Z – L))
N = Membership value
Z = Input value
L =Shifting with reference to zero
Five membership functions were used per input based on optimization studies done
during previous research (Meier et al 1992).

31
Figure 3.4-4: Plots of (A) increased ventilation with increased pCO2 levels, due to (B) increased RR and (C) increased TV (Letsky 1992) .
The two input parameters for this system are E and IE, where E is defined as the
difference between the actual %CO2 measured by the micro-capnometer and the set
%CO2 value, and IE is defined as the integral of the E value over 10 time intervals.
There were two major output parameters identified for the control of CO2, Respiration
rate (RR), the rate at which the animal’s lungs are inflated and deflated, and tidal volume
(TV), the volume of gas that is forced into the lungs with each breathe.

32
ETCO2 Control Membership Functions
0
0.2
0.4
0.6
0.8
1
1.2
-3 -2 -1 0 1 2 3
E(Mearured CO2 - Set CO2)
Mem
bers
hip
(Tru
th)
NB
NS
Z
PS
PB
Figure 3.4-5: Fuzzification membership functions for the E input rule base.
The linear relationship between O2 concentrations and the RR and TV are used as
the basis for the control system output rule base (table3.4-3), resulting in a more drastic
increase in TV/RR for more drastic changes in ETCO2. In order to simplify the action of
the control system, a scaling factor approach was adopted for the output rule set. The
scaling factor allows for the development of a single output rule set and single crisp
output value used to scale the set point values of RR and TV. Once the output rule set is
established, it is possible to develop a set of inference operations (shown below) to
convert the values assigned to the input rule sets into values for the output rule set (see
table 3.4-3).
Z= MAX (NBE, NBIE)
BS = MAX [NSE, MIN (ZE, NSIE)]
S = MIN (ZE, ZIE)
AS = MAX [PSE, MIN (ZE, PSIE)]
VS = MAX (PBE, PBIE)
Where E and IE denote which input value the rule pertains to.

33
INPUT OUTPUT
Rule E (Measured - Set)
IE (Integral Error) Rule Output
NB -2 -20 Z Set – (0.5* correction Value)
NS -1 -10 BS Set – (0.25*correction Value)
Z 0 0 S Set
PS 1 10 AS Set + Correction Value
PB 2 20 VS Set + (2 * Correction Value)
Table 3.4-3: ETCO2 controller rule base definition summary.
After the inference process is completed and values are assigned to the each of the
output rules it is possible to obtain a crisp value for the scaling factor using the
defuzzification process. Using a standard fuzzy logic defuzzification operation and the
following was obtained (C = Correction Value).
Output = ((Z*(1-(0.5*C)))+(BS*(1-(0.25*C)))+(S*1)+(AS*(1+(C)))+(VS*(1+(2*C)))) Z + BS + S + AS + VS
An additional processing step was added to the system after noting an effect of the
animal’s pO2 value on the ventilation (TV and RR) values (figure 3.4-4). The additional
processing step allows the user to enter the animal’s pO2 obtained from a manual blood
gas measurement. The value of the pO2 entered by the user is used to scale the correction
factor, resulting in a variable adjustment of RR and TV depending on the pO2 value
entered. A summary of the pO2 ranges and the scaling associated with them is shown in
table 3.4-4. A default value of 100mmHg is automatically entered into the pO2 field if no
measured pO2 is entered by the user.

34
Figure 3.4-6: Graph showing the change in ventilation
due to changes in oxygen concentration (Letsky 1992)
PO2 Range (mmHg)
Scaling
49 and lower 2* Correction Value 50 - 74 1.5*Correction Value 75 - 99 1.25* Correction Value
100 and higher 1* Correction Value Table 3.4-4: Correction value scaling factors for various pO2 ranges.
The ETCO2 Control VI shown in figure 3.4-6 is based on the above calculations.
The fuzzification process is achieved using a formula structure that represents the
membership functions and outputs a membership value for each of the input rules (figure
3.4-5 box (1)). The inference process is achieved using a series of Min/Max VIs
sequenced to duplicate the fuzzy logic inference operations stated previously (figure 3.4-
6 box (2)). The defuzzification process is achieved using another formula structure
which takes in the output rule values obtained from the inference process and outputs a
single crisp value (figure 3.4-6 box (3)). Scaling of the correction value was achieved
using a case structure with the pO2 range as the criteria for which case to use (figure 3.4-

35
6 box (4)). The correction value, CO2 set point, pO2, RR set point and TV set point
values are left as input values to provide flexibility to the user.
3.5.
T
file, is sh
(1)
Figure 3.4-7: ETCO2 Cothe fuzzificationoperations (boxfront panel disp
Data Transfer Sy
he VI used to automatically w
own in figure 3.5-1. The Wr
(2)
ntrol VI block diagram, inference and defuzzes 1, 2 and 3 respectivlay.
stem
rite the patient’s mo
ite to File VI is also c
(3)
(aificely
nito
apa
(4)
) showing ation ) and (b)
red parameters to a text
ble of placing markers in

36
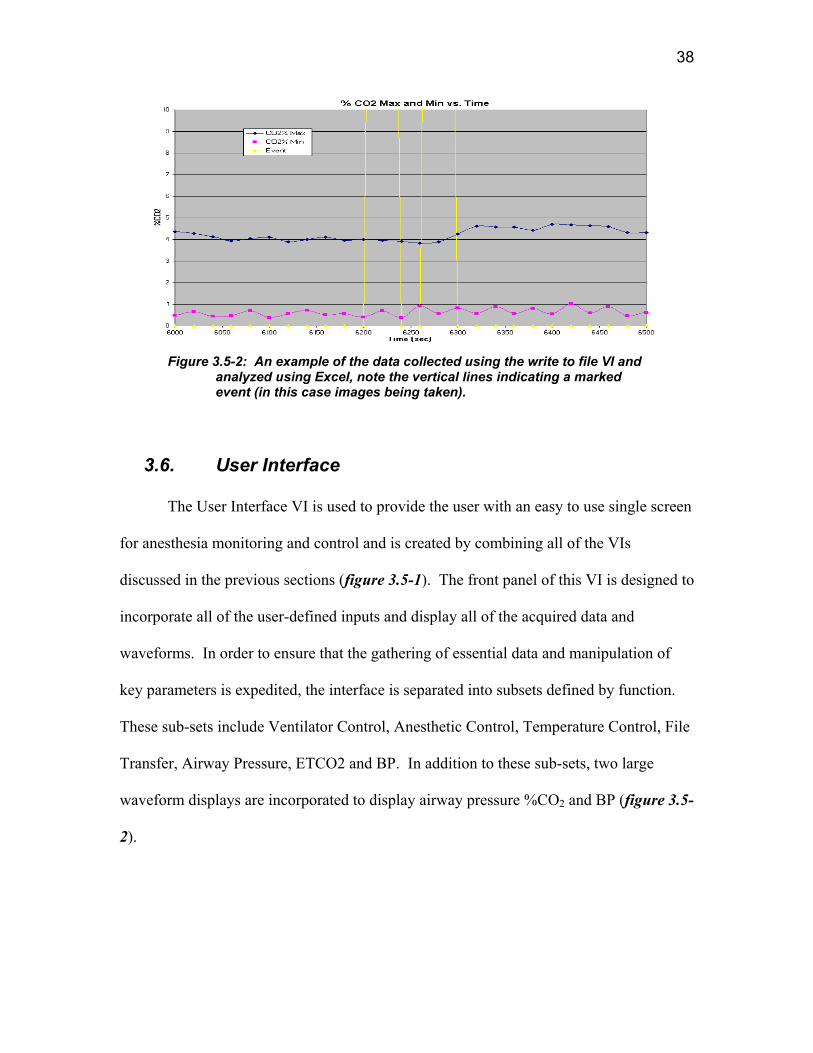
the data and a text description describing the marked event. The event marker capability
makes the analysis of the data and the recreation of the events during the procedure more
convenient and accurate. An example of data collected using this VI, and its event
marking capability, is shown in figure 3.5-2.

37
(a)
(b)
Figure 3.5-1: the Write to File VI block diagram (a) and front panel display (b).
38
Figure 3.5-2: An example of the data collected using the write to file VI and
analyzed using Excel, note the vertical lines indicating a marked event (in this case images being taken).
3.6. User Interface
The User Interface VI is used to provide the user with an easy to use single screen
for anesthesia monitoring and control and is created by combining all of the VIs
discussed in the previous sections (figure 3.5-1). The front panel of this VI is designed to
incorporate all of the user-defined inputs and display all of the acquired data and
waveforms. In order to ensure that the gathering of essential data and manipulation of
key parameters is expedited, the interface is separated into subsets defined by function.
These sub-sets include Ventilator Control, Anesthetic Control, Temperature Control, File
Transfer, Airway Pressure, ETCO2 and BP. In addition to these sub-sets, two large
waveform displays are incorporated to display airway pressure %CO2 and BP (figure 3.5-
2).

Mean Arterial
Pressure
Pressure
ControlRate/Tidal Volume ETCO2
Anesthetic Concentration /
Flow ControlWater Bath Control
Duty
Cycle
Figure 3.6-1: User interface VI block is made up of the previously discussed VIs
39
Control Ventilator Control
Write to File

40
Figure 3.6-2: Interfacev2 VI block diagram (a) and front panel interface (b)

41
3.6.1. Interface Hierarchy
The following is a block diagram representation of the hierarchy of the VIs used to
create the user interface:
Figure 3.6-3: Block diagram showing the hierarchy of the sub-VIs used to make the
interface VI.
42
4. METHODS
The system that was developed to achieve the goals set forth at the start of this project
had to be tested for safety, efficacy and stability. This was achieved using both in-vitro
and in-vivo experiments. The in-vivo testing was completed using a total of 10 rats,
which underwent both short and long–term perturbation experiments to assess the
capabilities of the system. The following sections describe the methods used to complete
these experiments.
4.1. In-Vitro Testing
In order to test the performance, safety and efficacy of the body temperature
control system before it was tested on any animals, a rat phantom was designed and built.
It was created using a plastic conicle vial filled with distilled water into which the rectal
thermometer was placed. The phantom was placed on the heated stage and covered with
the heating blanket.
In-Vitro testing of the blood pressure and ETCO2 control systems was not
possible due to a lack of an acceptable rat phantom for these parameters. Though there
are mathematical models (rat) that exist that can model the physiological reaction to both
anesthetic changes and changes in RR and TV, the interfacing of such models with the
existing system was not feasible since the model would have to produce a waveform
(analog) output that could be sampled by the system, which is currently not available.
4.2. In-Vivo Experiments
The true capabilities of the control systems were tested using live animals that
were under continuous monitoring by an anesthetist. The testing consisted of two major

43
portions; the short-term perturbation tests and the long-term perturbation tests. The
testing was separated in this manner to better evaluate the system’s stability and ability to
regulate in two different time response situations, one which models such events as rapid
un-sustained pressure changes due to surgical activity and the other which models long
lasting pressure changes due to loss of blood or fluid infusion. During both sets of
experiments, the ETCO2 control system was evaluated, when available. All in-vivo
experiments were conducted in accordance with the protocols approved by the institutes
Institutional Animal Care and Use Committee (IACUC) at the Worcester Polytechnic
Institute.
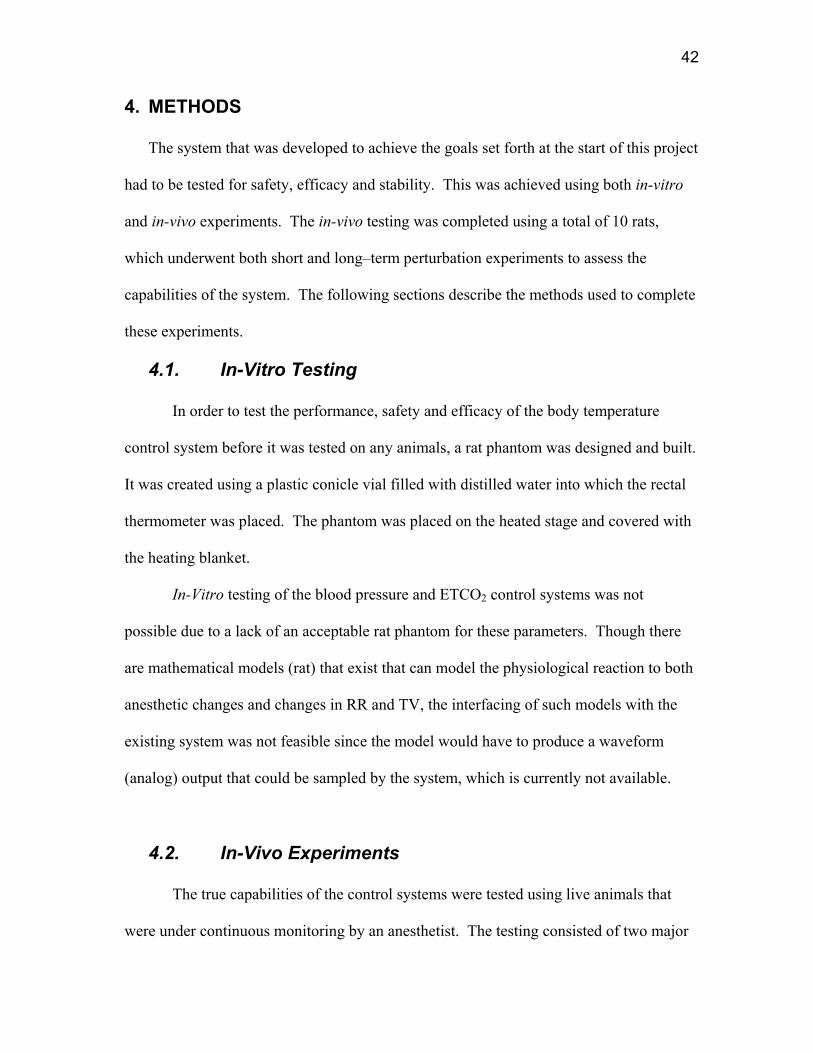
Each rat was anesthetized at the start of experiments using an induction chamber
(figure 4.2-1 (a)), which was filled with a mixture of N2, O2, and halothane saturated O2.
The interface was used to control the concentrations of the gases and monitor the actual
flow rates. Once the rat lost consciousness, an anesthesia mask was affixed over it’s
snout allowing for sustained anesthesia while the tracheotomy procedure was completed
(figure 4.2-1 (b)). While the mask was in place, the halothane concentration was reduced
to ~2.5% to reduce the chances of over anesthetization while maintaining depth. The
tracheotomy procedure consisted of exposing the trachea via surgical dissection and
inserting a Teflon cannula into the trachea. After the tracheal cannula was placed (figure
4.2-1 (c)) it was connected to the gas mixture and the animal was allowed to breathe
freely until labored breathing was detected by the surgeon or the anesthetist, at which
time the ventilator was started with an appropriate respiratory rate and tidal volume
chosen based primarily on the animal’s body weight.

44
The placement of the tracheal cannula allowed for the monitoring of %CO2 by the
micro-capnometer. Prior to the beginning of each experiment the micro-capnometer was
calibrated using pure N2 and 5% CO2 calibration gas. At this point the temperature probe
was placed into the rectum of the rat and body temperature control was started (set point
of 38 oC). In addition, the Write to File function was activated at this point of the
procedure to gather available data at a typical rate of 1 data set / (10 sec), though the
sampling rate did vary from experiment to experiment due to changes in the processor
and memory load on the computer.
The left femoral vein and artery were exposed via surgical dissection. Once
exposed, the left femoral artery was catheterized with Intramedic brand PE50
polyethylene tubing. The catheter was pre-filled with heparinized saline (10 units/ml) to
reduce the risk of coagulation during the procedure. The arterial catheter was connected
to the pressure transducer, which was calibrated with a sphygmomanometer prior to the
start of each experiment (40 mmHg and 200 mmHg calibration points), allowing for BP
monitoring. The femoral artery catheter was also used as the withdrawal point for blood
gas samples (~0.25 ml blood/sample). The left femoral vein was also catheterized with
PE50 polyethylene tubing and used for the administration of fluids and vasoactive drugs.

45
(a) (b)
(c)
Ventilator Inhalation Tube
Tracheal Cannula
Ventilator Exhalation Tube (with CO2 Sampling line)
Figure 4.2-1: Digital images of a rat (a) in an induction chamber (b) with the anesthesia mask over its snout and (c) with the tracheal cannula inserted and connected to the ventilator inhalation and exhalation tubing.
4.2.1. Short-term Perturbation
The short-term perturbation tests were performed initially to test the ability of the
control system to return the BPto the set level following a short drastic change in BP. In
this set of experiments, the BP of the rat was monitored in situations where no control

46
was present and where automated control was activated. CO2 was not controlled during
this set of experiments due to complications with the ventilator being used at the time.
During this set of experiments, 4 rats (R1 – R4) were tested once they had reached
a stable state after being instrumented as previously described. Once a stable state was
achieved, a 1 µg injection of epinephrine (0.1 ml of 10 µg/ml epinephrine diluted in
sterile saline solution) was administered IA. The order of the controlled or no-control
conditions was randomized. After injection, the BP was allowed to reach a stable level
before moving on to the next test (time between injections varied greatly between
animals).
4.2.2. Long-term Perturbation
Long-term perturbation tests were performed to determine the systems ability to
control BP and ETCO2 during a situation of prolonged pressure fluctuation. These
experiments were designed to induce conditions of either hypertension or hypotension to
fully access the system. In these experiments, the animal’s BP was manipulated using
vasoactive drugs. As with the short term perturbation testing, these tests were
randomized and performed under both controlled and no-controlled situations. During
the long term perturbation experiments, the CO2 controller was activated in conjunction
with the BP controller and deactivated during the no control situation.
During this set of experiments, 6 rats LTP1 – LTP6, were tested once they
reached a stable state after being instrumented as previously described. Once a stable
physiological state was achieved, the animal was forced into a hypertensive state using a
5 µg/(kg*min) dose of neo-synephrine, a vasoconstriction drug, maintained for a 10-

47
minute period. The infusion was administered IV in the left femoral artery and a Cole
Parmer syringe pump was used to ensure a constant infusion rate. For these experiments
the neo-synephrine was diluted to a concentration of 15 µg/ml in Lactated Ringers
Solution (LRS). Controlled and no-control situations were tested.
A hypotensive state was achieved using sodium nitroprusside, a drug that causes
vasodilatation, at a dose of 1 µg/(kg*min) and maintained for a 10-minute period. The
infusion was administered IV in the left femoral artery and a Cole Parmer syringe pump
was used to ensure a constant infusion rate. For these experiments, the neo-synephrine
was diluted to a concentration of 3 µg/ml in Lactated Ringers Solution (LRS). Again,
controlled and no-control situations were tested.

48
5. RESULTS
5.1. Body Temperature Results
The temperature of the rat phantom was monitored and the results of one of these
experiments is shown in figure 5.1-1. After testing the control system on the rat phantom
to ensure safety and stability, the system was tested on an actual rat. The results of one
such experiment are shown in figure 5.1-2. The control system was able to maintain the
temperature of the water within the +/- 0.5 oC range throughout several trial runs, and
was able to achieve this while ramping to the set point temperature in an acceptable
period of time. The control system, once at set temperature (37 oC), stayed within the 0
and 25 % duty cycle regions for the majority of the test runs, meaning that the wear on
the solenoid was reduced. The oscillations seen in the temperature over time were
estimated to be a result of the heating and cooling of the metal stage and were not further
investigated, since the temperature remained within the acceptable range.
32
33
34
35
36
37
38
0 1000 2000 3000 4000 5000 6000
Time (sec)
Wat
er T
empe
ratu
re (C
elci
us)
Figure 5.1-1: Test data for control of water temperature in a rat substitute
(With a set point of 37 degrees Celsius).

49
Body Temp vs. Time
35
35.5
36
36.5
37
37.5
38
38.5
39
39.5
40
4000 4500 5000 5500 6000 6500 7000 7500 8000
Time (sec)
Bod
y Te
mp
(C)
Body Temp
Event
Figure 5.1-2:A sample of the data collected during a preliminary
animal procedure (set point Temperature of 38 degrees Celsius).
5.2. Short term Perturbation Results
During the short-term perturbation testing the user interface was set to save data
every twenty seconds. The acquired data were saved to a text file and later converted to
ExcelR format for further analysis. An example of a resulting data set is shown in table
5.2-1. The data pertaining to the epinephrine injections were isolated and the time course
was adjusted to reflect the time relative to injection. The adjustment of the time course to
relative time allowed for the direct comparison of the physiological reaction before,
during and after injection under control and no-control conditions.
The important variables for the evaluation of the control system were identified
as the deviation of the measured MAP from the set point (baseline) MAP and the control
variable % anesthetic. Due to the natural variation in animals, the MAP deviation value
was expressed as a percent deviation from the MAP set point to allow for the direct

50
comparison of the different animals’ data sets. The % MAP deviation was calculated as
follows:
% MAP deviation = (Measured MAP – Set point MAP) *100 Set point MAP Once the % MAP deviation was calculated, a plot of the % anesthetic and % MAP
deviation vs. time for both the control and no-control conditions was produced for each
animal. A representative plot from animal R-1 is shown in figure 5.2-1& 5.2-2 and the
plots for all data yielding animals are included in Appendix A. The % anesthetic for the
no-control condition was excluded from these plots because it did not change. Of the four
animals tested, three animals yielded data for both the control and no-control conditions,
while one only yielded data for the no-control condition and was removed from further
analysis.
For a statistical analysis of these results, the root mean square (RMS) value of the
% MAP deviation for both the control and no control conditions was calculated (for a
~250 seconds interval) A paired t-test analysis was used to determine if there was a
significant decrease in the % MAP deviation (as expressed by the RMS values) while
under automated control. A summary of the calculated values of RMS and the results of
the paired t-test are shown in table 5.2-2
51
Time (sec. post injection)
0 50 100 150 200
MAP
(mm
Hg)
0
20
40
60
80
100
120
140
% A
nest
hetic
(Hal
otha
ne)
0.0
0.5
1.0
1.5
2.0
2.5
3.0Bolus
MAP mmHg (Control)MAP mmHg (No Control)% Anesthetic (Control)
Figure 5.2-1: Animal R-1 epinephrine test data showing MAP under control (closed circles) and no- control (open circles) conditions and % anesthetic (closed triangles) vs. time.

52
Time (sec. post injection)
0 50 100 150 200
Dev
iatio
n fro
m M
AP S
etpo
int (
%)
-60
-40
-20
0
20
40
60
% A
nest
hetic
(Hal
otha
ne)
0.0
0.5
1.0
1.5
2.0
2.5
3.0Bolus
% MAP Deviation (Control)% MAP Deviation (No Control)% Anesthetic (Control)
Figure 5.2-2 Animal R-1 epinephrine test data showing % MAP deviation under control (closed circles) and no- control (open circles) conditions and % anesthetic (closed triangles) vs. time.

53
Animal: R-1 Strain: Sprague Dawley Test: Epinephrine (No Control) Date: 03/19/03
Time (post Inj.)
Temp Set (oC)
Actual Temp. (oC)
An. % (Halothane) O2%
CO2 %
MAX
CO2 % MIN
Vent Press. MAX
Vent. Press. MIN
Tidal Volume
(cc)
Resp. Rate
(BPM)
MAP (mmHg)
Event Marker Event
Set Pressure (mmHg)
Dev. From MAP
% Dev. From MAP
-180 38 38.10 2.00 32 4.87 1.77 3.51 -1.2 2.7 93 105.06 0 No event 105 0.06 0.06
-170 38 38.10 2.00 32 5.04 1.67 6.64 -1.2 2.7 93 105.06 0 No event 105 0.06 0.06
-160 38 38.10 2.00 32 5.30 1.55 2.05 -1.2 2.7 93 104.96 0 No event 105 -0.04 -0.04
-150 38 38.10 2.00 32 5.34 1.73 5.31 -1.2 2.7 93 105.17 0 No event 105 0.17 0.16
-140 38 38.10 2.00 32 5.36 1.71 5.82 -1.2 2.7 93 105.68 0 No event 105 0.68 0.64
-130 38 38.10 2.00 32 5.56 1.91 5.37 -1.1 2.7 93 104.76 0 No event 105 -0.24 -0.23
-120 38 38.10 2.00 32 5.83 1.78 4.69 -1.1 2.7 93 104.45 0 No event 105 -0.55 -0.53
-110 38 38.10 2.00 32 5.67 2.61 5.65 -1.2 2.7 93 104.96 0 No event 105 -0.04 -0.04
-100 38 38.10 2.00 32 5.83 1.91 5.71 -1.1 2.7 93 104.35 0 No event 105 -0.66 -0.63
-90 38 38.10 2.00 32 5.89 1.75 6.35 -1.2 2.7 93 104.86 0 No event 105 -0.14 -0.14
-80 38 37.98 2.00 32 5.95 1.67 6.22 -1.2 2.7 93 105.06 0 No event 105 0.06 0.06
-70 38 37.98 2.00 32 5.91 1.69 1.12 -1.2 2.7 93 105.78 0 No event 105 0.78 0.74
-60 38 37.98 2.00 32 5.48 1.60 4.06 -1.2 2.7 93 105.68 0 No event 105 0.68 0.64
-50 38 38.10 2.00 32 6.12 1.78 5.32 -1.2 2.7 93 105.58 0 No event 105 0.58 0.55
-40 38 37.98 2.00 32 6.02 2.20 3.65 -1.1 2.7 93 105.68 0 No event 105 0.68 0.64
-30 38 37.98 2.00 32 5.98 1.83 4.25 -1.1 2.7 93 105.47 0 No event 105 0.47 0.45
-20 38 37.98 2.00 32 6.00 2.59 4.91 -1.2 2.7 93 104.76 0 No event 105 -0.24 -0.23
-10 38 37.86 2.00 32 6.11 1.95 5.47 -1.2 2.7 93 105.27 0 No event 105 0.27 0.25
0 38 37.86 2.00 32 5.95 1.95 5.39 -1.2 2.7 93 105.27 100 1 ug epi (no control)
105 0.27 0.25
10 38 37.86 2.00 32 6.08 1.75 4.62 -1.1 2.7 93 105.17 0 No event 105 0.17 0.16
20 38 37.86 2.00 32 5.31 1.63 4.06 -1.2 2.7 93 119.23 0 No event 105 14.23 11.93
30 38 37.86 2.00 32 5.31 1.72 2.54 -1.2 2.7 93 103.93 0 No event 105 -1.07 -1.03
40 38 37.86 2.00 32 4.69 2.19 5.63 -1.1 2.7 93 86.80 0 No event 105 -18.21 -20.97
50 38 37.86 2.00 32 4.98 1.53 4.58 -1.1 2.7 93 78.89 0 No event 105 -26.11 -33.09
60 38 37.86 2.00 32 5.67 1.73 6.88 -1.0 2.7 93 79.82 0 No event 105 -25.18 -31.55
70 38 37.98 2.00 32 3.77 1.63 5.91 -0.9 2.7 93 83.82 0 No event 105 -21.18 -25.27
80 38 37.98 2.00 32 4.31 1.67 5.28 -1.2 2.7 93 89.46 0 No event 105 -15.54 -17.37
90 38 37.86 2.00 32 4.16 1.89 5.83 -1.1 2.7 93 95.11 0 No event 105 -9.89 -10.40
100 38 37.98 2.00 32 4.75 1.72 6.50 -1.0 2.7 93 101.68 0 No event 105 -3.32 -3.27
110 38 37.98 2.00 32 5.28 1.82 6.63 -1.1 2.7 93 104.24 0 No event 105 -0.76 -0.73
120 38 37.86 2.00 32 5.53 1.90 6.15 -1.1 2.7 93 106.29 0 No event 105 1.29 1.22
130 38 37.86 2.00 32 5.79 2.30 7.10 -1.2 2.7 93 106.40 0 No event 105 1.40 1.31
140 38 37.86 2.00 32 5.56 2.17 5.60 -1.2 2.7 93 107.83 0 No event 105 2.83 2.63
150 38 37.86 2.00 32 5.91 1.79 7.20 -1.0 2.7 93 108.66 0 No event 105 3.65 3.36
160 38 37.86 2.00 32 5.82 2.35 5.70 -1.2 2.7 93 108.86 0 No event 105 3.86 3.55
Table 5.2-1 Representative data set for animal R-1 showing formatted data for an epinephrine injection test under no- control conditions.

54
Animal # R-1 R-1 R-1
RMS % MAP
Deviation No Control12.53 11.959 9.428
RMS % MAP
Deviation Control 9.242 10.806 8.570
D 3.291 1.153 0.859
D 1.767 s 1.327
T 2.306 p < 0.20
Table 5.2-2: Summary of calculated RMS values and Paired t-test results
5.3. Long-term Perturbation results
For all long-term perturbation testing, the interface was set to save data to a text
file approximately every four seconds. Once saved to the text file, as with the
short-term perturbations, the data was transferred to an ExcelR spreadsheet for
further analysis. A representative data set is shown in table 5.3-1. Since there
were two types of long-term perturbations, Neo-Synephrine (hypertension) and
sodium nitroprusside (hypotension) the data was separated by type of infusion
and control or no-control conditions. As with the short-term perturbation results,
the % MAP deviation was identified as the key evaluation parameter for these
tests while the % anesthetic was the major control variable. As with the previous
experiments, the time scale for these experiments was adjusted to represent

55
relative time post infusion start to allow the data from the control and no-control
tests to be directly compared.
Of the six animals tested, only four yielded data for the neo-synephrine
testing (LTP-2, LTP-3, LTP-4, LTP-6). A representative plot of % MAP
deviation and % anesthetic vs. time for the Neo-Synephrine injection testing is
shown in figure 5.3-1& 5.3-2 and the plots for all data yielding animals are
included in Appendix B.

56
Animal: LTP-3 Strain: Brown Norway Test: Sodium Nitroprusside (Control) Sex: Female Date: 03/12/03
Time (post Inj.)
Temp Set (oC)
Actual Temp. (oC)
An. % (Halothane)
O2% CO2
% MAX
CO2 % MIN
Vent Press. MAX
Vent. Press. MIN
Tidal Volume
(cc)
Resp. Rate
(BPM)
MAP (mmHg)
HR (BPM)
Event Marker Event
Set Pressure (mmHg)
Dev. From MAP
% Dev. From MAP
-344 38 37.86 1.80 30 5.26 0.11 2.78 -1.03 1.5 77 95.83 315 100
Pressure control started 95
95 0.83 0.87
-334 38 37.86 2.50 30 4.86 0.10 2.78 -1.03 1.5 77 94.60 315 0 No event 95 -0.41 -0.43
-324 38 37.98 2.50 30 5.24 0.12 2.81 -1.03 1.5 77 94.60 316 0 No event 95 -0.41 -0.43
-320 38 37.98 2.50 30 5.26 0.11 2.78 -1.03 1.5 77 94.80 315 0 No event 95 -0.20 -0.21
-316 38 37.98 2.50 30 5.25 0.12 2.73 -1.03 1.5 77 95.93 315 0 No event 95 0.93 0.98
-312 38 37.98 2.15 30 5.21 0.10 2.81 -1.03 1.5 77 94.49 313 0 No event 95 -0.51 -0.53
-308 38 37.98 1.80 30 5.05 0.11 2.76 -1.03 1.5 77 94.60 313 0 No event 95 -0.41 -0.43
-304 38 37.86 1.80 30 5.08 0.10 2.81 -1.03 1.5 77 90.49 313 0 No event 95 -4.51 -4.75
-300 38 37.98 1.80 30 5.33 0.12 2.73 -1.03 1.5 77 93.16 314 0 No event 95 -1.84 -1.94
-296 38 37.98 1.80 30 5.34 0.16 2.81 -1.05 1.5 77 92.65 312 0 No event 95 -2.36 -2.48
-292 38 37.98 1.80 30 5.46 0.17 2.76 -1.03 1.5 77 92.03 312 0 No event 95 -2.97 -3.13
-288 38 37.98 1.80 30 5.58 0.21 2.76 -1.03 1.5 77 92.24 313 0 No event 95 -2.77 -2.91
-284 38 37.98 1.80 30 5.68 0.21 2.76 -1.03 1.5 77 92.75 313 0 No event 95 -2.25 -2.37
-280 38 37.98 1.80 30 5.65 0.22 2.73 -1.03 1.5 77 93.47 313 0 No event 95 -1.53 -1.61
-276 38 37.86 1.80 30 5.65 0.22 2.73 -1.03 1.5 77 92.75 313 0 No event 95 -2.25 -2.37
-272 38 37.98 1.80 30 5.50 0.19 2.78 -1.03 1.5 78 93.36 314 0 No event 95 -1.64 -1.72
-268 38 37.98 1.80 30 5.70 0.23 3.03 -1.03 1.5 77 93.36 315 0 No event 95 -1.64 -1.72
-264 38 37.98 1.80 30 5.67 0.21 3.00 -1.05 1.5 77 94.29 313 0 No event 95 -0.71 -0.75
-260 38 37.98 1.80 30 5.53 0.21 2.98 -1.03 1.5 78 93.98 314 0 No event 95 -1.02 -1.07
-256 38 37.98 1.80 30 5.49 0.22 2.98 -1.03 1.5 77 94.80 314 0 No event 95 -0.20 -0.21
-252 38 37.98 1.80 30 5.59 0.21 2.93 -1.03 1.4 75 94.60 313 0 No event 95 -0.41 -0.43
-248 38 37.98 1.80 30 5.53 0.19 2.76 -1.03 1.4 76 96.65 313 0 No event 95 1.65 1.73
-244 38 37.98 1.80 30 5.53 0.18 2.78 -1.03 1.4 76 96.96 315 0 No event 95 1.96 2.06
-240 38 37.98 1.80 30 5.71 0.19 2.73 -1.05 1.4 76 97.57 315 0 No event 95 2.57 2.71
-236 38 37.98 1.80 30 5.74 0.19 2.78 -1.05 1.4 77 99.21 317 0 No event 95 4.21 4.43
-232 38 37.98 1.80 30 5.68 0.21 2.76 -1.05 1.4 76 98.39 317 0 No event 95 3.39 3.57
-228 38 37.98 1.80 30 5.64 0.18 2.71 -1.03 1.4 76 99.52 317 0 No event 95 4.52 4.76
-224 38 37.98 1.81 30 5.60 0.19 2.66 -1.03 1.4 76 100.24 318 0 No event 95 5.24 5.52
-220 38 37.98 1.81 30 5.74 0.18 2.78 -1.05 1.4 76 100.03 320 0 No event 95 5.03 5.30
-216 38 37.86 1.81 30 5.73 0.19 2.78 -1.03 1.4 77 100.34 318 0 No event 95 5.34 5.62
-212 38 37.98 1.80 30 5.65 0.18 2.71 -1.05 1.4 76 98.80 318 0 No event 95 3.80 4.00
-208 38 37.98 1.81 30 5.62 0.14 2.76 -1.03 1.4 76 98.39 318 0 No event 95 3.39 3.57
-204 38 37.98 1.81 30 5.40 0.11 2.56 -1.03 1.4 76 98.08 318 0 No event 95 3.08 3.25
-200 38 37.86 1.80 30 5.50 0.08 2.71 -1.05 1.4 76 97.57 318 0 No event 95 2.57 2.71
-196 38 37.98 1.80 30 5.43 0.10 2.78 -1.05 1.4 75 95.21 317 1 No event 95 0.21 0.22
-164 38 37.86 1.77 30 5.27 0.09 2.73 -1.03 1.4 75 87.82 313 0 No event 95 -7.18 -7.56
-160 38 37.98 1.80 30 5.46 0.09 2.71 -1.03 1.4 74 91.00 312 0 No event 95 -4.00 -4.21
-156 38 37.98 1.79 30 5.32 0.09 2.73 -1.05 1.4 75 89.57 313 0 No event 95 -5.43 -5.72
Table 5.3-1: Representative data set for animal LTP-3 showing formatted data for an Sodium Nitroprusside infusion test under control conditions.

57
LTP-6 Neo-Synephrine Test Data:% MAP & % Anesthetic vs. Time
Time (sec. post infusion start)
0 200 400 600 800
MAP
(mm
Hg)
40
60
80
100
120
140
% A
nest
hetic
(Hal
otha
ne)
0.0
0.5
1.0
1.5
2.0
2.5
3.0Pump Started Pump Stopped
MAP mmHg (Control)MAP mmHg (No Control)% Anesthetic (Control)
Figure 5.3-1: Animal LTP-6 Neo-Synephrine infusion test data showing MAP under control (closed circles) and no- control (open circles) conditions and % anesthetic (closed triangles) vs. time.
LTP-6 Neo-Synephrine Test Data:% MAP Deviation & % Anesthetic vs. Time
Time (sec. post infusion start)
0 200 400 600 800
Dev
iatio
n fro
m M
AP S
etpo
int (
%)
-40
-20
0
20
40
60
% A
nest
hetic
(Hal
otha
ne)
0.0
0.5
1.0
1.5
2.0
2.5
3.0Pump Started Pump Stopped
% MAP Deviation (Control)% MAP Deviation (No Control)% Anesthetic (Control)
Figure 5.3-2: Animal LTP-6 Neo-Synephrine infusion test data showing % MAP deviation under control (closed circles) and no- control (open circles) conditions and % anesthetic (closed triangles) vs. time.

58
Of the six animals tested only four animals yielded data for the sodium
nitroprusside infusion tests (LTP-2, LTP-3, LTP-5, LTP-6). A representative plot of %
MAP deviation and % anesthetic vs. time for the sodium nitroprusside infusion testing is
shown in figure 5.3-3 & 5.3-4.and the plots for all data yielding animals are included in
Appendix C.
As with the short-term perturbation a quantitative evaluation of the data from the
long-term perturbations was achieved by performing a paired t-test analysis on the
calculated RMS values from each test. The results of the RMS and t-test calculations for
Neo-Synephrine and sodium nitroprusside infusion tests are shown in table 5.3-2 and
table 5.3-3 respectively.
LTP-6 Sodium Nitroprusside Test 2 Data:% MAP & % Anesthetic vs. Time
Time (sec. post infusion start)
0 200 400 600
MAP
(mm
Hg)
0
20
40
60
80
100
120
140Pump Started Pump Stopped
% A
nest
hetic
(Hal
otha
ne)
0.0
0.5
1.0
1.5
2.0
2.5
3.0
MAP mmHg (Control)MAP mmHg (No Control)% Anesthetic (Control)
Figure 5.3-3: Animal LTP-6 sodium nitroprusside infusion test data showing
MAP under control (closed circles) and no- control (open circles) conditions and % anesthetic (closed triangles) vs. time.

59
LTP-6 Sodium Nitroprusside Test 2 Data:% MAP Deviation & % Anesthetic vs. Time
Time (sec. post infusion start)
0 200 400 600
Dev
iatio
n fro
m M
AP S
etpo
int (
%)
-60
-40
-20
0
20
40
60
Pump Started
% A
nest
hetic
(Hal
otha
ne)
0.0
0.5
1.0
1.5
2.0
2.5
3.0Pump Started Pump Stopped
% MAP Deviation (Control)% MAP Deviation (No Control)% Anesthetic (Control)
Figure 5.3-4: Animal LTP-6 sodium nitroprusside infusion test data
showing % MAP deviation under control (closed circles) and no- control (open circles) conditions and % anesthetic (closed triangles) vs. time.
Neo-Synephrine infusion Data Analysis Results
Animal # LTP2 LTP3 LTP4A LTP4B LTP6
RMS % MAP
Deviation No-Control 17.34 25.93 17.93 17.93 30.70
RMS % MAP
Deviation Control 12.12 30.95 27.38 15.06 22.38
d 5.21 -5.02 -9.45 2.87 8.31
D 0.39 s 7.39
t 0.117 P < 0.50
Table 5.3-2: Summary of calculated RMS values and Paired t-test results for the Neo-Synephrine infusion experiments.

60
Sodium Nitroprusside infusion Data Analysis Results
Animal # LTP2 LTP3 LTP5A LTP5B LTP6A LTP6B
RMS % MAP
Deviation No-Control 15.71 8.37 35.74 10.49 18.83 14.59
RMS % MAP
Deviation Control 11.04 6.60 18.42 9.47 14.04 8.02
d 4.68 1.77 17.32 1.02 4.78 6.57
D 6.02 S 5.90
t 2.499 p < 0.10
Table 5.3-3: Summary of calculated RMS values and Paired t-test results for sodium nitroprusside infusion experiments.
The overall stability and consistency of the system was analyzed by comparing
the MAP values for each animal at the same time relative to infusion start for each of the
long-term experiments. Mean and standard deviation values for each time point (relative
to infusion start) during both the control and no-control conditions were calculated for the
Neo-Synephrine and sodium nitroprusside infusion experiments. The resulting plots of
mean and standard deviation values against time (post infusion start) are shown in figures
5.3-4 and 5.3-5, respectively.
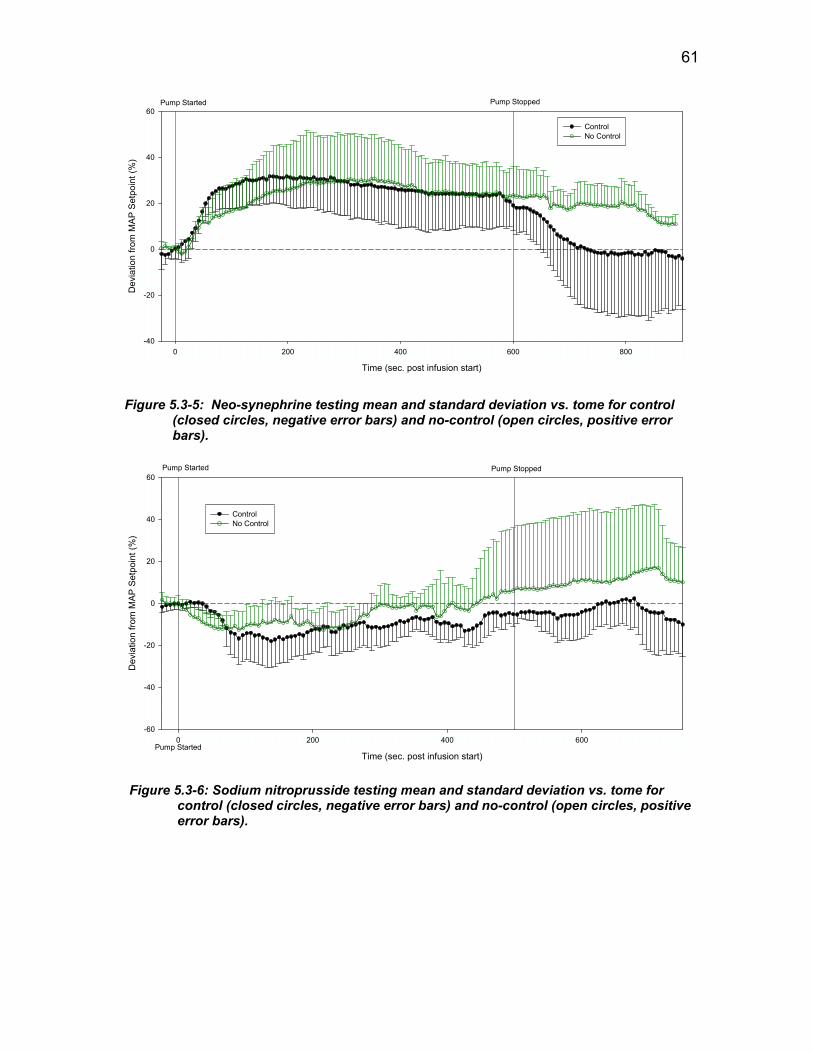
61
Time (sec. post infusion start)
0 200 400 600 800
Dev
iatio
n fro
m M
AP S
etpo
int (
%)
-40
-20
0
20
40
60Pump Started Pump Stopped
ControlNo Control
Figure 5.3-5: Neo-synephrine testing mean and standard deviation vs. tome for control (closed circles, negative error bars) and no-control (open circles, positive error bars).
Time (sec. post infusion start)
0 200 400 600
Dev
iatio
n fro
m M
AP S
etpo
int (
%)
-60
-40
-20
0
20
40
60
Pump Started
Pump Started Pump Stopped
ControlNo Control
Figure 5.3-6: Sodium nitroprusside testing mean and standard deviation vs. tome for control (closed circles, negative error bars) and no-control (open circles, positive error bars).

62
5.4. CO2 controller Results
Attempts were made to use the CO2 control system during the short-term
perturbation tests but were unsuccessful due to limitations of the Columbus Instruments
ventilator being used at the time. Prior to the start of the long-term perturbation testing, a
beta version of the Harvard Apparatus Inspira was used. The Inspira was able to handle
the demands of the control system and allowed for the use of the CO2 controller during
the long term testing. Though no specific perturbations were performed, it was possible
to collect data for each animal and observe the reactions of the control system to changes
in ETCO2. The key parameter for evaluation of the CO2 control system was identified as
the MAX % CO2 and the major control variables were identified as tidal volume and
respiratory rate. Due to calibration issues with the micro-capnometer, all % CO2 values
are one half that of the actual value. Representative plots of ETCO2, tidal volume and
respiration rate vs. time are shown in figures 5.4-1 and 5.4-2 and plots for all of the LTP
animals can be found in Appendix D.
Time (sec. post infusion start)
0 200 400 600
ETC
O2 (
%)
0
1
2
3
4
5
Tida
l Vol
ume
(cc)
0.0
0.5
1.0
1.5
Res
pira
tory
Rat
e (B
PM)
0
20
40
60
80
100
120Pump Started Pump Stopped
% ETCO2 DeviationTidal VolumeRespiration Rate
Figure 5.4-1: Representative plot of % CO2 (closed circle) tidal volume (closed triangle) and respiratory rate (Closed square) vs. time for animal LTP-3.

63
Time (sec. post infusion start)
0 200 400 600
Dev
iatio
n E
TCO
2 Set
poin
t (%
)
-20
-10
0
10
20Pump Started Pump Stopped
Cha
nge
from
TV
setp
oint
(%)
-10
-5
0
5
10
Cha
nge
from
RR
set
poin
t (%
)
-10
-5
0
5
10
% ETCO2 Deviation% Change in TV% Change in RR
Figure 5.4-2: Representative plot of % CO2 deviation (closed circle) change in TV set point (closed triangle) and change in RR set point (Closed square) vs. time for animal LTP-3.
5.5. Steady state observations
During the long-term perturbation testing, animal LTP-5 was allowed to stabilize
and then placed on pressure and CO2 control with no perturbations for a period of ~45
min. This was done to assess the normal variation of an animal’s physiology when no
active procedures are taking place and the system’s ability to maintain the set points in
this situation. Though no quantitative data can be obtained since the n is equal to 1,
qualitative information can be gleaned by examining the resulting plots (figures 5.5-1 -
5.5-4).

64
Time (sec.)
0 200 400 600 800 1000
MAP
(mm
Hg)
0
20
40
60
80
100
120
140
% A
nest
hetic
(Hal
otha
ne)
0.0
0.5
1.0
1.5
2.0
2.5
3.0
MAP (mmHg)% Anesthetic
Figure 5.5-1: Animal LTP-5 steady state test data showing MAP under control (closed circles) and % anesthetic (closed triangles) vs. time.
Time (sec.)
0 200 400 600 800 1000
Dev
iatio
n fro
m M
AP S
etpo
int (
%)
-60
-40
-20
0
20
40
60
% A
nest
hetic
(Hal
otha
ne)
0.0
0.5
1.0
1.5
2.0
2.5
3.0
% MAP Deviation% Anesthetic
Figure 5.5-2: Animal LTP-5 steady state test data showing %
MAP deviation under control (closed circles) and % anesthetic (closed triangles) vs. time.
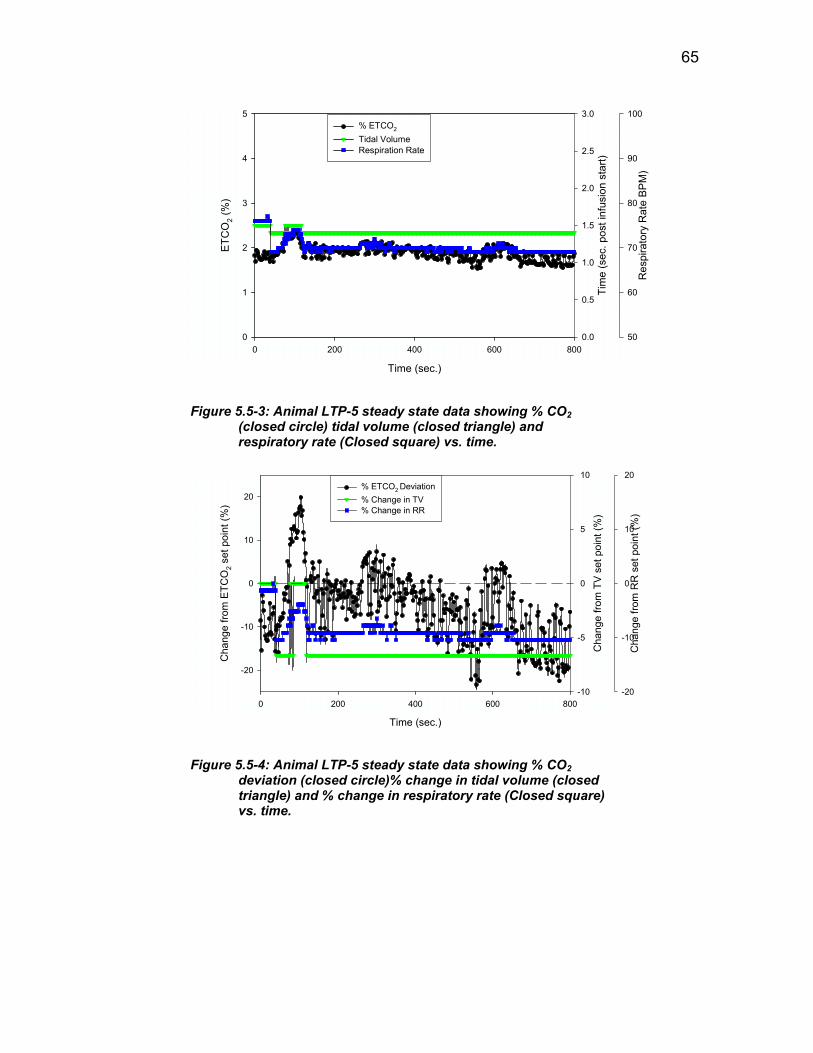
65
Time (sec.)
0 200 400 600 800
ETC
O2 (
%)
0
1
2
3
4
5
Tim
e (s
ec. p
ost i
nfus
ion
star
t)
0.0
0.5
1.0
1.5
2.0
2.5
3.0
Res
pira
tory
Rat
e BP
M)
50
60
70
80
90
100% ETCO2
Tidal Volume Respiration Rate
Figure 5.5-3: Animal LTP-5 steady state data showing % CO2 (closed circle) tidal volume (closed triangle) and respiratory rate (Closed square) vs. time.
Time (sec.)
0 200 400 600 800
Cha
nge
from
ETC
O2 s
et p
oint
(%)
-20
-10
0
10
20
Cha
nge
from
TV
set p
oint
(%)
-10
-5
0
5
10
Cha
nge
from
RR
set
poi
nt (%
)
-20
-10
0
10
20% ETCO2 Deviation% Change in TV% Change in RR
Figure 5.5-4: Animal LTP-5 steady state data showing % CO2 deviation (closed circle)% change in tidal volume (closed triangle) and % change in respiratory rate (Closed square) vs. time.
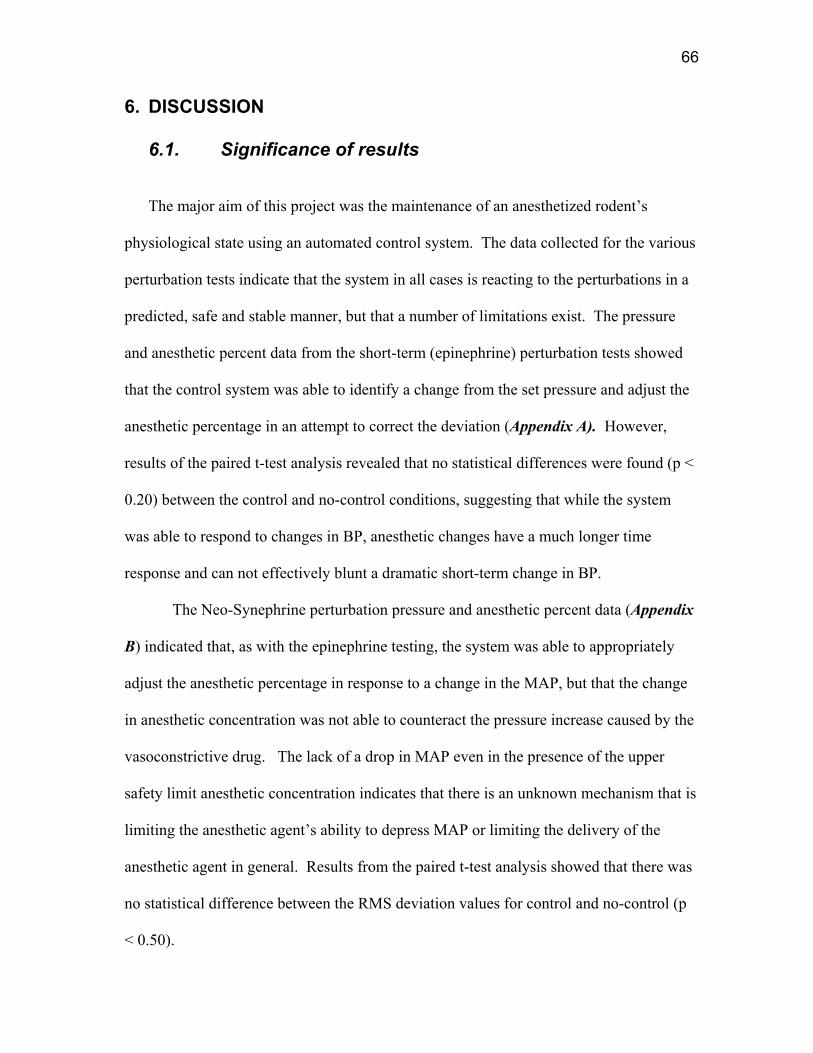
66
6. DISCUSSION
6.1. Significance of results
The major aim of this project was the maintenance of an anesthetized rodent’s
physiological state using an automated control system. The data collected for the various
perturbation tests indicate that the system in all cases is reacting to the perturbations in a
predicted, safe and stable manner, but that a number of limitations exist. The pressure
and anesthetic percent data from the short-term (epinephrine) perturbation tests showed
that the control system was able to identify a change from the set pressure and adjust the
anesthetic percentage in an attempt to correct the deviation (Appendix A). However,
results of the paired t-test analysis revealed that no statistical differences were found (p <
0.20) between the control and no-control conditions, suggesting that while the system
was able to respond to changes in BP, anesthetic changes have a much longer time
response and can not effectively blunt a dramatic short-term change in BP.
The Neo-Synephrine perturbation pressure and anesthetic percent data (Appendix
B) indicated that, as with the epinephrine testing, the system was able to appropriately
adjust the anesthetic percentage in response to a change in the MAP, but that the change
in anesthetic concentration was not able to counteract the pressure increase caused by the
vasoconstrictive drug. The lack of a drop in MAP even in the presence of the upper
safety limit anesthetic concentration indicates that there is an unknown mechanism that is
limiting the anesthetic agent’s ability to depress MAP or limiting the delivery of the
anesthetic agent in general. Results from the paired t-test analysis showed that there was
no statistical difference between the RMS deviation values for control and no-control (p
< 0.50).

67
The sodium nitroprusside perturbation pressure and anesthetic percent data
collected from the four animals showed that the system was able to adjust the anesthetic
concentration and reduce the % MAP deviation in the control situation compared to the
no-control (Appendix C). Paired t-test analysis was performed on the calculated RMS
values for % MAP deviation, giving a t value of 2.499, proving that the control condition
was a significant improvement (p < 0.10) over the no-control condition to a confidence
level between 90% and 95 % (to = 2.015 and to = 2.579, respectively).
The %CO2, TV and RR data obtained throughout the long-term perturbation tests
(Appendix D) shows that the system was able to maintain the ETCO2 under near steady
state conditions (the perturbations used had little effect on ETCO2). Though this is not a
perturbation experiment it is an important indicator of the systems stability and efficacy
under normal conditions.
6.2. Future Work
The presence of a significant improvement in the hypotension perturbation testing
with no prior optimization of the control system indicates that further work should be
completed that analyzes and optimizes the activity of the pressure controller. A number
of variables exist in the system that could directly affect the ability of the system to
effectively and safely maintain the desired set point. Additional hypotension testing
should be completed in conjunction with this optimization to increase the number of data
points available for statistical analysis.
As stated previously, the inability of the system to reduce MAP during the Neo-
Synephrine (hypertension) experiments even in the presence of increased anesthetic

68
concentration suggests that an unknown mechanism exists which limits the anesthetic’s
ability to reduce the elevated MAP. Additional hypertension testing should be completed
using a different drug or a method that minimizes the fluctuation of systemic parameters
other the blood pressure to fully evaluate the situation and identify the limitation.
Additional short and long term perturbation experiments should be completed
using alternative inhalant anesthetics. The use of an alternative anesthetic may provide a
more rapid response or a different MAP depressing mechanism that could allow for
increased effectiveness for short-term fluctuations and situation modeled in the Neo-
Synephrine infusion test. The interface developed for this project already contains
functionality that allows for the selection of alternative anesthetics.
Because all of the perturbations performed during this project considered only the
control or no-control conditions, additional testing should be completed which considers
a positive control. In order to achieve this, an anesthetist should attempt to control the set
points of the animal during perturbations and these results should be compared to the
results obtained during automated control. This testing can identify any limitations in
halothane’s ability to control BP and allow for the validation of the system’s decision
making.
Though all of the testing that was completed in this project was done on rats, mice
are another important animal model in the lab. In order to complete this testing for the
pressure control system a reliable means for acquiring the BP of a mouse must be
developed. Arterial cannulation in the mouse is extraordinarily difficult and not
employed in this project.

69
Perturbation testing of the ETCO2 control system should be completed to assess
that system’s ability to maintain the set point %CO2 in non-steady state conditions.
Possible perturbations include the addition of CO2 gas to the inhaled gas mixture or
injection of bicarbonate.
6.3. Conclusions
The four specific goals for this project were to 1) Develop a computer-controlled
monitoring system (based on LabVIEWR) capable of “real time” data acquisition and
display of body temperature, end tidal CO2 (ETCO2), ventilator pressure and blood
pressure, 2) Develop a communications capability allowing for the control of laboratory
instrumentation, such as the ventilator, heating bath and gas flow meters, 3) Develop a
computer-based control system (using LabVIEWR) for maintaining body temperature,
ETCO2, and blood pressure., 4) Design a user interface that incorporates the above
subsystems and an event marker and file transfer system.
The project was successful in producing a single user interface capable of “real-time”
acquisition, display, transfer and evaluation of physiological data from an anesthetized
animal and, based on this evaluation, manipulation of the available control variables in an
attempt to maintain a predetermined set point. The in-vivo testing completed in this
project proved that the system was able to significantly improve the deviation from the
set pressure while under control in the hypotension condition.
Though both the short-term and hypertension testing showed no significant
improvement, the system successfully manipulated the anesthetic percentage in a safe and

70
stable manner in response to changes in MAP. The results for the hypertension testing
suggest that unknown mechanisms exist that limit the anesthetic agent’s ability to depress
MAP or limit the delivery of the anesthetic agent in general.
Though no quantitative analysis was done, the qualitative data for the CO2 control
system obtained during the long-term perturbation testing showed that the system can
safely and effectively adjust the TV and RR values to maintain a ETCO2 level close to
the set point.
Though currently limited, this system is an important first step towards a fully
automated monitoring and control system and can be used as the basis for further
research investigating alternate anesthetic agents and optimization of the control
algorithms.

71
7. REFERENCES
Afshart, A. and C. Georgescu (1994). “A Fuzzy Model-Based Optimal Control Strategy.” EMTL-Schlumberger Industries, France: 120-125
Allen, Robert, David Smith (2001). “Neuro-fuzzy closed-loop control of depth of
anesthesia.” Artificial Intelligence in Anesthesia 21: 185-191 American College of Veterinary Anesthesiology (1995). “Suggestions for monitoring
anesthetized veterinary patients.” JAVMA 206 (7) Becker, Kurt, Bernhard Thull, Horst Kasmacher-Leidinger, Johannes Stemmer, Gunther
Rau, Gunther Kalff, Hans-Jergen Zimmerman (1997). “Design and validation of an intelligent patient monitoring and alarm system based on a fuzzy logic process model.” Artificial Intelligence in Medicine 11: 33-53
Boutilette, Michael Paul, Kevin James McNamara, Colleen Marie O’Rourke (2000).
“Development of a Computer Controlled Anesthesia Machine for Mice” Major Qualifying Project, Worcester Polytechnic Institute Biomedical Engineering Department.
Brule, James A. (1985). “Fuzzy Systems: A Tutorial.”
http://www.austinlinks/Fuzz/tutorial /.html 1985 Chu, Kuch-Shiu, and Andrew Hunter (1999) “GA Design of Crisp-Fuzzy logic
Controllers.” School of Computing and Information Systems, University of Sunderland
Dojat, M., F. Pachet, Z. Guessoum, D. Touchard, A. Harf, L. Brochard (1997).
“NeoGanesh: a working system for the automated control of assisted ventilation in ICUs.” Artificial Intelligence in Medicine 11: 97117
Dorsch, Jerry A., Susan E. Dorsch, 1984. Understanding Anesthesia Equipment
Construction Care and Complications. Baltimore, MD. Williams & Wilkins Dulkara, T., K. Irikura, Z. Huang, N. Panahian, and M. A. Moskowitz (1995).
“Cardiovascular Responses Under Controlled and Monitored Physiological Conditions in the Anesthetized Mouse.” Journal of Cerebral Blood Flow and Metabolism 15 (4): 631638
Frei, C. W., M. Derighetti and A. M. Zbinden (1997). “Modelling for control of mean
arterial blood pressure (MAP) during Anesthesia.” Presented at 2nd MATHMOD, Vienna
Gaines, B. R. “Fuzzy Reasoning and the Logic of Uncertainty.”

72
Graal, P.M.A. de, G.C. van den Eljkel, H.J.L.M. Vullings, B.A.J.M.de Mol (1997). “A decision-driven design of a decision support system in anesthesia.” Artificial Intelligence in Medicine 11: 141-153
Guettler, Norbert, Dejan Vukajlovic, Alexander Berkowtson, Britta Schulte, Ali Erdogen,
Joerg Carisson, Joerg Neuzner, Hanz Pitschner (2001). “Affect of Vagus Blockage with Atropine on Heart-Rate Turbulence.” PACE 24(4): 539-786
Horstkotte, Erik (2000). “Fuzzy expert systems.” http://www.austinlinks/fuzzy-expert
systems/.html 2000 Horstkotte, Erik (2000). “Fuzzy Logic Overview.”
http://www.austinlinks/fuzzy/overview/.html 2000 Jain, L.C. (2000). “Industrial Applications of Fuzzy Systems.” Knowledge-Based
Intelligent Engineering Systems (KES) Center, University of South Australia Johnson, G. Allan, Ph.D., Daniel H. Turnbull, Ph.D.m Elaine G. Fitzsimons, M.S. (1999).
“In-Vivo Microscopy: Technologies and Applications.” Duke Center for In Vivo Microscopy, NIH/NICRR
Jones, Richard W., Michael J. Harrison, Andrew Lowe (2001). “Computerized
anesthesia monitoring using fuzzy trend templates.” Artificial Intelligence in Medicine 21: 247-251
Ko, J.C.H (2002). “Pharmacology: Inhalation Anesthetics.” Veterinary Medicine,
Oklahoma State University February 8, 2002 Kubota, Toru, Christine M. Mahler, Charles F. McTiernan, Clarence C. Wu, Marc D.
Feldman and Arthur M. Feldman (1998). “End-systolic pressure:-dimension relationship of in situ mouse left ventricle.” J Mol Cell Cardiol 30: 357-363
Langari, Reza (1996). “Hierarchal Approach to Fuzzy Logic Control.” Department
Mechanical Engineering, Texas A & M University. Linkens, D.A. (1992). “Adaptive and Intelligent Control in Anesthesia.” IEE Control
Systems December 1992: 6-11 Linkens, D. A., 1994. Intelligent Controls in Biomedicine. Bristol, PA. Taylor and
Francis Ltd. Linkens, D.A., M.F. Abbod (1998). “Intelligent Control of Anesthesia.” IEE: 271-274 Linkens, D.A., L. Vefgin (1997), “Recognition of patient anesthetic levels: neural
network systems, principal components analysis and canonical discriminant variates.” Artificial Intelligence in Medicine 11: 155-173

73
Lowe, Andrew, Michael J. Harrison, Richard W. Jones (1999). “Diagnostic monitoring
in anesthesia using fuzzy trend templates for matching temporal patterns.” Artificial Intelligence in Medicine 16: 183-199
McAllister, M. Luisa, John Dockery, Sergei Ovchinmikov, Klaus-Peter Adisassinig
(1985). “Tutorial on Fuzzy Logic in Simulation.” Proceedings of the 1985 winter simulation conference: 40-44
Meler R., J. Nieuwland, A.M. Zbinden and S.S. hacisolihzade (1992). Fuzzy Logic
Control of Blood Pressure during Anesthesia.” IEEE Control Systems: 12-17 Morari, Memfred (2001). “Challenges and Opportunities in Process Control.” AIChe
Journal 27 (10): 21952392 Mortier, Eric P., Michel M. R. F. Struys (2001), “Monitoring the depth of anesthesia
using bispectral analysis and closed-loop controlled administration of propofol.” Best Practice & Research Clinical Anesthesiology 15 (1): 6376
Olansen, Jon B. and Eric Rosow, 2002. Virtual Bio-Instrumentation: Biomedical,
Clinical and Healthcare Applications in LabVIEW. Upper Saddle River, NJ. Prentice Hall PRT
Qingyang Hu, Rose, David W. Petr (2000). “A Predictive Self-Tuning Fizzy-Logic
Feedback Rate Controller.” IEEE Transactions on Networking 8 (6): 697-709 Rao, Ramesh R., B. Wayne Bequette and Rob J. Roy (2000). “Control of hemodynamic
and anesthetic states in critical care patients.” Chemical and Biomedical Engineering Departments, Renselaer Polytechnic Institute
Roberts, Dr. John (1994). “Control of Carbon Dioxide Levels during Neuro-anesthesia:
Current Practice and an Appraisal of our Reliance on Capnography.” Anesthesia & Intensive Care
Seiber, T. J., C. W. Frei, M. Derighetti, P. Peigenwinter, D. Leibundgut, and A. M.
Zbinden (2000). “Model-based automatic feedback control versus human control of end-tidal isoflurane concentration using low-flow anesthesia .” British Journal of Anesthesia 85 (6): 818825
Shieh, Jian Shing, Derek Arthur Linkens, and John E. Peacock (1999). “Hierarchal
Rule-Based and Self-Organizing Fuzzy Logic Control for Depth of Anesthesia.” IEEE Transactions on Systems MAN and Cybernetics – Part C 29 (1): 98—109
Short, Charles E., 1987. Principles & Practice of Veterinary Anesthesia. Baltimore, MD:
Williams and Wilkins

74
Szolovits, Peter, 1982. Artificial Intelligence in Medicine. Washington, D.C., American Association for the Advancement of Science
Valke, Christian and Howard Jay Chizech (1997). “Closed-Loop Drug Infusion for
Control of Heart Rate Trajectory in Pharmacological Stress Tests.” IEEE Transactions on Biomedical Engineering 44 (3): 185-195
Whitely, J. P., D. J. Gavaghan and C. E. W. Hahn (2001). “Modeling inert gas exchange
in tissue and mixed-venous blood return to the lungs.” Journal of Theoretical Biology 209: 431-443
Zadeh, Lotfi A., Janusz Kacprzyk, 1992, FUZZY LOGIC FOR THE MANAGEMENT
OF UNCERTAINTY. New York, NY: John Wiley & sons Inc.

75
Appendix A: Epinephrine Injection Data Plots
The following plots are summary plots of the calculated % NAP deviation for both
the control and no-control condition and % anesthetic in the control condition vs. relative
time post injection.
Animal R-1 Epinephrine Test Data:% MAP & % Anesthetic vs. Time
Time (sec. post injection)
0 50 100 150 200
MAP
(mm
Hg)
0
20
40
60
80
100
120
140
% A
nest
hetic
(Hal
otha
ne)
0.0
0.5
1.0
1.5
2.0
2.5
3.0Bolus
MAP mmHg (Control)MAP mmHg (No Control)% Anesthetic (Control)
Animal R-1 Epinephrine Test Data:% MAP Deviation & % Anesthetic vs. Time
Time (sec. post injection)
0 50 100 150 200
Dev
iatio
n fro
m M
AP S
etpo
int (
%)
-60
-40
-20
0
20
40
60%
Ane
sthe
tic (H
alot
hane
)
0.0
0.5
1.0
1.5
2.0
2.5
3.0Bolus
% MAP Deviation (Control)% MAP Deviation (No Control)% Anesthetic (Control)
Control Condition
RMS Value
(%)
Pressure Set-
point (mmHg)
Anesthetic Set-
point (%)
Control 9.24 110 2.0
No-Control 12.53 105 NA

76
Animal R-2 Epinephrine Test Data:% MAP & % Anesthetic vs. Time
Time (sec. post injection)0 50 100 150 200 250
MAP
(mm
Hg)
0
20
40
60
80
100
120
140Bolus
% A
nest
hetic
(Hal
otha
ne)
0.0
0.5
1.0
1.5
2.0
2.5
3.0
MAP mmHg (Control)MAP mmHg (No Control)% Anesthetic (Control)
Animal R-2 Epinephrine Test Data:% MAP Deviation & % Anesthetic vs. Time
Time (sec. post injection)0 50 100 150 200 250
Dev
iatio
n fro
m M
AP S
etpo
int (
%)
-60
-40
-20
0
20
40
60
% A
nest
hetic
(Hal
otha
ne)
0.0
0.5
1.0
1.5
2.0
2.5
3.0Bolus
% MAP Deviation (Control)% MAP Deviation (No Control)% Anesthetic (Control)
Control Condition
RMS Value
(%)
Pressure Set-
point (mmHg)
Anesthetic Set-
point (%)
Control 10.8 112 1.9
No-Control 11.96 105 NA

77
Animal R-3 Epinephrine Injection Test Data:% MAP & % Anesthetic vs. Time
Time (sec. post injection)
0 50 100 150 200 250 300
MAP
(mm
Hg)
0
20
40
60
80
100
120
140Bolus
% A
nest
hetic
(Hal
otha
ne)
0.0
0.5
1.0
1.5
2.0
2.5
3.0
MAP mmHg (Control)MAP mmHg (No Control)% Anesthetic (Control)
Animal R-3 Epinephrine Injection Test Data:% MAP Deviation & % Anesthetic vs. Time
Time (sec. post injection)
0 50 100 150 200 250 300
Dev
iatio
n fro
m M
AP S
etpo
int (
%)
-60
-40
-20
0
20
40
60
% A
nest
hetic
(Hal
otha
ne)
0.0
0.5
1.0
1.5
2.0
2.5
3.0Bolus
% MAP Deviation (Control)% MAP Deviation (No Control)% Anesthetic (Control)
Control Condition
RMS Value
(%)
Pressure Set-
point (mmHg)
Anesthetic Set-
point (%)
Control 8.57 100 1.5
No-Control 9.43 100 NA

78
Appendix B: Neo-Synephrine Infusion Data plots
The following are plots of MAP and % MAP deviation for both the control and no-
control conditions as well as % anesthetic for the control condition vs. relative time post
infusion start for all of the animals which yielded data for the neo-synephrine infusion
tests.
Animal LTP-2 Neo-Synephrine Test Data:MAP & % Anesthetic vs. Time
Time (sec. post infusion start)0 200 400 600 800
MAP
(mm
Hg)
0
20
40
60
80
100
120
140
160Pum p Started Pump Stopped
% A
nest
hetic
(Hal
otha
ne)
0.0
0.5
1.0
1.5
2.0
2.5
3.0
MAP mm Hg (Control)MAP mm Hg (No Control)% Anesthetic (Control)
Animal LTP-2 Neo-Synephrine Test Data:MAP Deviation & % Anesthetic vs. Time
Time (sec. post infusion start)0 200 400 600 800
Dev
iatio
n fro
m M
AP S
etpo
int (
%)
-60
-40
-20
0
20
40
60
% A
nest
hetic
(Hal
otha
ne)
0.0
0.5
1.0
1.5
2.0
2.5
3.0Pump Started Pump Stopped
% MAP Deviation (Control)% MAP Deviation(No Control)% Anesthetic (Control)
Control Condition
RMS Value
(%)
Pressure Set-
point (mmHg)
Anesthetic Set-
point (%)
Control 12.12 120 1.9
No-Control 17.34 105 NA

79
Animal LTP-3 Neo-Synephrine Test Data:MAP & % Anesthetic vs. Time
Time (sec. post infusion)
0 200 400 600 800
MAP
mm
Hg
(%)
0
20
40
60
80
100
120Pump Start Pump Stopped
% A
nest
hetic
(Hal
otha
ne)
0.0
0.5
1.0
1.5
2.0
2.5
3.0
MAP mmHg (Control)MAP mmHg (No Control)% Anesthetic (Control)
Time (sec. post infusion)
0 200 400 600 800
Dev
iatio
n fro
m M
AP S
etpo
int (
%)
-60
-40
-20
0
20
40
60
% A
nest
hetic
(Hal
otha
ne)
0.0
0.5
1.0
1.5
2.0
2.5
3.0Pump Started Pump Stopped
% MAP Deviation (Control)% MAP Deviation (No Control)% Anesthetic (Control)
Animal LTP-3 Neo-Synephrine Test Data:MAP Deviation & % Anesthetic vs. Time
Control Condition
RMS Value
(%)
Pressure Set-
point (mmHg)
Anesthetic Set-
point (%)
Control 30.95 80 1.8
No-Control 25.93 75 NA

80
Animal LTP-4 Neo-Synephrine Test Data:MAP & % Anesthetic vs. Time
Time (sec. post infusion start)
0 200 400 600
MAP
(mm
Hg)
0
20
40
60
80
100
120
140
% A
nest
hetic
(Hal
otha
ne)
0.0
0.5
1.0
1.5
2.0
2.5
3.0Pump Started Pump Stopped
MAP mmHg (Control)MAP mmHg(No Control)% Anesthetic (Control)
Animal LTP-4 Neo-Synephrine Test Data:MAP Deviation & % Anesthetic vs. Time
Time (sec. post infusion start)
0 200 400 600
Dev
iatio
n fro
m M
AP S
etpo
int (
%)
-60
-40
-20
0
20
40
60
% A
nest
hetic
(Hal
otha
ne)
0.0
0.5
1.0
1.5
2.0
2.5
3.0Pump Started Pump Stopped
% MAP Deviation (Control)% MAP Deviation (No Control)Neo % MAP Dev. Upper specification
Control Condition
RMS Value
(%)
Pressure Set-
point (mmHg)
Anesthetic Set-
point (%)
Control 27.38 85 1.9
No-Control 17.93 125 NA

81
LTP-6 Neo-Synephrine Test Data:% MAP & % Anesthetic vs. Time
Time (sec. post infusion start)
0 200 400 600 800
MAP
(mm
Hg)
40
60
80
100
120
140
% A
nest
hetic
(Hal
otha
ne)
0.0
0.5
1.0
1.5
2.0
2.5
3.0Pump Started Pump Stopped
MAP mmHg (Control)MAP mmHg (No Control)% Anesthetic (Control)
LTP-6 Neo-Synephrine Test Data:% MAP Deviation & % Anesthetic vs. Time
Time (sec. post infusion start)
0 200 400 600 800
Dev
iatio
n fro
m M
AP S
etpo
int (
%)
-40
-20
0
20
40
60
% A
nest
hetic
(Hal
otha
ne)
0.0
0.5
1.0
1.5
2.0
2.5
3.0Pump Started Pump Stopped
% MAP Deviation (Control)% MAP Deviation (No Control)% Anesthetic (Control)
Control Condition
RMS Value
(%)
Pressure Set-
point (mmHg)
Anesthetic Set-
point (%)
Control 22.38 105 2.1
No-Control 30.70 85 NA

82
Appendix C: Sodium Nitroprusside Infusion Data Plots
The following are plots of MAP and % MAP deviation for both the control and no-
control conditions as well as % anesthetic for the control condition vs. relative time post
infusion start for all of the animals which yielded data for the sodium nitroprusside
infusion tests.
Animal LTP-2 Sodium Nitroprusside Test Data:MAP & % Anesthetic vs. Time
Time (sec. post infusion start)0 200 400 600
MAP
(mm
Hg)
0
20
40
60
80
100
120
140
160Pump Started Pump Stopped
% A
nest
hetic
(Hal
otha
ne)
0.0
0.5
1.0
1.5
2.0
2.5
3.0
MAP mmHg (Control)MAP mmHg (No Control)% Anesthetic (Control)
Animal LTP-2 Sodium Nitroprusside Test Data:MAP Deviation & % Anesthetic vs. Time
Time (sec. post infusion start)0 200 400 600
Dev
iatio
n fro
m M
AP S
etpo
int (
%)
-60
-40
-20
0
20
40
60
% A
nest
hetic
(Hal
otha
ne)
0.0
0.5
1.0
1.5
2.0
2.5
3.0Pump Started Pump Stopped
% MAP Deviation (Control)% MAP Deviation (No Control)Col 1 vs Col 2
Control Condition
RMS Value
(%)
Pressure Set-
point (mmHg)
Anesthetic Set-
point (%)
Control 11.04 105 1.9
No-Control 15.71 100 NA

83
Animal LTP-3 Sodium Nitroprusside Test Data:MAP & % Anesthetic vs. Time
Time (sec. post infusion start)
0 200 400 600 800 1000
MAP
(mm
Hg)
0
20
40
60
80
100
120Pump Started Pump Stopped
% A
nest
hetic
(Hal
otha
ne)
0.0
0.5
1.0
1.5
2.0
2.5
3.0
MAP mmHg (Control) MAP mmHg (No Control)% Anesthetic (Control)
Animal LTP-3 Sodium Nitroprusside Test Data:MAP Deviation & % Anesthetic vs. Time
Time (sec. post infusion start)
0 200 400 600 800 1000
Dev
iatio
n fro
m M
AP S
etpo
int (
%)
-60
-40
-20
0
20
40
60
% A
nest
hetic
(Hal
otha
ne)
0.0
0.5
1.0
1.5
2.0
2.5
3.0Pump Started Pump Stopped
% MAP Deviation (Control) % MAP Deviation (No Control)% Anesthetic (Control)
Control Condition
RMS Value
(%)
Pressure Set-
point (mmHg)
Anesthetic Set-
point (%)
Control 6.60 95 1.8
No-Control 8.37 105 NA

84
LTP-5 Sodium Nitroprusside Test 1 Data:% MAP & % Anesthetic vs. Time
Time (sec. post infusion start)0 200 400 600
MAP
(mm
Hg)
0
20
40
60
80
100
120
140
160Pump Started Pump Stopped
% A
nest
hetic
(Hal
otha
ne)
0.0
0.5
1.0
1.5
2.0
2.5
3.0
MAP mmHg (Control)MAP mmHg (No Control)% Anesthetic (Control)
LTP-5 Sodium Nitroprusside Test 1 Data:% MAP Deviation & % Anesthetic vs. Time
Time (sec. post infusion start)0 200 400 600
Dev
iatio
n fro
m M
AP S
etpo
int (
%)
-60
-40
-20
0
20
40
60
80
% A
nest
hetic
(Hal
otha
ne)
0.0
0.5
1.0
1.5
2.0
2.5
3.0Pump Started Pump Stopped
% MAP Deviation (Control)% MAP Deviation (No Control)% Anesthetic (Control)
Control Condition
RMS Value
(%)
Pressure Set-
point (mmHg)
Anesthetic Set-
point (%)
Control 18.42 120 1.8
No-Control 35.74 80 NA

85
LTP-5 Sodium Nitroprusside Test 2 Data:% MAP & % Anesthetic vs. Time
Time (sec. post infusion start)0 200 400 600 800
MAP
(mm
Hg)
0
20
40
60
80
100
120
140Pump Started Pump Stopped
% A
nest
hetic
(Hal
otha
ne)
0.0
0.5
1.0
1.5
2.0
2.5
3.0
MAP mmHg (Control)MAP mmHg (No Control)% Anesthetic (Control)
LTP-5 Sodium Nitroprusside Test 2 Data:% MAP Deviation & % Anesthetic vs. Time
Time (sec. post infusion start)0 200 400 600 800
Dev
iatio
n fro
m M
AP S
etpo
int (
%)
-60
-40
-20
0
20
40
60
% A
nest
hetic
(Hal
otha
ne)
0.0
0.5
1.0
1.5
2.0
2.5
3.0Pump Started Pump Stopped
% MAP Deviation (Control)% MAP Deviation (No Control)% Anesthetic (Control)
Control Condition
RMS Value
(%)
Pressure Set-
point (mmHg)
Anesthetic Set-
point (%)
Control 18.42 120 1.8
No-Control 35.74 80 NA

86
LTP-6 Sodium Nitroprusside Test 1 Data:% MAP & % Anesthetic vs. Time
Time (sec. post infusion start)
0 200 400 600
MAP
(mm
Hg)
0
20
40
60
80
100
120
140Pump Started Pump Stopped
% A
nest
hetic
(Hal
otha
ne)
0.0
0.5
1.0
1.5
2.0
2.5
3.0
MAP mmHg (Control)MAP mmHg (No Control)% Anesthetic (Control)
LTP-6 Sodium Nitroprusside Test 1 Data:% MAP Deviation & % Anesthetic vs. Time
Time (sec. post infusion start)
0 200 400 600
Dev
iatio
n fro
m M
AP S
etpo
int (
%)
-60
-40
-20
0
20
40
60
% A
nest
hetic
(Hal
otha
ne)
0.0
0.5
1.0
1.5
2.0
2.5
3.0Pump Started Pump Stopped
% MAP Deviation (Control)% MAP Deviation (No Control)% Anesthetic (Control)
Control Condition
RMS Value
(%)
Pressure Set-
point (mmHg)
Anesthetic Set-
point (%)
Control 14.04 125 2.1
No-Control 18.83 100 NA

87
LTP-6 Sodium Nitroprusside Test 2 Data:% MAP & % Anesthetic vs. Time
Time (sec. post infusion start)
0 200 400 600
MAP
(mm
Hg)
0
20
40
60
80
100
120
140Pump Started Pump Stopped
% A
nest
hetic
(Hal
otha
ne)
0.0
0.5
1.0
1.5
2.0
2.5
3.0
MAP mmHg (Control)MAP mmHg (No Control)% Anesthetic (Control)
LTP-6 Sodium Nitroprusside Test 2 Data:% MAP Deviation & % Anesthetic vs. Time
Time (sec. post infusion start)
0 200 400 600
Dev
iatio
n fro
m M
AP S
etpo
int (
%)
-60
-40
-20
0
20
40
60
% A
nest
hetic
(Hal
otha
ne)
0.0
0.5
1.0
1.5
2.0
2.5
3.0Pump Started Pump Stopped
% MAP Deviation (Control)% MAP Deviation (No Control)% Anesthetic (Control)
Control Condition
RMS Value
(%)
Pressure Set-
point (mmHg)
Anesthetic Set-
point (%)
Control 8.02 105 2.1
No-Control 14.59 120 NA

88
Appendix D: ETCO2 Data Plots
The following are plots of % CO2, tidal volume and respiratory rate vs. time and
%change in ETCO2, %change in TV and % change in RR vs. time for the animals that
yielded data for the ETCO2 control system.
Animal LTP-2 Neo-Synephrine Test Data:% ETCO2 / Respiratory Rate/ Tidal Volume vs. Time
Time (sec. post infusion start)
0 200 400 600 800 1000
ETC
O2 (
%)
0
1
2
3
4
Tida
l Vol
ume
(cc)
0.0
0.5
1.0
1.5
Res
pira
tory
Rat
e (B
PM)
0
20
40
60
80
100
120
140Pump StoppedPump Started
ETCO2 (%)Tidal Volume (cc)Respiratory Rate (BPM)
Animal LTP-2 Neo-Synephrine Test Data:% ETCO2 Deviation/% Change in RR/ % Change in TV vs. Time
Time (sec. post infusion start)
0 200 400 600 800 1000
Dev
iatio
n fro
m E
TCO
2 Set
poin
t (%
)
-15
-10
-5
0
5
10
15
Cha
nge
from
TV
setp
oint
(%)
-5.0
-2.5
0.0
2.5
5.0Pump Started Pump Stopped
Cha
nge
from
RR
set
poin
t (%
)
-5.0
-2.5
0.0
2.5
5.0
% ETCO2 Deviation % Change in TV% Change in RR
Parameter Set-point Units
ETCO2 % 3.4 %
Tidal Volume 1.3 cc
Respiratory Rate 95 BPM

89
Animal LTP-3 Sodium Nitroprusside Test Data:% ETCO2 /Tidal Volume/Respiratory Rate vs. Time
Time (sec. post infusion start)
0 200 400 600
ETC
O2 (
%)
0
1
2
3
4
5
Tida
l Vol
ume
(cc)
0.0
0.5
1.0
1.5
Res
pira
tory
Rat
e (B
PM)
0
20
40
60
80
100
120Pump Started
Pump Stopped
% ETCO2
Tidal Volume Respiration Rate
Animal LTP-3 Sodium Nitroprusside Test Data:% ETCO2 Deviation/% Change in TV/% Change in RR vs. Time
Time (sec. post infusion start)
0 200 400 600
Dev
iatio
n E
TCO
2 Set
poin
t (%
)
-10
-5
0
5
10
Cha
nge
from
TV
setp
oint
(%)
-5.0
-2.5
0.0
2.5
5.0
Cha
nge
from
RR
set
poin
t (%
)
-10.0
-7.5
-5.0
-2.5
0.0
2.5
5.0
7.5
10.0Pump Started
Pump Stopped
% ETCO2 Deviation% Change in TV% Change in RR
Parameter Set-point Units
ETCO2 % 2.5 %
Tidal Volume 1.4 cc
Respiratory Rate 74 BPM

90
Animal LTP-3 Neo-Synephrine Test Data:% ETCO2 /Tidal Volume/Respiratory Rate vs. Time
Time (sec. post infusion start)
0 200 400 600
ETC
O2 (
%)
0
1
2
3
4
5
Tida
l Vol
ume
(cc)
0.0
0.5
1.0
1.5
Res
pira
tory
Rat
e BP
M)
0
20
40
60
80
100
120Pump Started Pump Stopped
% ETCO2 DeviationTidal VolumeRespiration Rate
Animal LTP-3 Neo-Synephrine Test Data:% ETCO2 Deviation/% Change in TV/% Change in RR vs. Time
Time (sec. post infusion start)
0 200 400 600
Dev
iatio
n E
TCO
2 Set
poin
t (%
)
-20
-10
0
10
20Pump Started Pump Stopped
Cha
nge
from
TV
setp
oint
(%)
-10
-5
0
5
10
Cha
nge
from
RR
set
poin
t (%
)
-10
-5
0
5
10
% ETCO2 Deviation% Change in TV% Change in RR
Parameter Set-point Units
ETCO2 % 2.2 %
Tidal Volume 1.4 cc
Respiratory Rate 77 BPM
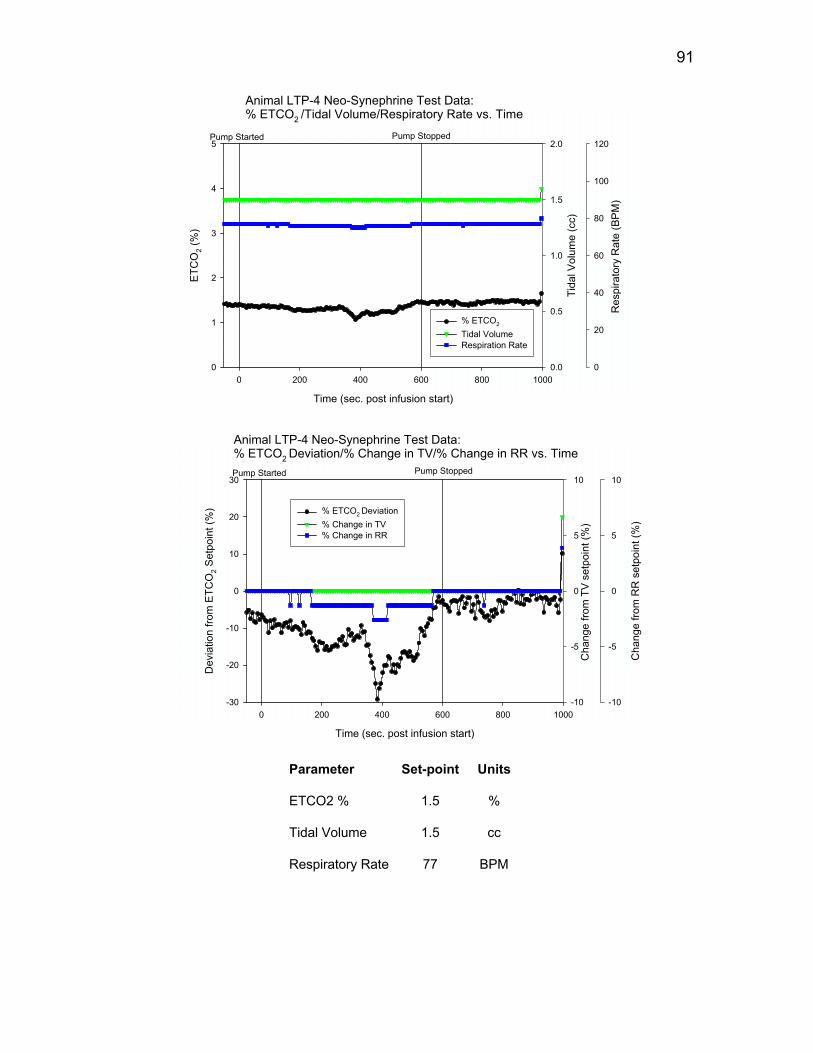
91
Animal LTP-4 Neo-Synephrine Test Data:% ETCO2 /Tidal Volume/Respiratory Rate vs. Time
Time (sec. post infusion start)
0 200 400 600 800 1000
ETC
O2 (
%)
0
1
2
3
4
5Pump Started Pump Stopped
Tida
l Vol
ume
(cc)
0.0
0.5
1.0
1.5
2.0
Res
pira
tory
Rat
e (B
PM)
0
20
40
60
80
100
120
% ETCO2
Tidal Volume Respiration Rate
Animal LTP-4 Neo-Synephrine Test Data:% ETCO2 Deviation/% Change in TV/% Change in RR vs. Time
Time (sec. post infusion start)
0 200 400 600 800 1000
Dev
iatio
n fro
m E
TCO
2 Set
poin
t (%
)
-30
-20
-10
0
10
20
30Pump Started Pump Stopped
Cha
nge
from
TV
setp
oint
(%)
-10
-5
0
5
10
Cha
nge
from
RR
set
poin
t (%
)
-10
-5
0
5
10
% ETCO2 Deviation% Change in TV% Change in RR
Parameter Set-point Units
ETCO2 % 1.5 %
Tidal Volume 1.5 cc
Respiratory Rate 77 BPM

92
Animal LTP-5 Sodium NitroprussideTest 1 Data:% ETCO2 /Tidal Volume/Respiratory Rate vs. Time
Time (sec. post infusion start)0 100 200 300 400 500 600
ETC
O2 (
%)
0
1
2
3
4
5Pump Started Pump Stopped
Tida
l Vol
ume
(cc)
0.0
0.5
1.0
1.5
Res
pira
tory
Rat
e (B
PM)
0
20
40
60
80
100
120
% ETCO2
Tidal Volume Respiration Rate
Animal LTP-5 Sodium NitroprussideTest 1 Data:% ETCO2 Deviation/% Change in TV/% Change in RR vs. Time
Time (sec. post infusion start)0 200 400 600
Dev
iatio
n fro
m E
TCO
2 Set
poin
t (%
)
-20
-10
0
10
20Pump Started Pump Stopped
Cha
nge
from
TV
setp
oint
(%)
-10
-5
0
5
10
Cha
nge
from
RR
set
poin
t (%
)
-10
-5
0
5
10
% ETCO2 Deviation% Change in TV% Change in RR
Parameter Set-point Units
ETCO2 % 2.3 %
Tidal Volume 1.4 cc
Respiratory Rate 74 BPM

93
Animal LTP-5 Sodium Nitroprusside Test 2 Data:% ETCO2 /Tidal Volume/Respiratory Rate vs. Time
Time (sec. post infusion start)0 200 400 600 800
ETC
O2 (
%)
0
1
2
3
4
5Pump Started Pump Stopped
Tida
l Vol
ume
(cc)
0.0
0.5
1.0
1.5
Res
pira
tory
Rat
e (B
PM)
0
20
40
60
80
100
120
% ETCO2
Tidal Volume Respiration Rate
Animal LTP-5 Sodium Nitroprusside Test 2 Data:% ETCO2 Deviation/% Change in TV/% Change in RR vs. Time
Time (sec. post infusion start)0 200 400 600 800
Dev
iatio
n fro
m E
TCO
2 Set
poin
t (%
)
-20
-10
0
10
20
Pump Started Pump Stopped
Cha
nge
from
TV
setp
oint
(%)
-10
-5
0
5
10
Cha
nge
from
RR
set
poin
t(%)
-10
-5
0
5
10
% ETCO2 Deviation% Change in TV% Change in RR
Parameter Set-point Units
ETCO2 % 2.5 %
Tidal Volume 1.4 cc
Respiratory Rate 75 BPM

94
Animal LTP-6 Steady Stae Test Data:% ETCO2 /Tidal Volume/Respiratory Rate vs. Time
Time (sec.)0 50 100 150 200 250
ETC
O2 (
%)
0
1
2
3
4
5
Tida
l Vol
ume
(cc)
0.0
0.5
1.0
1.5
2.0
Res
pira
tory
Rat
e (B
PM)
0
20
40
60
80
100
120
% ETCO2
Tidal Volume Respiration Rate
Animal LTP-6 Steady Stae Test Data:% ETCO2 Deviation/% Change in TV/% Change in RR vs. Time
Time (sec.)0 50 100 150 200 250
Dev
iatio
n fro
m E
TCO
2 Set
poin
t (%
)
-20
-10
0
10
20
Cha
nge
from
TV
setp
oint
(%)
-10
-5
0
5
10
Cha
nge
from
RR
set
poin
t (%
)
-10
-5
0
5
10
% ETCO2 Deviation% Change in TV% Change in RR
Parameter Set-point Units
ETCO2 % 2.7 %
Tidal Volume 1.4 cc
Respiratory Rate 78 BPM